Article

Research on the Distribution of Overlying Rock Fractures Caused by Mining in Ultra-Thick Coal Seams and Its Impact on the Near-Surface Aquifer

1
College of Energy Engineering, Xi’an University of Science and Technology, Xi’an 710054, China
2
CCTEG Xi’an Research Institute (Group) Co., Ltd., Xi’an 710077, China
*
Author to whom correspondence should be addressed.
Sustainability 2023, 15(18), 13974; https://doi.org/10.3390/su151813974
Submission received: 23 July 2023 / Revised: 10 September 2023 / Accepted: 14 September 2023 / Published: 20 September 2023
(This article belongs to the Special Issue Advances in Coal Mine Disasters Prevention)

Abstract

:
Near-surface water is the foundation for maintaining the ecological environment, and coal remains an important energy source in today’s world as we face a shortage of green energy. Achieving near-surface-water protection while safely mining coal is an important way to ensure social and ecological health and sustainability. The key lies in whether the fracture height of the mining overlying strata affects the aquifer. This article compiles the coupling finite element and discrete element method (CFE-DEM) and established mechanical constitutive models such as the interaction between rock blocks on both sides of the penetrated fracture, rock mass fracture process, and the plastic deformation law of rocks based on the results of mining-induced overlying rock failure. On this basis, a numerical calculation model is established based on the engineering geological conditions of the Beixinyao Coal Mine. The numerical simulation results indicate that the theory and the CFE-DEM method can numerically simulate the distribution and evolution of mining-induced overlying rock fractures. The water-conducting fractures in the overlying strata of extra-thick coal seams extend to the front of the working face in a trapezoidal shape, and the angle formed between them and the advancing direction ranges from 62° to 75°. Combined with the in situ measurement results, the height of the water-conducting fracture zone of the extra-thick coal seam is between 209 m and 230 m; the fractures were not found to have affected the aquifer at a vertical distance of 252 m from the coal seam. This means that the impact of ultra-thick coal seam mining on the aquifer is very limited. The research is of great significance for ensuring coal mining and surface ecological sustainability in ultra-thick coal seam areas.

1. Introduction

The surface aquifer is an important basis for maintaining the sustainable development of the ecological environment [1]. Many animals and plants rely on the surface or near-surface aquifer to survive. At present, clean and green energy cannot fully meet human needs; thus, coal remains one of the main sources of energy supply [2,3]. However, underground coal mining leads to fractures in the overlying rock, especially under the mining conditions of an ultra-thick coal seam, where the roof moves in a large range and the fractures opening are large [4,5,6]. Once fractures extend to the surface aquifer, it leads to a decrease in the water level of the aquifer and the death of the surface vegetation (Figure 1), seriously affecting ecological sustainability. This phenomenon is particularly worth studying in the ultra-thick coal seam areas of the arid western region of North China.
The core parameter to judge whether underground coal mining has an impact on the surface ecology is the height of the water-conducting fracture zone. For a long time, many scholars have believed that the envelope of the water-conducting fracture zone conforms to a saddle-shaped or trapezoidal distribution, and its height is often calculated according to the “empirical formula” [7,8]. The laws of overburdened rock movement are often explained quantitatively by the masonry beam theory or the transfer rock beam theory [9,10,11], which, to a certain extent, meet the needs of environmental protection and coal mine safety. However, the above empirical and theoretical formulas conceal a series of coupled continuous and progressive failure mechanics processes, such as the elastic–plastic deformation of the mining overlying rock, mixed tension–shear fracture, and separation/extrusion/shear friction after fracture. Under some mining conditions, the calculated overlying rock movement, fracture distribution range, and height deviate greatly from the actual ones and even lead to abnormal disasters [12,13,14].
Numerical simulation is an important method to study the fractures from mining overlying rocks. The key to the accuracy of the simulation results lies in the establishment of constitutive equations that reflect the evolution of the rock continuum–discrete. At present, scholars widely base their views on the “continuum assumption”, using finite element and finite difference methods, through the ideal elastoplastic model [15]; the strain softening plastic model [16]; the plastic model considering the influence of confining pressure on the subsequent yield function [17]; the elastic–plastic damage model [18] based on the shear strength criteria, such as Mohr–Coulomb and Mises shear strength [19,20]; strain energy [21]; and damage variables [22], as criteria, according to the plastic zone, the damage zone, and the energy zone, determined by the boundary of the water-conducting fracture zone. In addition, based on the assumption of discrete blocks, most scholars use the discrete element method to simplify the coal rock matrix into rectangular blocks or spheres and endow it with elastic or rigid mechanical properties, while the joints between matrices often adopt the Coulomb slip model [23,24], according to Newton’s second law, to calculate the distribution of the overlying rock fractures.
However, the rock mass is a complex continuous–discrete media combination containing intact rock and fractures [25]. During the mining process, an intact rock often transforms from a continuum or a quasi-continuum into a discrete block. A series of complex and coupled mechanical responses occurred during this process, including elastic–plastic deformation, mixed tension–shear fracture, and the separation/compression/shear friction of rock blocks on both sides of the structural plane. This progressive failure mechanical process of the rock mass deeply affects the distribution of water-conducting fractures. Based on the assumption of “continuum” or “discrete block” and mechanical theories such as “elasticity, damage, slip criterion under simple stress conditions, friction coefficient as constant parameter friction mechanics”, it is difficult to comprehensively obtain the numerical solutions for continuous–discrete medium transformations. We also cannot accurately assess the impact of underground coal mining on surface aquifers.
This article closely revolves around the mechanical characteristics of progressive failure of mining overlying rocks, treating the rock mass as a continuous-discrete combination. We established elastic–plastic constitutive equations for intact rock, mixed fracture constitutive equations for potential fracture surfaces under complex tensile and shear stresses, and compressive shear friction constitutive equations for rough structural surfaces. We also used finite–discrete element methods to calculate the mechanical response of rock masses before and after fracture. Furthermore, we established a numerical model of mining overburden containing natural structural planes in order to simulate and study the movement and fracture evolution of mining overburden based on experimental verification of the theoretical model. This research method and subsequent achievements are of great significance for water conservation coal mining, surface subsidence control in mining areas, and surface water protection.

2. Theory

The height of hydraulic fractures is a key parameter for determining the impact of underground coal mining on the near-surface aquifer. According to the in situ experimental results of geological drilling, under the mining influence of ultra-thick coal seam, the originally intact overlying rock always form three types of failure forms: penetrated fractured rock masses, non-penetrated fractured rock, and intact rock. The mechanical responses of the above three parts have significant differences and need to be studied separately.

2.1. Interaction between Rock Blocks on Both Sides of Penetrated Fracture

The huge secondary stress caused by mining of ultra-thick coal seam often leads to large-scale penetrated fractures in the overlying strata. The interaction and relative movement of rock blocks on both sides of a fracture will lead to further changes in overlying rock stress and fractures distribution.
Considering that there are many different contact relations between discrete blocks, constitutive equations are established for each case:
(a) Two adjacent rock blocks are separated from each other:
In this state, the distance between any two nodes between two blocks (i.e., solid elements in the numerical model) is greater than the size of the element. At this time, there is no contact force between the blocks. Calculate the translation and rotation of rock blocks according to Newton’s second law.
(b) Two adjacent rock blocks are squeezed against each other:
In this case, there is compression but no shear force between two blocks.
The compressive equation between the two blocks is:
s n = D n w n , max w n / ( w n , max w n )
where sn is the compressive stress; wn,max is the maximum closure amount of the crack, determined based on experiments; wn is the closure amount of the crack, variable; Dn is the elastic modulus of adjacent rock blocks.
(c) Two adjacent rock blocks are in a shear friction state:
Based on the research results of Sargin [26] and combined with the experimental data of fracture shear friction, establish the friction equation:
s shear = [ D s s + s s peak ( H 1 ) ( w s / w s peak ) 2 ] / [ 1 + ( D s w s peak / s s peak 2 ) ( w s / w s peak ) + D s ( w s / w s peak ) 2 ]
where Ds is the shear modulus of the fracture surface; s, s s peak is shear stress, peak shear stress; ws, w s peak represents shear displacement and peak shear displacement; H is the material parameter, and obtained by fitting the load–displacement curve from the shear friction experiment.
Based on Equations (1) and (2), the constitutive equations of discrete block interaction were established.

2.2. Rock Mass Fracture Process

Non-penetrated fractures are also a common mechanical response within the overlying strata during the mining process of ultra-thick coal seams. It refers to the transitional state of a rock from an intact stage to a completely fractured stage, and is an important basis for determining the occurrence and expansion of overlying rock fractures. The relationship between traction force and separation displacement during the elastic deformation stage of fracture is:
{ t n t s t t } = [ E nn 0 0 0 E ss 0 0 0 E tt ] { δ n δ s δ t }
where tn, ts, tt are the loads in the normal and two tangential directions of the potential fracture surface, and Enn, Ess, Ett are the stiffness, and δn, δs, δt are the separation displacement in the normal and two tangential directions of the potential fracture surface.
When the stress meets the following conditions, the potential fracture surface begins to fracture:
max { t n t n 0 , t s t s 0 , t t t t 0 } = 1
Among them, t n 0 , t s 0 , t t 0 are the peak loads, t n is the tensile load on the fracture surface.
As the amount of separation δn, δs, δt continues to increase, the indirect contact area of the rock blocks on both sides of the fracture surface gradually decreases, resulting in a decrease in the tensile and shear strength of the material. Therefore, damage is introduced to describe the above phenomenon. The damage evolution equation is:
D = δ m f ( δ m max δ m 0 ) δ m max ( δ m f δ m 0 )
Among them, D is the damage variable. δ m max is the total displacement in the crack tip at a certain moment, constant parameter; δ m 0 is the total displacement at the initial fracture time, constant parameter; δ m f is the total displacement at any time, variable.
The potential fracture surface bearing capacity after damage is:
t n = { ( 1 D ) t ¯ n , t ¯ n 0   tensile   stress t ¯ n   compressive   stress t s = ( 1 D ) t ¯ s , t t = ( 1 D ) t ¯ t
Once the following critical displacement is reached, the potential fracture surface completely fracture:
δ F = δ n 2 + δ s 2 + δ t 2
where δ F is the critical displacement of fracture under tensile and shear loads, constant parameter.

2.3. Plastic Deformation Law of Rocks

Elastoplastic deformation often occurs within intact rock blocks enclosed by through or non-penetrated fractures, resulting in huge secondary stresses caused by the mining of extremely thick coal seams.
The stress–strain of rock during elastic deformation conforms to the generalized Hooke’s law,
σ i j = λ ε k k δ i j + 2 G ε i j
where σ i j is the stress component, ε i j is the strain component ( i , j = 1 , 2 , 3 ), λ is the Lame constant, and G is the Shear modulus.
The intact rock yields when its stress conditions reach the Mohr–Coulomb criterion, and on this basis, it is assumed that the stress–strain of the intact rock conforms to the ideal elastic–plastic model.
The expression of the Mohr–Coulomb criterion is:
τ = c + σ tan φ
where c is the cohesive force; φ is the internal friction angle; τ, σ are the shear stress and the principal stress on the slip surface, respectively.
Flow rule expression:
d ε i j p = d θ Φ σ i j
where ε i j p is the plastic strain component, Φ is the plastic potential function, d θ is the plastic factor; the expression of Φ is
Φ = [ ( δ 0 σ t tan ψ ) 2 + ( B q ) 2 ] 1 / 2 p tan ψ
where q is the deviator stress, p is the spherical stress, δ0 is the cusp curvature of the meridian of the plastic potential function in the q-p plane during tension, with a value of 0.1; ψ is the shear expansion angle. B controls the shape of the plastic potential function G in the π plane, expressed as:
B = 4 ( 1 e 2 ) cos 2 α + ( 2 e 1 ) 2 A ( π / 3 ) 2 ( 1 e 2 ) cos α + ( 2 e 1 ) [ 4 ( 1 e 2 ) cos 2 α + 5 e 2 4 e ]
where e is the eccentricity, and e = (3 − sin α)/(3 + sin α).

3. Method and Verification

3.1. Numerical Simulation Method

In the second section, the constitutive relations of complete rock deformation, rock mass fracture, and relative motion between rock blocks after complete fracture are introduced. For the former two, the finite element method can be used to solve the mechanical responses such as nodal forces and nodal displacements; for the latter, the discrete element method can be used to calculate the mechanical responses of extrusion and shear friction. Therefore, a numerical simulation method of coupling finite element and discrete element method (CFE-DEM) was proposed. Its basic idea is:
(a)
Firstly, the entire calculation area is divided into solid elements and zero-thickness cohesive elements.
(b)
Assign parameters and boundary conditions to the numerical model. The initial ground stress, the nodal force and displacement of solid elements under mining conditions, and the fracture energy of cohesive elements are calculated by the finite element method (FEM). When the fracture energy is greater than or equal to the fracture energy obtained in the experiment, delete the cohesive element and assign the state variable state = 0.
(c)
Traversing and searching cohesive elements with state = 0 in the entire numerical model, determining the area enclosed by the above elements, denoting it as Ωi. The FEM method is used in the Ωi to calculate the nodal force and nodal displacement of each element after the boundary cohesive elements of the Ωi area is deleted (self-balancing calculation).
(d)
The node force on the interface between the region Ωi and the adjacent Ωi+1 region acts on the discrete element nodes through shared nodes. Under this condition, the displacement w1 and rotation angle α1 of the discrete element area Ωi under the action of external load, body force, and nodal force are calculated by DEM within Δt time.
(e)
Judging whether the “mutual intrusion displacement w1” on the interface between the area Ωi and the adjacent Ωi+1 area satisfies the tolerance Wtolerance. If yes, further calculate the mechanical response in the FEM area Ωi, see step (f) for details; otherwise, take the displacement tolerance Wtolerance as the displacement boundary condition, superimpose the initial stress condition, and calculate the nodal forces and nodal displacements in the area Ωi by FEM.
(f)
Apply the displacement value calculated by DEM to the finite element Ωi and the adjacent Ωi+1 area as the continuous displacement boundary conditions. According to the constitutive relationship in Section 2, Ωi area mechanical response is implicitly solved by FEM.
(g)
If the difference between the nodal force on the interface obtained by FEM and DEM | P F P D | P t o l e r a n c e , where PF is the nodal force obtained by FEM, PD is the nodal force obtained by DEM, and P t o l e r a n c e is the tolerance, then the calculation of this iterative step ends; otherwise, the nodal force is taken as (PF + PD)/2 is the force boundary, which is reapplied in the FEM area and DEM area, and the nodal force and nodal displacement are calculated, respectively, until the inequality | P F P D | P t o l e r a n c e is established.
According to the above steps, the coupling of finite element and discrete element methods is realized, and then numerically realize the conversion process of the rock mass from quasi-continuous medium to discrete medium.

3.2. Parameter Identification

In order to carry out theoretical verification, it is first necessary to identify parameters.
The specific methods for obtaining various mechanical parameters in the constitutive model are as follows: (a) The cohesive force c, internal friction angle φ, dilatancy angle ψ, elastic modulus E, Poisson’s ratio μ, can be obtained through the triaxial compression strength of intact rock blocks under different confining pressures. (b) By using the load–displacement curves obtained from mode I and mode II fracture experiments, parameters such as fracture displacement δn, δs, δt, tensile/shear modulus of elasticity Enn, Ess, Ett, load (tn, ts, tt) can be obtained, and the damage evolution equation D can be calculated. (c) For the penetrated fractures, the shear friction parameters can be obtained by carrying out the direct shear test under the corresponding geo-stress conditions, the normal stress is 5 MPa. The mechanical parameters of rock obtained from the above experiments are shown in Table 1.

3.3. Verification of Constitutive Equations

The Mohr–Coulomb criterion and the corresponding plastic potential function have been widely used in the rock mechanics of intact rock [27]. Constitutive equations of interaction between rock blocks on both sides of the penetrated fractures have been validated by Sargin [26]. While the constitutive equations of rock mass fracture process need be verified by fracture mechanics experiments under the conditions of three-point bending (i.e., mode I fracture) and penetration shear (i.e., mode II fracture). Based on the above mechanical parameters, the constitutive model was verified by comparing numerical simulation and laboratory experiments results.
A numerical model for mode I fracture specimens was established, with a cylindrical diameter of 50 mm and a height of 200 mm. A V-shaped prefabricated notch was made in the middle of the specimen, with a notch thickness of 1 mm. A numerical model for mode II fracture specimen was established, with a cylinder diameter of 50 mm and a height of 50 mm. A circular crack (width of 2 mm) on each of the upper and lower end faces of the specimen were prefabricated, with a crack depth of 10 mm on the upper end face and 20 mm on the lower end face. Cohesive elements on the potential fracture surface were arranged in two types specimens, and solid elements are arranged at other positions. The mechanical properties of the material were determined by Equations (3)–(7), and the mechanical parameters were shown in Table 1. The loading end and support of the testing machine for numerical simulation of mode I fracture were both replaced by cylindrical analytical rigid body approximation. The loading end and support of the testing machine for numerical simulation of mode II fracture were both approximated by a circular analytical rigid body. The loading rates for both mode I and mode II fractures were 0.02 mm/min.
The numerical simulation and experimental results of mode I and mode II fracture are shown in Figure 2.
Comparing the results of numerical simulation and experiments, it can be concluded that: the load–displacement curves of mode I and II fractures calculated by the constitutive equations of fracture mechanics were basically consistent with the experimental results. Specifically, the peak loads of mode I fracture and mode II fracture obtained from the experiment were 784.7 N and 5719.7 N, respectively. The peak loads of mode I fracture and mode II fracture obtained from numerical simulation were 769.8 N and 5687.9 N, respectively. The difference in peak fracture stress between the experimental and simulated specimens was 0.5–5.7%. Therefore, the fracture mechanics constitutive model was well applicable to the roof rock fracture process.

4. Numerical Simulation
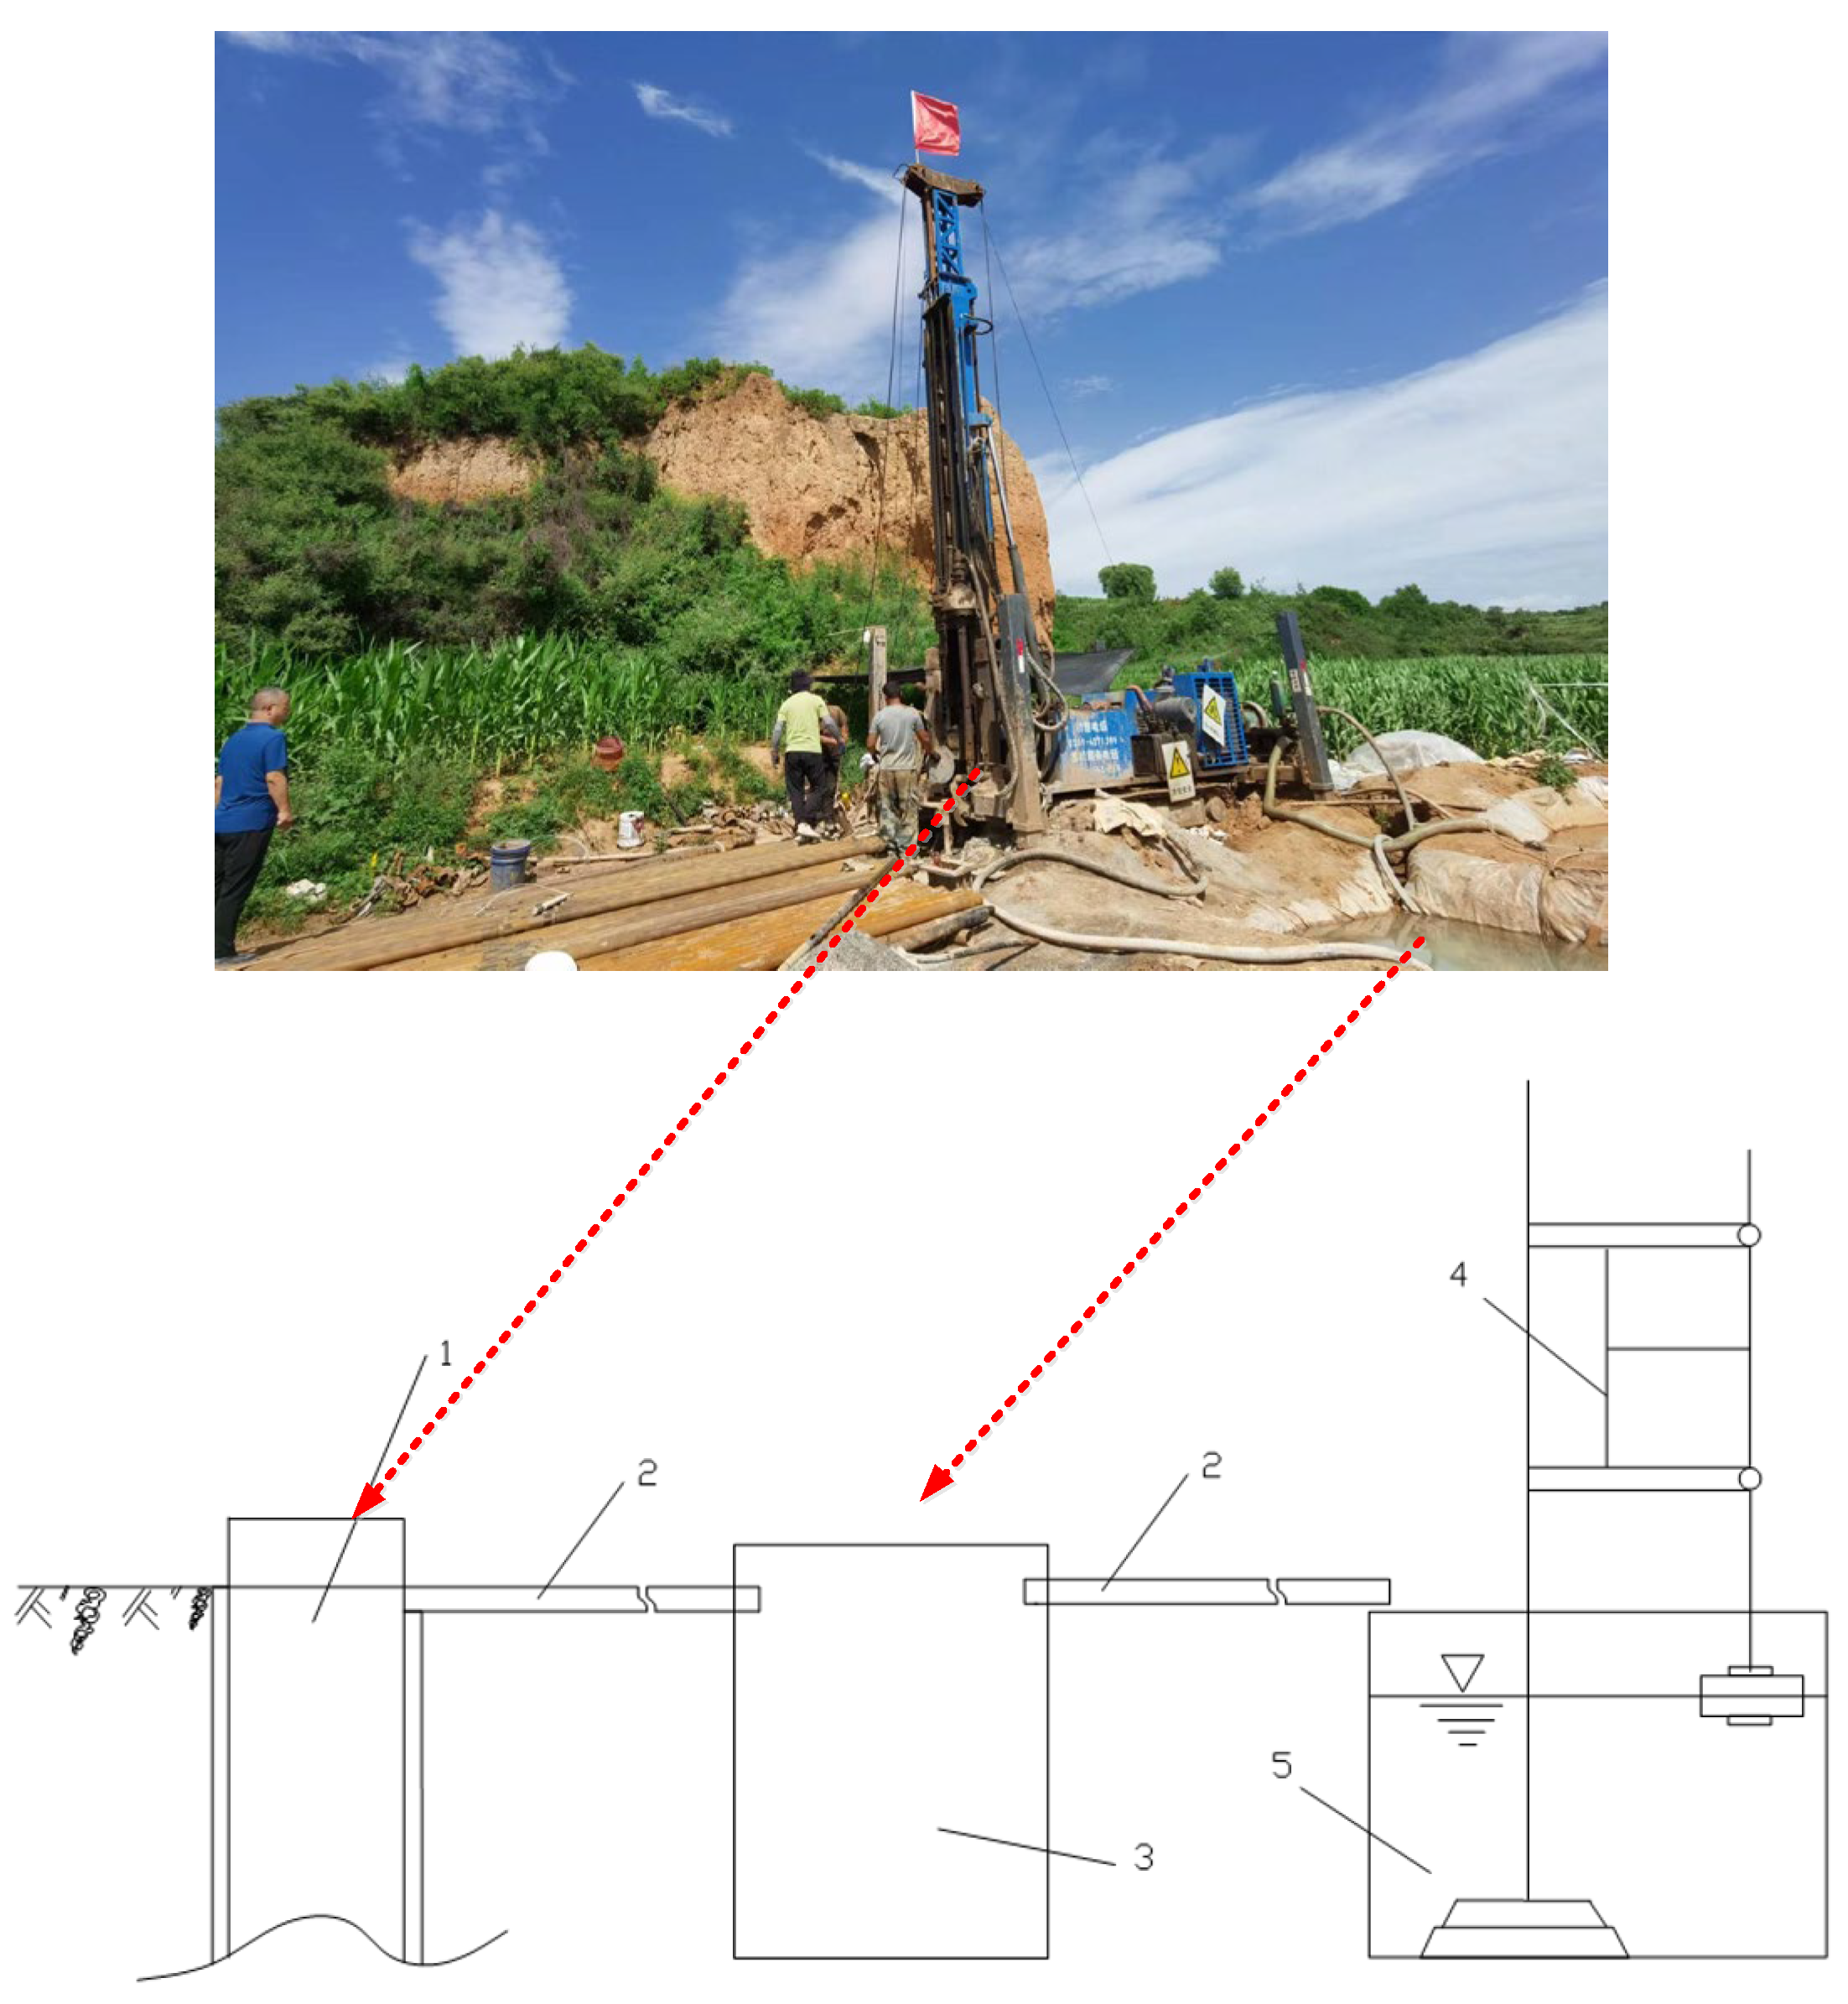
BeiXinYao Coal Mine, located in Ningwu County, Shanxi Province (Figure 3), is mainly mining NO. 5 coal seam. The average thickness of the coal seam is 16 m, belonging to ultra-thick coal seam with a mining depth of 305 m. Its main aquifers in the overlying rock are the Quaternary aquifer and the weathered fissure bedrock aquifer, with a distance of 252 m from the coal seam (Figure 4), and the Huihe River flows above the coal mine (Figure 3). The main roof is sandstone, the direct and main roof is sandstone and sandy mudstone, and the floor is mudstone. Under the disturbance of mining in the 5 # ultra-thick coal seam, the water-conducting fractures in the overlying rock may affect the aquifer with strong water abundance, thus seriously affecting the safe mining of the 5 # ultra-thick coal seam.
To study the distribution of water-conducting fracture fractures in overlying rocks under the mining influence, a numerical calculation model was established as shown in Figure 4. The model is 760 m long and 380 m high. We applied horizontal constraints on the left and right sides of the model, and vertical constraints on the model bottom.
The coupling finite element and discrete element (CFE-DEM) method was carried out on the entire model to obtain the distribution of overlying rock fractures and stress field caused by mining in ultra-thick coal seams, as shown in Figure 5.
Considering that the inclined length of the working face is 200 m, a representative advancing distance of 170–290 m was selected to analyze the fractures and stress field of the overlying rock, as the “square” and subsequent cycles of internal roof movement were more intense.
When the working face was advanced to 170 m, the roof key strata of the sandstone broke, resulting in a small advance bearing pressure, with an equivalent force of about 12.5 MPa. Fractures on the direct roof were generated 18 m ahead of the working face. The penetrated fractures in the overlying rock extend in a trapezoidal shape towards the front of the working face, developing to the top boundary of sandy mudstone at a vertical distance of 85 m from the coal seam. The angle between the envelope line of the fractures in the leading working face and the horizontal direction was 62°. The rock above it was affected by the goaf, and tension fractures appeared near the top boundary of each rock strata, but they were not penetrated fractures. The maximum horizontal distance between the advanced fractures on the surface and the working face was 160 m.
When the working face was advanced to 200 m, the roof mudstone and siltstone form a suspended roof, the advance bearing pressure increased, the equivalent force was about 21 MPa, and the fractures of the direct roof was 27 m ahead of the working face. The penetrated water-conducting fractures in the overlying rock extended in a trapezoidal shape towards the front of the working face, with an angle of 75° between fractures envelope line and the horizontal direction, and develop to the top boundary of the mudstone at a vertical distance of 152 m from the coal seam. The maximum horizontal distance between the surface advanced fractures and the working face was 98 m.
When the working face was advanced to 230 m, the roof key strata had already been broken, and the advance bearing pressure has decreased. The peak equivalent stress was about 12 MPa, and the fractures on the direct roof were generated 20 m ahead of the working face. The penetrated water-conducting fractures in the overlying rock extended in a trapezoidal shape towards the front of the working face, with an angle of 63° between fractures envelope line and the horizontal direction, and develop to the top boundary of the mudstone at a vertical distance of 152 m from the coal seam. The maximum horizontal distance between the surface advanced fractures and the working face was 81 m.
When the working face advanced to 260 m, the suspended distance of roof mudstone and siltstone increased, leading abutment pressure increased, and the peak equivalent stress was about 22 MPa. The fractures of the direct roof were 32 m ahead of the working face. The penetrated water-conducting fractures in the overlying rock extended in a trapezoidal shape towards the front of the working face, with an angle of 64° between the fractured envelope line and the horizontal direction. The water-conducting fractures mainly developed to the top boundary of mudstone at a vertical distance of 152 m from the coal seam. However, in local locations, there is a situation where mudstone fractures intersected with its top sandstone fractures, but fractures opening was relatively small, about 5.2 × 10⁻³ m. The maximum horizontal distance between the surface advanced fractures and the working face was 81 m.
When the working face was advanced to 290 m, the roof mudstone and siltstone collapsed completely, leading abutment pressure decreased, and the peak equivalent stress was about 10 MPa, and fractures of the direct roof were 32 m ahead of the working face. The penetrated water-conducting fractures in the overlying rock extended in a trapezoidal shape towards the rear of the working face (16 m behind the working face), and then form a tension type leading fractures in the sandstone strata of the roof (27 m ahead of the working face). In the upper rock strata of the sandstone, lagging water-conducting fractures appear again (about 30 m behind the working face). In the key strata of the roof, the suspended area gradually increased, and the roof fractures mainly occur during the previous period of weighting; thus, the overlying rock fractures generally lagged behind the working face. In addition, the sandstone strata exhibited significant brittle fractures, and mining-induced fractures were prone to occur within it. The maximum horizontal distance between the surface advanced crack and the working face was 28 m.
As the working face further advanced, the water-conducting fractures in the overlying rock of the ultra-thick coal seam had an angle between fractures envelope line in front of the working face and the advancing direction, ranging from 62 to 75°. The overlying rock fractures have developed to the surface. However, it should be noted that the “fractures opening” has a significant impact on its water conductivity.
To determine the height of water-conducting fractures that can affect the safe mining of the working face, 6 measuring lines were arranged in the model at vertical distances of 56 m, 133 m, 148 m, 188 m, 209 m, and 230 m from the coal seam. The fractures with an opening of more than 1 mm during the mining process were statistically analyzed, and the total opening change curve of the fractures shown in Figure 6 was obtained.
As seen in Figure 6, with the increase in the vertical distance between the survey lines and the coal seam, the total opening of fractures in overlying strata was reduced from 30 m (vertical distance of 56 m) to 2.3 m (vertical distance of 230 m). According to the cubic law of seepage in fractured rock masses, it was known that at fractures opening of 2.3 m, the water flow rate of the aquifer flowing into the goaf would be much smaller than the drainage capacity of the drainage equipment. In addition, as the working face of the ultra-thick coal seam advanced, the total opening of fractures at each measuring line showed a trend of first increasing then decreasing. Taking Line 1 as an example: when the working face advanced to 53.7 m, the roof had not yet broken, the rock strata were less disturbed, and the fractures opening was small. When the working face advanced to 73.45 m, the roof completely broke and collapsed, causing periodic pressure, and the goaf was filled with broken rock blocks. At this time, the width of the water-conducting fractures changed significantly with rapidly increases to 21.24 m. This situation reaches its peak when the working face advances to 141.25 m, and the fractures open to a maximum of 29.45 m. When the working face advances to 282.5 m, the mining stress gradually begins to stabilize, the rock strata rotated, showing an overall downward trend. At this time, the width of the crack decreased to 21.62 m. The crack opening at other survey lines was consistent with the changes in and causes of the survey line 1 and would not be repeated.
Based on the above numerical results of fracture opening, the height of water-conducting fractures ranges from 209 m to 230 m.
From the above simulation results, compared with traditional finite element FEM, finite difference FDM, and discrete element DEM methods, the CFE-DEM method has unique advantages in dealing with water-conducting fractures in mining overlying strata, as shown in Table 2.

5. In Situ Testing

5.1. Test Methods

Use the consumption method of drilling flushing fluid to determine the height of water-conducting fractures. During the mining process of ultra-thick coal seam, fractures appear in the overlying rock, which can greatly increase the permeability of the overlying rock. If geological drilling was carried out in the fractured overlying rock, the height of water-conducting fractures could be determined by monitoring the changes in the liquid level of the flushing fluid (a fluid used to reduce the temperature of the drill bit and protect the drilling hole).
The in situ test of flushing fluid leakage was conducted through the “flushing fluid leakage observation system”. The schematic diagram is shown in Figure 7. During the drilling process (1), the flushing fluid flowed through the sedimentation tank (3) from the water source tank (5) and then entered the drilling hole. If the water level in the borehole kept at a constant value, only the flow rate of flushing fluid supplied to the borehole (i.e., the amount of flushing fluid leakage) needed to be measured to qualitatively determine the development of fractures in different rock layers. By comparing the leakage amount of flushing fluid in natural strata and strata under the mining influence, the height of the water-conducting fracture zone can be determined. To achieve this, a buoy type water level gauge (4) was installed in the water source tank (5) to obtain the real-time drop height of the flushing liquid level in the water source tank.
To obtain the height of the overlying rock fracture zone, the judgment criteria need to be established:
(1)
The consumption of flushing fluid increases with the drilling depth of the borehole;
(2)
At a certain location, all the flushing fluid in the drilling hole has been lost, and there is no flushing fluid in the hole. Moreover, after plugging, there is still a phenomenon of all the flushing fluid leaking when drilling again;
(3)
As the drilling depth increases, the water level inside the borehole decreases faster;
(4)
There are longitudinal fractures in the rock core or slight air suction in the borehole.
The monitoring borehole for the height of the water-conducting fracture zone in the overlying strata of the ultra-thick coal seam mining was arranged in the 5105 face, with a distance of 500 m between the borehole and the starting cut, and a distance of 110 m between the borehole and the air inlet tunnel. After the mining progress of 5105 face was completed and the overlying rock movement was stable, drilling could be carried out.

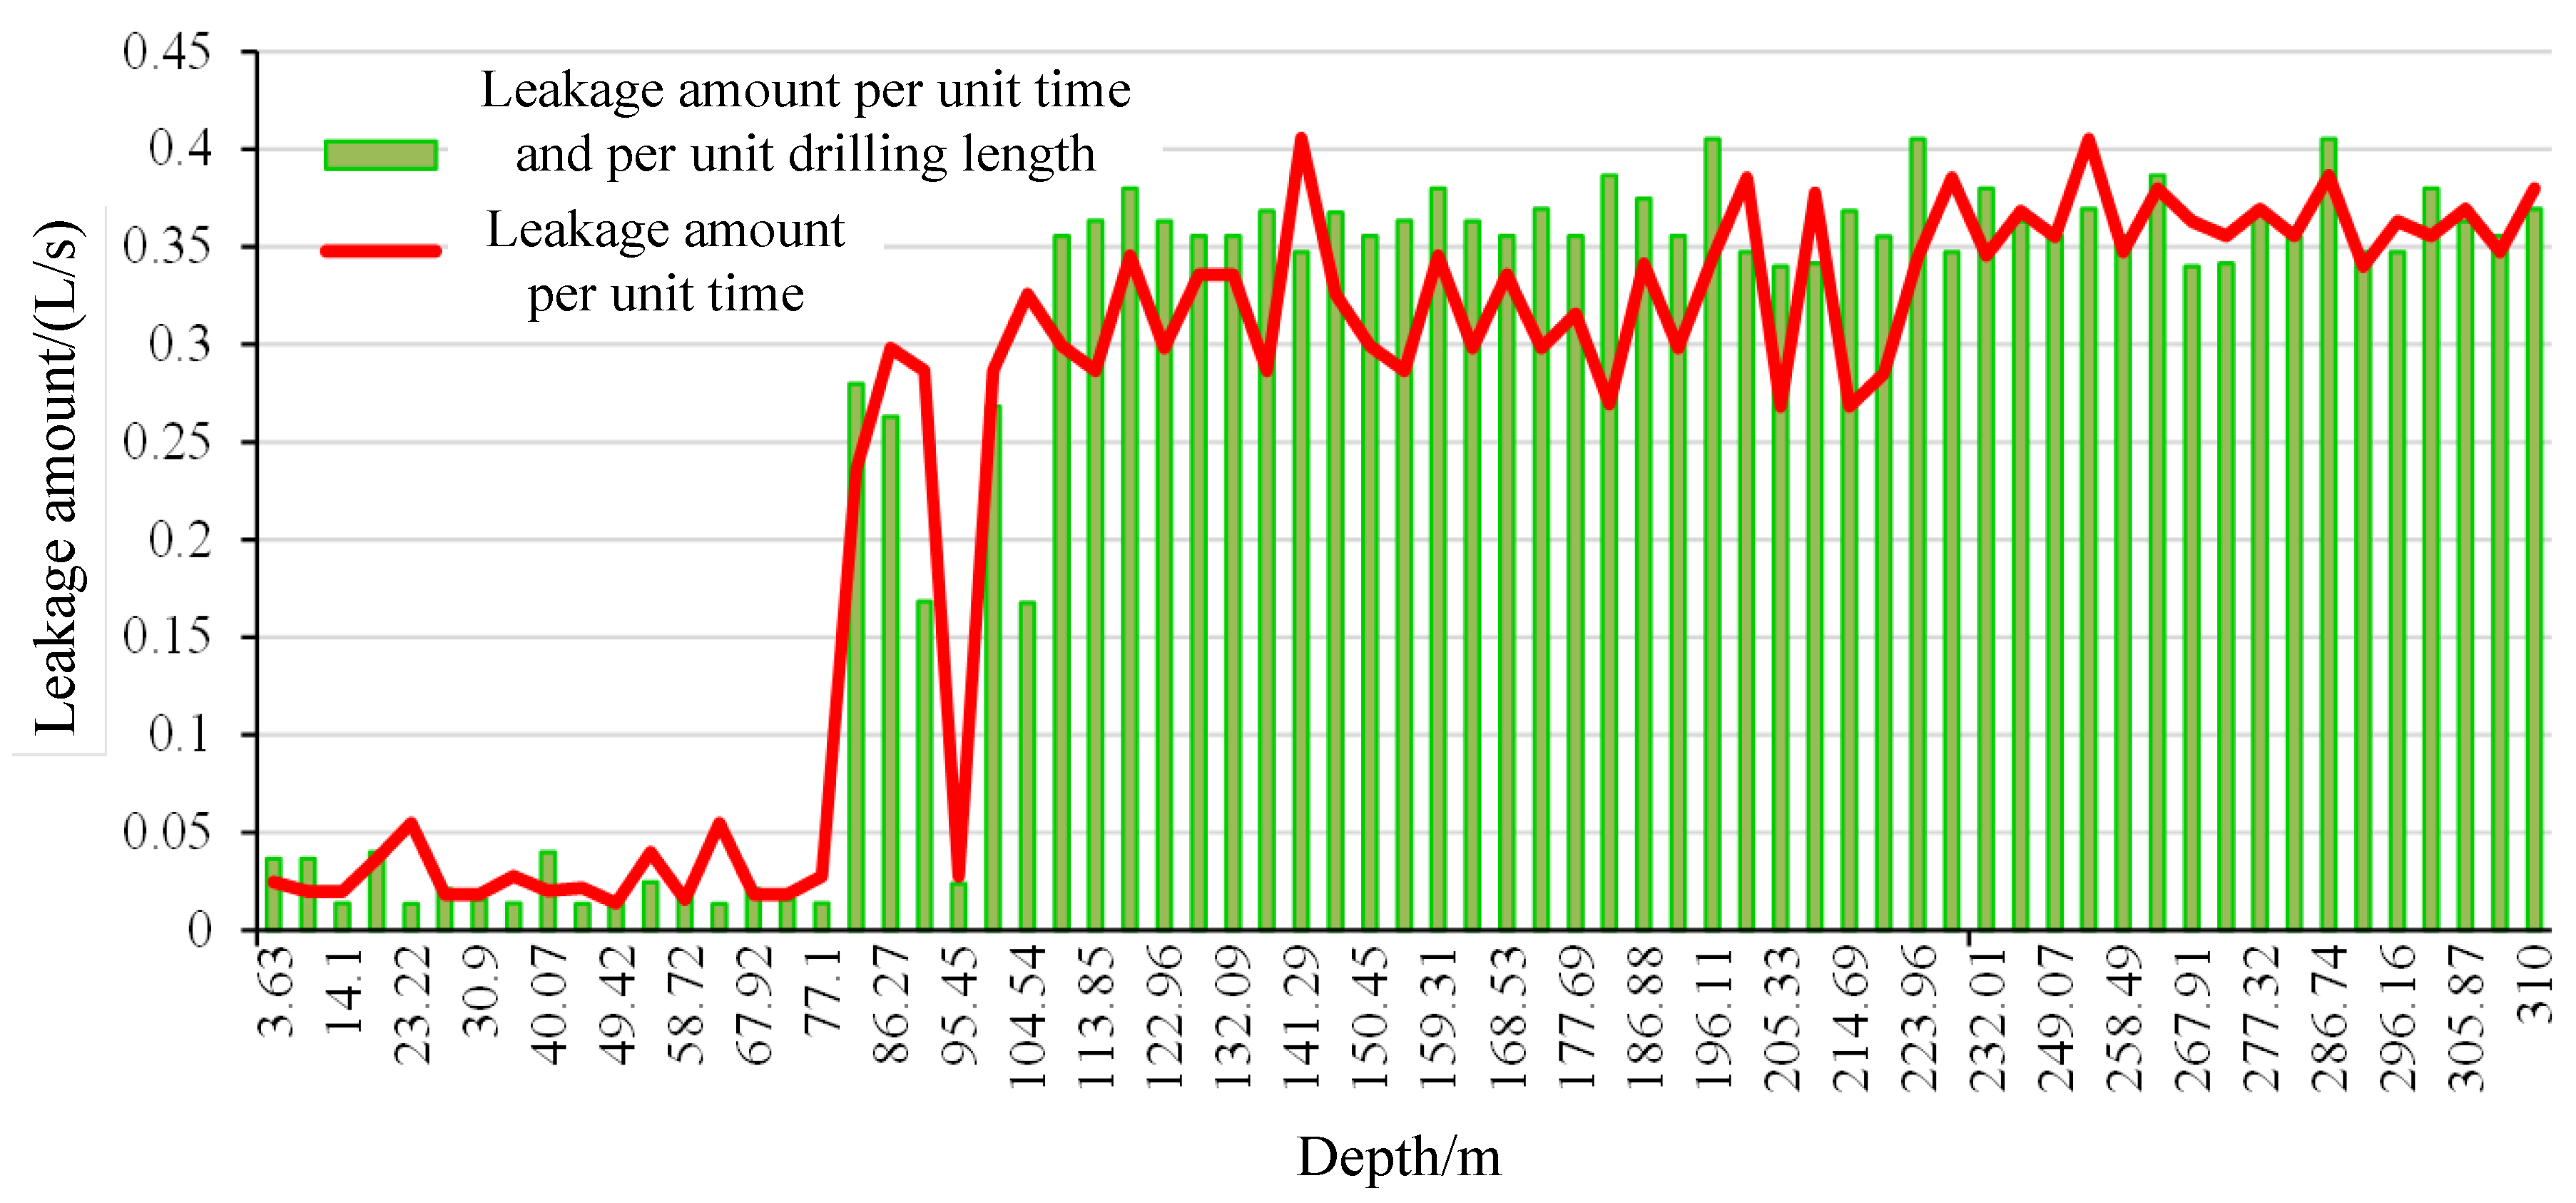
5.2. In Situ Test Results

The consumption of flushing fluid was observed every 5 m of drilling. In the above process, the fluid consumption during drilling at a depth of 0–86.27 m was 0.01–0.052 L/s, indicating that the opening of overlying rock fractures during mining was small. When the drilling depth reached 86.27 m, the fluid consumption reached 0.2632 L/s, which was 5–20 times the fluid consumption at the shallow position, indicating that fractures opening at this location were large after the coal mining. Afterwards, the leakage rate remained at a high-level fluctuation, and the leakage rate of the drilling gradually increased with the increase in depth, until there was no water reflux in the hole and all the flushing fluid was lost, indicating that the damage degree of rock caused by mining continued to increase. The consumption of flushing fluid starts from 86.27 m and reaches the bottom of the borehole. This indicated that the height of the overlying rock water-conducting fracture zone at the borehole was 224 m.
The numerical simulation results (Figure 8) show that the height of the water-conducting fracture zone in the overlying strata was between 209 m and 230 m. This value was close to the in situ test results, indicating the rationality of the numerical results. In addition, based on the above results, the overlying rock fractures caused by the mining of ultra-thick coal seams did not affect the water rich aquifer with a vertical distance of 252 m from the coal seam, and there is a mudstone layer between the water-conducting fracture zone and the aquifer. Therefore, the impact of ultra-thick coal seam mining on the surface ecological environment was small.

6. Conclusions

(1)
Compared to the theory based on the assumption of continuous media, the theory established in this article and the corresponding CFE-DEM numerical method can numerically simulate the distribution and evolution of mining-induced overlying rock fractures.
(2)
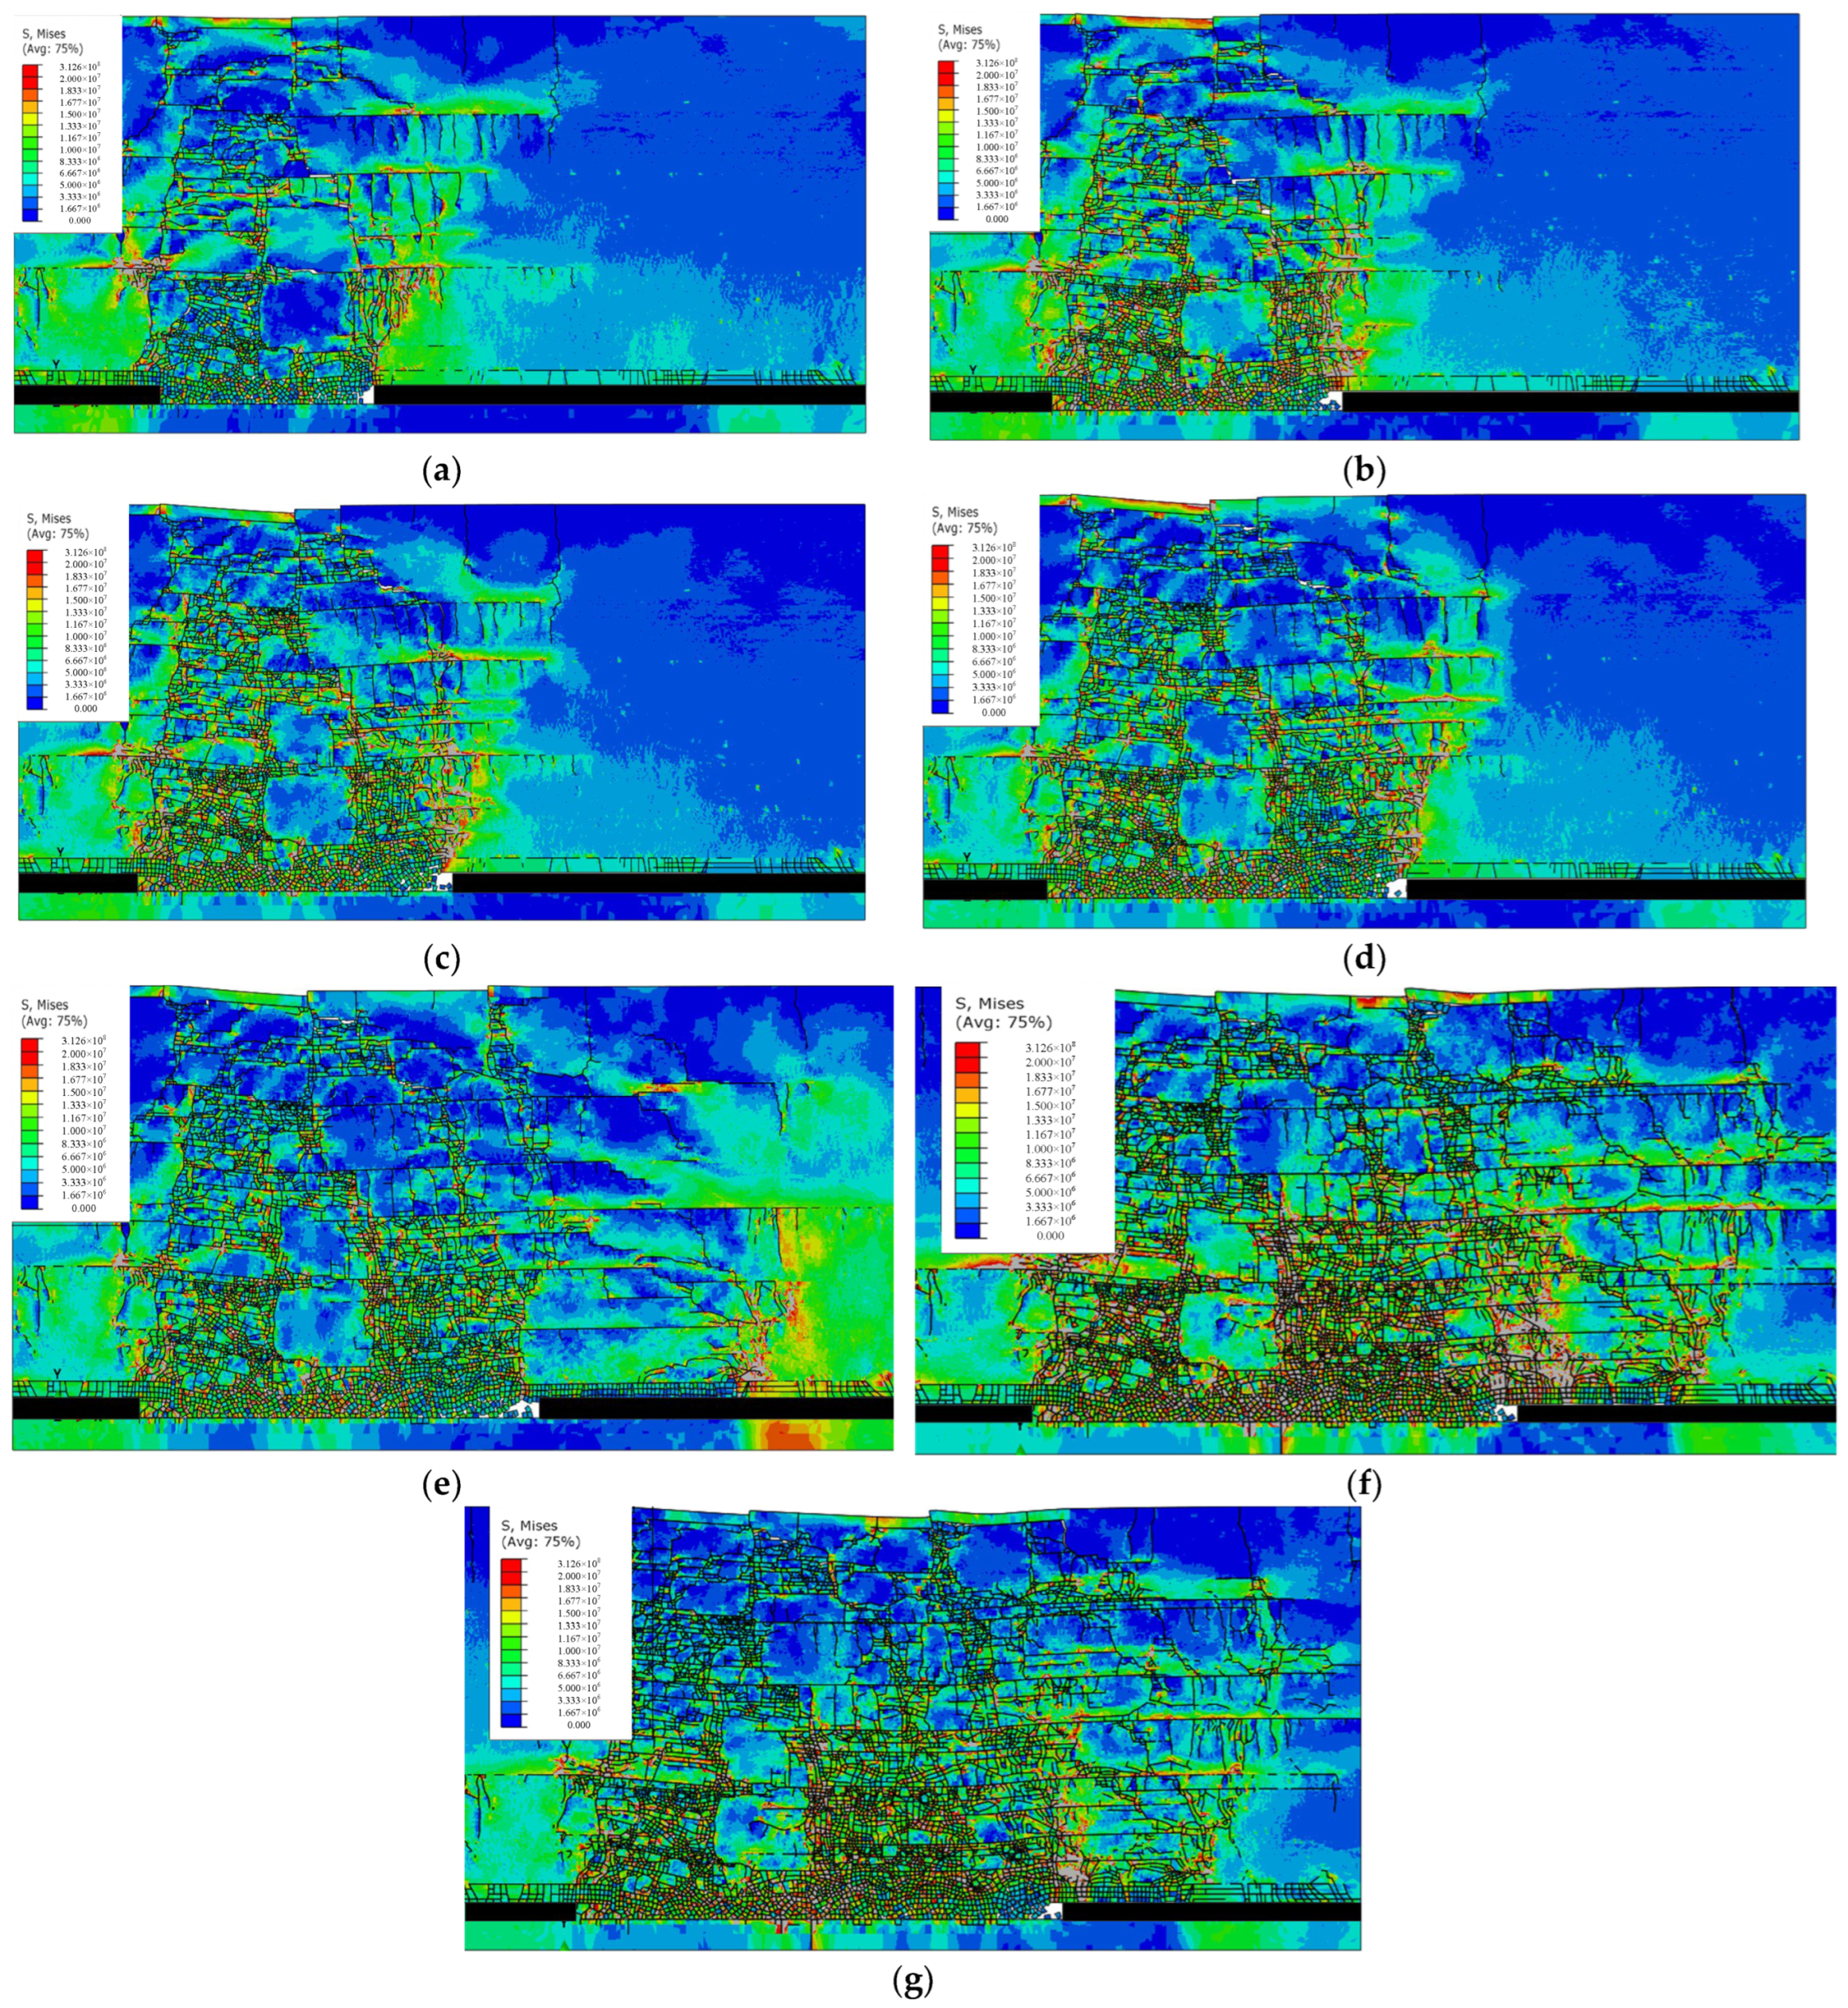
The numerical calculation results indicate that direct roof cracks generally occur between 18 m and 32 m in front of the working face.
(3)
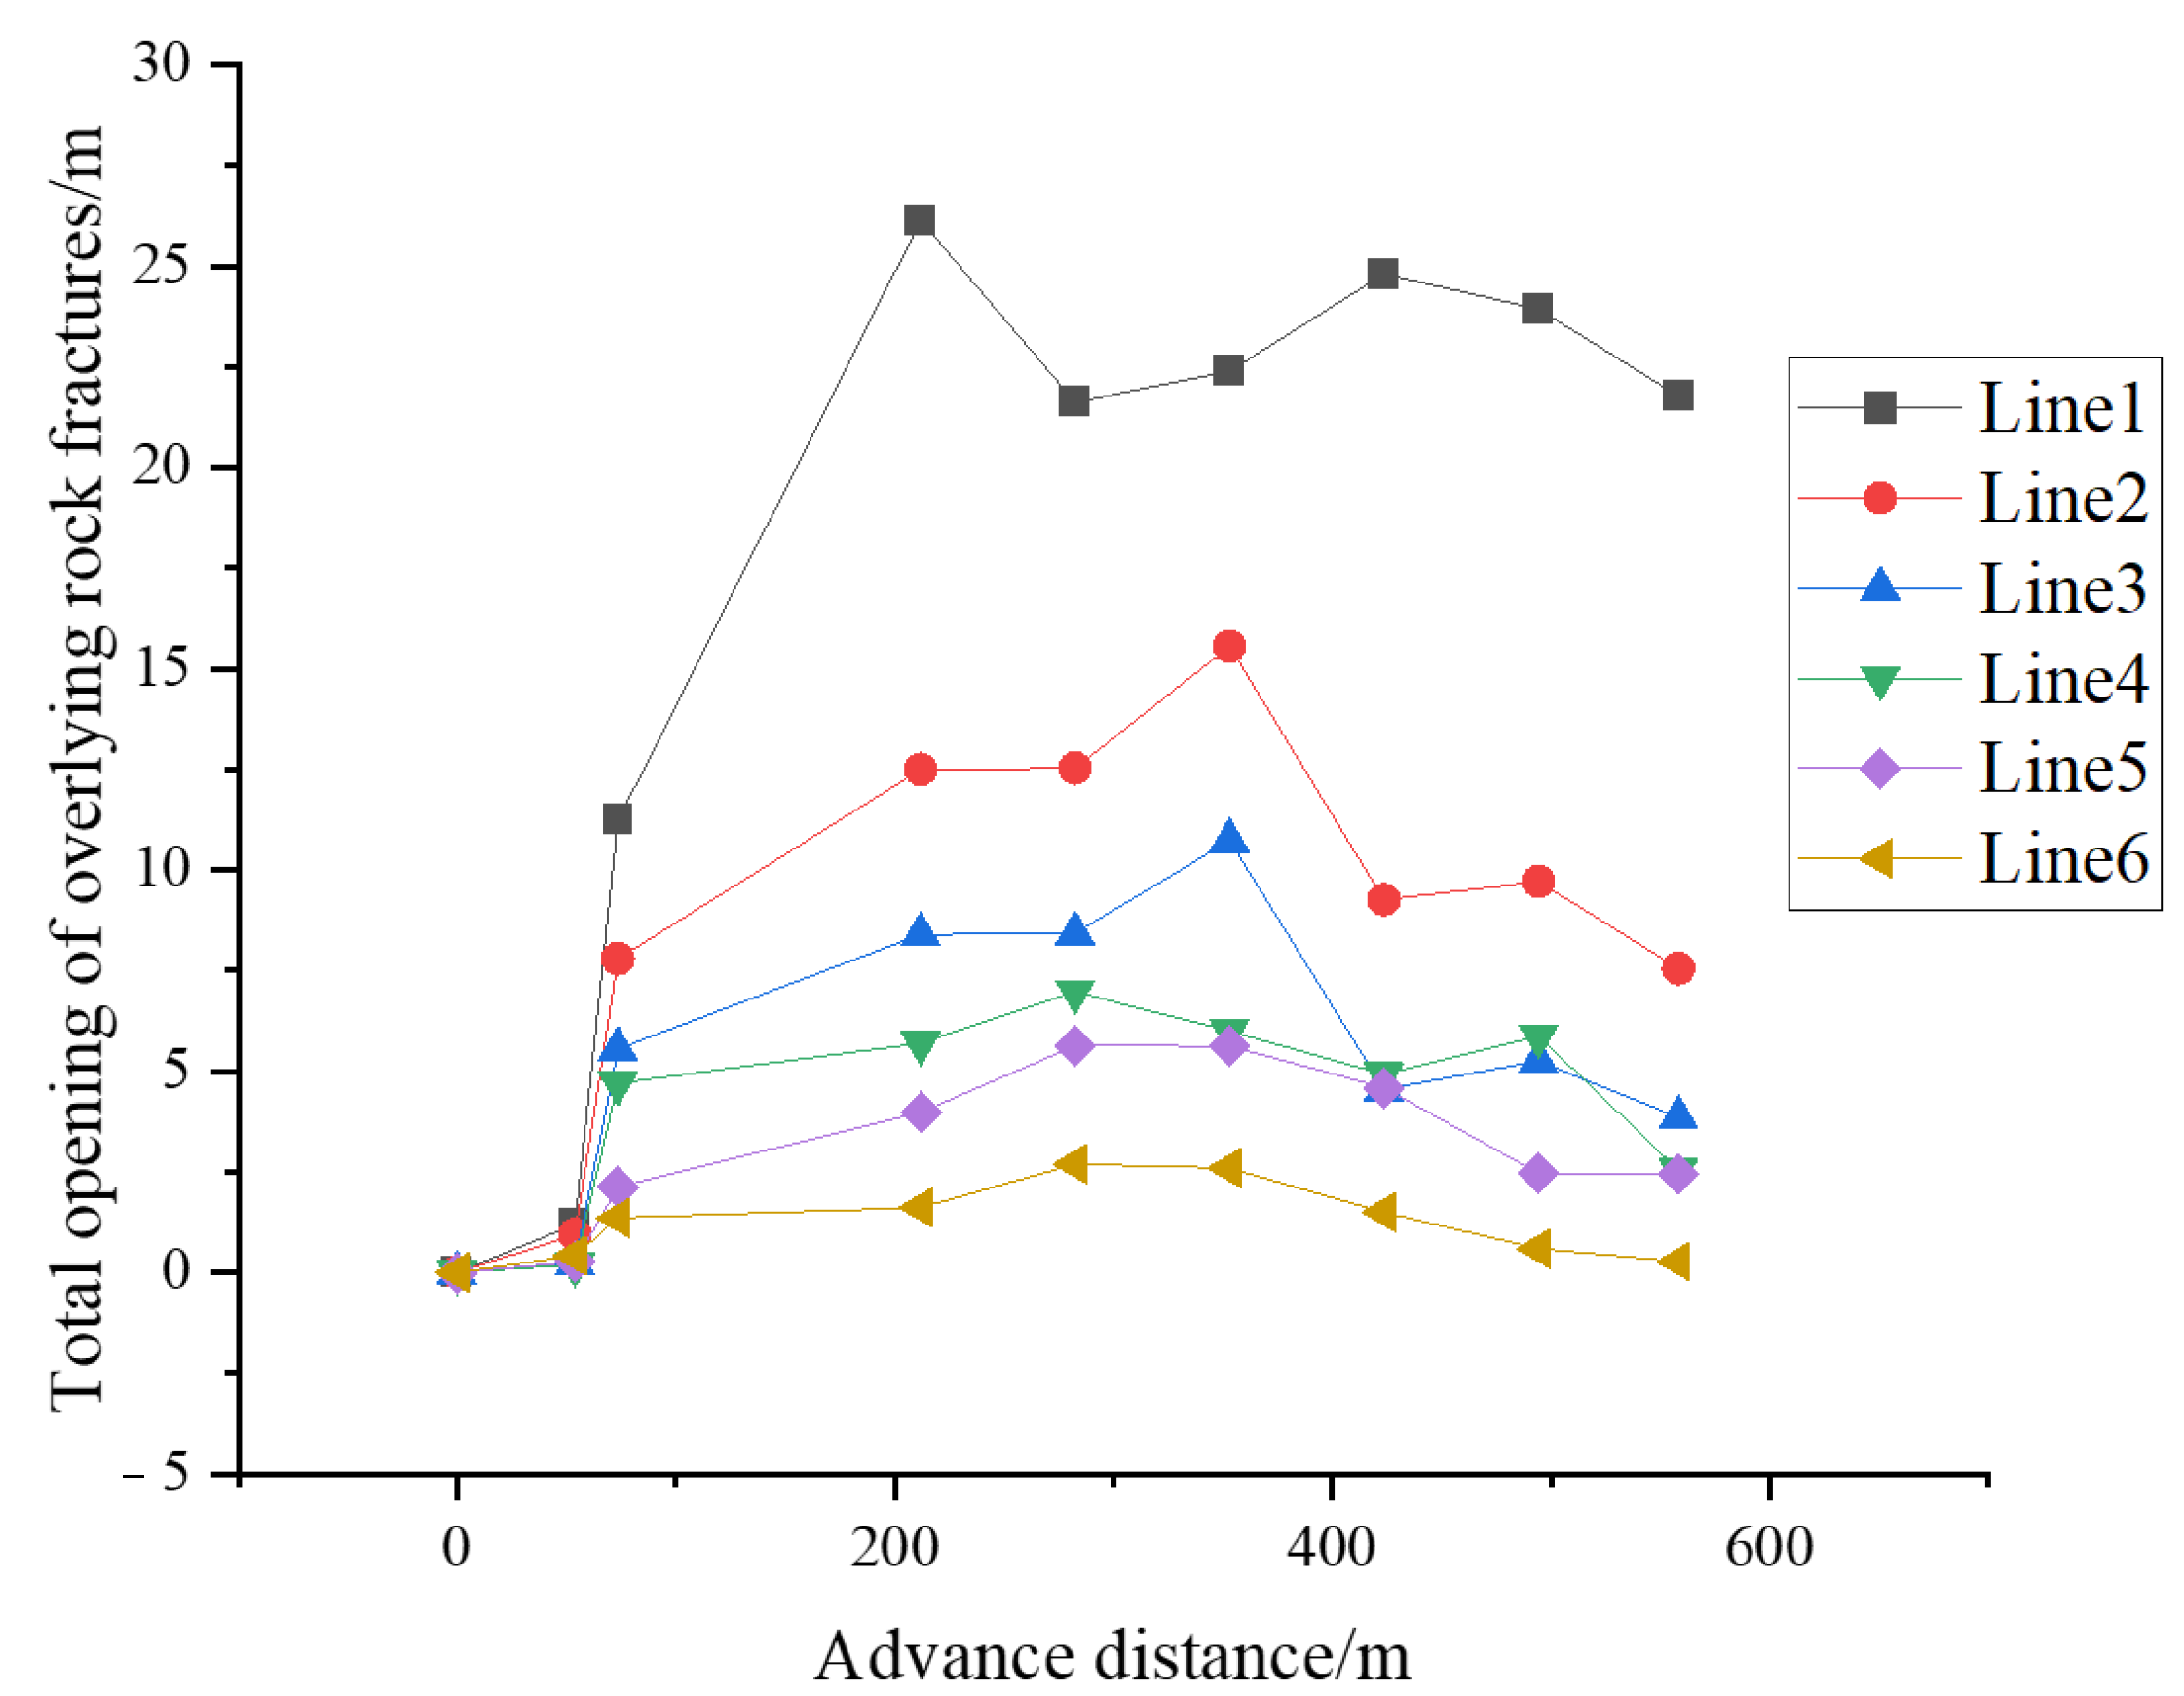
The water-conducting cracks in the overlying strata of the direct roof of the ultra-thick coal seam generally extend in a trapezoidal shape towards the working face, with an angle between 62° and 75° with the advancing direction.
(4)
The on-site test and numerical simulation results indicate that the height of the water-conducting fracture zone in the overlying strata of the ultra-thick coal seam is between 209 m and 230 m.
(5)
There are multiple muddy weak permeable layers between 230 m and 252 m above the top boundary of the water-conducting fracture zone. Therefore, the mining of ultra-thick coal seams will not have a serious impact on the surface ecological environment.

Author Contributions

Conceptualization, X.Y.; methodology, Y.Z.; software, Y.Z.; validation, Y.Z. and X.Y.; formal analysis, Y.Z.; investigation, Y.Z.; resources, X.Y.; data curation, X.Y.; writing—original draft preparation, Y.Z.; writing—review and editing, Y.Z.; visualization, Y.Z.; supervision, X.Y.; project administration, Y.Z. All authors have read and agreed to the published version of the manuscript.

Funding

This research received no external funding.

Institutional Review Board Statement

Not applicable.

Informed Consent Statement

Not applicable.

Data Availability Statement

Due to the involvement of data privacy in coal mines, complete disclosure of data is not supported.

Conflicts of Interest

The authors declare no conflict of interest.

References

  1. Afshar, A.; Khosravi, M.; Molajou, A. Assessing adaptability of cyclic and non-cyclic approach to conjunctive use of groundwater and surface water for sustainable management plans under climate change. Water Resour. Manag. 2021, 35, 3463–3479. [Google Scholar] [CrossRef]
  2. Arens, M.; Åhman, M.; Vogl, V. Which countries are prepared to green their coal-based steel industry with electricity?—Reviewing climate and energy policy as well as the implementation of renewable electricity. Renew. Sustain. Energy Rev. 2021, 143, 110938. [Google Scholar] [CrossRef]
  3. Gupta, S.D. Using real options to value capacity additions and investment expenditures in renewable energies in India. Energy Policy 2021, 148, 111916. [Google Scholar] [CrossRef]
  4. Yuan, Z.; Zhi-Jun WA, N.; Fu-Chen, L.I. Large deformation mechanism of roadway driving along goaf under unstable overlying rock strata. J. Min. Saf. Eng. 2012, 29, 451. [Google Scholar]
  5. Wang, Z.; Li, W.; Wang, Q.; Hu, Y.; Du, J. Monitoring the Dynamic Response of the Overlying Rock–Soil Composite Structure to Underground Mining Using BOTDR and FBG Sensing Technologies. Rock Mech. Rock Eng. 2021, 54, 5095–5116. [Google Scholar] [CrossRef]
  6. Liu, H.; Deng, K.; Zhu, X.; Jiang, C. Effects of mining speed on the developmental features of mining-induced ground fissures. Bull. Eng. Geol. Environ. 2019, 78, 6297–6309. [Google Scholar] [CrossRef]
  7. Miao, X.; Cui, X.; Wang, J.; Xu, J. The height of fractured water-conducting zone in undermined rock strata. Eng. Geol. 2011, 120, 32–39. [Google Scholar] [CrossRef]
  8. Li, L.; Li, F.; Zhang, Y.; Yang, D.; Liu, X. Formation mechanism and height calculation of the caved zone and water-conducting fracture zone in solid backfill mining. Int. J. Coal Sci. Technol. 2020, 7, 208–215. [Google Scholar] [CrossRef]
  9. Ning, J.; Wang, J.; Tan, Y.; Xu, Q. Mechanical mechanism of overlying strata breaking and development of fractured zone during close-distance coal seam group mining. Int. J. Min. Sci. Technol. 2020, 30, 207–215. [Google Scholar] [CrossRef]
  10. Du, W.; Chai, J.; Zhang, D.; Lei, W. The study of water-resistant key strata stability detected by optic fiber sensing in shallow-buried coal seam. Int. J. Rock Mech. Min. Sci. 2021, 141, 104604. [Google Scholar] [CrossRef]
  11. Liu, W.; Pang, L.; Liu, Y.; Du, Y. Characteristics Analysis of Roof Overburden Fracture in Thick Coal Seam in Deep Mining and Engineering Application of Super High Water Material in Backfill Mining. Geotech. Geol. Eng. 2018, 37, 2485–2494. [Google Scholar] [CrossRef]
  12. Xu, J.L.; Qin, W.; Xuan, D.Y.; Zhu, W.B. Accumulative effect of overburden strata expansion induced by stress relief. J. China Coal Soc. 2020, 45, 35–43. [Google Scholar]
  13. Jun, W.; Weibing, Z.; Jianlin, X. Research on subsidence law of overlying strata in full mining of extra-thick coal seam. Ind. Mine Autom. 2021, 47, 21–26. [Google Scholar]
  14. Maosen, Y.; Weibing, Z.; Lin, L.; Xu, Z.; Jialin, X. Water-inrush mechanism and prevention for fourth panel roof in Bulianta coal mine. J. China Coal Soc. 2008, 33, 241–245. [Google Scholar]
  15. Fan, H.; Wang, L.; Lu, Y.; Li, Z.; Li, W.; Wang, K. Height of water-conducting fractured zone in a coal seam overlain by thin bedrock and thick clay layer: A case study from the Sanyuan coal mine in North China. Environ. Earth Sci. 2020, 79, 125. [Google Scholar] [CrossRef]
  16. Ilyukhin, D.; Gusev, V. The Use of the Finite Element Method for Ensuring Efficient and Safe Extraction of Minerals. In Key Engineering Materials; Trans Tech Publications Ltd.: Zurich, Switzerland, 2017; Volume 743, pp. 411–416. [Google Scholar]
  17. Qile, D. Overlying Strata Movement Law and Control of Underground Mining in End Slope. Ph.D. Thesis, University of Mining and Technology, Xuzhou, China, 2017. [Google Scholar]
  18. Liu, Y.; Liu, Q.; Li, W.; Li, T.; He, J. Height of water-conducting fractured zone in coal mining in the soil–rock composite structure overburdens. Environ. Earth Sci. 2019, 78, 242. [Google Scholar] [CrossRef]
  19. Liu, S.; Fei, Y.; Wang, J.; Wu, D.; Guo, D.; Dong, Y.; Liu, X.; Shangguan, Y. A novel method to retain a waterproof coal pillar near water-conducting fault. J. Geophys. Eng. 2023, 20, 225–239. [Google Scholar] [CrossRef]
  20. Ning, S.; Zhu, W.; Yi, X.; Wang, L. Evolution law of floor fracture zone above a confined aquifer using backfill replacement mining technology. Geofluids 2021, 2021, 8842021. [Google Scholar] [CrossRef]
  21. Qi, D.; Ru, X.; Li, D.; Chu, F.; Zhang, J. Study of the Height of Water Flowing Fracture Zone Based on Strain Energy Failure Criterion. In IOP Conference Series: Earth and Environmental Science; IOP Publishing: Bristol, UK, 2019; Volume 330. [Google Scholar]
  22. Yadong, J.; Haidong, C.; Baofeng, Z. Mechanism and Control of Water Inrush from Separated Roof Layers in the Jurassic Coalfields. Mine Water Environ. 2021, 40, 357–365. [Google Scholar]
  23. Zhu, T.; Li, W.; Wang, Q.; Hu, Y.; Fan, K.; Du, J. Study on the Height of the Mining-Induced Water-Conducting Fracture Zone Under the Q 2l Loess Cover of the Jurassic Coal Seam in Northern Shaanxi, China. Mine Water Environ. 2020, 39, 57–67. [Google Scholar] [CrossRef]
  24. Sun, W.B.; Wang, Y.; Qiu, H.F.; Ding, Z.W. Numerical simulation study of strip filling for water-preserved coal mining. Environ. Sci. Pollut. Res. 2019, 27, 12899–12907. [Google Scholar] [CrossRef] [PubMed]
  25. Wang, C.; Zhang, Q.-Y. Study of the Crack Propagation Model Under Seepage–Stress Coupling Based on XFEM. Geotech. Geol. Eng. 2017, 35, 2433–2444. [Google Scholar] [CrossRef]
  26. Sargin, M. Stress-Strain Relationships for Concrete and Analysis of Structural Concrete Sections. Ph.D. Thesis, University of Waterloo, Waterloo, ON, Canada, 1971. [Google Scholar]
  27. Labuz, J.F.; Zang, A. Mohr–Coulomb failure criterion. Rock Mech. Rock Eng. 2012, 45, 975–979. [Google Scholar] [CrossRef]
Figure 1. Surface vegetation in the Ningwu coalfield.
Sustainability 15 13974 g001
Figure 2. The numerical simulation and experimental results.
Sustainability 15 13974 g002
Figure 3. Location of BeiXinYao coal mine.
Sustainability 15 13974 g003
Figure 4. Numerical calculation model.
Sustainability 15 13974 g004
Figure 5. Evolution of overlying rock fractures and stress fields in different mining advances. (a) Advancing distance is 170 m; (b) advancing distance is 200 m; (c) advancing distance is 230 m; (d) advancing distance is 260 m; (e) advancing distance is 290 m; (f) advancing distance is 390 m; (g) advancing distance is 420 m.
Sustainability 15 13974 g005
Figure 6. The evolution curve of the cracks opening at positions of line 1–6 with the mining advancing distance.
Sustainability 15 13974 g006
Figure 7. Schematic diagram of flushing fluid leakage observation system. 1—drilling; 2—circulation tank; 3—sedimentation tank; 4—float type water level gauge; 5—water source.
Sustainability 15 13974 g007
Figure 8. Leakage of flushing fluid during drilling process.
Sustainability 15 13974 g008
Table 1. Parameters in the constitutive equations of overburden deformation–fracture–rock mass interaction (conversion value per unit area).
Nameρ
/(kg·m−3)
ts0,tt0
/MPa
tn0
/MPa
Enn
/GPa
Ess, Ett
/GPa
δ m max
/m
E/GPaμφ
/(°)
c
/MPa
ψ/(°)wn,max
/mm
Dn/GPaDS/GPa s s peak
/MPa
w s peak
/mm
siltstone25007.23.6416.230.0617.230.224012.35340.3620.119.757.310.75
limestone2500205.76.237.280.0441.560.254522.70340.4042.1515.6212.530.86
coal1500103.533.980.0610.210.25304.77250.4110.213.063.431.12
mudstone15003.5233.560.1211.850.25327.36260.2011.850.942.712.87
sandy mudstone2500103.5156.710.0715.330.25389.88320.2915.334.104.721.15
Table 2. Comparison of advantages and disadvantages of FEM, FDM, DEM, and CFE-DEM numerical methods.
MethodAdvantageDisadvantage
FEMEffectively simulate the plastic deformation and damage of intact rock blocksIdeal continuum assumption, Convergence
FDMEffectively simulate the plastic deformation and damage of intact rock blocksIdeal continuum assumption, Convergence
DEMUnconditional convergence, cracks propagationIdeal discrete medium Assumption, distribution of cracks in masonry form
CFE-DEMNumerical implementation of the entire process of deformation, cracking, and movement of mining overburden, with random cracking of cracksHigh computational cost
Disclaimer/Publisher’s Note: The statements, opinions and data contained in all publications are solely those of the individual author(s) and contributor(s) and not of MDPI and/or the editor(s). MDPI and/or the editor(s) disclaim responsibility for any injury to people or property resulting from any ideas, methods, instructions or products referred to in the content.

