
Examining the Safety Impacts of High-Occupancy Vehicle Lanes: International Experience and an Evaluation of First Operation in Israel


Abstract
:1. Introduction
2. Previous Research on Safety Impacts of HOV Lanes
2.1. Literature Search
2.2. Main Findings of the International Literature
3. Examining Accident Changes in the Israeli Case: Data and Methods
4. Accident Analyses of the Israeli Case: Results
4.1. A Detailed Example: Changes in the Number of Injury Accidents on Road Sections
4.2. Changes in All Accident Time-Series Examined
- In injury accidents (based on the TD files) on road sections, increasing trends were found in accident occurrences, in total accidents (with all injury levels), severe accidents, vehicle collisions and accidents involving motorcycles. However, the changes in daytime and night accidents on road sections were inconsistent in relation to different comparison-group roads.
- In injury accidents at interchange areas (based on the TD files), increasing trends were observed in total and daytime accidents, with an almost significant increase in the case of daytime accidents as compared to Road #1 (OR = 5.9, p = 0.066). At the same time, a decreasing trend was observed in nighttime injury accidents at interchange areas in relation to both comparison groups.
- Concerning injury accidents from the complementary files (“general with casualties”), on road sections, inconsistent changes were observed in the total and daytime accident occurrences, while in night accidents and accidents involving buses or motorcycles, decreasing trends were indicated. At the same time, regarding accidents at interchange areas, consistent increasing trends were found in the total and daytime accidents, including a significant increase as compared to Road #1 (OR = 3.0, p < 0.05 for total accidents; OR =3.9, p < 0.01 for daytime accidents) and Road #4 (OR = 2.4, p = 0.057 for daytime accidents). In night accidents at interchange areas, decreasing trends were observed.
- It should be noted that the decreasing trends observed in night accidents at interchange areas (according to data from both the main accident files and complementary files) are less relevant to the measure examined because HOV lanes on Road #2 operate mostly during daytime (between 6 am and 10 pm).
5. Discussion
6. Conclusions
Author Contributions
Funding
Institutional Review Board Statement
Informed Consent Statement
Data Availability Statement
Acknowledgments
Conflicts of Interest
Appendix A

| Variable | Estimate | Standard Error | DF | t Value | Pr > |t| |
| Intercept | −17.5814 | 30.5611 | 89.02 | −0.58 | 0.5665 |
| time | −0.02268 | 0.01569 | 42.37 | −1.45 | 0.1556 |
| type: C1 | 0.2500 | 0.3500 | 36.38 | 0.71 | 0.4795 |
| type: C2 | 0.3084 | 0.2876 | 36.35 | 1.07 | 0.2906 |
| type: T | 0 | . | . | . | . |
| time * type C1 | 0.002820 | 0.01954 | 36.11 | 0.14 | 0.8861 |
| time * type C2 | 0.01246 | 0.01597 | 36.1 | 0.78 | 0.4405 |
| time * type T | 0 | . | . | . | . |
| time2 | 0.04257 | 0.07111 | 48.9 | 0.60 | 0.5522 |
| time2 * type C1 | −0.00636 | 0.09071 | 40.35 | −0.07 | 0.9445 |
| time2 * type C2 | −0.06589 | 0.07099 | 40.27 | −0.93 | 0.3589 |
| time2 * type T | 0 | . | . | . | . |
| I_after | 0.09142 | 0.6290 | 47.44 | 0.15 | 0.8851 |
| I_after * type C1 | −0.2296 | 0.8200 | 42.9 | −0.28 | 0.7809 |
| I_after * type C2 | 0.08700 | 0.6415 | 43.01 | 0.14 | 0.8928 |
| I_after * type T | 0 | . | . | . | . |
| I_Lock1 | −0.1881 | 0.3803 | 91.05 | −0.49 | 0.6221 |
| I_Lock2 | 0.3344 | 0.3751 | 98.85 | 0.89 | 0.3749 |
| mon: 1 | 0.6300 | 0.2573 | 104.7 | 2.45 | 0.0160 |
| mon: 2 | 0.3741 | 0.2737 | 111.2 | 1.37 | 0.1744 |
| mon: 3 | 0.3036 | 0.2798 | 110.7 | 1.09 | 0.2802 |
| mon: 4 | 0.2509 | 0.2849 | 110.7 | 0.88 | 0.3803 |
| mon: 5 | 0.4742 | 0.2643 | 111.1 | 1.79 | 0.0755 |
| mon: 6 | 0.4596 | 0.2672 | 111 | 1.72 | 0.0882 |
| mon: 7 | 0.4828 | 0.2655 | 110.9 | 1.82 | 0.0717 |
| mon: 8 | 0.5172 | 0.2650 | 110.6 | 1.95 | 0.0535 |
| mon: 9 | 0.1066 | 0.3034 | 106.6 | 0.35 | 0.7260 |
| mon: 10 | 0.2423 | 0.3154 | 113.5 | 0.77 | 0.4439 |
| mon: 11 | 0.3637 | 0.2664 | 85.8 | 1.37 | 0.1758 |
| mon: 12 | 0 | . | . | . | . |
| log(exposure) | 1.0642 | 2.7779 | 89.15 | 0.38 | 0.7026 |
References
- UN. World Urbanization Prospects: The 2018 Revision (ST/ESA/SER.A/420); Department of Economic and Social Affairs, Population Division; United Nations: New York, NY, USA, 2018. [Google Scholar]
- OECD. Managing Urban Traffic Congestion; European Conference of Ministers of Transport; Organisation for Economic Co-operation and Development (OECD): Paris, France, 2007. [Google Scholar]
- Parsons Brinckerhoff. Managed Lanes Preliminary Feasibility Assessment; Nashville Area Metropolitan Planning Organisation: Nashville, TN, USA, 2015. [Google Scholar]
- NCHRP. Guidelines for Implementing Managed Lanes; NCHRP Report 835; National Cooperative Highway Program (NCHRP): Washington, DC, USA, 2016. [Google Scholar]
- Schijns, S.; Eng, P. High occupancy vehicle lanes–worldwide lessons for European practitioners. WIT Trans. Built Environ. 2006, 89, 181–193. [Google Scholar]
- Javid, R.J.; Xie, J.; Wang, L.; Yang, W.; Javid, R.J.; Salari, M. High-Occupancy Vehicle (HOV) and High-Occupancy Toll (HOT) Lanes. In International Encyclopedia of Transportation; Elsevier: Amsterdam, The Netherlands, 2021. [Google Scholar] [CrossRef]
- Dixon, C.; Alexander, K. Literature Review of HOV Lane Schemes; Issue 2; Unpublished Project Report UPR/T/002/05; Transport Research Laboratory: Crowthorne, UK, 2005. [Google Scholar]
- FHWA. Managed Lane Chapter for the Freeway Management and Operations Handbook; Federal Highway Administration (FHWA): Washington, DC, USA, 2011.
- Caltrans. High-Occupancy Vehicle Guidelines for Planning, Design and Operations; California State Transportation Agency: Sacramento, CA, USA, 2020.
- Department of Transport and Main Roads. Manual—Traffic and Road Use Management; Department of Transport and Main Roads: Brisbane, QLD, Australia, 2019.
- MOT. Strategic Program for Public Transport Development; Ministry of Transport: Jerusalem, Israel, 2012.
- MOT. Guidelines for Planning HOV Lanes; Infrastructure Planning and Development Administration; Ministry of Transport: Jerusalem, Israel, 2019.
- Hakkert, S. Literature Survey. Appendix in Guidelines for Planning HOV Lanes; Infrastructure Planning and Development Administration; Ministry of Transport: Jerusalem, Israel, 2019.
- AASHTO. Guide for High-Occupancy Vehicle (HOV) Facilities; Publication Code GHOV-3; American Association of State Highway and Transportation Officials (AASHTO): Washington, DC, USA, 2004. [Google Scholar]
- Bauer, J.; McKellar, C.; Bunker, J.; Wikman, J. HOV Lanes: An overall evaluation including Brisbane case studies. In Proceedings of the 2005 AITPM National Conference, Brisbane, Australia, 27–29 July 2005. [Google Scholar]
- Gitelman, V.; Hakkert, S. HOV Lanes on Road No 2: An Examination of Impacts on Traffic; Ministry of Transport: Jerusalem, Israel, 2020.
- Laureshyn, A.; Svensson, A.; Hyden, C. Evaluation of traffic safety, based on micro-level behavioural data: Theoretical framework and first implementation. Accid. Anal. Prev. 2010, 42, 1637–1646. [Google Scholar] [CrossRef] [PubMed]
- Arun, A.; Haque, M.M.; Bhaskar, A.; Washington, S.; Sayed, T. A systematic mapping review of surrogate safety assessment using traffic conflict techniques. Accid. Anal. Prev. 2021, 153, 106016. [Google Scholar] [CrossRef]
- Li, Z.; Wang, W.; Liu, P.; Bai, L.; Du, M. Analysis of Crash Risks by Collision Type at Freeway Diverge Area Using Multivariate Modeling Technique. J. Transp. Eng. 2015, 141, 04015002. [Google Scholar] [CrossRef]
- Gu, X.; Abdel-Aty, M.; Xiang, Q.; Cai, Q.; Yuan, J. Utilizing UAV video data for in-depth analysis of drivers’ crash risk at interchange merging areas. Accid. Anal. Prev. 2019, 123, 159–169. [Google Scholar] [CrossRef]
- Cooner, S.A.; Ranft, S.E. Safety evaluation of buffer-separated high-occupancy vehicle lanes in Texas. Transp. Res. Rec. 2006, 1959, 168–177. [Google Scholar] [CrossRef]
- Pearce, C.; Stanek, D. Contiguous HOV lane safety: A before and after comparison of accident rates. In Proceedings of the TRB Annual Meeting 2007, Washington, DC, USA, 21–27 January 2007. [Google Scholar]
- Elvik, R.; Hoye, A.; Vaa, T.; Sorensen, M. The Handbook of Road Safety Measures, 2nd ed.; Emerald: Bingley, UK, 2009. [Google Scholar]
- European Parliament; Council of the European Union. RISM Directive 2019/1936 of the European Parliament and of the Council of 23 October 2019 amending Directive 2008/96/EC on road infrastructure safety management (RISM). Off. J. Eur. Union L 2019, 305, 1–16. [Google Scholar]
- Cooper, H.M. Integrating Research: A Guide for Literature Reviews; SAGE Publications: Newbury Park, CA, USA, 1989. [Google Scholar]
- Moher, D.; Liberati, A.; Tetzlaff, J.; Altman, D.G. Preferred Reporting Items for Systematic Reviews and Meta-Analyses: The PRISMA Statement. PLoS Med. 2019, 6, e1000097. [Google Scholar]
- Boglietti, S.; Barabino, B.; Maternini, G. Survey on e-Powered Micro Personal Mobility Vehicles: Exploring Current Issues towards Future Developments. Sustainability 2021, 13, 3692. [Google Scholar] [CrossRef]
- Sohrabi, S.; Khodadadi, A.; Mousavi, S.M.; Dadashova, B.; Lord, D. Quantifying the automated vehicle safety performance: A scoping review of the literature, evaluation of methods, and directions for future research. Accid. Anal. Prev. 2021, 152, 106003. [Google Scholar] [CrossRef]
- Martensen, H.; Diependaele, K.; Daniels, S.; Van den Berghe, W.; Papadimitriou, E.; Yannis, G.; Van Schagen, I.; Weijermars, W.; Wijnen, W.; Filtness, A.; et al. The European road safety decision support system on risks and measures. Accid. Anal. Prev. 2019, 125, 344–351. [Google Scholar] [CrossRef]
- DSS European Road Safety Decision Support System. 2022. Available online: www.roadsafety-dss.eu (accessed on 3 April 2022).
- Hughes, W.E.; Jagannathan, R.; Qi, M.; Ghanta, N. Safety Impacts of New Traffic Management Techniques; Report, by Vanasse Hangen Brustlin Inc.; Office of the Secretary of Transportation, US DOT: Washington, DC, USA, 2011.
- Li, C.; Karimi, M.; Alecsandru, C. Microscopic Simulation-Based High Occupancy Vehicle Lane Safety and Operation Assessment: A Case Study. J. Adv. Transp. 2018, 2018, 5262514. [Google Scholar] [CrossRef]
- Fitzpatrick, K.; Brewer, M.; Park, E. Intermediate Access to Buffer-Separated Managed Lanes; Transportation Research Record 2065, 18–26; Transportation Research Board: Washington, DC, USA, 2008.
- Skowronek, D.; Ranft, S.; Cothron, A. An Evaluation of Dallas Area HOV Lanes, 53 Year 2002; Texas Transportation Institute: College Station, TX, USA, 2002; Volume 4961, No. 2. [Google Scholar]
- Cothron, A.S.; Ranft, S.E.; Walters, C.H.; Fenno, D.W.; Lord, D. Crash Analysis of Selected High-Occupancy Vehicle Facilities in Texas: Methodology, Findings, and Recommendations; Report FHWA/TX-04/0-4434-1; Texas Transportation Institute: College Station, TX, USA; Austin, TX, USA, 2004. [Google Scholar]
- Martin, P.; Lahon, D.; Stevanovic, A. High Occupancy Vehicle Lanes Evaluation II: Traffic Impact, Safety Assessment, and Public Acceptance; Report No. UT-04.13; University of Utah: Salt Lake City, UT, USA, 2004. [Google Scholar]
- Bauer, K.; Harwood, D.; Hughes, W.; Richard, K. Safety Effects of Narrow Lanes and Shoulder-Use Lanes to Increase Capacity of Urban Freeways. Transp. Res. Rec. 2004, 1897, 71–80. [Google Scholar] [CrossRef]
- Lee, J.-T.; Dittbemer, R.; Sripathi, H. Safety impacts of freeway managed-lane strategy inside lane for high-occupancy vehicle use and right shoulder lane as travel lane during peak periods. Transp. Res. Rec. 2007, 2012, 113–120. [Google Scholar] [CrossRef]
- Chung, K.; Chan, C.-Y.; Jang, K.; Ragland, D.R.; Kim, Y.-H. HOV Lane Configurations and Collision Distribution on Freeway Lanes—An Investigation of Historial Collision Data in California. In Proceedings of the TRB 2007 Annual Meeting CD-ROM, Washington, DC, USA, 21–25 January 2007. [Google Scholar]
- Jang, K.; Chung, K.; Ragland, D.R.; Chan, C.-Y. Safety Performance of High-Occupancy Vehicle (HOV) Facilities: Evaluation of HOV Lane Configurations in California. In Proceedings of the TRB 2009 Annual Meeting CD-ROM, Washington, DC, USA, 11–15 January 2009. [Google Scholar]
- Jang, K.; Ragland, D.R.; Chan, C.-Y. A Comparative Safety Study of Limited versus Continuous Access High Occupancy Vehicle (HOV) Facilities; California PATH Research Report UCB-ITS-PRR-2009-22; University of California: Berkeley, CA, USA, 2009. [Google Scholar]
- Cao, X.J.; Xu, Z.; Huang, A.Y. Safety Benefits of Converting HOV Lanes to HOT Lanes: Case Study of the I-394 MnPASS. ITE J. 2012, 82, 32–37. [Google Scholar]
- Jang, K.; Kang, S.; Seo, J.; Chan, C.-Y. Cross-section designs for the safety performance of buffer-separated high-occupancy vehicle lanes. J. Transp. Eng. 2013, 139, 247–254. [Google Scholar] [CrossRef]
- Colwill, M. Moving (More) people safely: Examining the safety impacts of HOV lanes. In Proceedings of the Transportation Association of Canada Conference and Exhibition: Past, Present, Future, ATC 2014, Montreal, QC, Canada, September 28–1 October 2014. [Google Scholar]
- Srinivasan, S.; Haas, P.; Alluri, P.; Gan, A.; Bonneson, J. Crash Prediction Method for Freeway Facilities with High Occupancy Vehicle (HOV) and High Occupancy Toll (HOT) Lanes; FDOT Contract BDV32-977-04; University of Florida: Gainesville, FL, USA, 2015. [Google Scholar]
- Kim, K.; Park, B.-J. Safety features of freeway weaving segments with a buffer-separated high-occupancy-vehicle (HOV) lane. Int. J. Inj. Control Saf. Promot. 2018, 25, 284–292. [Google Scholar] [CrossRef]
- Lee, J.; Abdel-Aty, M.; Nyame-Baafi, E. Investigating the Effects of Pavement Roughness on Freeway Safety using Data from Five States. Transp. Res. Rec. 2020, 2674, 127–134. [Google Scholar] [CrossRef]
- Yuan, J.; Abdel-Aty, M.; Fu, J.; Wu, Y.; Yue, L.; Eluru, N. Developing safety performance functions for freeways at different aggregation levels using multi-state microscopic traffic detector data. Accid. Anal. Prev. 2021, 151, 105984. [Google Scholar] [CrossRef]
- Himes, S.; Bonneson, J.S.; Gayah, V.; Liu, C. Safety Prediction Method for Freeway Facilities with High-Occupancy Lanes. Transp. Res. Board 2022, 2676, 501–513. [Google Scholar] [CrossRef]
- Gupta, M.; Pawar, N.M.; Velaga, N.R. Impact of lockdown and change in mobility patterns on road fatalities during COVID-19 pandemic. Transp. Lett. 2021, 13, 447–460. [Google Scholar] [CrossRef]
- CBS. Vehicle-Kilometers Travelled 2020; Publication 1855; Central Bureau of Statistics: Jerusalem, Israel, 2022.
- Gitelman, V.; Doveh, E.; Carmel, R.; Hakkert, S. The influence of shoulder characteristics on the safety level of two-lane roads: A case-study. Accid. Anal. Prev. 2019, 122, 108–118. [Google Scholar] [CrossRef]
- Gitelman, V.; Doveh, E. A Comparative Evaluation of the Safety Performance of Median Barriers on Rural Highways; A Case-Study. In Advances in Road Infrastructure and Mobility. IRF 2021. Sustainable Civil Infrastructures; Springer: Cham, Switzerland, 2022. [Google Scholar] [CrossRef]
- Statistical Analysis Software. SAS/STAT 9.4 User’s Guide; SAS Institute: Cary, NC, USA, 2022. [Google Scholar]
- Zheng, B. Summarizing the goodness of fit of generalized linear models for longitudinal data. Stat. Med. 2000, 19, 1265–1275. [Google Scholar] [CrossRef]
- Nakagawa, S.; Schielzeth, H. A general and simple method for obtaining R2 from generalized linear mixed-effects models. Methods Ecol. Evol. 2013, 4, 133–142. [Google Scholar] [CrossRef]
- Masiano, S.; Dunga, S.; Tembo, T.; Pfaff, C.; Cox, C.; Robert, B.; Ahmed, S.; Kim, M. Implementing remote supervision to improve HIV service delivery in rural Malawi. J. Glob. Health Rep. 2020, 4, e2020081. [Google Scholar] [CrossRef]
- Ukert, B.; Andreyeva, E.; Branas, C.C. Time series robustness checks to test the effects of the 1996 Australian firearm law on cause-specific mortality. J. Exp. Criminol. 2017, 14, 141–154. [Google Scholar] [CrossRef]
- Gürbüz, H.; Buyruk, S. Improvement of safe stopping distance and accident risk coefficient based on active driver sight field on real road conditions. IET Intell. Transp. Syst. 2019, 13, 1843–1850. [Google Scholar] [CrossRef]
| Source | Country, Area | Measures’ Description—HOV Lanes | Road Class, Sites | Crash Data Periods | Study Design | Other Road/Traffic Features Considered | Main Findings |
|---|---|---|---|---|---|---|---|
| Skowronek et al. (2002) [34] | Texas, USA | Left, buffer- separated and barrier-separated | Three freeway corridors of 6–8 mi each | FI crash data for 3–5 years in before and after periods | BA comparison of crash rates *; comparison with critical crash rates for similar corridors | --** |
|
| Cothron et al. (2004) [35] | Texas, USA | Left contraflow, separated with a moveable barrier | Freeway corridor, 5.6 mi | Injury crash data for 6–9 years in each period | BA comparison of crash rates * | -- |
|
| Cooner, Ranft (2006) [21]; Cothron et al. (2004) [35] | Texas, USA | On the left shoulder, with a painted buffer | Two freeway corridors of 6–7 mi each | Injury crash data for 4–5 years in each period, by severity; police crash reports (1150) | BA comparison of crash rates *; descriptive statistics of police reports | Buffer width, shoulder presence, lane width, speed differential between HOV and GP lanes |
|
| Martin et al. (2004) [36] | Utah, USA | Left, with a painted separation | Freeway, 16 mi | 2.5-year crash records, in after period | Descriptive statistics * | -- |
|
| Bauer et al. (2004) [37] | California, USA | The inside shoulder converted to an HOV lane, with painted separation; other lanes reduced in width | Urban freeways, 490 sites, 247.6 mi in total | 2-year before, 7-year after crashes | BA evaluation, with EB | -- |
|
| Lee et al. (2007) [38] | Virginia, USA | Left, no separation, and use of right shoulders as GP lanes in peak hours | Urban freeway, 6.5 mi | 3-year crash data | NB regression models for the daily number of crashes | AADT, adverse weather, adverse light conditions |
|
| Chung et al. (2007) [39] | California, USA | Left, buffer-separated and with continuous access | Eight freeway corridors, 78 mi in total | 10-year crash data | Descriptive statistics–crash patterns | -- |
|
| Jang et al. (2009a) [40]; Jang et al. (2009b) [41] | California, USA | Left, with and without painted separation | Eight freeway corridors, 92 mi in total | 5-year crash data during peak hours | Descriptive statistics; cross-section comparison | Shoulder width, length of access, the proximity of access to neighboring ramps |
|
| Cao et al. (2012) [42] | Minnesota, USA | Conversion of HOV to HOT lanes with adding access points; left reversible lanes, with painted separation | Urban freeway, 239 road segments | 4-year before, 2-year after crashes | BA evaluation, with fitting SPF | AADT, number of ramps |
|
| Jang et al. (2013) [43] | California, USA | Left, buffer-separated | Freeways: 13 routes, 246 km | 3-year data on collisions on HOV and adjacent lanes | NB regression models for PDO and injury crashes | Lane and shoulder widths, buffer width, AADT |
|
| Colwill (2014) [44] | Canada, Toronto and Hamilton area | Left, buffered, limited-access | Two freeways, each with six interchanges and 2–3 sections, examined | Several years before and after HOV lanes’ operation (not specified) | BA evaluation; crash trends’ analysis for FI and PDO crashes | -- |
|
| Srinivasan et al. (2015) [45] | USA, three States | Left, separated by painted stripes or buffer (HOV) or by buffer with flexible poles (HOT) | Urban freeway segments with HOV lanes (491 mi) or HOT lanes (27 mi) | 5-year crash data, FI and PDO, for HOV segments; 4-year crash data for HOT segments | NB regression models for FI and total crashes, with 6, 8, 10 or 12 total lanes for HOV segments and various lane numbers for HOT segments | AADT, lanes’ number, left-shoulder-width, painted strip vs. buffer widths |
|
| Kim, Park (2018) [46] | California, USA | Left, buffer-separated: weaving segments | Freeways: 59 sites–weaving zones, with and without HOV lanes’ access points | 3-year crash data | Descriptive analysis; explanatory models | Presence of HOV lanes’ access points, length, lanes’ number, AADT, lane occupancy and speed |
|
| Lee et al. (2020) [47] | USA, five States | n/a | Freeways, urban and rural; 46,955 road units | 1-year data | NB regression models for total crashes and rear-end, sideswipe, single-vehicle crash types | AADT, share of trucks, lanes’ number, median and shoulder width, pavement roughness index, speed limit, area type |
|
| Yuan et al. (2021) [48] | USA, three States | Mostly, left | 11 freeways, urban and rural: 2050 mi in total | 2-year crash and traffic data | NB regression models for total crashes | Various levels of aggregation for traffic data and speed, number of lanes, speed limit |
|
| Himes et al. (2022) [49] | USA, California and Washington | Left, HOV (or HOT) lanes, with various types of access and separation from GP lanes | Freeways, urban and rural: 543 mi in total | 5-year data | NB regression models for total crashes and multiple-vehicle crashes (in one travel direction) | AADT, speed, lanes’ number, shoulder and lane widths, distances from ramps and access points, curvature, HOV lane access type and separation type, median and outside barriers’ presence |
|
| Road Group | Road # | Study Sections—Between Interchanges | Length, km | Number of Interchanges in the Study Sections |
|---|---|---|---|---|
| Treatment (T), with HOV lanes | 2 | Netania–Glilot | 21.9 | 8 |
| Comparison (C1) | 1 | Kibbutz Galuiot–Ben Shemen | 18.9 | 6 |
| Comparison (C2) | 4 | Ashdod–Dror | 53.6 | 21 |
| Variable | Values | Meaning |
|---|---|---|
| I(type(j)) | 0, 1 | indicator of belonging to the treatment- or comparison-group road, where type: T, C1 or C2 |
| I_after | 0, 1 | indicator of belonging to the study period: 1 for after, 0 for before period |
| time | 1…33, 35…48 | number of observation indicates a general over-time trend |
| time2 | 0, 1–13 | number of observation since the intervention point (HOV lanes’ operation) indicates a change in trend in the after-period |
| I_Lock1 | 0, 1 | indicator of belonging to the first lockdown months |
| I_Lock2 | 0, 1 | indicator of belonging to the second lockdown months |
| I(mon(j)) | 0, 1 | indicates a month of the year (seasonal effect), where mon: 1–12 |
| log(exposure) | 4 numeric values | indicator of traffic exposure per year |
| offset | numeric values | Estimated as log(days per month × length in km)—for section accidents; log(days per month × number of intersections)—for junction accidents |
| No. | Time-Series Code | Accident Data File * | Accident Sites ** | Accident Type | Treatment Sites T | Comparison Sites C1 | Comparison Sites C2 | |||
|---|---|---|---|---|---|---|---|---|---|---|
| Before | After | Before | After | Before | After | |||||
| 1 | 11 | TD | Sections | Total | 64 | 20 | 74 | 19 | 259 | 80 |
| 2 | 12 | TD | Sections | Fatal + serious | 16 | 8 | 25 | 6 | 76 | 32 |
| 3 | 13 | TD | Sections | Vehicle collisions | 45 | 17 | 47 | 13 | 190 | 57 |
| 4 | 14 | TD | Sections | Daytime | 50 | 16 | 55 | 14 | 196 | 55 |
| 5 | 15 | TD | Sections | Nighttime | 14 | 4 | 19 | 5 | 63 | 25 |
| 6 | 16 | TD | Sections | with MTC | 15 | 10 | 30 | 8 | 105 | 31 |
| 7 | 21 | TD | Junctions | Total | 33 | 14 | 43 | 16 | 111 | 53 |
| 8 | 22 | TD | Junctions | Daytime | 21 | 12 | 31 | 13 | 73 | 36 |
| 9 | 23 | TD | Junctions | Nighttime | 12 | 2 | 12 | 3 | 38 | 17 |
| 10 | 31 | general | Sections | Total | 675 | 151 | 320 | 88 | 1284 | 367 |
| 11 | 32 | general | Sections | Daytime | 575 | 131 | 282 | 73 | 1095 | 317 |
| 12 | 33 | general | Sections | Nighttime | 100 | 20 | 38 | 15 | 189 | 50 |
| 13 | 34 | general | Sections | with bus | 23 | 5 | 11 | 3 | 45 | 11 |
| 14 | 35 | general | Sections | with MTC | 59 | 19 | 34 | 12 | 170 | 44 |
| 15 | 41 | general | Junctions | Total | 66 | 28 | 218 | 106 | 479 | 238 |
| 16 | 42 | general | Junctions | Daytime | 50 | 26 | 194 | 93 | 422 | 202 |
| 17 | 43 | general | Junctions | Nighttime | 16 | 2 | 24 | 13 | 57 | 36 |
| Ratio | Estimate | 95% Confidence Interval | p-Value | |
|---|---|---|---|---|
| Ratio T | 1.44 | 0.41 | 5.03 | 0.56 |
| Ratio C1 | 1.10 | 0.33 | 3.70 | 0.87 |
| Ratio C2 | 1.03 | 0.41 | 2.61 | 0.95 |
| Odds Ratio: Treatment vs. C1 | 1.31 | 0.35 | 4.90 | 0.68 |
| Odds Ratio: Treatment vs. C2 | 1.41 | 0.49 | 4.07 | 0.52 |
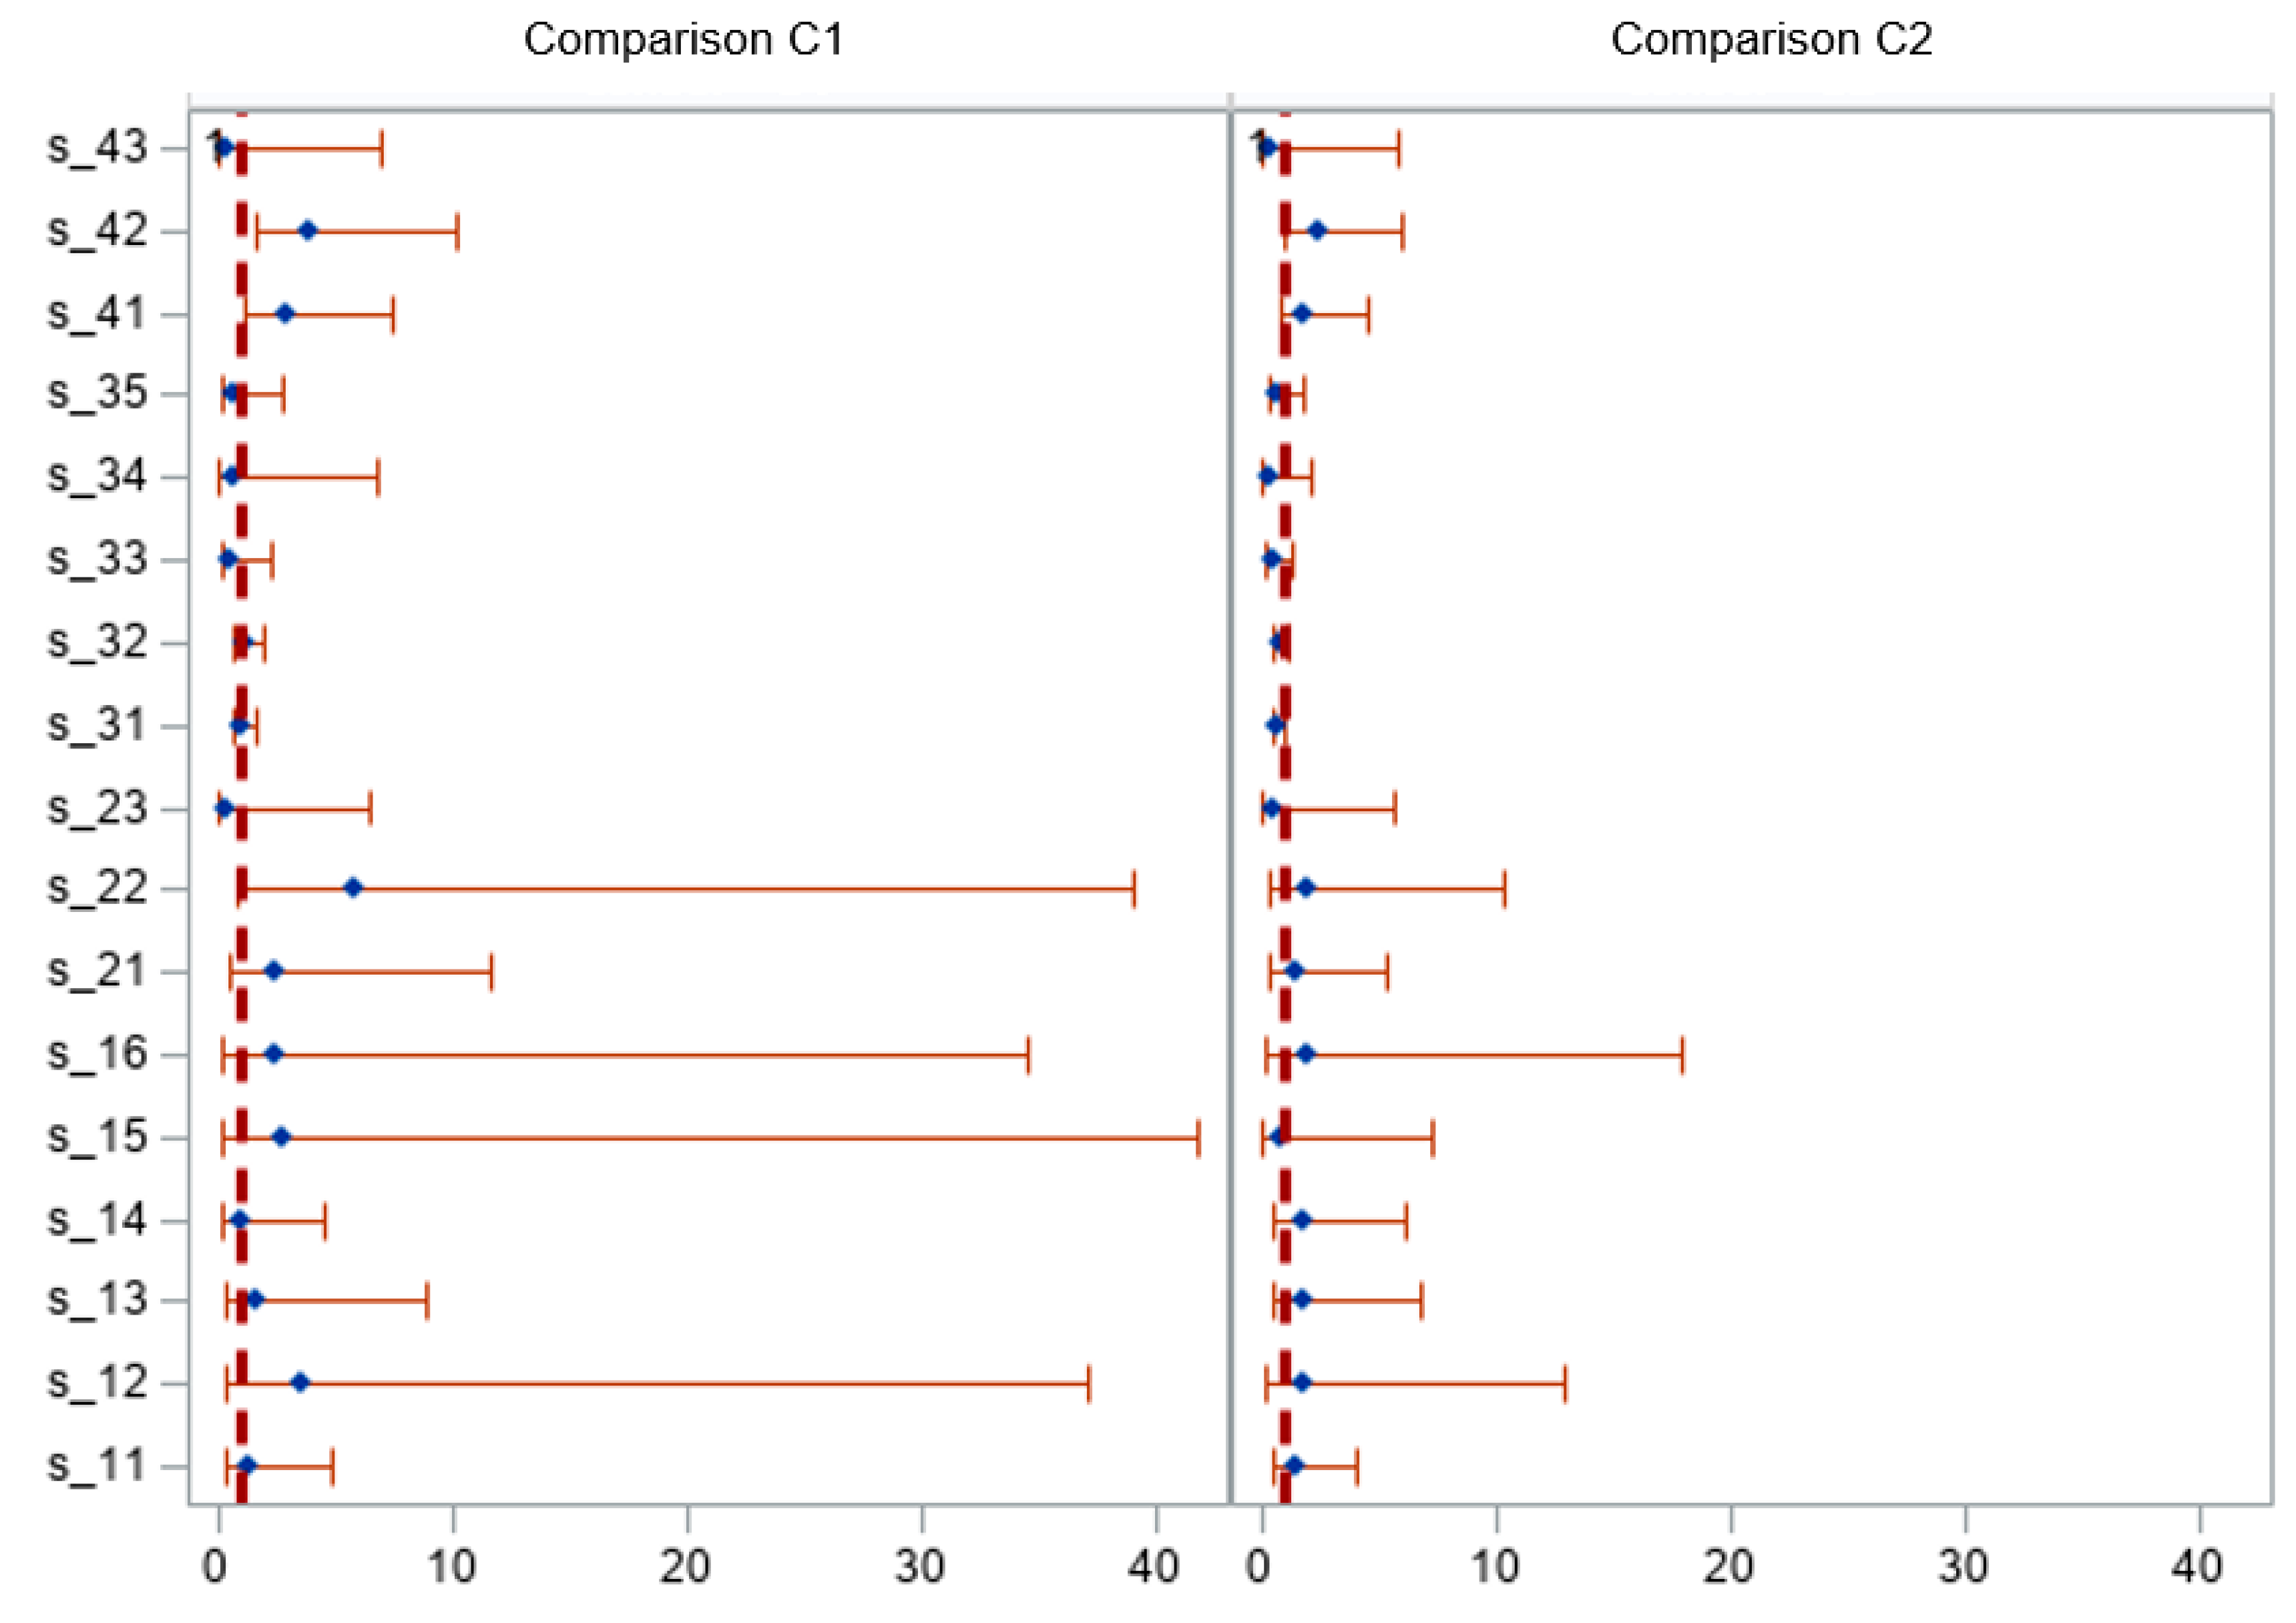
| No. | Comparison-Group | Series * | p-Value | OR Estimate | 95% Confidence Interval | Comparison-Group | p-Value | OR Estimate | 95% Confidence Interval | ||
|---|---|---|---|---|---|---|---|---|---|---|---|
| 1 | C1 | 11 | 0.680 | 1.31 | 0.35 | 4.90 | C2 | 0.519 | 1.41 | 0.49 | 4.07 |
| 2 | C1 | 12 | 0.292 | 3.48 | 0.33 | 37.02 | C2 | 0.559 | 1.78 | 0.25 | 12.84 |
| 3 | C1 | 13 | 0.528 | 1.68 | 0.32 | 8.94 | C2 | 0.441 | 1.70 | 0.43 | 6.77 |
| 4 | C1 | 14 | 0.950 | 0.95 | 0.20 | 4.55 | C2 | 0.375 | 1.75 | 0.50 | 6.18 |
| 5 | C1 | 15 | 0.450 | 2.76 | 0.18 | 41.73 | C2 | 0.781 | 0.73 | 0.07 | 7.22 |
| 6 | C1 | 16 | 0.500 | 2.43 | 0.17 | 34.45 | C2 | 0.577 | 1.87 | 0.19 | 17.87 |
| 7 | C1 | 21 | 0.233 | 2.50 | 0.54 | 11.54 | C2 | 0.581 | 1.44 | 0.38 | 5.40 |
| 8 | C1 | 22 | 0.066 | 5.88 | 0.89 | 39.06 | C2 | 0.442 | 1.91 | 0.35 | 10.39 |
| 9 | C1 | 23 | 0.441 | 0.31 | 0.01 | 6.40 | C2 | 0.627 | 0.57 | 0.06 | 5.71 |
| 10 | C1 | 31 | 0.963 | 1.01 | 0.61 | 1.67 | C2 | 0.080 | 0.73 | 0.51 | 1.04 |
| 11 | C1 | 32 | 0.642 | 1.13 | 0.67 | 1.89 | C2 | 0.150 | 0.76 | 0.53 | 1.11 |
| 12 | C1 | 33 | 0.393 | 0.56 | 0.14 | 2.19 | C2 | 0.156 | 0.52 | 0.20 | 1.30 |
| 13 | C1 | 34 | 0.734 | 0.67 | 0.07 | 6.82 | C2 | 0.230 | 0.33 | 0.05 | 2.04 |
| 14 | C1 | 35 | 0.587 | 0.69 | 0.18 | 2.67 | C2 | 0.420 | 0.68 | 0.26 | 1.77 |
| 15 | C1 | 41 | 0.022 | 2.96 | 1.18 | 7.41 | C2 | 0.174 | 1.83 | 0.75 | 4.45 |
| 16 | C1 | 42 | 0.006 | 3.94 | 1.54 | 10.11 | C2 | 0.057 | 2.42 | 0.97 | 6.03 |
| 17 | C1 | 43 | 0.411 | 0.26 | 0.01 | 6.97 | C2 | 0.401 | 0.28 | 0.01 | 5.87 |
Disclaimer/Publisher’s Note: The statements, opinions and data contained in all publications are solely those of the individual author(s) and contributor(s) and not of MDPI and/or the editor(s). MDPI and/or the editor(s) disclaim responsibility for any injury to people or property resulting from any ideas, methods, instructions or products referred to in the content. |
© 2023 by the authors. Licensee MDPI, Basel, Switzerland. This article is an open access article distributed under the terms and conditions of the Creative Commons Attribution (CC BY) license (https://creativecommons.org/licenses/by/4.0/).
Share and Cite
Gitelman, V.; Doveh, E. Examining the Safety Impacts of High-Occupancy Vehicle Lanes: International Experience and an Evaluation of First Operation in Israel. Sustainability 2023, 15, 13976. https://doi.org/10.3390/su151813976
Gitelman V, Doveh E. Examining the Safety Impacts of High-Occupancy Vehicle Lanes: International Experience and an Evaluation of First Operation in Israel. Sustainability. 2023; 15(18):13976. https://doi.org/10.3390/su151813976
Chicago/Turabian StyleGitelman, Victoria, and Etti Doveh. 2023. "Examining the Safety Impacts of High-Occupancy Vehicle Lanes: International Experience and an Evaluation of First Operation in Israel" Sustainability 15, no. 18: 13976. https://doi.org/10.3390/su151813976
APA StyleGitelman, V., & Doveh, E. (2023). Examining the Safety Impacts of High-Occupancy Vehicle Lanes: International Experience and an Evaluation of First Operation in Israel. Sustainability, 15(18), 13976. https://doi.org/10.3390/su151813976