Article

Multicriteria Quantification of the Compatibility of the Targets from Romania’s Relevant Strategies with the European Green Deal

1
Energy Engineering Department, University of Oradea, 410087 Oradea, Romania
2
Doctoral School of Engineering Sciences, University of Oradea, 410087 Oradea, Romania
*
Author to whom correspondence should be addressed.
Sustainability 2023, 15(18), 13386; https://doi.org/10.3390/su151813386
Submission received: 14 June 2023 / Revised: 28 July 2023 / Accepted: 22 August 2023 / Published: 7 September 2023
(This article belongs to the Special Issue Advances in Sustainability Research from the University of Oradea)

Abstract

:
This study deepens and further concretizes an analysis conducted in a prior study highlighting Romania’s goals and objectives in comparison with the sustainable development principles established through the adoption of the European Green Deal (EGD) at the European Union (EU) level. The second section of this paper presents this study’s methodology, aiming to highlight the quantification of the compatibility of the targets of Romania’s pertinent strategies with the EGD after evoking the principles of sustainable development (SD) and—in this context—the importance of achieving the objectives set by the EGD. The third section of this paper presents our findings, and the final section offers conclusions drawn from our analysis.

1. Introduction

This paper expands upon the authors’ previous concerns regarding the analysis of the relevant development strategies of Romania (RDSR) to indicate the degree to which they include the principles of SD and their compatibility with the strategies of the EU in this domain, that is, mainly with respect to the EGD.
In this context, we consider it useful to reiterate the statement made by Felea and Felea [1], according to which the full integration of Romania into the EU implies much more prompt reactions in terms of the compatibility of national policies and strategies with those of the community. The most important direction of compatibility concerns the way in which society develops in general and with respect to the economy. Sustainable development is a well-known concept that has been implemented at the EU level since the 1990s [2,3,4,5,6,7].
The publication of Brundtland’s “Our Common Future” report in 1987 (under the auspices of the United Nations [3]) yielded the first definition of sustainability: “sustainable development is development that aims to satisfy the needs of the present without jeopardizing future generations’ ability to satisfy their own needs.” We cannot discuss sustainable development without harmonizing the three pillars that underpin it. As a result, sustainable development arises where the three principles intersect (Figure 1).
Each of the three components of sustainable development presented in Figure 1 includes a series of objectives (Figure 2). Next, we will summarize the objectives of the economic, social, and ecological systems as they are described by the economist M. Munasinghe in his work published in 1993 [8].
The way the concept of sustainable development is structured—the three pillars—but also the objectives generated by each pillar make this concept very complex, generating many opinions about how it can be implemented considering the constraints arising from both the social and environmental domains with respect to the economic area. This concept is detailed in Felea’s work [9], where a set of related indicators can also be found.
Establishing a set of SD indicators is currently a major concern at the EU and member-state levels, as evidenced by many documents developed at the EU level, such as the document published by Bubbico and Djkstra [10] on the social aspects of SD. As a result, the European Commission created a set of SD indicators [11] that have been broken down into three tiers and concentrate on ten actual key societal issues.
Consequently, based on the European model, a three-level national system of SD indicators was created. It is in accordance with the EU’s system of indicators, which is managed by the National Institute of Statistics. Based on this set of indicators, the National Institute of Statistics performs multilevel periodic evaluations of Romania, often via comparison with the EU. Notably, the analysis we carry out in this paper cannot be found in the National Institute of Statistics or Eurostat reports; thus, this paper provides greater depth with regard to the way in which the concept of SD is structured. Effectiveness and sustainable development have multiple links and mutual conceptual and operational interactions, and these links and interactions relate to current concepts as well. When analyzing the relationship between the two concepts, i.e., sustainable development and competitiveness, we must start with how the concept of sustainability is structured, namely, the fact that it is supported by three pillars: economic, social, and environmental pillars. One of the most relevant questions that can be asked is related to the order of priority of the three pillars. It is almost obvious that the economic pillar is the main element of the concept, considering its effects on human life. After careful consideration, we can conclude that the effects of the economic pillar, which lead to an increase in standards of living and economic development, are incompatible with the ability to achieve the desired goals of the other two pillars: social inclusion and environmental protection. The goal of shaping socioeconomic processes based on the values promoted by the EU finds its expression in the social model: “People represent the most important asset of Europe and must be the central point of the policies of the Union”; this objective has been in place since 2000 in the Lisbon Strategy [12]. Consequently, the interdependent relationship between economic competitiveness, a pillar, and sustainable development, a comprehensive and broad concept, is essential. The necessary analysis for establishing the hierarchy in which the three pillars of sustainable development are positioned must start with this relationship. If this order is not achieved by starting with the environmental and social pillars, the concept of sustainability risks remaining in the idea phase. When focusing on the economic aspect and considering it as the primordial aspect, it is impossible to comprehensively account for the other two pillars, which are only mentioned at a theoretical level in future strategies out of a desire to keep concerns related to appearance at the level perceived through the concept of SD, as also revealed in the article published by Felea in 2015 [13].
The most relevant EU development strategies [12,14,15,16,17,18] from the last 30 years positioned SD in the foreground, constantly adapting to the development stage and the objective restrictions identified at community and international levels. Humanity has become aware, especially in the last 10 years, of the primary importance of the impact of economic processes on climate change, for which the sustainable development strategies (SDSs) have introduced appropriate restrictions. The effects of climate change are well known [19,20]: extreme weather conditions, melting of glaciers, rising sea levels, ocean acidification, and depletion of biodiversity. In order to limit global warming to an acceptable threshold from the point of view of the Intergovernmental Panel on Climate Change, i.e., to 1.5 °C, from this group of specialists’ viewpoints, it is essential that humanity reaches CO2 emission neutrality by 2050.
The Paris Agreement on Climate Change [21], signed by 195 countries and the EU, establishes this vital objective for humanity. Concerns are focused on the greenhouse gas (GHG) with the largest share (81% of total GHG), namely CO2. According to the Sixth Assessment Report of the Intergovernmental Panel on Climate Change (IPCC) [22], other GHGs that matter in terms of environmental impact and SD and that are emitted as a result of human activities are methane (11%), nitrous oxide (5%), and hydrocarbons (2%).

2. Literature Review

The specialized literature is increasingly rich in theses, reports, and scientific works that deal with the important and broad theme of SD, in various specific directions. For example, the prestigious MDPI database currently comprises 421 journals, out of which at least 16 dedicate many works to SD, the most relevant being Sustainability, Energies, Climate, Economies, Ecologies, Clean Technologies, Environments, Hydrogen, Smart Cities, Waste, and Water. In terms of the subject treated in this paper, in this framework, we evoke some works with particular relevance for the subject assumed by us.
Thus, in [23], it is emphasized that, since there are no regulations on climate change at the macroregional level, currently, each region in the EU adopts its own climate strategies, avoiding macroregional and global effects. The author campaigns for the integration of regional strategies in European SD strategies. It is concluded that the regulations and mechanisms applied at the regional and monosectoral levels must be assumed and integrated into the European sustainability strategies. At present, it is admitted that for the operationalization of SD principles, the key factor is the transformation of energy processes to become much cleaner compared with those currently in use. In this respect, hydrogen is considered an energy agent with a great perspective. Thus, political factors and specialists see hydrogen as a carrier of energy to allow the decarbonization of sectors that are difficult to reduce.
In 2003, Dillman and Heinonen [24] approached the issue of hydrogen-synthesizing technologies on a less optimistic note, based on currently accessible energy development models, concluding that a “safe” value for GHG emissions by 2050 would be equivalent to the cumulative consumption of 8–12% of the remaining carbon budget. According to the authors of this paper, the excessive use of green hydrogen involves large amounts of energy from renewable sources, which can have a negative impact on the consumption of material and energy resources.
Van der Spek et al. [25] discussed the anticipated function of hydrogen in the energy transition and pointed out that a unique dynamic has been observed over time in this context. As a result, whereas previously hydrogen and/or electricity production (ElE) were primarily thought of as clean fuels for automobiles, the main interest now stems from hydrogen’s versatility in easing the transition to CO2 neutrality, where addressing emissions from intricate industrial processes is of the utmost importance. The authors argue for a robust strategy to enable the hydrogen economy.
The key to decarbonization and the operationalization of the crucial goal of “net zero emissions” is the production of the energy types that mankind now consumes, namely electrical, thermal, and mechanical, from green resources. The potential for green energy production and pollution reduction in rural regions is discussed by Borowski and Barwici [26]. The findings of research on the viability of employing environmentally friendly energy for production while also utilizing toxic waste produced on rural farms are provided. When it comes to environmental protection, the generation of biogas can be extremely important, particularly when there is an excess of animal waste and products from slaughterhouses. The work’s writers underline the numerous benefits, including monetary, energetic, environmental, and agronomic ones.
Aiming to establish useful correlations for the whole economy, Nuno, Carlos Leitão [27] address the relationship between fundamental economic indicators and GHG emissions for a 46-year period, investigating the impact of this relationship on the Portuguese economy. The authors’ conclusion is that the empirical study demonstrates that the increase in the intensity of trade contributes to effects on the environment and energy consumption, with a negative impact on CO2 emissions.
According to Nurrohman et al. [28], a comprehensive approach to urban planning is necessary to increase urban resilience in the face of climate change. The paper’s authors advise applying the research findings with reference to two cities in Indonesia because they believe that municipal officials’ motivation and initiative, along with the proper restrictions on environmental impact, are the most powerful factors of influence in the process of developing and implementing urban development strategies.
According to Javier et al. [29], the design and execution of urban regeneration strategies require the use of holistic solutions, which are necessary for the transformation of cities into smarter ones. The authors created an urban regeneration model through the EU-funded REMOURBAN project, which was carried out in Valladolid (Spain). This model integrates the main influencing factors to identify the impact on the main SD characteristics of sustainable and smart cities: sustainable neighborhoods, sustainable urban mobility, and smart infrastructures and processes. The authors propose, at the city level, a holistic, integrated evaluation regarding SD.
In accordance with Guido C. Guerrero-Liquet et al. [30], for the implementation of SD, renewable sources are key pillars. Since the process of increasing the share of renewable energy sources requires appreciable technical and financial efforts, the authors of this paper address the issues of risk management within the projects of renewable sources based on solar energy, elaborating a specific guide applicable in similar situations.
Peri et al. [31] aim at more comprehensive concerns specific to sustainability, referring to the three very important aspects—water, energy, and food—and to their interconnections. They use a multiobjective model, applicable in such complex processes that are of great importance for SD.
Similarly, Marttunen and Mika et al. [32] address the sustainable evolution of human civilization, stating that water security demands guaranteeing economic, social, and environmental sustainability. The authors propose models for the assessment of water supply security, establishing specific indicators to take into account the interdependencies of the three essential resources: water, energy, and food. The model also aims to simulate the applicability framework in Finland.
We consider particularly relevant the conclusions of Sajid, Ali, and Jang Choon-Man [33], which reaffirm the well-known and recognized truth according to which the large-scale adoption of renewable energy technologies leads, in addition to reducing GHG, to increasing the standard of living in isolated areas where classic electrical systems are not accessible. The authors of this paper elaborate on a project model, including technical evaluation and economic analysis, for a wind-solar hybrid system dedicated to supplying electric energy to isolated areas [33]. In addition to the specific equipment of the wind-solar system, this system is also equipped with energy storage installations in accumulator batteries and pumps.
The work of Gregory N. et al. [34], which deals with the projection of sustainability through the prism of intersectoral legislation at the government level, is noteworthy since it relates to our own issues. Interest in the water-energy nexus, a theory that describes how these two resources are connected, has grown along with worries about energy security and water scarcity. This paper allows us to understand, through a comparative analysis of two case studies, how the management policies of the two key sectors—water and energy—can influence the SD of some regions and states. The authors propose a methodology for studying the integration of climate change policies, considering the connection between these two very important resources.
Asumadu et al. [35] deal with the same topical issue—global warming—which they put in the context of the inevitable limitations of economic performance. The authors of this paper analyzed the relationship between GHG emissions and energy development based on renewable resources in OECD countries, considering industrial evolution. The circular economy is a key factor in reducing GHG and implementing EGD.
According to Romero-Perdomo, Felipe et al. [36], the circular economy is essential for reducing GHG and mitigating and then stopping climate change. The authors highlight—through the analysis of 789 specialized works—four essential directions in scientific research [36]: EC practices, bioeconomy, climate and energy, and sustainability and natural resources.
In the view of Matak and Nikola et al. [37], to be successful in the implementation of SD strategies, first of all, local and regional initiatives and adhesions are essential. The authors of this paper draw attention to the complexity of the mathematical model of the specific processes and propose solving the problem through nonlinear regression algorithms.
In [38], Ciot analyzed the administrative premises related to the processes that will be involved in the implementation of the EGD in Romania. To achieve this objective, the author proposed an analysis model that takes into account three levels and dimensions: strategic, administrative, and operational, a model which—in the author’s opinion—is applicable at the European and Romanian level.
The same difficulties are also addressed by Doskocil [39], who suggests a novel and suitable strategy for the SD of the EU member states, respecting the EGD objectives. The report, which proposed a multicriteria evaluation approach with four criteria and indicators for tracking progress toward green growth, used the OECD public database. The author claims that this strategy gives management authorities a tool to assess the Green Deal’s level of development.
The present work is in line with the authors’ concerns regarding the analysis of Romania’s strategies compared with the SDSs of the EU, with the aim of identifying solutions that lead to the compatibility of national strategies with those of the community and to increasing the compatibility of the national economy [40]. In order to meet the current requirements—including the objectives of the Paris Agreement—at the EU level, the EGD was adopted, through which the EU aims to make the community climate neutral by 2050. With all the damages caused to the foundations of SD by Russia through the consequences of the barbaric war it waged against Ukraine, the European Civilized Community is determined to apply and implement the objectives and targets of the Paris Agreement and the GEP Environmental team. The European Civilized Community’s member states must work together for this to happen, and critical to this is the analysis undertaken at the national level on these issues. This work’s goal is also to achieve that. Through the comparative analysis of the Significant National Strategies under the aspect of the impact on the climate, and RDSR in relation to the EGD, the author of [1] indicated the need to update the RDSR, starting from the objectives and targets identified in the EGD. To achieve the purpose of this work, that of quantification, we will take only the identified targets, as these are quantitative amounts, the targets being formulated only as desired with linguistic value.
We specify that the National Recovery and Resilience Plan (NRRP) and the Significant National Strategies for Climate Impacts (SNSC) are included in the RDSR. We also specify that in this paper, we use both the terms Sustainable Development and Sustainability, which we define as having a broader meaning than SD and encompassing not only growth but also stagnation or decrease, with the objective being the effective sustainability of the processes.

3. Materials and Methods

From [1], we took the targets with a direct impact on the fulfillment of the vital objective “net zero emissions”, identified in the related EGD legislation and from other EU documents congruent with it, and compared them with the targets intended to achieve the same objectives, which are written in the RDSR. The steps of the work methodology are highlighted in Figure 3.
The EU’s goal of becoming climate neutral by 2050, set by GEP Environmental, is crucial because it calls for an economy with zero net GHG emissions, which implies that those emissions will be offset by CO2 sequestration. This is especially true given that the EU is currently the third-largest GHG emitter in the world [41]. Energy conversion processes are responsible for approximately 80% of GHG emissions, which justifies focusing on these processes, mainly through a substantial increase in the share of renewable energy resources (RER) and the significant improvement of energy efficiency (EE). Table 1 lists the targets identified in the EGD’s applied legislation and other documents congruent with it, drawn up at the EU level.
Romania has signed all international and community documents regarding the environment and climate, including the Paris Agreement. There are many areas included in the GEP environmental-related legislation in which Romania has substantial negative gaps compared with the EU average. In summary, at the level of 2020 [1]:
  • In terms of GHG emissions, Romania is well below the EU average, with an emission intensity of 537.6 g equiv. CO2/1 EUR, which can be compared with the EU average of 266.5 g equiv. CO2/1 EUR.
  • Under the energy efficiency aspect, energy productivity had a value of 5.2 EUR/kg in Romania, which can be compared with the EU average of 8.57 EUR/kg.
  • Under the aspect of the valorization of renewable energy resources, the gross final consumption index of RER had values of 24.48% in Romania and 22.09% in the EU.
  • The municipal waste recycling rate was 13.7% in Romania and 47.20% on average in the EU. In order to obtain the overall vision, the synthesis presented in [1] was completed with specific sectoral targets taken from the NRRP [42], thus obtaining the national targets listed in Table 2.
Comparing and quantifying the compatibility of TEs with TNs is a meticulous operation that carries the risk of some errors occurring. The comparisons and evaluations are suitable and were created only for the targets that are found in both categories: in the EU according to the EGD and in Romania according to the RDSR. For this reason, it is not possible to make an explicit analysis regarding the national targets (TNs) that concern waste (TN6, TN7). We specify the fact that, even if the recovery of waste cannot be identified as an explicit target in the EGD, this concern is intense in many EU states, and is materialized through the reduction in GHG and the increase in energy produced from RRE.
At first glance, we find that the tables of the two sets of targets:
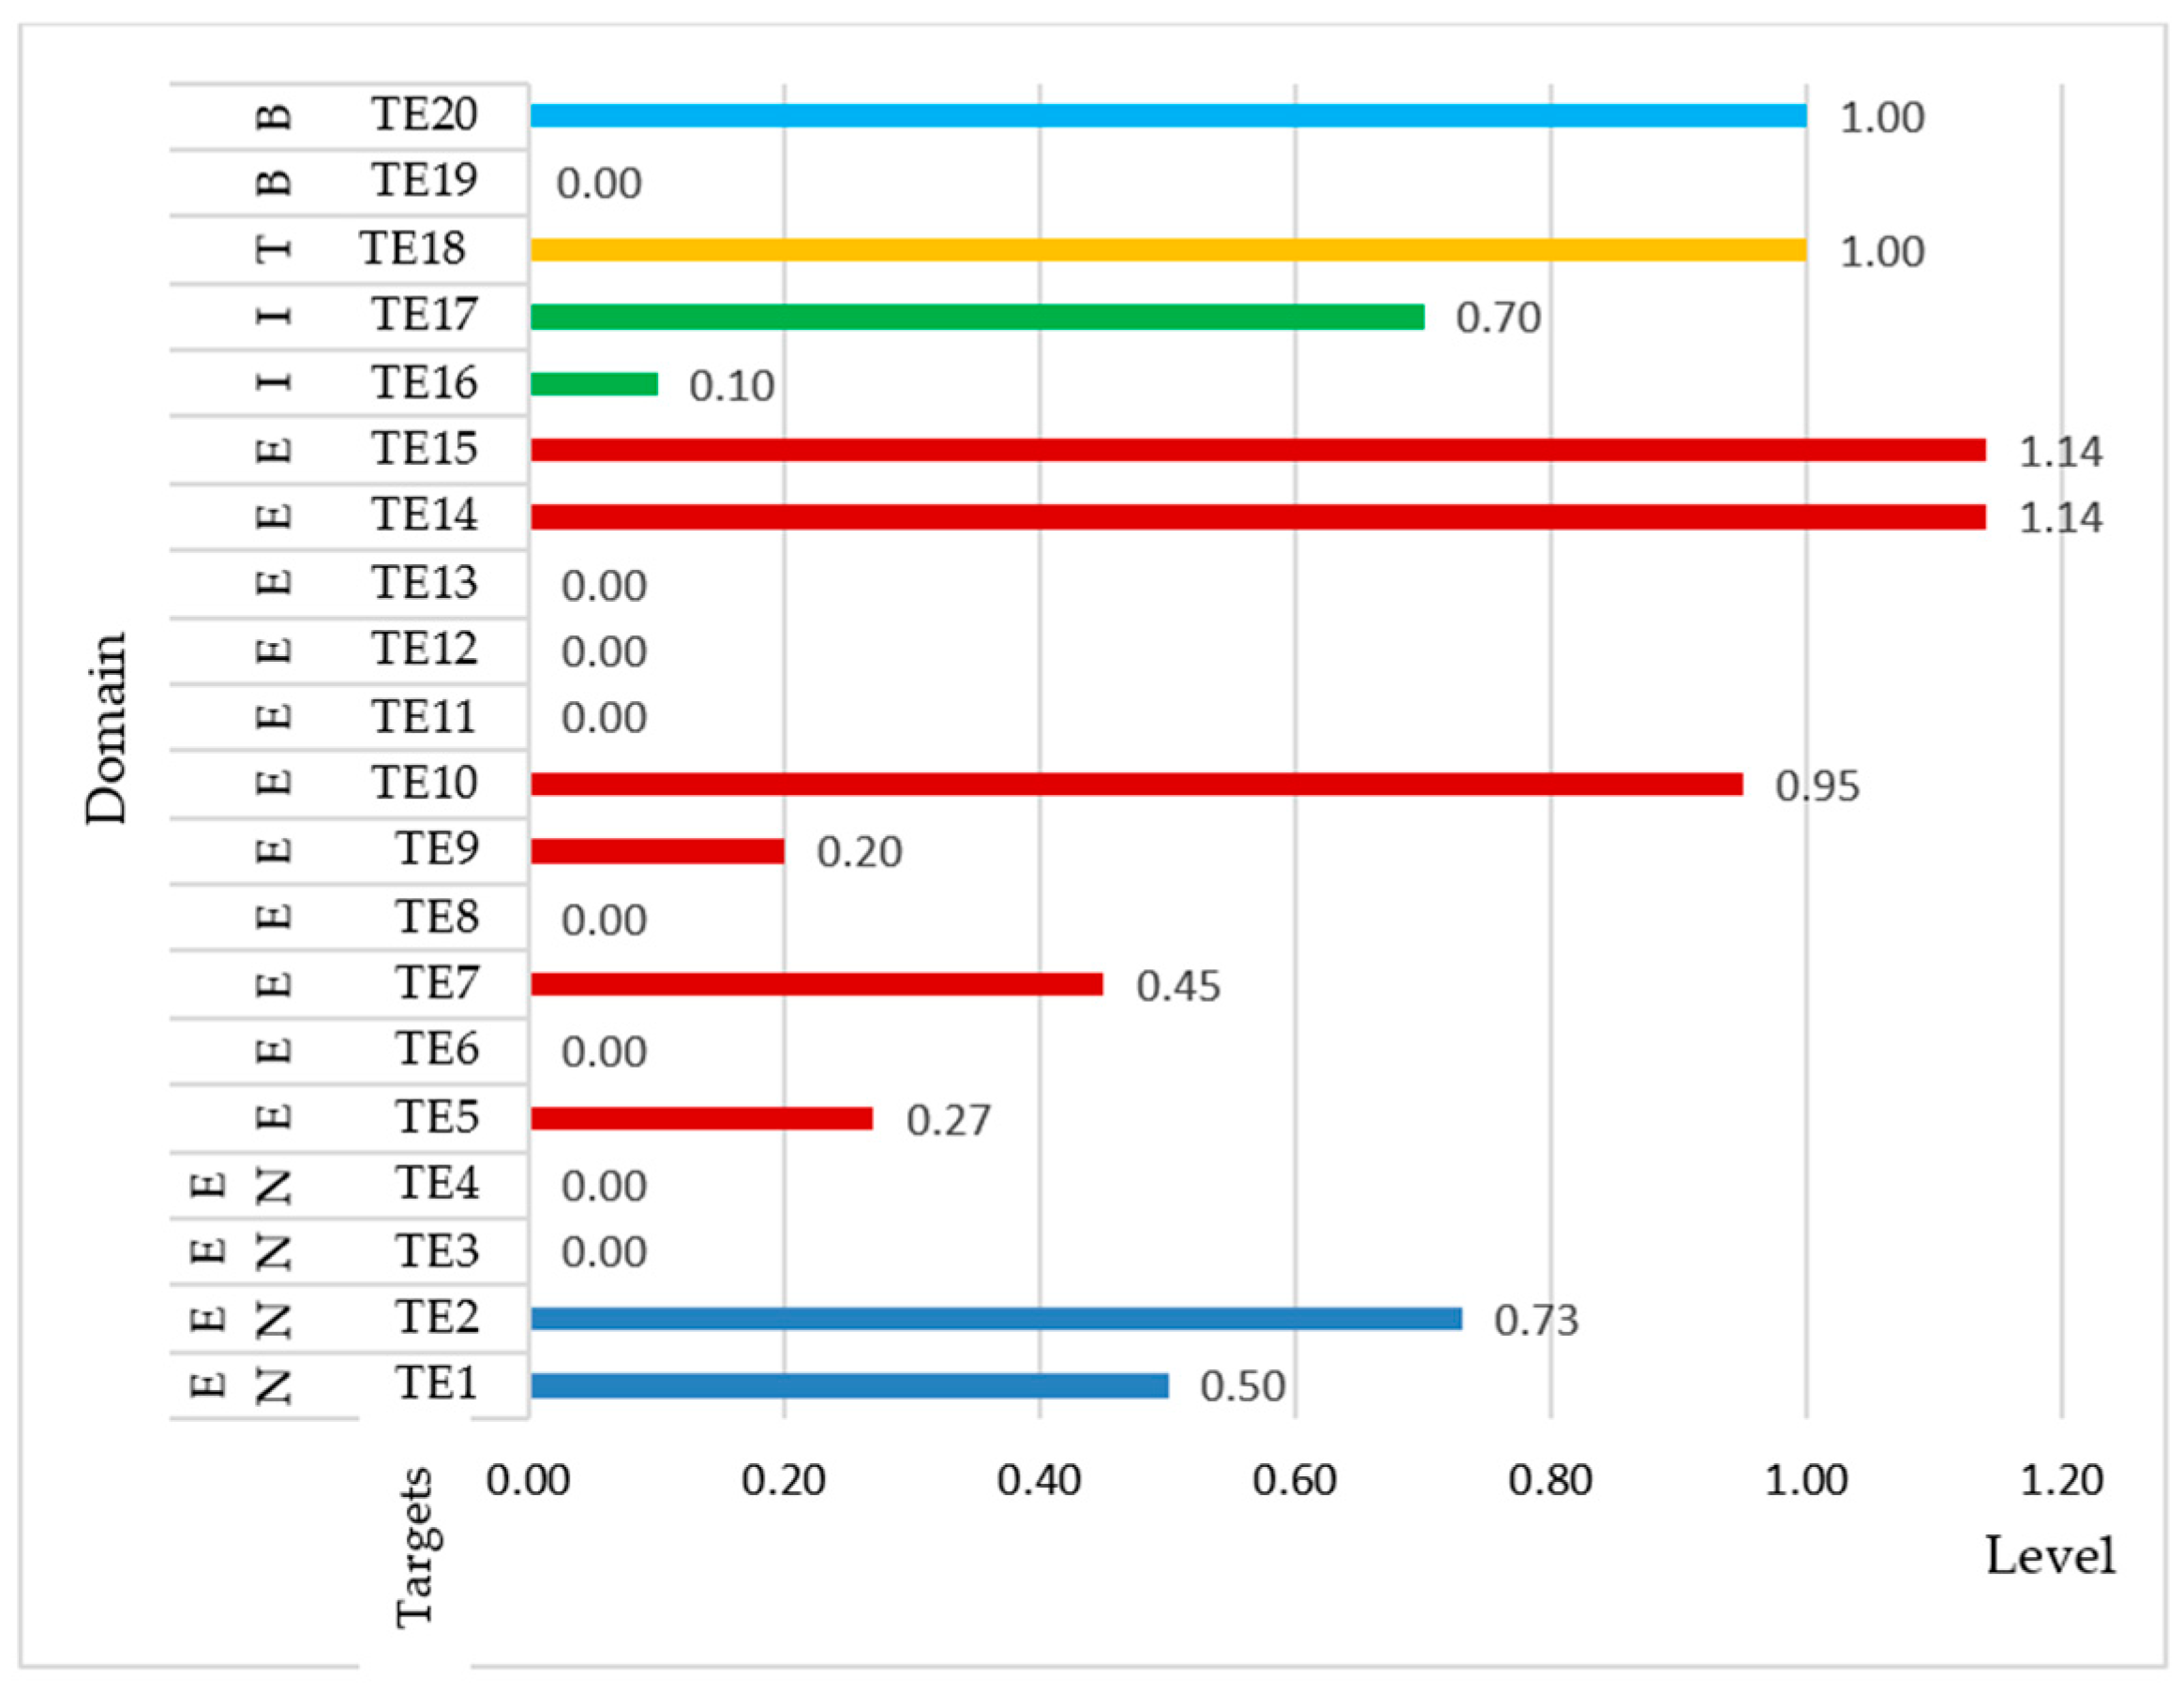
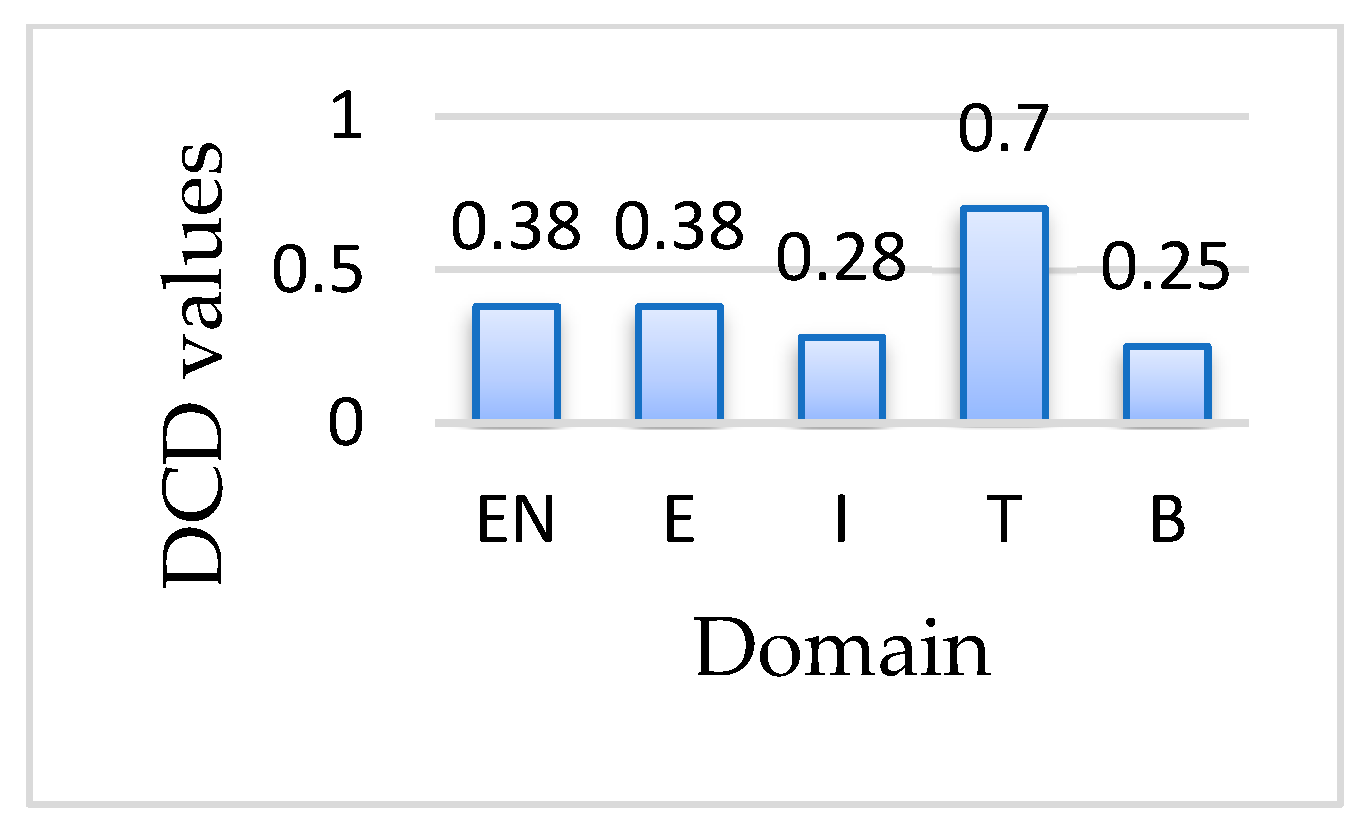
  • Are structured on the same five domains, which we rank according to their importance on OV, as follows: environment (EN), energy (E), SRE industry (I), transport (T), and buildings (B).
  • Are numerically unequal (19 TE and 29 TN), with the following distribution by domains:
EN       E           I         T         B T E T N 4 11 2 1 2 7 9 6 5 2
  • Contain some targets that are unclear, irrelevant, or superfluous, being included, practically, in others that are more comprehensive. For this reason, for the comparative numerical evaluations, we will work with a set of clear, relevant, comprehensive targets, such as this: TE—all, TN—those registered in matrix (2).
T N E N 2 , 4 E 10 , 11 , 13 , 15 , 16 I 17 T 23 , 27 B 28 , 29
  • Are unequal in terms of importance regarding the impact on vital objectives. Here, we are not referring to the importance viewed in terms of the scope of the geographical and economic area to which the target refers (EU—very large, RO—small) but to the importance in terms of the effect on GHG reduction, that is, to the scale to which the target is applied. From this point of view, we consider that the targets can be grouped into three categories, in which—for the purpose of quantification—we will give them different importance factors (IFs), as follows:
I F = 1 f o r   t h o s e   i n   t h e   E   f i e l d   a n d   i n   t h e   E N   f i e l d w i t h   d i r e c t   r e f e r e n c e   t o   G H G ; 0.7 f o r   t h o s e   f r o m   f i e l d s   I ,   T ,   a n d   B ; 0.5 f o r   t h o s e   i n   t h e   E N   f i e l d w i t h o u t   d i r e c t   r e f e r e n c e   t o   G H G ;
To compare targets that are measured in absolute units [tons, GW et al.], we define and evaluate the absolute values of the economic relevance factor (RF) and, respectively, the relative values (RRFs) for each TN as follows:
R F = T E V / G D P E f o r   E U ; T N V / G D P N f o r   R O ;
R R F = R F N / R F E
where:
(TEV, TNV)—the assumed values for TE and TN, respectively;
(GDPE, GDPN)—the value of the gross domestic product at the level of the EU and Romania respectively [EUR];
(RFE, RFN)—the factor of economic relevance at the level of the EU and Romania.
We evaluate the characterization indicators of the compatibility and convergence of TNs with TEs. Obviously, for this purpose, the reference is TE, and TNs that do not have a correspondent in TE have only an intrinsic value regarding the national level of concern that we characterize through a score, evaluated by domains (SD) and at the national level (SN), as follows:
S D i = j i I F i j S N = i = 1 5 S D i
IFij—importance factor of target “j” in domain “i’’.
In order to highlight the degree of compatibility of the set of TNs with the reference set of TEs, for each domain, we resort to the vector expression method:
DC = (a, b, …)
where (a, b, c, …)—numbers that reflect the coverage of successive TEs by TN, without highlighting the degree of coverage, with the following meaning:
zero (0)—TE not covered by TN;
one (1)—TE covered by TN.
For the five domains, we gather the related vectors in a matrix.
The evaluation of the degree of convergence involves the use of the numerical values of the targets (TE, TN) and of the characterization factors (RF, RRF). The set of values for the degree of convergence of the targets for each domain (DCT) is highlighted as follows:
D C T = T N V T E V f o r   a s s u m e d   t a r g e t s   i n   % R R F f o r   t a r g e t s   a s s u m e d   w i t h   a b s o l u t e   v a l u e s
Based on the individual values, the values of the cumulative degrees of convergence are calculated by domains (DCD) and at the national level (DCN):
D C D = 1 N T E D j i N T N D C T i j × I F i j D C N = 1 5 i = 1 5 D C D i 8
NTED—the number of TEs in a domain.

4. Results

Through the processing of the existing data by applying the presented model, the results presented below were obtained. The values obtained for the DC indicator are presented in Table 3.
The evaluated score for TN, according to the presented model, has the following values:
D S D E N E I T B 6 9 4.2 3.5 1.4
SN = 24.1
The values obtained for DCT and DCD, determined in accordance with the model described and based on the values assumed by TN and TE, are summarized in Table 4, and in Figure 4 and Figure 5, we show graphically, by targets and domain, the level of convergence of the RDSR with the EGD.

5. Discussion

5.1. The Purpose of the Work

This paper is intended to illustrate the current state, the gaps that still need to be filled, and the steps Romania must take in order to completely achieve the goals and targets outlined in the EGD [41] through the research conducted and synthesized in this document. The future of Romania depends on maintaining the economy in a sustainable manner. The fundamental documents created by the EU for this goal are the EGD and related legislation. Due to the EGD’s recent adoption at the EU level, the member states have not yet synchronized their national strategies with the EGD [41], as seen in the example of Romania. Due to the limited amount of highly specialized literature available on the topic addressed in this research—the analysis of the compatibility of national plans with the EGD—it is impossible to compare the findings of this paper with those of other studies of a similar nature.

5.2. Romania’s National Strategies

Romania has many national strategies, the most important from the perspective of EGD objectives being [43]: the national strategy for the sustainable development of Romania 2030, the development strategy of Romania in the next 20 years, the National Integrated Plan for Energy and Climate Change 2021–2030, and Romania’s Energy Strategy 2019–2030 with the perspective of 2050. These strategies mainly target the 2020–2030 time frame, not even being connected from the temporal perspective of the EGD, which has the essential objectives and targets quantified for two important stages: 2030 and 2050.
The significant national strategies in terms of the impact on the climate, recently completed with the National Recovery and Resilience Plan [42], are comprehensive in terms of the areas addressed by the legislation implementing the EGD. As a result of the opportunity created by the EU, Romania developed and is implementing the National Recovery and Resilience Plan [42], which will implement a series of concrete targets regarding the modernization of the national economy, with a major impact on reducing GHG, utilizing clean energy, and harnessing renewable energy resources. The National Recovery and Resilience Plan is more adapted to the demands of the EGD than the national strategies in terms of its impact on the climate.
The significant national strategies in terms of the impact on the climate [43] and the National Recovery and the Resilience Plan [42] have objectives consistent with EGD objectives [41], but they have some superfluous targets and a significant number of targets that do not synchronize with those assumed at the EU level.

5.3. Level of Targets

Among the 29 targets with an impact on vital objectives identified in the significant national strategies in terms of the impact on the climate and the National Recovery and the Resilience Plan, only 12 are in correspondence with 11 similar targets from the EU legislation, structured as follows: 2 in the environment, 5 in energy, 1 in the renewable energy resources industry, 2 in transport, and 2 in buildings. It is obvious that the significant national strategies in terms of their impact on the climate drafting groups did not coordinate while taking into account the discrepancies between current national targets that have the same object (for example, GHG).
The targets (TNs) in The significant national strategies in terms of the impact on the climate and the National Recovery and the Resilience Plan are significantly more modest than the corresponding ones in the EU application legislation, in most directions: environmental impact through GHG and recyclable waste, energy efficiency, the share of RER in the energy mix, and through the share of electricity across all energy agents. There is one exception—the TN, which refers to the reduction in energy consumption (total and in buildings) and, in relation to this, increasing the use of electric cars. This work determines the directions in which Romania must act to close the gaps and evaluates the degree of convergence of the current discrepancies. The degree of convergence is insufficient for each of the following five domains: environment (38%), energy (38%), the industry for renewable energy resources (28%), transportation (70%), and buildings (25%). As a result, the overall degree of convergence is only close to 40%.

6. Conclusions

We believe it is imperative that Romania revises its national strategies and adopts a National Green Deal to bring the national targets (TNs) to the same level as those in the EU (TEs), with the fundamental objective (OF) of net zero emissions by 2050, in light of the current situation and the significance of the vital objective assumed by the EU (net zero emissions).
We think the working methodology described in this paper is universal in the sense that it may be used for analyses of a comparable nature in any EU member state, which is a good incentive for additional study, including comparisons of analyses among EU member states. The writers of this paper sought to advance the topic by examining changes at the national, EU, and state levels, as well as by enlarging the scope of analytical inquiry through the use of fuzzy information processing, among other techniques.

Author Contributions

Conceptualization, I.F.; methodology, A.I.F. and I.F.; validation, A.I.F. and I.F.; formal analysis, A.I.F.; investigation, I.F.; resources, C.R.H.; data curation, I.F.; writing—original draft preparation, I.F.; writing—review and editing, C.R.H.; visualization, A.I.F.; supervision, I.F. All authors have read and agreed to the published version of the manuscript.

Funding

This research received no external funding.

Institutional Review Board Statement

Not applicable.

Informed Consent Statement

Not applicable.

Data Availability Statement

The analyzed data can be found on the websites of the European Commission, the European Union, and the Romanian government. No link was created to present the results of the research.

Conflicts of Interest

The authors declare no conflict of interest.

References

  1. Felea, I.; Felea, A.I. Analysis of the compatibility of Romania’s relevant strategies with the European Green Deal, Oradea. J. Sustain. Energy 2022, 13, 89–93. [Google Scholar]
  2. Artis, M.J.; Nixson, F. The Economics of the European Union. In Policy and Analysis, 4th ed.; Oxford University Press: Oxford, UK, 2007. [Google Scholar]
  3. The Brundtland Report. Paper Presented at UN. 1987. Available online: http://www.un-documents.net/wced-ocf.htm (accessed on 3 April 2023).
  4. European Commission. European Commission Documents: Competitiveness Advisory Group. Climate action. Enhanding European Competitiveness. 1995. Available online: http://ec.europa.eu/clima/politics/brief/eu/index_en.htm (accessed on 3 April 2023).
  5. United Nations. Human Development Report. 1999. Available online: https://digitallibrary.un.org/record/286004#record-files-collapse-header (accessed on 3 April 2023).
  6. European Commission. A Final Report for The European Commission Directorate-General Regional Policy—A Study on the Factors of Regional Competitiveness; European Commission Documents; Cambridge Econometrics, University of Cambridge: Cambridge, UK, 2003. [Google Scholar]
  7. Popescu, I.; Bondrea, A. Constantinescu. In Sustainable Development. A Romanian Perspective; Economic Publishing House: Bucharest, Romania, 2005. [Google Scholar]
  8. Munasinghe, M. Environmental Economics and Sustainable Development; World Bank Paper; The World Bank: Washington, DC, USA, 1993. [Google Scholar]
  9. Felea, A.I. Increasing the Competitiveness of the Romanian Economy in the Context of Sustainable Development. Ph.D. Thesis, University of Oradea, Oradea, Romania, 2014. [Google Scholar]
  10. Bubbico, R.L.; Dijkstra, L. The European regional Human Development and Human Poverty Indices. Reg. Focus 2011, 2, 1–10. [Google Scholar]
  11. Eurostat. 2023. Available online: https://ec.europa.eu/eurostat (accessed on 6 April 2023).
  12. Lisbon Strategy 2000. Available online: http://circa.europa.eu/irc/opoce/fact_sheets/info/data/policies/lisbon/article_7207_ro.htm (accessed on 3 April 2023).
  13. Felea, A.I. Competitiveness and Sustainable Development. An Integrated Strategic Approach at the Level of Romania and the EU; Publishing House of the University of Oradea: Oradea, Romania, 2015; ISBN 978-606-10-1529-0. [Google Scholar]
  14. Single European Act. 1987. Available online: https://eur-lex.europa.eu/legal-content/EN/TXT/?uri=celex%3A11986U%2FTXT (accessed on 4 April 2023).
  15. Maastricht Treaty. 1993. Available online: https://www.europarl.europa.eu/about-parliament/en/in-the-past/the-parliament-and-the-treaties/maastricht-treaty (accessed on 4 April 2023).
  16. Gothenburg Summit. 2001. Available online: https://www.consilium.europa.eu/media/20983/00200-r1en1.pdf (accessed on 6 April 2023).
  17. European Commission. Sustainable Development Strategy. 2006. Available online: https://data.consilium.europa.eu/doc/document/ST-10917-2006-INIT/en/pdf (accessed on 6 April 2023).
  18. Europe 2020 Strategy. 2010. Available online: https://eur-lex.europa.eu/LexUriServ/LexUriServ.do?uri=COM:2010:2020:FIN:en:PDF (accessed on 6 April 2023).
  19. European Union. Climate change—European Climate Deal. 2019. Available online: https://climate-pact.europa.eu/index_en (accessed on 6 April 2023).
  20. European Commission. Consequences of climate change. 2023. Available online: https://climate.ec.europa.eu/climate-change/consequences-climate-change_en (accessed on 6 April 2023).
  21. European Council. The Paris Agreement on Climate Change—Consilium. Available online: https://www.consilium.europa.eu/en/policies/climate-change/paris-agreement/ (accessed on 3 April 2023).
  22. Sixth Assessment Report of the Intergovernmental Panel on Climate Change. Available online: https://www.ipcc.ch/2021/08/09/ar6-wg1-20210809 (accessed on 6 April 2023).
  23. Cattivelli, V. Macro-Regional Strategies, Climate Policies and Regional Climatic Governance in the Alps. Climate 2023, 11, 37. [Google Scholar] [CrossRef]
  24. Dillman, K.; Heinonen, J. Towards a Safe Hydrogen Economy: An Absolute Climate Sustainability Assessment of Hydrogen Production. Climate 2023, 11, 25. [Google Scholar] [CrossRef]
  25. van der Spek, M.; Banet, C.; Bauer, C.; Gabrielli, P.; Goldthorpe, W.; Mazzotti, M.; Munkejord, S.T.; Røkke, N.A.; Shah, N.; Sunny, N.; et al. Perspective on the hydrogen economy as a pathway to reach net-zero CO2 emissions in Europe. Energy Environ. Sci. 2022, 15, 1034–1077. [Google Scholar] [CrossRef]
  26. Borowski, P.; Barwici, J. Efficiency of Utilization of Wastes for Green Energy Production and Reduction of Pollution in Rural Areas. Energies 2023, 16, 13. [Google Scholar] [CrossRef]
  27. Dillman, K.; Heinonen, J. Testing the Role of Trade on Carbon Dioxide Emissions in Portugal. Economies 2021, 9, 22. [Google Scholar]
  28. Wijaya, N.; Nitivattananon, V.; Shrestha, R.P.; Kim, S.M. Drivers and Benefits of Integrating Climate Adaptation Measures into Urban Development: Experience from Coastal Cities of Indonesia. Sustainability 2020, 12, 750. [Google Scholar] [CrossRef]
  29. Antolín, J.; de Torre, C.; García-Fuentes, M.Á.; Pérez, A.; Tomé, I.; Mirantes, M.L.; Hoyos, E. Development of an Evaluation Framework for Smartness and Sustainability in Cities. Sustainability 2020, 12, 5193. [Google Scholar] [CrossRef]
  30. Guerrero-Liquet, G.C.; Sánchez-Lozano, J.M.; García-Cascales, M.S.; Lamata, M.T.; Verdegay, J.L. Decision-Making for Risk Management in Sustainable Renewable Energy Facilities: A Case Study in the Dominican Republic. Sustainability 2016, 8, 455. [Google Scholar] [CrossRef]
  31. Peri, M.; Vandone, D.; Baldi, L. Volatility Spillover between Water, Energy and Food. Sustainability 2017, 9, 1071. [Google Scholar] [CrossRef]
  32. Marttunen, M.; Mustajoki, J.; Sojamo, S.; Ahopelto, L.; Keskinen, M. A Framework for Assessing Water Security and the Water–Energy–Food Nexus—The Case of Finland. Sustainability 2019, 11, 2900. [Google Scholar] [CrossRef]
  33. Ali, S.; Jang, C.-M. Optimum Design of Hybrid Renewable Energy System for Sustainable Energy Supply to a Remote Island. Sustainability 2020, 12, 1280. [Google Scholar] [CrossRef]
  34. Sixt, G.N.; Strambo, C.; Zhang, J.; Chow, N.; Liu, J.; Han, G. Assessing the Level of Inter-Sectoral Policy Integration for Governance in the Water–Energy Nexus: A Comparative Study of Los Angeles and Beijing. Sustainability 2020, 12, 7220. [Google Scholar] [CrossRef]
  35. Sarkodie, S.A.; Ajmi, A.N.; Adedoyin, F.F.; Owusu, P.A. Econometrics of Anthropogenic Emissions, Green Energy-Based Innovations, and Energy Intensity across OECD Countries. Sustainability 2021, 13, 4118. [Google Scholar] [CrossRef]
  36. Romero-Perdomo, F.; Carvajalino-Umaña, J.D.; Moreno-Gallego, J.L.; Ardila, N.; González-Curbelo, M. Research Trends on Climate Change and Circular Economy from a Knowledge Mapping Perspective. Sustainability 2022, 14, 521. [Google Scholar] [CrossRef]
  37. Matak, N.; Mimica, M.; Krajačić, G. Optimising the Cost of Reducing the CO2 Emissions in Sustainable Energy and Climate Action Plans. Sustainability 2022, 14, 3462. [Google Scholar] [CrossRef]
  38. Ciot, M.-G. On European Green Deal and Sustainable Development Policy (the Case of Romania). Sustainability 2021, 13, 12233. [Google Scholar] [CrossRef]
  39. Doskočil, R. The Multicriteria Assessment of the Green Growth in the Context of the European Union’s Green Deal. Amfiteatru Econ. 2022, 24, 739–757. [Google Scholar] [CrossRef]
  40. Felea, I.; Adrian, I.F. The Multidimensional Characterization of Romania’s Energetic Competitiveness, 12th Edition—FOREN. In Tomorrow’s Energy: From Vision to Reality; World Energy Council Central & Eastern Europe Energy Forum: Bucharest, Romania, 2014. [Google Scholar]
  41. The European Green Deal. 2019. Available online: https://commission.europa.eu/strategy-and-policy/priorities-2019-2024/european-green-deal_en (accessed on 7 April 2023).
  42. National Recovery and Resilience Plan. Ministry of Investments and European Projects of Romania. 2021. Available online: https://mfe.gov.ro/pnrr/ (accessed on 7 April 2023).
  43. The Romanian Government. 2023. Available online: https://www.gov.ro/ (accessed on 7 April 2023).
Figure 1. Interdependence between the three pillars of sustainable or lasting development (source: [7]).
Sustainability 15 13386 g001
Figure 2. The three components of sustainable development (source: [8]).
Sustainability 15 13386 g002
Figure 3. The steps of the work methodology.
Sustainability 15 13386 g003
Figure 4. The level of convergence by domain.
Sustainability 15 13386 g004
Figure 5. The level of convergence by domain of the RDSR with the EGD. The national value of the degree of convergence is DCN = 0.398.
Sustainability 15 13386 g005
Table 1. Targets from the EGD application legislation and other relevant EU documents.
No.FieldTargets Assumed at EU Level (TE)
1.Environment [EN]
  • TE1: The GHG-neutral European space = reduction by 2050 of net GHG emissions by 100% compared with 1990.
  • TE2: Net reduction by 2030 of GHG emissions by 55% compared with 1990.
  • TE3: 13% reduction in GHG intensity by 2030.
  • TE4: 90% reduction in GHG emissions in transport by 2050.
2.Energy [E]
  • TE5: Installed power in wind and photovoltaic EE sources to be close to 10 TW.
  • TE6: By 2050, ElE, H2, and synthetic fuels will represent 50% of the energy mix.
  • TE7: By 2050, ElE produced from RRE will represent 80–90% of total EE.
  • TE8: By 2050, clean H2 will account for 12% of final energy consumption.
  • TE9: By 2050, ElE consumption will double, accounting for 50% of final energy consumption with an increase of 1%/year.
  • TE10: RRE will represent 40% of the EU’s energy mix in 2030.
  • TE11: Increase by 1.1%/year of the share of RRE in industry.
  • TE12: Increase by 2.1%/year of the share of RRE in the centralized heating and cooling processes.
  • TE13: Installed power in offshore wind turbines: 60 GW in 2030 and 300 GW in 2050.
  • TE14: Reduction in primary and final energy consumption by 39% and 36%, respectively, by 2030.
  • TE15: During 2024–2030, EU member states will reduce final energy consumption by 1.5%/year.
3.Renewable energy industry [I]
  • TE16: Low-carbon hydrogen production reaches 150 million tons.
  • TE17: Electrolyzers for the production of H2 from renewable energy resources: minimum 6 GW by 2024 and minimum 40 GW by 2030.
4.Transport [T]
  • TE18: Electric cars will exceed 60% of classic car sales.
5.Buildings [B]
  • TE19: 49% of the energy consumed in buildings comes from RRE by 2030.
  • TE20: Reducing the energy consumption of buildings by 1.7%/year.
Table 2. Targets registered in the RDSR.
No. FieldRomania’s Adopted Targets (TN)
1.Environment [EN]
  • TN1. Reducing GHG emissions from industry by 30% by 2035 through increasing energy efficiency.
  • TN2. Reduction in GHG emissions by 40% (compared with 1990) by 2030.
  • TN3. Reduction in GHG by 43.9% compared with 2005.
  • TN4. GHG reduction of 80% by 2050 compared with 1990.
  • TN5. Reduction in GHG emissions by 40% by 2030 and 60% by 2050 (compared with 1990).
  • TN6. Recycling of 40% of municipal waste by 2027 and 55% by 2037.
  • TN7. Recycling of 65% of packaging waste by 2025 and 70% by 2030.
2.Energy [E]
  • TN8. RER will have a share of 27% of gross energy consumption in 2030.
  • TN9. The share of RER energy in the final gross energy consumption will be 30.7%.
  • TN10. The share of RER in total primary energy will be 37.9% in 2030.
  • TN11. The production of ElE from RER will be 37.5% by 2030 and 37.8% by 2050.
  • TN12. ElE will represent 19.5% of gross energy consumption by 2030 and 23.6% by 2050.
  • TN13. The share of ElE in the final energy consumption will be 19% by 2030 and 25% by 2050.
  • TN14. Increasing energy efficiency by at least 27% compared with the status quo scenario by 2030.
  • TN15. Reduction in primary energy consumption by 45.1% and final consumption by 40.4% (compared with the 2007 PRIMES projection).
  • TN16: The power installed in RER (wind and solar) will be 0.95 GW by 2024 and 3GW by 2026.
3.Renewable energy industry [I]
  • TN17: Electrolyzers for the production of H2 from RER: minimum 0.1 GW, with a production of 10 thousand tons/year by 2026.
  • TN18: Realization of 1870 km hydrogen distribution network by 2026.
  • TN19: Construction of a high-efficiency cogeneration plant with a power of 300 MW by 2026.
  • TN20: Construction of a production and assembly line for storage batteries with a productivity of 2 GW/year by 2025.
  • TN21: Realization of production and assembly line of cells and photovoltaic panels with the productivity of 200 GW/year by 2025.
  • TN22: Realization of an electricity storage capacity with the power of 240 MW by 2025.
4.Transport [T]
  • TN23: Realization of 30 thousand charging stations for electric vehicles by 2026.
  • TN24: Construction of 1339 km of modernized roads by 2026.
  • TN25: Construction of 2851 km of new/modernized railway infrastructure and 262 new electric rolling stock by 2026.
  • TN26: Construction of 12.7 km of new subway lines by 2026.
  • TN27: Scrapping of at least 250 thousand highly polluting vehicles (including Euro 3) and the purchase of at least 29.5 thousand vehicles with zero emissions by 2026.
5.Buildings [B]
  • TN28: Energetic renovation of at least 4.36 million square meters of residential buildings by 2026.
  • TN29: Energetic renovation of at least 2.31 million square meters of public buildings by 2026.
Table 3. DC indicator values.
No.DomainDC-Vector
1.Environment [EN](1, 1, 0, 0)
2.Energy [E](1, 0, 1, 0, 1, 1, 0, 0, 0, 1, 0)
3.Renewable energy industry [I](1, 1)
4.Transport [T](1)
5.Buildings [B](0, 1)
Table 4. DCT and DCD indicator values.
No.DomainDCT ValuesDCD Values
1.Environment [EN]{0.8, 0.73, 0, 0}0.38
2.Energy [E]{0.27, 0, 0.45, 0, 0.2, 0.95, 0, 0, 0, 1.14, 1.14}0.38
3.Renewable energy industry [I]{0.1, 0.7}0.28
4.Transport [T]{1}0.7
5.Buildings [B]{0, 1}0.25
Disclaimer/Publisher’s Note: The statements, opinions and data contained in all publications are solely those of the individual author(s) and contributor(s) and not of MDPI and/or the editor(s). MDPI and/or the editor(s) disclaim responsibility for any injury to people or property resulting from any ideas, methods, instructions or products referred to in the content.

