
Chemometric Analysis-Based Sustainable Use of Different Current Baking Wheat Lots from Romania and Hungary

 ,
,  , and
, and
Abstract
:1. Introduction
2. Materials and Methods
2.1. The Biological Material
2.2. Methods
2.2.1. Organoleptic Analysis
2.2.2. Chemical Analysis
2.2.3. Physical Analysis
2.3. Statistical Analysis
3. Results and Discussion
3.1. Organoleptic Analysis
3.2. Physical, Chemical and Rheological Parameters
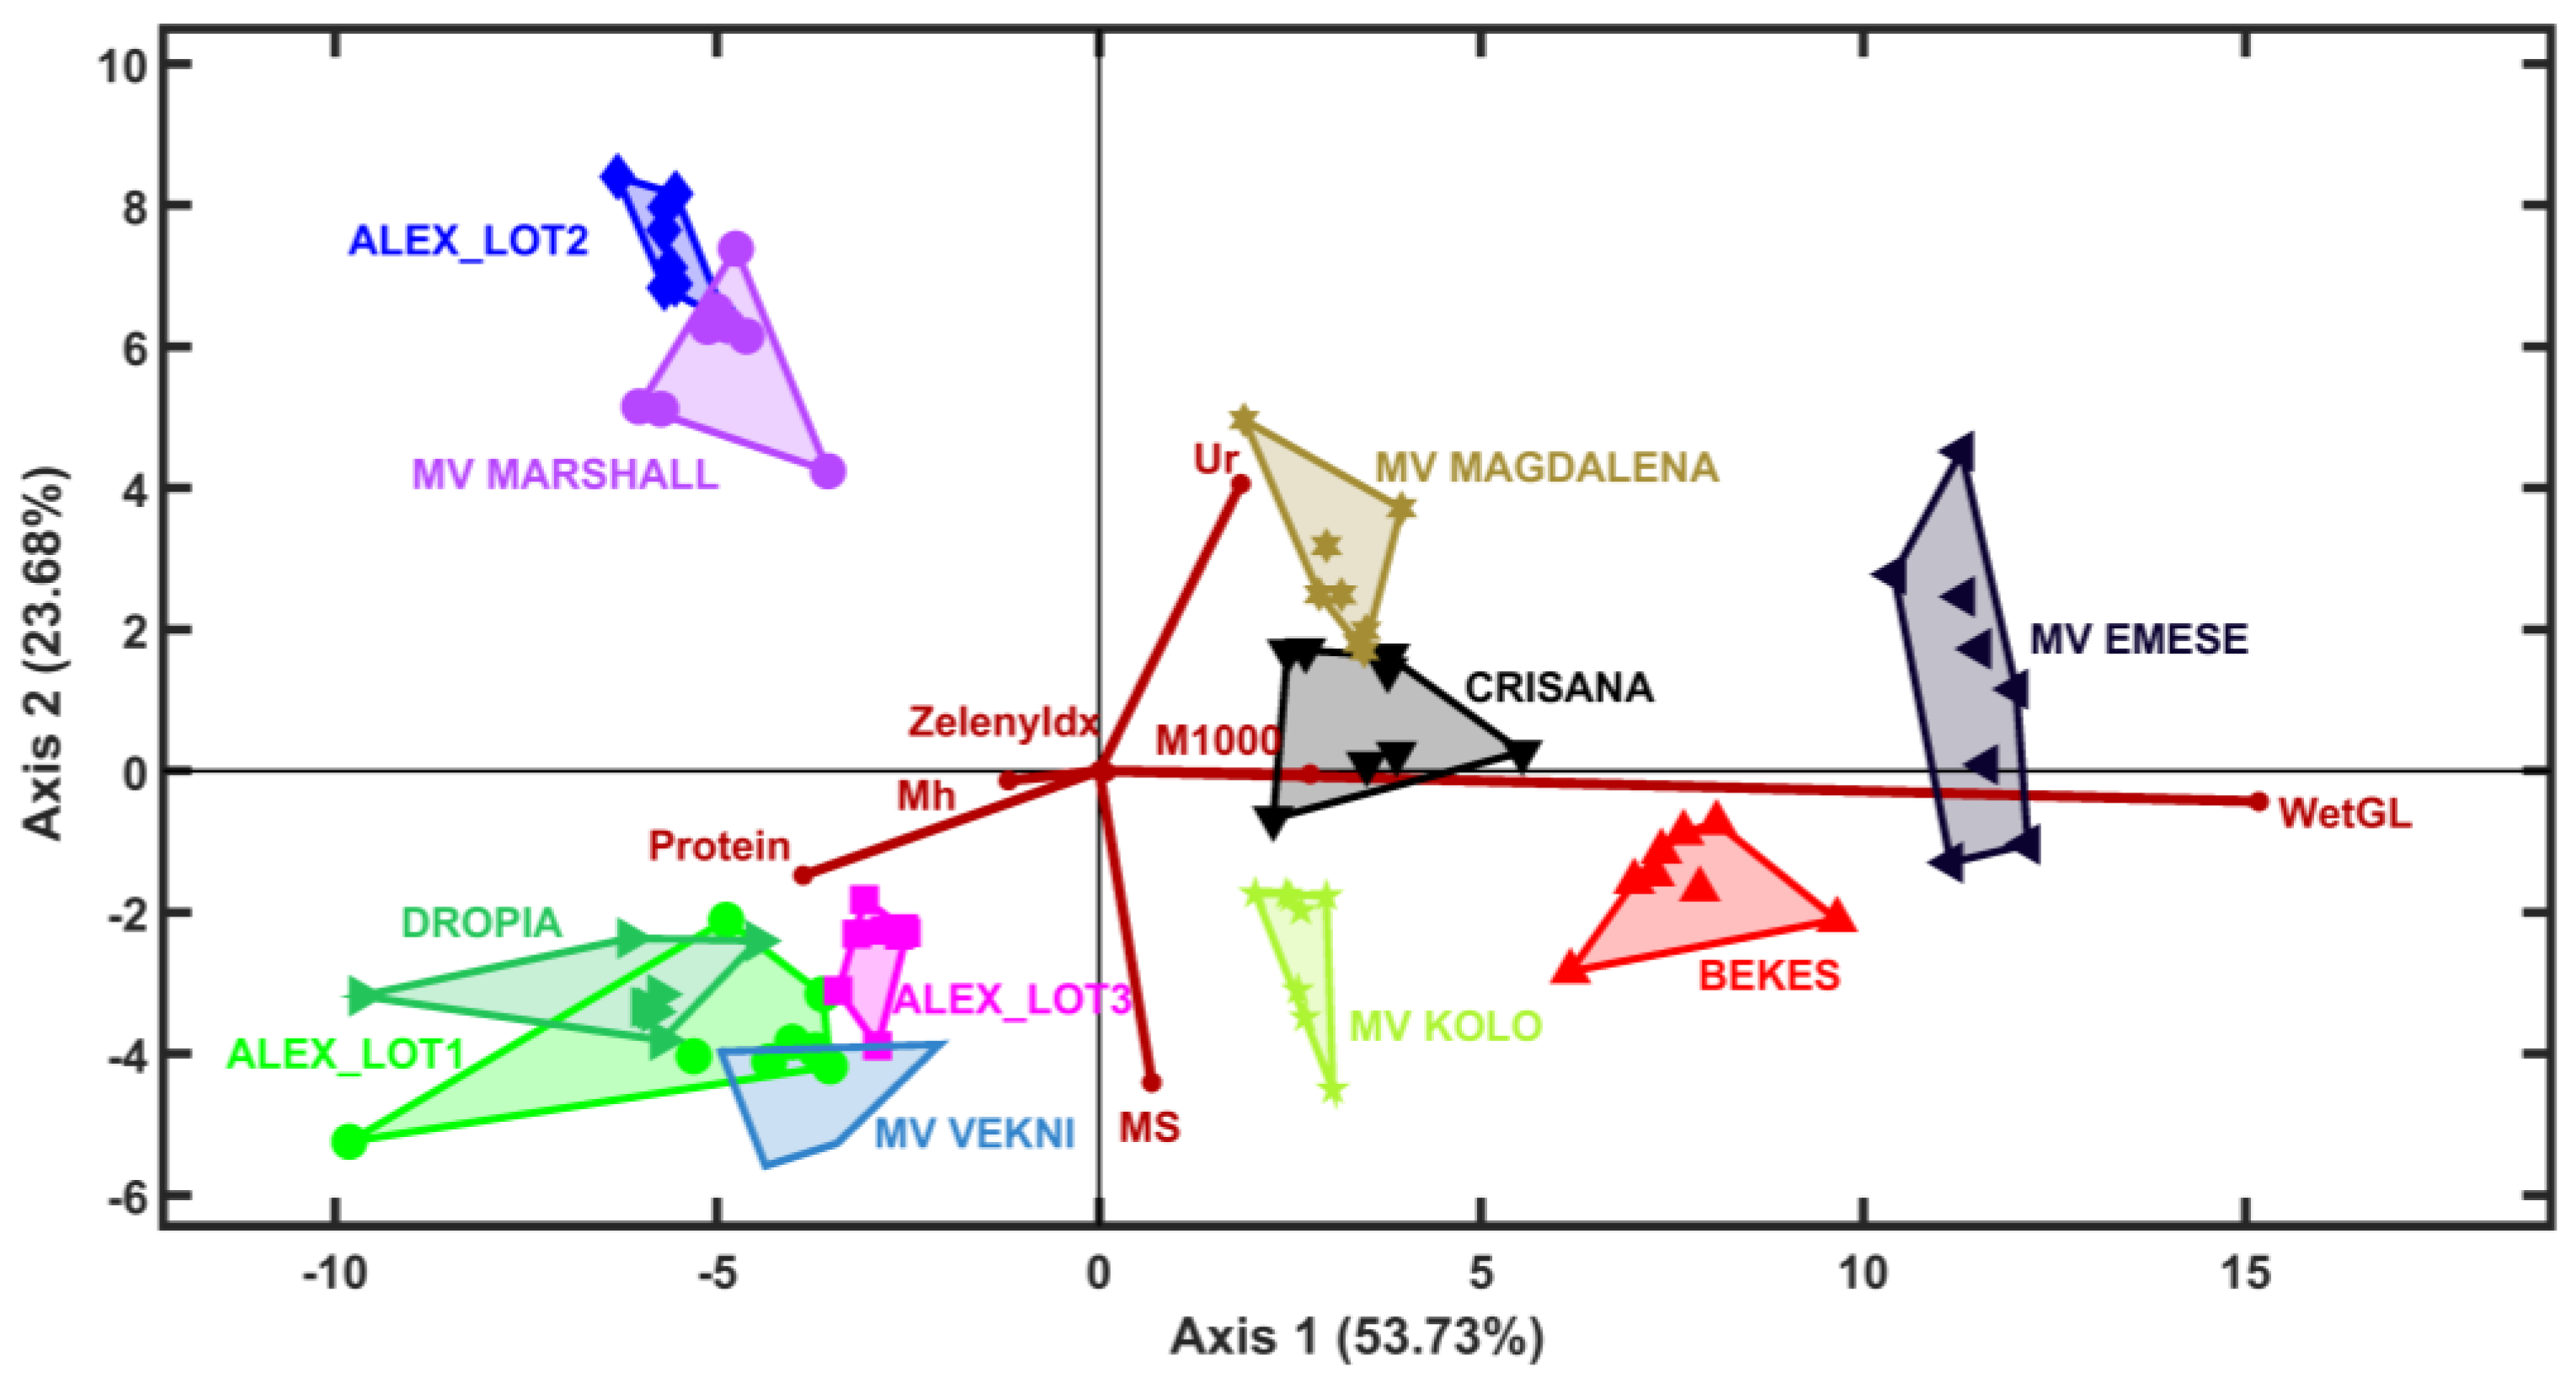
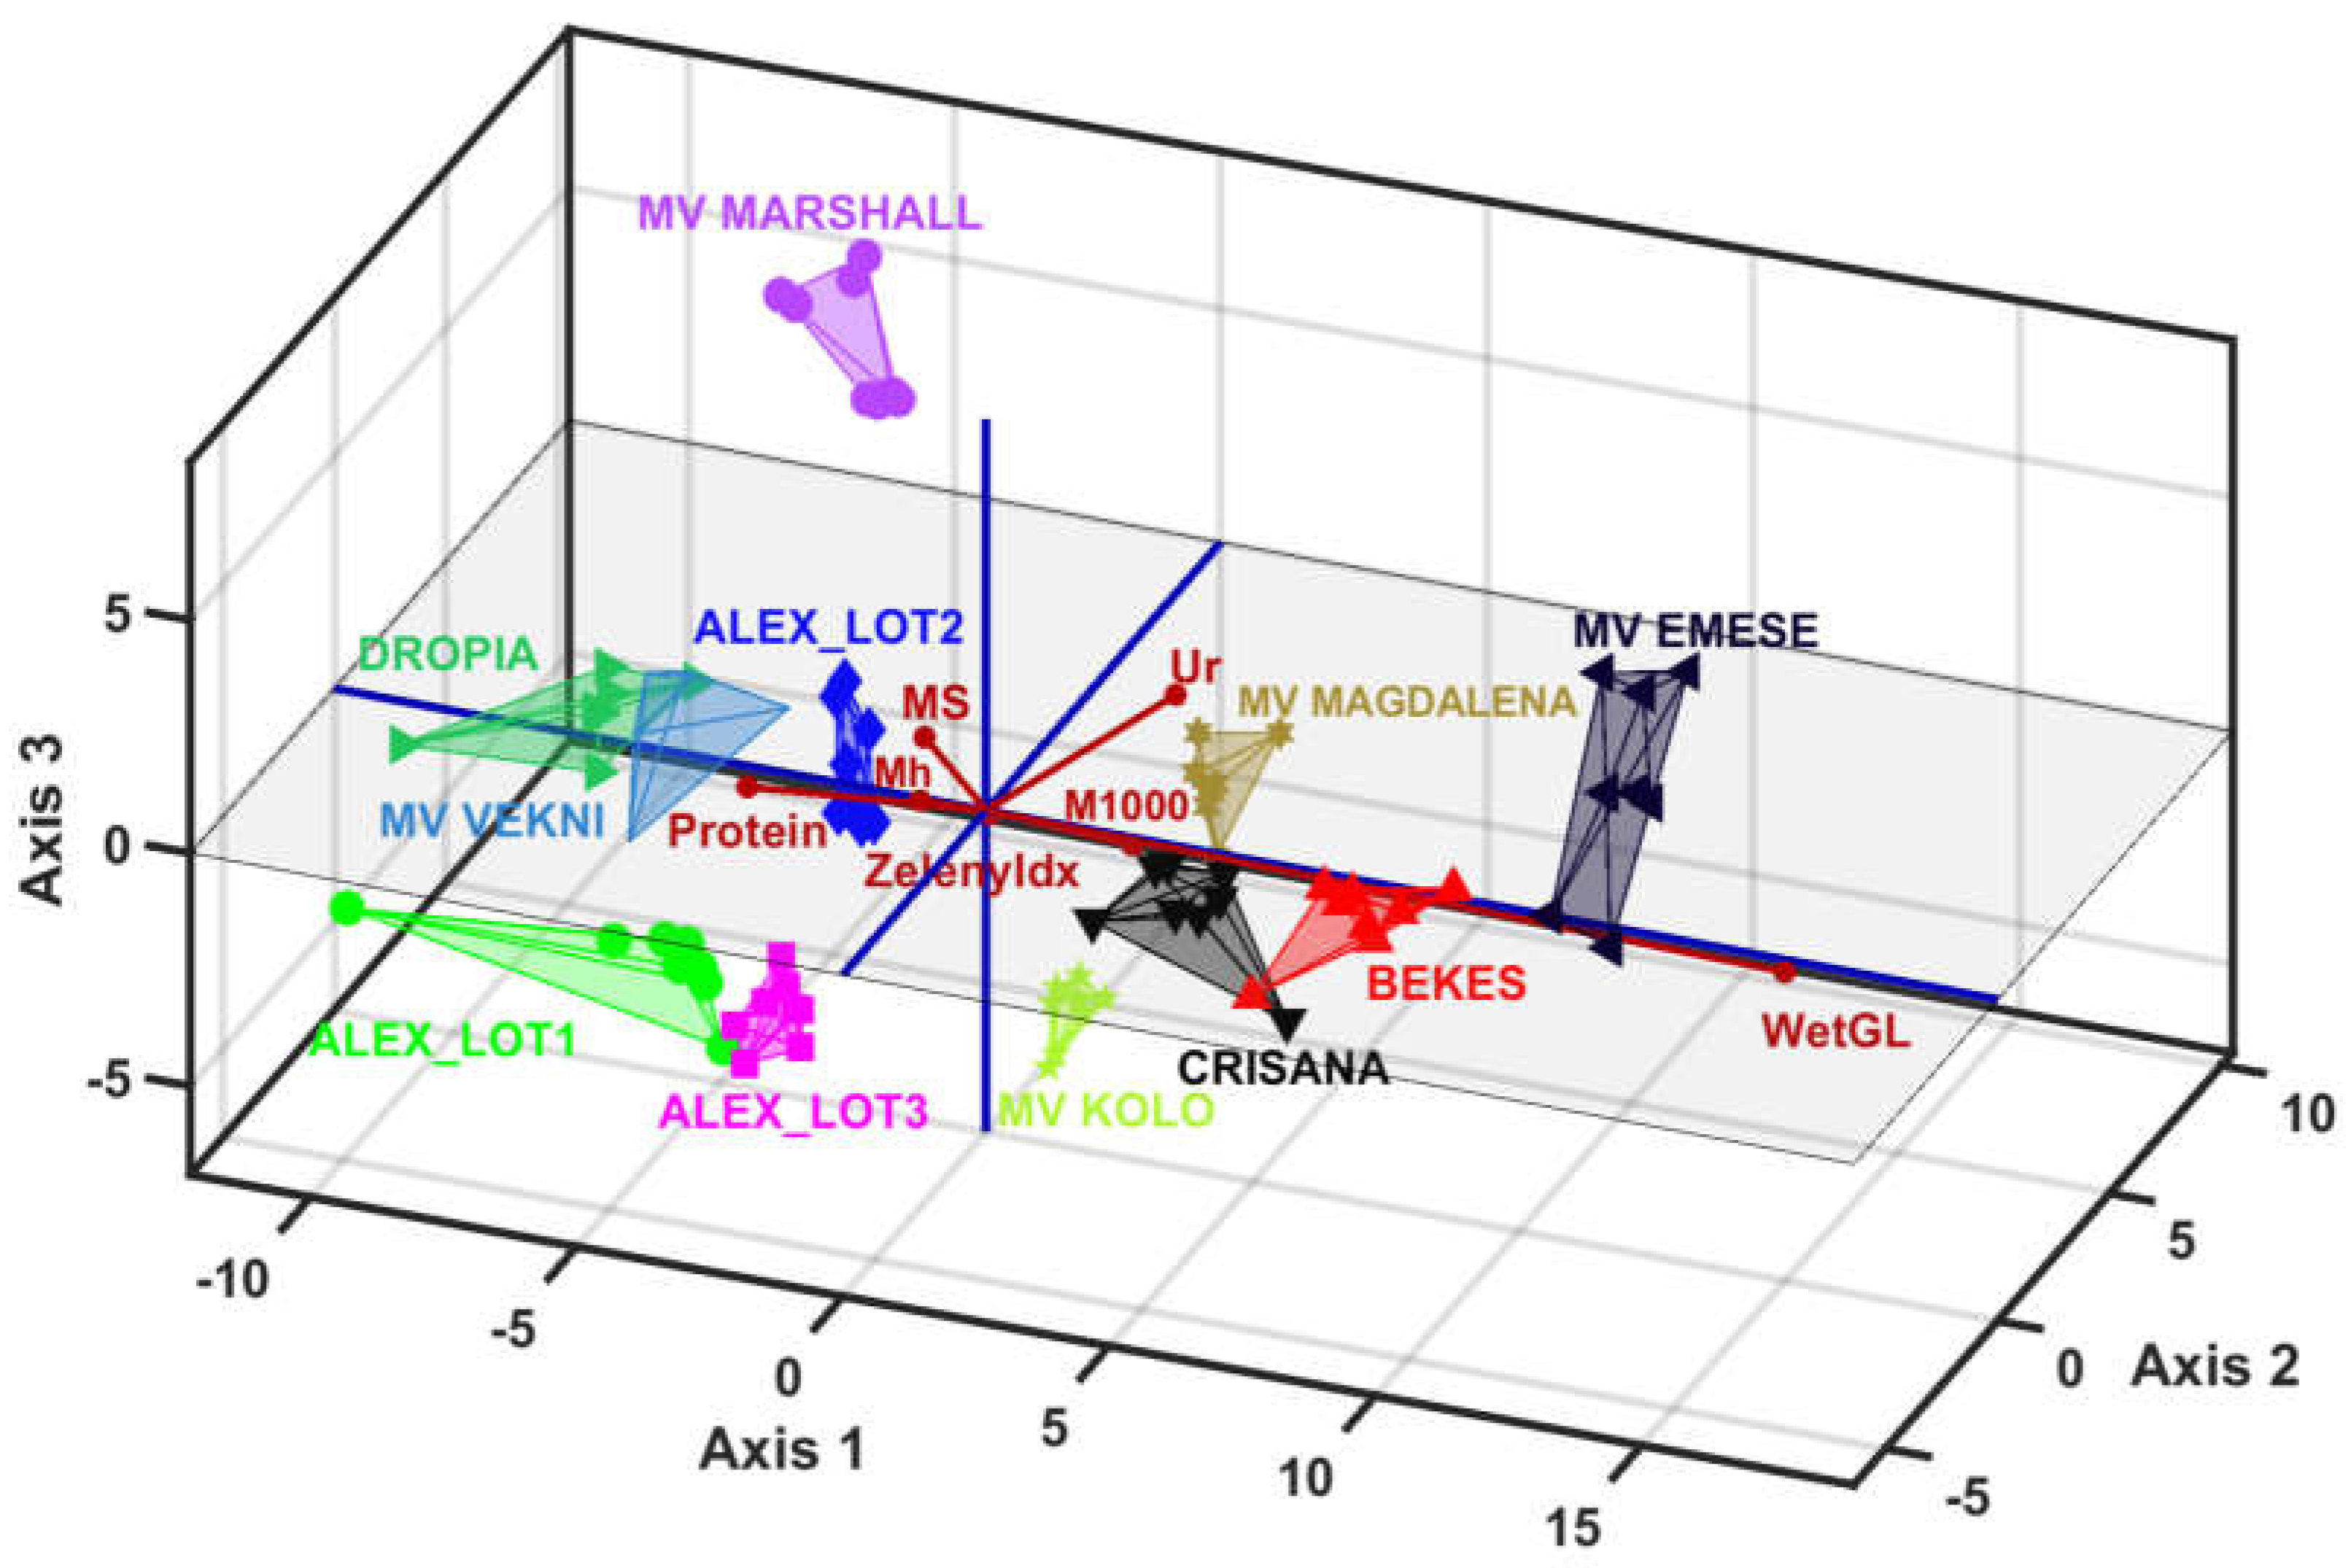
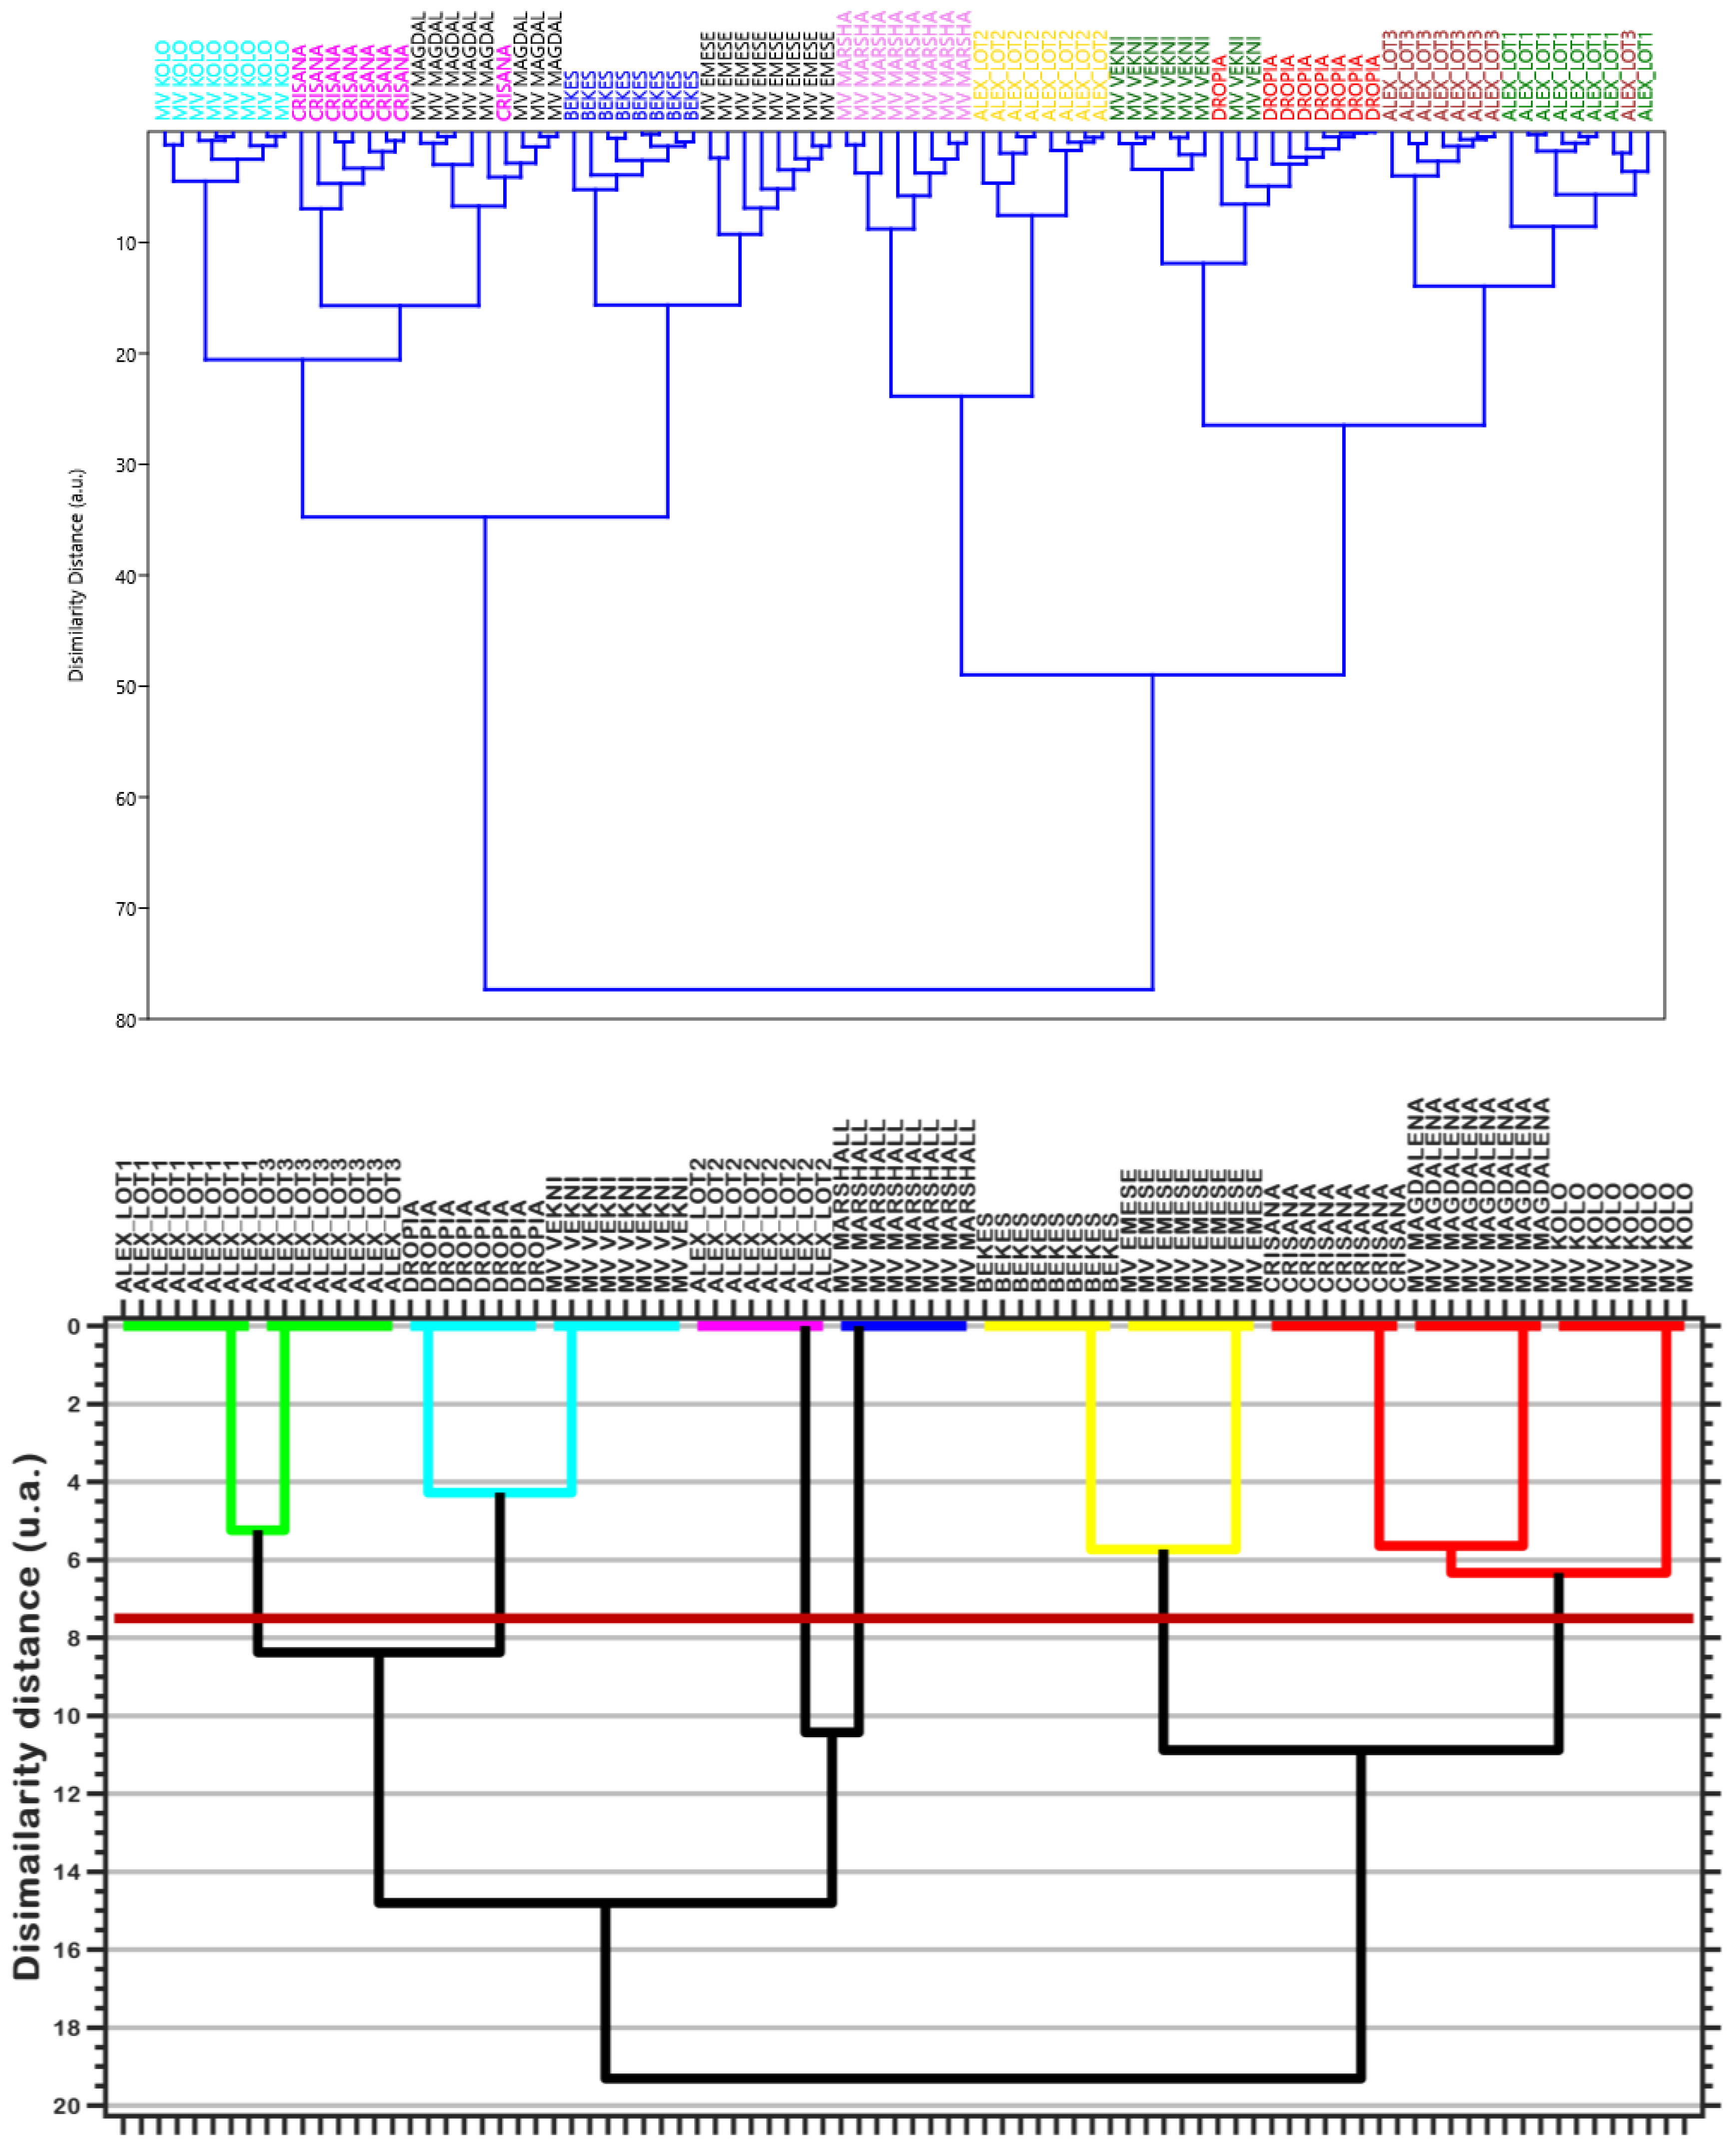
3.3. Multivariate Analysis
4. Conclusions
Author Contributions
Funding
Institutional Review Board Statement
Informed Consent Statement
Data Availability Statement
Acknowledgments
Conflicts of Interest
References
- Mahesh, B. Non-Destructive Testing. Int. J. Res. Eng. Sci. Manag. 2020, 2, 2581–2792. [Google Scholar]
- Wang, F.; Xi, Z.; Yang, J.; Yang, X. Research Progress of Grain Quality Nondestructive Testing Methods. In Computer and Computing Technologies in Agriculture VI: 6th IFIP WG 5.14 International Conference, CCTA 2012, Zhangjiajie, China, 19–21 October 2012; Li, D., Chen, Y., Eds.; Springer: Berlin/Heidelberg, Germany, 2013; pp. 255–262. [Google Scholar]
- Banach, J.K.; Majewska, K.; Grzywińska-Rąpca, M.; Żuk-Gołaszewska, K. The Use of a Non-Invasive Electrical Method to Assess the Chemical Composition, Hardness, and Color of Durum Wheat Grain Cultivated in an Integrated System. Sustainability 2022, 14, 3834. [Google Scholar] [CrossRef]
- Hussain, N.; Sun, D.-W.; Pu, H. Classical and Emerging Non-Destructive Technologies for Safety and Quality Evaluation of Cereals: A Review of Recent Applications. Trends Food Sci. Technol. 2019, 91, 598–608. [Google Scholar] [CrossRef]
- Johnson, J.B. An Overview of Near-Infrared Spectroscopy (NIRS) for the Detection of Insect Pests in Stored Grains. J. Stored Prod. Res. 2020, 86, 101558. [Google Scholar] [CrossRef]
- Li, X.; Zhang, L.; Zhang, Y.; Wang, D.; Wang, X.; Yu, L.; Zhang, W.; Li, P. Review of NIR Spectroscopy Methods for Nondestructive Quality Analysis of Oilseeds and Edible Oils. Trends Food Sci. Technol. 2020, 101, 172–181. [Google Scholar] [CrossRef]
- Zhu, F.; Yao, H.; Hruska, Z.; Kincaid, R.; Brown, R.; Bhatnagar, D.; Cleveland, T. Integration of Fluorescence and Reflectance Visible Near-Infrared (VNIR) Hyperspectral Images for Detection of Aflatoxins in Corn Kernels. Trans. ASABE 2016, 59, 785–794. [Google Scholar] [CrossRef]
- Tao, F.; Yao, H.; Hruska, Z.; Burger, L.W.; Rajasekaran, K.; Bhatnagar, D. Recent Development of Optical Methods in Rapid and Non-Destructive Detection of Aflatoxin and Fungal Contamination in Agricultural Products. TrAC Trends Anal. Chem. 2018, 100, 65–81. [Google Scholar] [CrossRef]
- De Girolamo, A.; Cervellieri, S.; Cortese, M.; Porricelli, A.C.R.; Pascale, M.; Longobardi, F.; von Holst, C.; Ciaccheri, L.; Lippolis, V. Fourier Transform Near-Infrared and Mid-Infrared Spectroscopy as Efficient Tools for Rapid Screening of Deoxynivalenol Contamination in Wheat Bran: Fourier Transform near-Infrared and Mid-Infrared Spectroscopy. J. Sci. Food Agric. 2019, 99, 1946–1953. [Google Scholar] [CrossRef]
- Horvat, D.; Magdic, D.; Jurkovic, Z.; Simic, G.; Drezner, G.; Kurtanjek, Z. Chemometric and Image Analysis of Croatian Wheat Cultivars and Their Bread Making Quality. In ITI 2002, Proceedings of the 24th International Conference on Information Technology Interfaces (IEEE Cat. No. 02EX534), Cavtat, Croatia, 24–27 June 2002; IEEE: Manhattan, NY, USA, 2002. [Google Scholar]
- Magdić, D.; Horvat, D.; Jurkovic, Z.; Rezica, S.; Kurtanjek, Z. Chemometric Analysis of High Molecular Mass Glutenin Fractions and Image Data of Bread Crumb Structure from Croatian Wheat Cultivars. Food Technol. Biotechnol. 2002, 40, 331–341. [Google Scholar]
- Hucl, P.; Briggs, C.; Shirtliffe, S.; Beres, B.; Spaner, D.; Dyck, A.; Gerard, G. Increasing Grain Yield While Maintaining Baking Quality in Canada Western Red Spring Wheat. Can. J. Plant Sci. 2022, 102, 973–983. [Google Scholar] [CrossRef]
- Zivancev, D. Characterization of Bread Wheat Cultivars (Triticum aestivum L.) by Glutenin Proteins. Cereal Res. Commun. 2012, 41, 133–140. [Google Scholar] [CrossRef]
- Kurtanjek, Z.; Horvat, D.; Drezner, G.; Magdić, D. Prediction of Wheat Baking Quality Based on Gliadin Fractions and HMW-GS Data by Chemometric Analysis (PLS Modelling). Acta Aliment. 2013, 42, 609–617. [Google Scholar] [CrossRef]
- Jańczak-Pieniążek, M.; Buczek, J.; Kaszuba, J.; Szpunar-Krok, E.; Bobrecka-Jamro, D.; Jaworska, G. A Comparative Assessment of the Baking Quality of Hybrid and Population Wheat Cultivars. Appl. Sci. 2020, 10, 7104. [Google Scholar] [CrossRef]
- Jerome, R.E.; Singh, S.K.; Dwivedi, M. Process Analytical Technology for Bakery Industry: A Review. J. Food Process Eng. 2019, 42, e13143. [Google Scholar] [CrossRef]
- Publications Office of the European Union CELEX1, Commission Regulation (EU) No 1272/2009 of 11 December 2009 Laying down Common Detailed Rules for the Implementation of Council Regulation (EC) No 1234/2007 as Regards Buying-in and Selling of Agricultural Products under Public Intervention. Available online: http://op.europa.eu/en/publication-detail/-/publication/275f9aed-b70c-4d31-9d79-20f103f83667/language-en (accessed on 16 January 2023).
- Official Journal of the European Union Council Regulation (EC) No 1234/2007 of 22 October 2007 Establishing a Common Organisation of Agricultural Markets and on Specific Provisions for Certain Agricultural Products (Single CMO Regulation); 2007; Volume 299. Available online: https://eur-lex.europa.eu/legal-content/EN/TXT/?uri=celex:32007R1234 (accessed on 16 January 2023).
- Martin, C.; Herrman, T.J.; Loughin, T.; Oentong, S. Micropycnometer Measurement of Single-Kernel Density of Healthy, Sprouted, and Scab-Damaged Wheats. Cereal Chem. 1998, 75, 177–180. [Google Scholar] [CrossRef]
- Chang, C.S. Copyright since 1988 by the American Association of Grain Chemists, Inc. Measuring Density and Porosity of Grain Kernels Using a Gas Pycnometer. Cereal Chem. 1988, 65, 13–15. [Google Scholar]
- Yanchev, I.; Ivanova, D.; Ivanov, V. Effect of the Meteorological Conditions in Two Ecological Regions on Common Wheat Development and Productivity. J. Environ. Prot. Ecol. 2014, 15, 965–972. [Google Scholar]
- International Organization for Standardization ISO 7970:2021 Wheat (Triticum aestivum L.)—Specification. Available online: https://www.iso.org/standard/75731.html (accessed on 16 January 2023).
- Jimenez-Pulido, I.J.; Daniel, R.; Perez, J.; Martínez-Villaluenga, C.; De Luis, D.; Martín Diana, A.B. Impact of Protein Content on the Antioxidants, Anti-Inflammatory Properties and Glycemic Index of Wheat and Wheat Bran. Foods 2022, 11, 2049. [Google Scholar] [CrossRef] [PubMed]
- Timar Adrian. Grains Quality Control—Practical Guide; Oradea Publishing House: Oradea, Romania, 2008. [Google Scholar]
- ASRO SR 13548:2013; Grâu Comun (Triticum aestivum). Asociatia de Standardizare din România: București, Romania, 2013.
- STAS 6253-80; Seminţe pentru Consum. Determinarea Caracteristicilor Organoleptice. Organismul National de Standardizare: Bucharest, Romania, 1980.
- Cecchini, C.; Antonucci, F.; Costa, C.; Marti, A.; Menesatti, P. Application of Near-Infrared Handheld Spectrometers to Predict Semolina Quality. J. Sci. Food Agric. 2021, 101, 151–157. [Google Scholar] [CrossRef]
- Hassoon, W.H.; Dziki, D.; Miś, A.; Biernacka, B. Wheat Grinding Process with Low Moisture Content: A New Approach for Wholemeal Flour Production. Processes 2020, 9, 32. [Google Scholar] [CrossRef]
- Guerrini, L.; Napoli, M.; Mancini, M.; Masella, P.; Cappelli, A.; Parenti, A.; Orlandini, S. Wheat Grain Composition, Dough Rheology and Bread Quality as Affected by Nitrogen and Sulfur Fertilization and Seeding Density. Agronomy 2020, 10, 233. [Google Scholar] [CrossRef]
- Cecchini, C.; Bresciani, A.; Menesatti, P.; Pagani, M.A.; Marti, A. Assessing the Rheological Properties of Durum Wheat Semolina: A Review. Foods 2021, 10, 2947. [Google Scholar] [CrossRef]
- Cappelli, A.; Cini, E.; Guerrini, L.; Masella, P.; Angeloni, G.; Parenti, A. Predictive Models of the Rheological Properties and Optimal Water Content in Doughs: An Application to Ancient Grain Flours with Different Degrees of Refining. J. Cereal Sci. 2018, 83, 229–235. [Google Scholar] [CrossRef]
- Schopf, M.; Wehrli, M.C.; Becker, T.; Jekle, M.; Scherf, K.A. Fundamental Characterization of Wheat Gluten. Eur. Food Res. Technol. 2021, 247, 985–997. [Google Scholar] [CrossRef]
- Radawiec, A.; Rutkowska, B.; Tidaback, J.A.; Gozdowski, D.; Knapowski, T.; Szulc, W. The Impact of Selenium Fertilization on the Quality Characteristics of Spring Wheat Grain. Agronomy 2021, 11, 2100. [Google Scholar] [CrossRef]
- Xu, M.; Jin, Z.; Simsek, S.; Hall, C.; Rao, J.; Chen, B. Effect of Germination on the Chemical Composition, Thermal, Pasting, and Moisture Sorption Properties of Flours from Chickpea, Lentil, and Yellow Pea. Food Chem. 2019, 295, 579–587. [Google Scholar] [CrossRef]
- De Bondt, Y.; Liberloo, I.; Roye, C.; Windhab, E.J.; Lamothe, L.; King, R.; Courtin, C.M. The Effect of Wet Milling and Cryogenic Milling on the Structure and Physicochemical Properties of Wheat Bran. Foods 2020, 9, 1755. [Google Scholar] [CrossRef] [PubMed]
- Kirchev, H.; Muhova, A. Phenological Development of Triticale Varieties Depending on the Weather Conditions. In Proceedings of the XXIII International Symposium on Biotechnology, Rome, Italy, 10–11 December 2018; pp. 57–63. [Google Scholar]
- Kumar, N.; Bansal, A.; Sarma, G.S.; Rawal, R.K. Chemometrics Tools Used in Analytical Chemistry: An Overview. Talanta 2014, 123, 186–199. [Google Scholar] [CrossRef]
- Popa, M.; Morar, D.; Adrian, T.; Teuşdea, A.; Popa, D. Study Concerning the Pollution of the Marine Habitats with the Microplastic Fibres. J. Environ. Prot. Ecol. 2014, 15, 916–923. [Google Scholar]
- Purcarea, C.; Laslo, V.; Memete, A.R.; Agud, E.; Miere (Groza), F.; Vicas, S.I. Antigenotoxic and Antimutagenic Potentials of Proline in Allium Cepa Exposed to the Toxicity of Cadmium. Agriculture 2022, 12, 1568. [Google Scholar] [CrossRef]
- Ntumi, S. Reporting and Interpreting Multivariate Analysis of Variance (MANOVA): Adopting the Best Practices in Educational Research. J. Res. Educ. Sci. 2021, 12, 48–57. [Google Scholar] [CrossRef]
- Graziano, S.; Marmiroli, N.; Visioli, G.; Gullì, M. Proteins and Metabolites as Indicators of Flours Quality and Nutritional Properties of Two Durum Wheat Varieties Grown in Different Italian Locations. Foods 2020, 9, 315. [Google Scholar] [CrossRef] [PubMed]
- Grafenauer, S.; Miglioretto, C.; Solah, V.; Curtain, F. Review of the Sensory and Physico-Chemical Properties of Red and White Wheat: Which Makes the Best Whole Grain? Foods 2020, 9, 136. [Google Scholar] [CrossRef] [PubMed]
- Doblado-Maldonado, A.F.; Pike, O.A.; Sweley, J.C.; Rose, D.J. Key Issues and Challenges in Whole Wheat Flour Milling and Storage. J. Cereal Sci. 2012, 56, 119–126. [Google Scholar] [CrossRef]
- Memete, A.R.; Teusdea, A.C.; Timar, A.V.; Vuscan, A.N.; Mintaș, O.S.; Cavalu, S.; Vicas, S.I. Effects of Different Edible Coatings on the Shelf Life of Fresh Black Mulberry Fruits (Morus nigra L.). Agriculture 2022, 12, 1068. [Google Scholar] [CrossRef]
- Durazzo, A.; Kiefer, J.; Lucarini, M.; Camilli, E.; Marconi, S.; Gabrielli, P.; Aguzzi, A.; Gambelli, L.; Lisciani, S.; Marletta, L. Qualitative Analysis of Traditional Italian Dishes: FTIR Approach. Sustainability 2018, 10, 4112. [Google Scholar] [CrossRef]


| No. | Sample Code | Sample Location |
|---|---|---|
| 1. | DROPIA | Romania, Săcuieni |
| 2. | ALEX_LOT1 | Romania, Săcuieni |
| 3. | ALEX_LOT2 | Romania, Săcuieni |
| 4. | ALEX_LOT3 | Romania, Săcuieni |
| 5. | CRIŞANA | Romania, Săcuieni |
| 6. | BEKES | Hungary, Berettyóújfalu |
| 7. | MV_KOLO | Hungary, Berettyóújfalu |
| 8. | MV_VEKNI | Hungary, Berettyóújfalu |
| 9. | MV_MARSHALL | Hungary, Berettyóújfalu |
| 10. | MV_EMESE | Hungary, Berettyóújfalu |
| 11. | MV_MAGDALENA | Hungary, Berettyóújfalu |
| Wheat Lots | Mh (kg/hL) | M1000 (g) | MS (g/cm3) | WetGL (%) | Protein (%) | Ur (%) | ZelenyIdx (mL) |
|---|---|---|---|---|---|---|---|
| DROPIA | 77.49 a,b ± 0.04 | 47.00 c ± 0.00 | 1.23 c,d ± 0.00 | 25.11 f ± 0.21 | 13.69 a ± 0.05 | 12.29 e ± 0.05 | 62.88 f ± 1.89 |
| ALEX_LOT1 | 77.89 a ± 0.04 | 47.36 a,b,c ± 0.29 | 1.25 b,c ± 0.03 | 25.11 f ± 0.30 | 13.42 b,c,d,e ± 0.04 | 12.23 e ± 0.06 | 75.25 a ± 0.71 |
| ALEX_LOT2 | 78.16 a ± 0.05 | 47.24 b,c ± 0.04 | 1.11 h ± 0.05 | 24.89 f ± 0.09 | 12.99 g ± 0.19 | 12.81 b ± 0.05 | 73.13 a,b ± 1.13 |
| ALEX_LOT3 | 76.96 b,c ± 0.29 | 47.49 a,b ± 0.20 | 1.15 f,g,h ± 0.02 | 25.34 d,e ± 0.00 | 13.58 a,b,c ± 0.12 | 12.26 e ± 0.05 | 71.50 b,c ± 1.31 |
| CRISANA | 76.36 c± 1.21 | 47.60 a,b ± 0.00 | 1.19 d,e,f ± 0.02 | 26.01 c ± 0.13 | 13.23 e,f ± 0.02 | 12.49 d ± 0.11 | 68.38 c,d,e ± 1.85 |
| BEKES | 77.58 a,b ± 0.19 | 47.24 b,c ± 0.04 | 1.20 d,e ± 0.01 | 26.79 b ± 0.15 | 13.60 a,b ± 0.08 | 12.57 c,d ± 0.06 | 70.50 b,c ± 2.33 |
| MV KOLO | 78.09 a ± 0.14 | 47.76 a ± 0.07 | 1.17 e,f,g ± 0.01 | 26.07 c ± 0.03 | 13.41 b,c,d,e ± 0.07 | 12.33 e ± 0.10 | 68.88 c,d ± 2.10 |
| MV VEKNI | 77.73 a ± 0.15 | 47.26 b,c ± 0.04 | 1.30 a ± 0.04 | 25.36 d ± 0.09 | 13.52 a,b,c,d ± 0.19 | 12.22 e ± 0.05 | 62.00 f ± 1.77 |
| MV MARSHALL | 78.09 a ± 0.15 | 47.05 c ± 0.54 | 1.29 a,b ± 0.02 | 25.12 e,f ± 0.08 | 13.38 c,d,e,f ± 0.07 | 13.01 a ± 0.08 | 65.00 e,f ± 4.2 |
| MV EMESE | 77.48 a,b ± 0.46 | 47.62 a,b ± 0.46 | 1.23 c,d ± 0.01 | 27.15 a ± 0.07 | 13.36 d,e,f ± 0.12 | 12.77 b ± 0.14 | 65.50 d,e,f ± 3.02 |
| MV MAGDALENA | 78.05 a ± 0.15 | 47.55 a,b ± 0.22 | 1.14 g,h ± 0.01 | 26.12 c ± 0.09 | 13.19 f,g ± 0.20 | 12.63 c ± 0.06 | 62.13 f ± 0.83 |
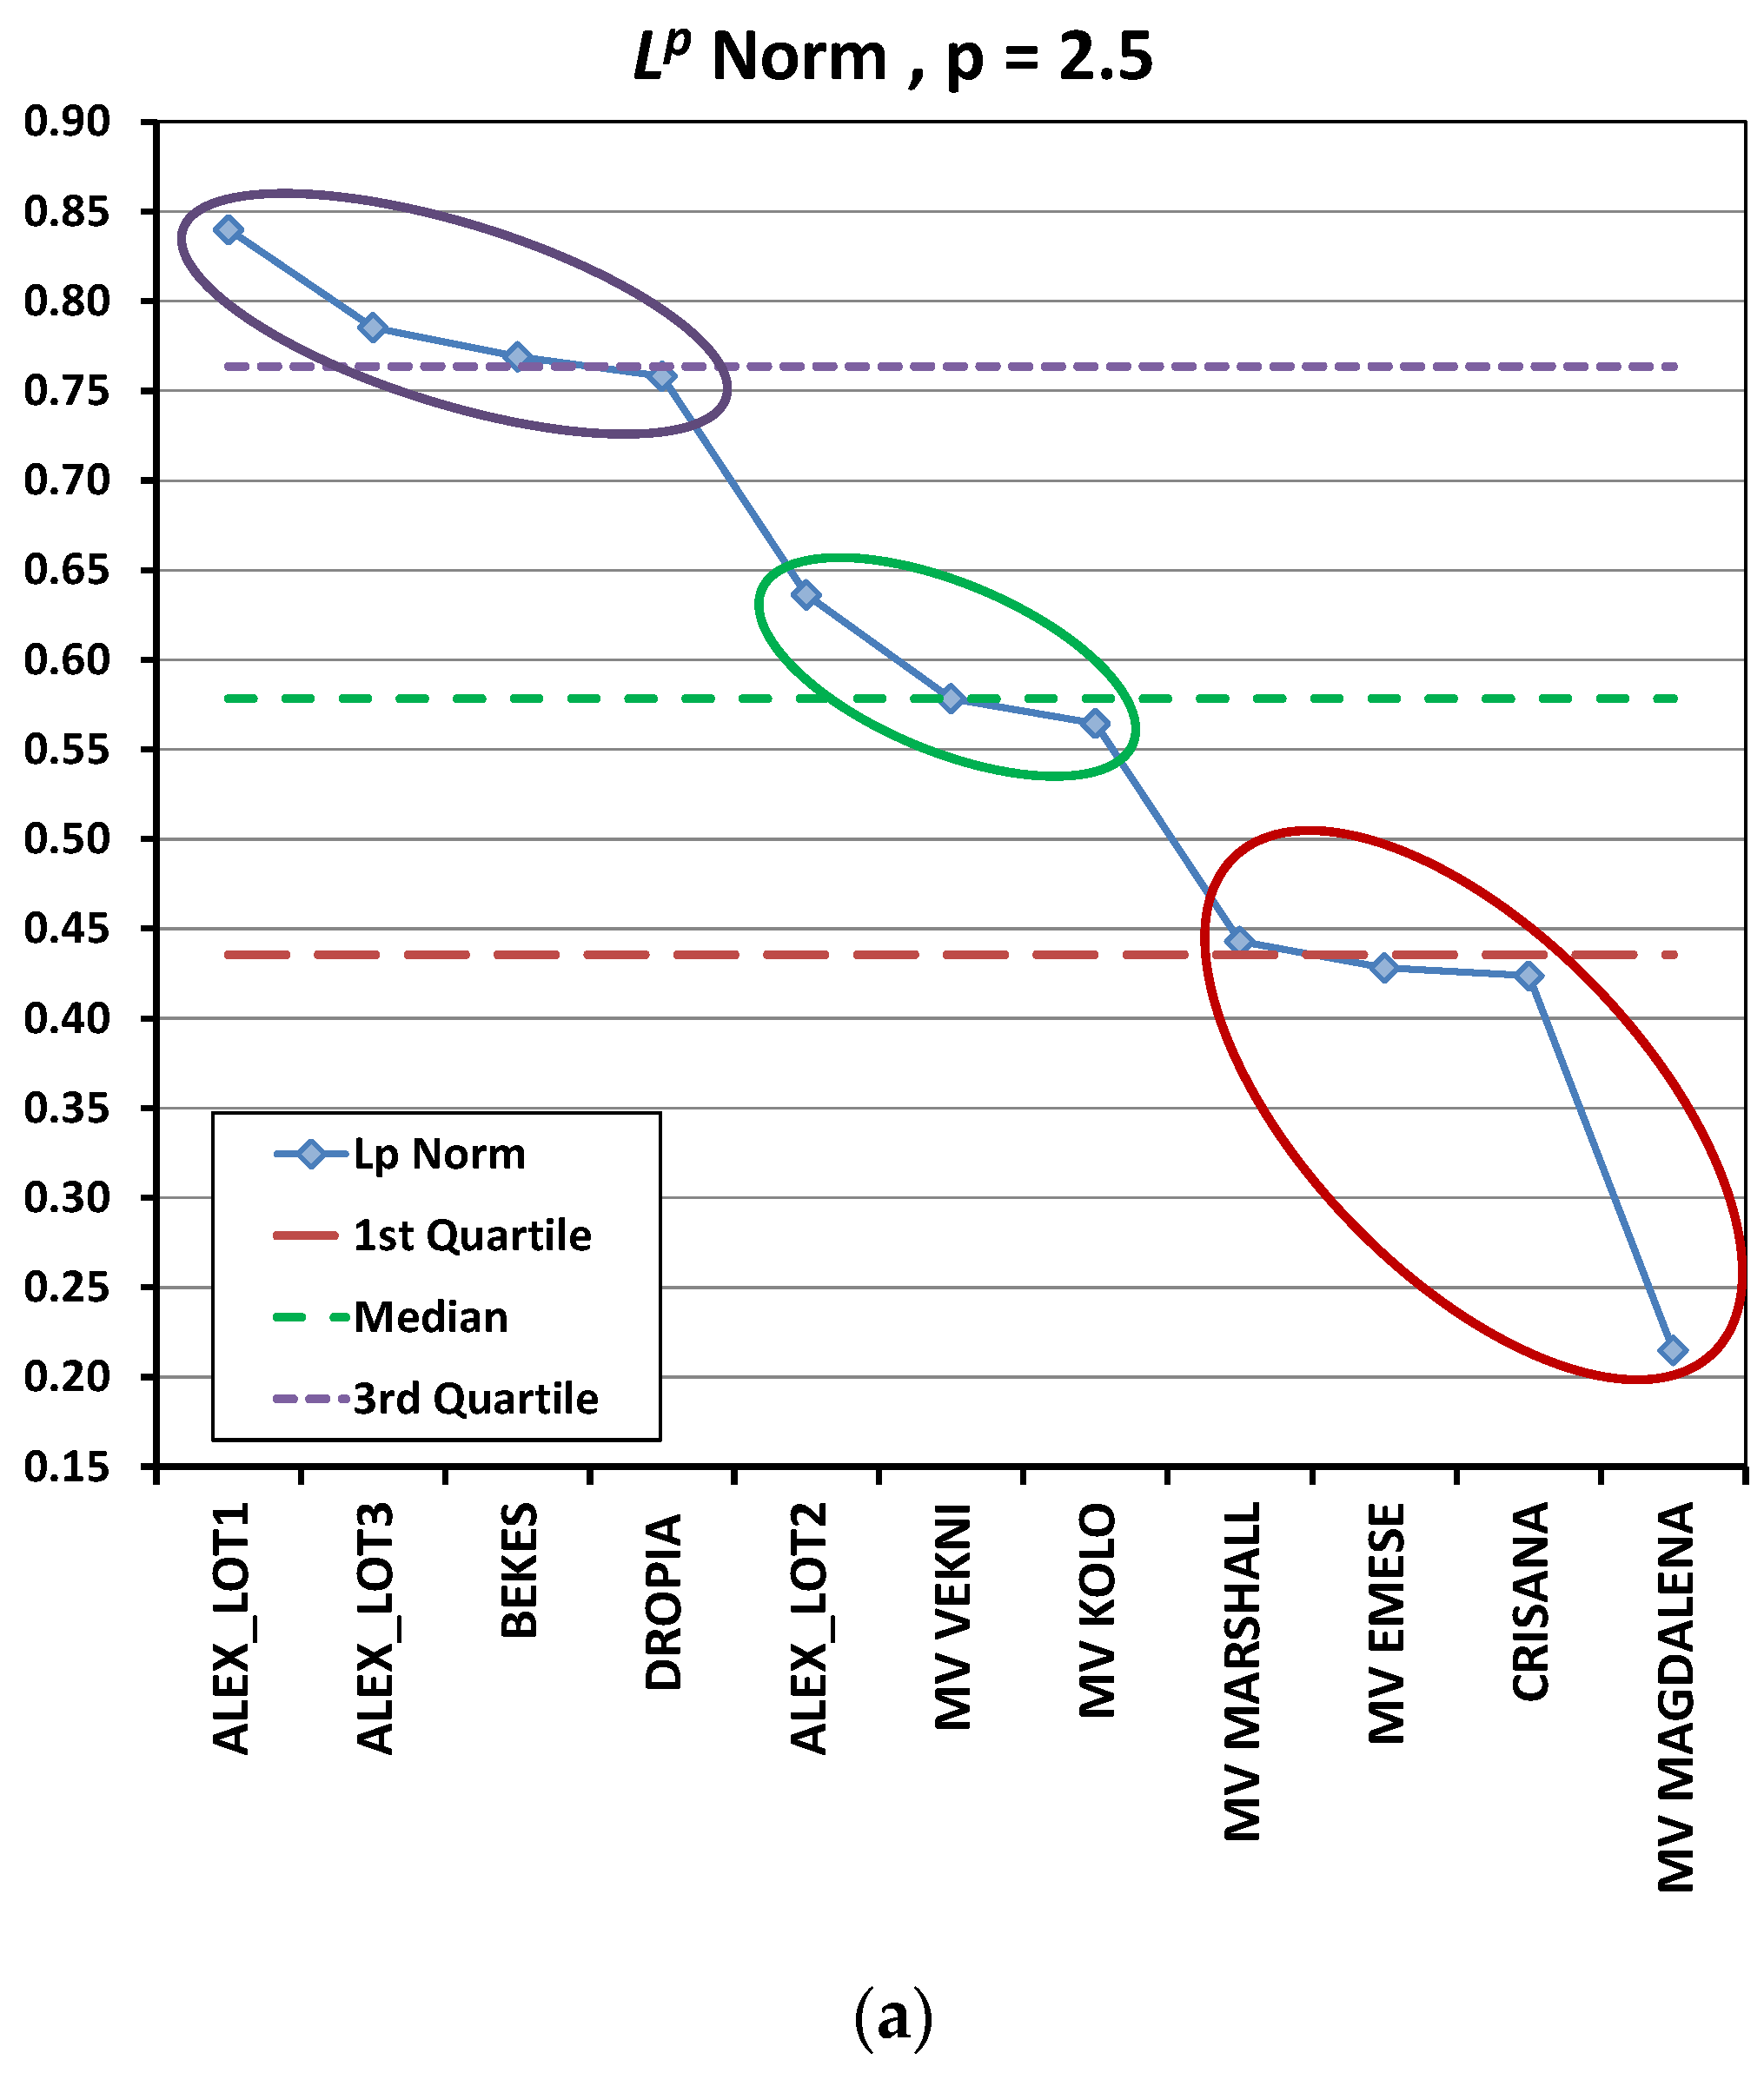
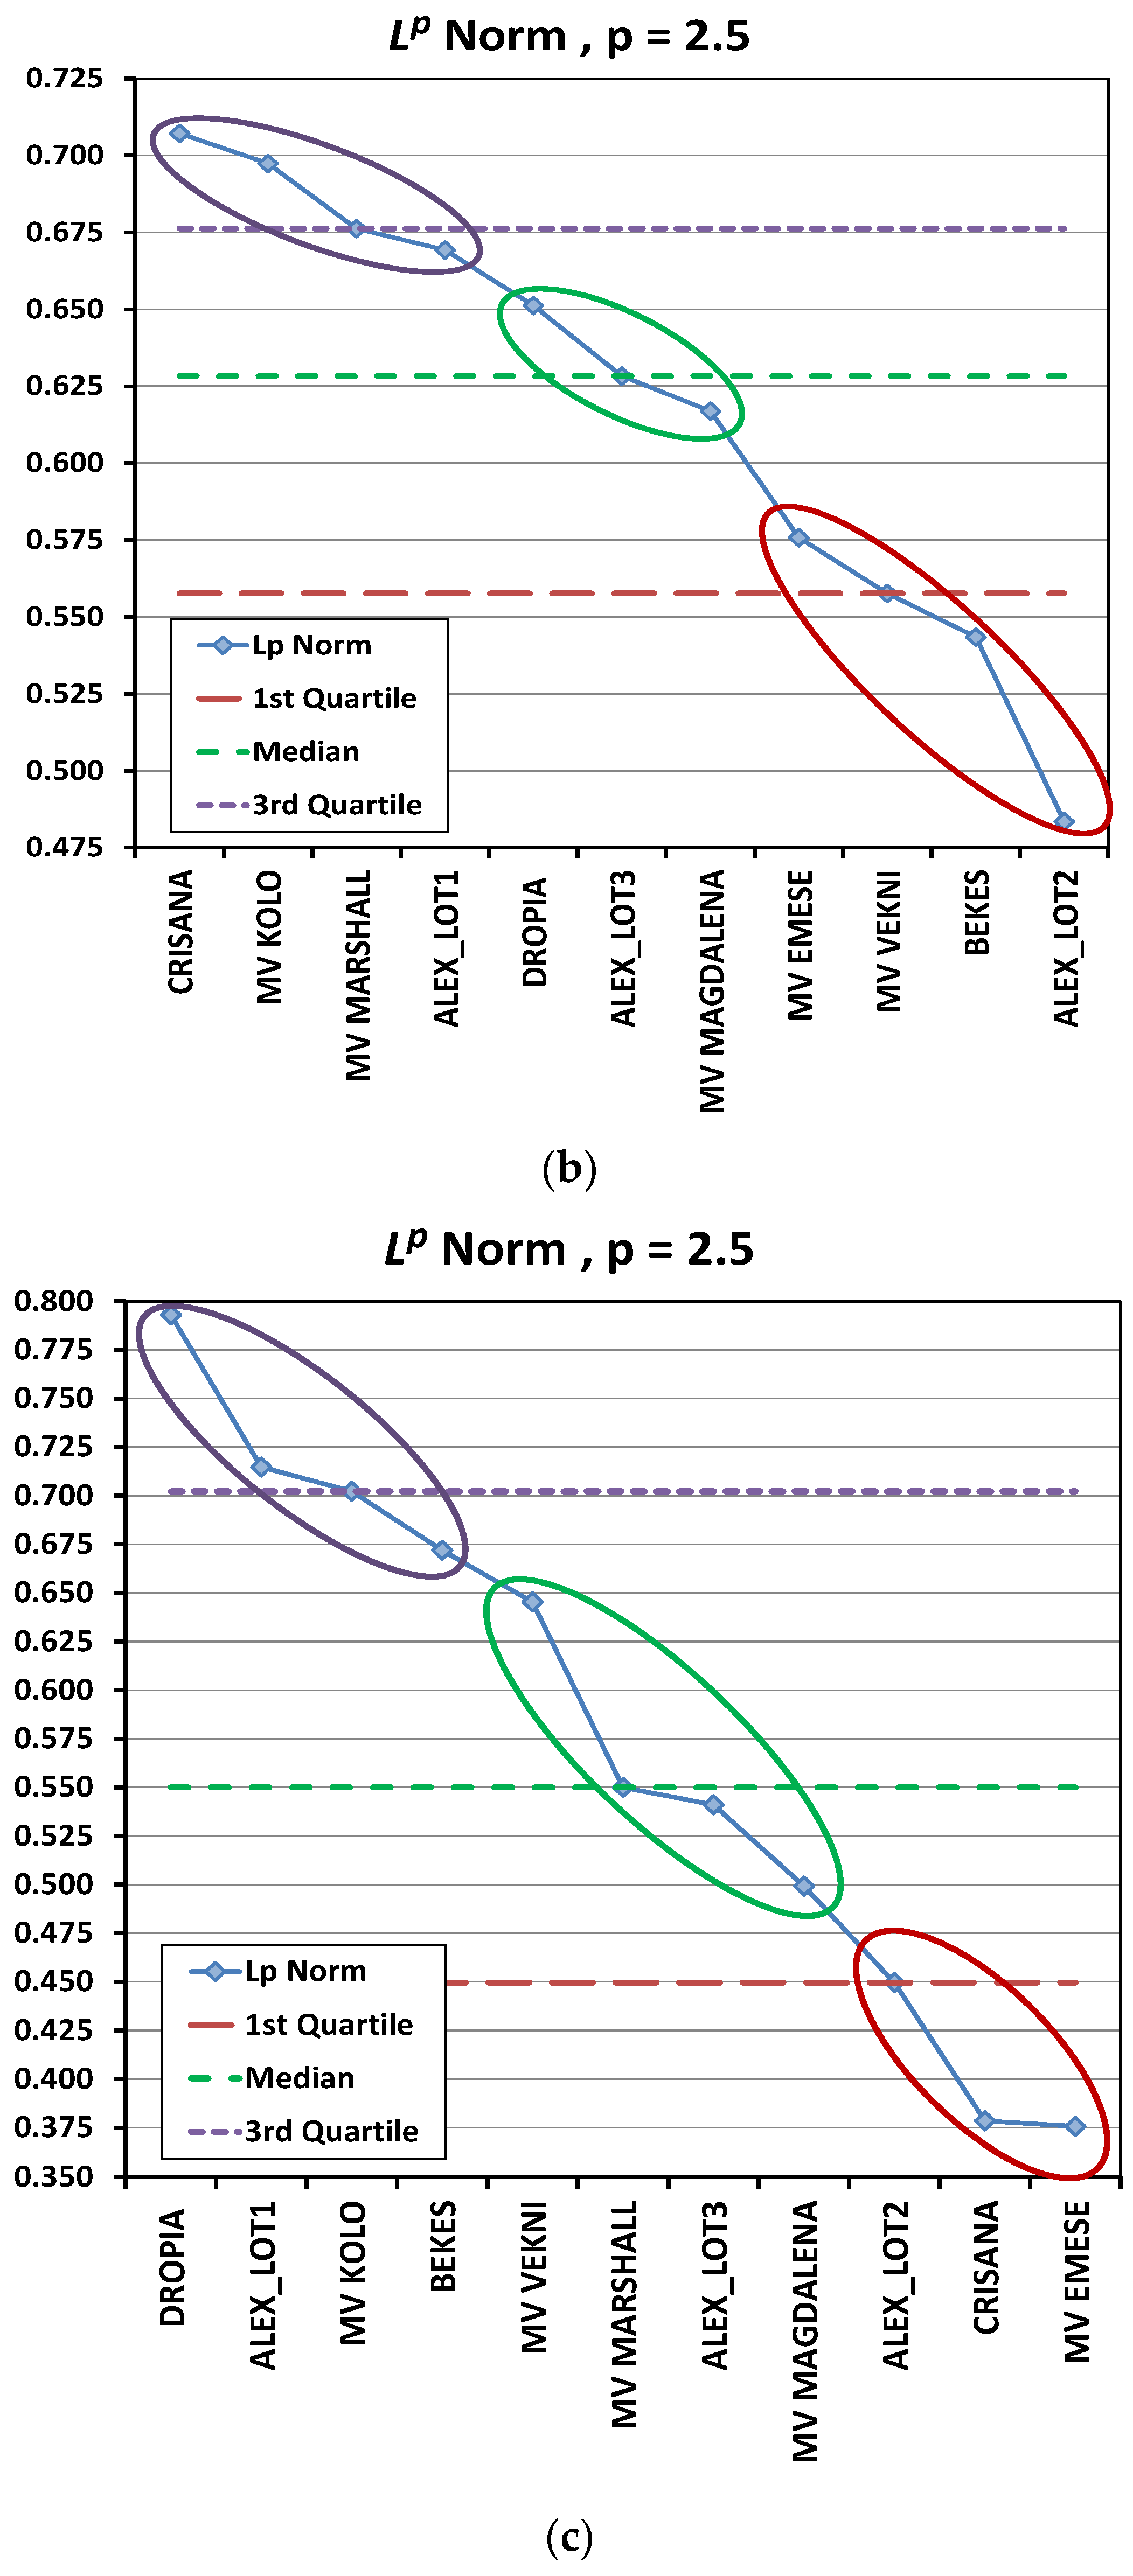
| Wheat | Lp Norm | Rank | Wheat | Lp Norm | Rank | Wheat | Lp Norm | Rank |
|---|---|---|---|---|---|---|---|---|
| Lots | (p = 2.5) | Lots | (p = 2.5) | Lots | (p = 2.5) | |||
| a * | b * | c * | ||||||
| ALEX_LOT1 | 0.840 | 1 | CRISANA | 0.707 | 1 | DROPIA | 0.793 | 1 |
| ALEX_LOT3 | 0.785 | 2 | MV KOLO | 0.697 | 2 | ALEX_LOT1 | 0.715 | 2 |
| BEKES | 0.769 | 3 | MV MARSHALL | 0.676 | 3 | MV KOLO | 0.702 | 3 |
| DROPIA | 0.758 | 4 | ALEX_LOT1 | 0.669 | 4 | BEKES | 0.672 | 4 |
| ALEX_LOT2 | 0.636 | 5 | DROPIA | 0.651 | 5 | MV VEKNI | 0.645 | 5 |
| MV VEKNI | 0.578 | 6 | ALEX_LOT3 | 0.628 | 6 | MV MARSHALL | 0.550 | 6 |
| MV KOLO | 0.564 | 7 | MV MAGDALENA | 0.617 | 7 | ALEX_LOT3 | 0.541 | 7 |
| MV MARSHALL | 0.443 | 8 | MV EMESE | 0.576 | 8 | MV MAGDALENA | 0.499 | 8 |
| MV EMESE | 0.428 | 9 | MV VEKNI | 0.558 | 9 | ALEX_LOT2 | 0.450 | 9 |
| CRISANA | 0.424 | 10 | BEKES | 0.543 | 10 | CRISANA | 0.378 | 10 |
| MV MAGDALENA | 0.215 | 11 | ALEX_LOT2 | 0.483 | 11 | MV EMESE | 0.376 | 11 |
| MANOVA p-Values | DROPIA | ALEX_LOT1 | ALEX_LOT2 | CRISANA | BEKES | MV_KOLO | MV_VEKNI | MV_MARSHALL | ALEX_LOT3 | MV_EMESE | MV_MAGDA |
|---|---|---|---|---|---|---|---|---|---|---|---|
| DROPIA | 0.0164 | 0.0002 | 0.0004 | 0.0001 | 0.0011 | 0.6116 | 0.0012 | 0.0175 | 0.0000 | 0.0005 | |
| ALEX_LOT1 | 0.0164 | 0.0004 | 0.0009 | 0.0002 | 0.0053 | 0.0173 | 0.0002 | 0.1666 | 0.0000 | 0.0003 | |
| ALEX_LOT2 | 0.0002 | 0.0004 | 0.0004 | 0.0000 | 0.0002 | 0.0001 | 0.0011 | 0.0010 | 0.0000 | 0.0007 | |
| CRISANA | 0.0004 | 0.0009 | 0.0004 | 0.0207 | 0.0781 | 0.0007 | 0.0002 | 0.0086 | 0.0024 | 0.1014 | |
| BEKES | 0.0001 | 0.0002 | 0.0000 | 0.0207 | 0.0342 | 0.0002 | 0.0000 | 0.0005 | 0.0908 | 0.0081 | |
| MV_KOLO | 0.0011 | 0.0053 | 0.0002 | 0.0781 | 0.0342 | 0.0025 | 0.0001 | 0.0379 | 0.0008 | 0.0454 | |
| MV_VEKNI | 0.6116 | 0.0173 | 0.0001 | 0.0007 | 0.0002 | 0.0025 | 0.0007 | 0.0060 | 0.0000 | 0.0006 | |
| MV_MARSHALL | 0.0012 | 0.0002 | 0.0011 | 0.0002 | 0.0000 | 0.0001 | 0.0007 | 0.0002 | 0.0000 | 0.0005 | |
| ALEX_LOT3 | 0.0175 | 0.1666 | 0.0010 | 0.0086 | 0.0005 | 0.0379 | 0.0060 | 0.0002 | 0.0000 | 0.0022 | |
| MV_EMESE | 0.0000 | 0.0000 | 0.0000 | 0.0024 | 0.0908 | 0.0008 | 0.0000 | 0.0000 | 0.0000 | 0.0021 | |
| MV_MAGDA | 0.0005 | 0.0003 | 0.0007 | 0.1014 | 0.0081 | 0.0454 | 0.0006 | 0.0005 | 0.0022 | 0.0021 |
Disclaimer/Publisher’s Note: The statements, opinions and data contained in all publications are solely those of the individual author(s) and contributor(s) and not of MDPI and/or the editor(s). MDPI and/or the editor(s) disclaim responsibility for any injury to people or property resulting from any ideas, methods, instructions or products referred to in the content. |
© 2023 by the authors. Licensee MDPI, Basel, Switzerland. This article is an open access article distributed under the terms and conditions of the Creative Commons Attribution (CC BY) license (https://creativecommons.org/licenses/by/4.0/).
Share and Cite
Timar, A.V.; Teusdea, A.C.; Purcarea, C.; Vuscan, A.N.; Memete, A.R.; Vicas, S.I. Chemometric Analysis-Based Sustainable Use of Different Current Baking Wheat Lots from Romania and Hungary. Sustainability 2023, 15, 12756. https://doi.org/10.3390/su151712756
Timar AV, Teusdea AC, Purcarea C, Vuscan AN, Memete AR, Vicas SI. Chemometric Analysis-Based Sustainable Use of Different Current Baking Wheat Lots from Romania and Hungary. Sustainability. 2023; 15(17):12756. https://doi.org/10.3390/su151712756
Chicago/Turabian StyleTimar, Adrian Vasile, Alin Cristian Teusdea, Cornelia Purcarea, Adrian Nicolae Vuscan, Adriana Ramona Memete, and Simona Ioana Vicas. 2023. "Chemometric Analysis-Based Sustainable Use of Different Current Baking Wheat Lots from Romania and Hungary" Sustainability 15, no. 17: 12756. https://doi.org/10.3390/su151712756
APA StyleTimar, A. V., Teusdea, A. C., Purcarea, C., Vuscan, A. N., Memete, A. R., & Vicas, S. I. (2023). Chemometric Analysis-Based Sustainable Use of Different Current Baking Wheat Lots from Romania and Hungary. Sustainability, 15(17), 12756. https://doi.org/10.3390/su151712756