


A Conflict-Based Safety Diagnosis of SCI Roundabouts Using a Surrogate Safety Measure Model


 ,
,  ,
,  and
and 
Abstract
:1. Introduction
2. Literature Review
- (i)
- Trajectories obtained from UAV footage and image processing
- (ii)
- Trajectories obtained from simulation software such as VISSIM and AIMSUN

| Study (Year) | Roundabout Type | Trajectory Method Investigation | Performance Analysis | Indicators |
|---|---|---|---|---|
| Shawky et al., 2022 [4] | Conventional roundabout | UAV | SSAM | PET |
| Leonardi and Distefano 2023 [12] | Conventional roundabout and turbo-roundabout | Aimsun | SSAM | TTC, PET, DR, MaxS |
| Giuffrè et al., 2019 [17] | Single-roundabout Double-lane roundabout and turbo-roundabout | VISSIM and Aimsun | SSAM | TTC, PET, MaxS, |
| Bahmankhah et al., 2022 [18] | Conventional Roundabout | VISSIM | SSAM | TTC, PET, DR, MaxS, DeltaS |
| Karwand et al., 2023 [19] | Conventional Roundabout | VISSIM | SSAM | PET, TTC, Max DST, Max S |
| Vasconcelos, et al., 2014 [20] | Single-lane roundabout double-lane roundabout turbo- roundabout | Aimsun | SSAM | TTC, PET, DeltaS (Relative Speed) |
| Gallelli et al., 2021 [21] | Conventional roundabout and turbo- roundabout | VISSIM | SSAM | TTC, PET, DR, MaxS, DeltaS |
| Giuffrè et al., 2017 [27] | Double-lane roundabout Turbo-roundabout Flower roundabout Target roundabout | VISSIM | SSAM | TTC, PET |
| Tesoriere et al., 2021 [28] | Unconventional elliptical and turbo-roundabout | VISSIM | SSAM | TTC, PET |
| Giuffrè et al., 2018 [29] | Single-roundabout Double-lane roundabout and turbo-roundabout | VISSIM and Aimsun | SSAM | TTC, PET |
| Liu et al., 2020 [30] | Rotor design developed for a five-leg roundabout | VISSIM | SSAM | MaxΔV, TTC |
| Gallelli et al., 2019 [31] | Conventional Roundabout | VISSIM | SSAM | TTC |
| Virdi et al., 2019 [32] | Conventional Roundabout | VISSIM | SSAM | TTC |
| Ghanim et al., 2020 [33] | Signalized roundabout | VISSIM | SSAM | TTC, PET |
| Morando et al., 2018 [34] | Conventional Roundabout | VISSIM | SSAM | TTC, PET |
| Al-Ghandour et al., 2011 [35] | Single-lane roundabout | VISSIM | SSAM | TTC |
| Bulla-Cruz et al., 2020 [36] | Conventional Roundabout | VISSIM | SSAM | TTC, PET |
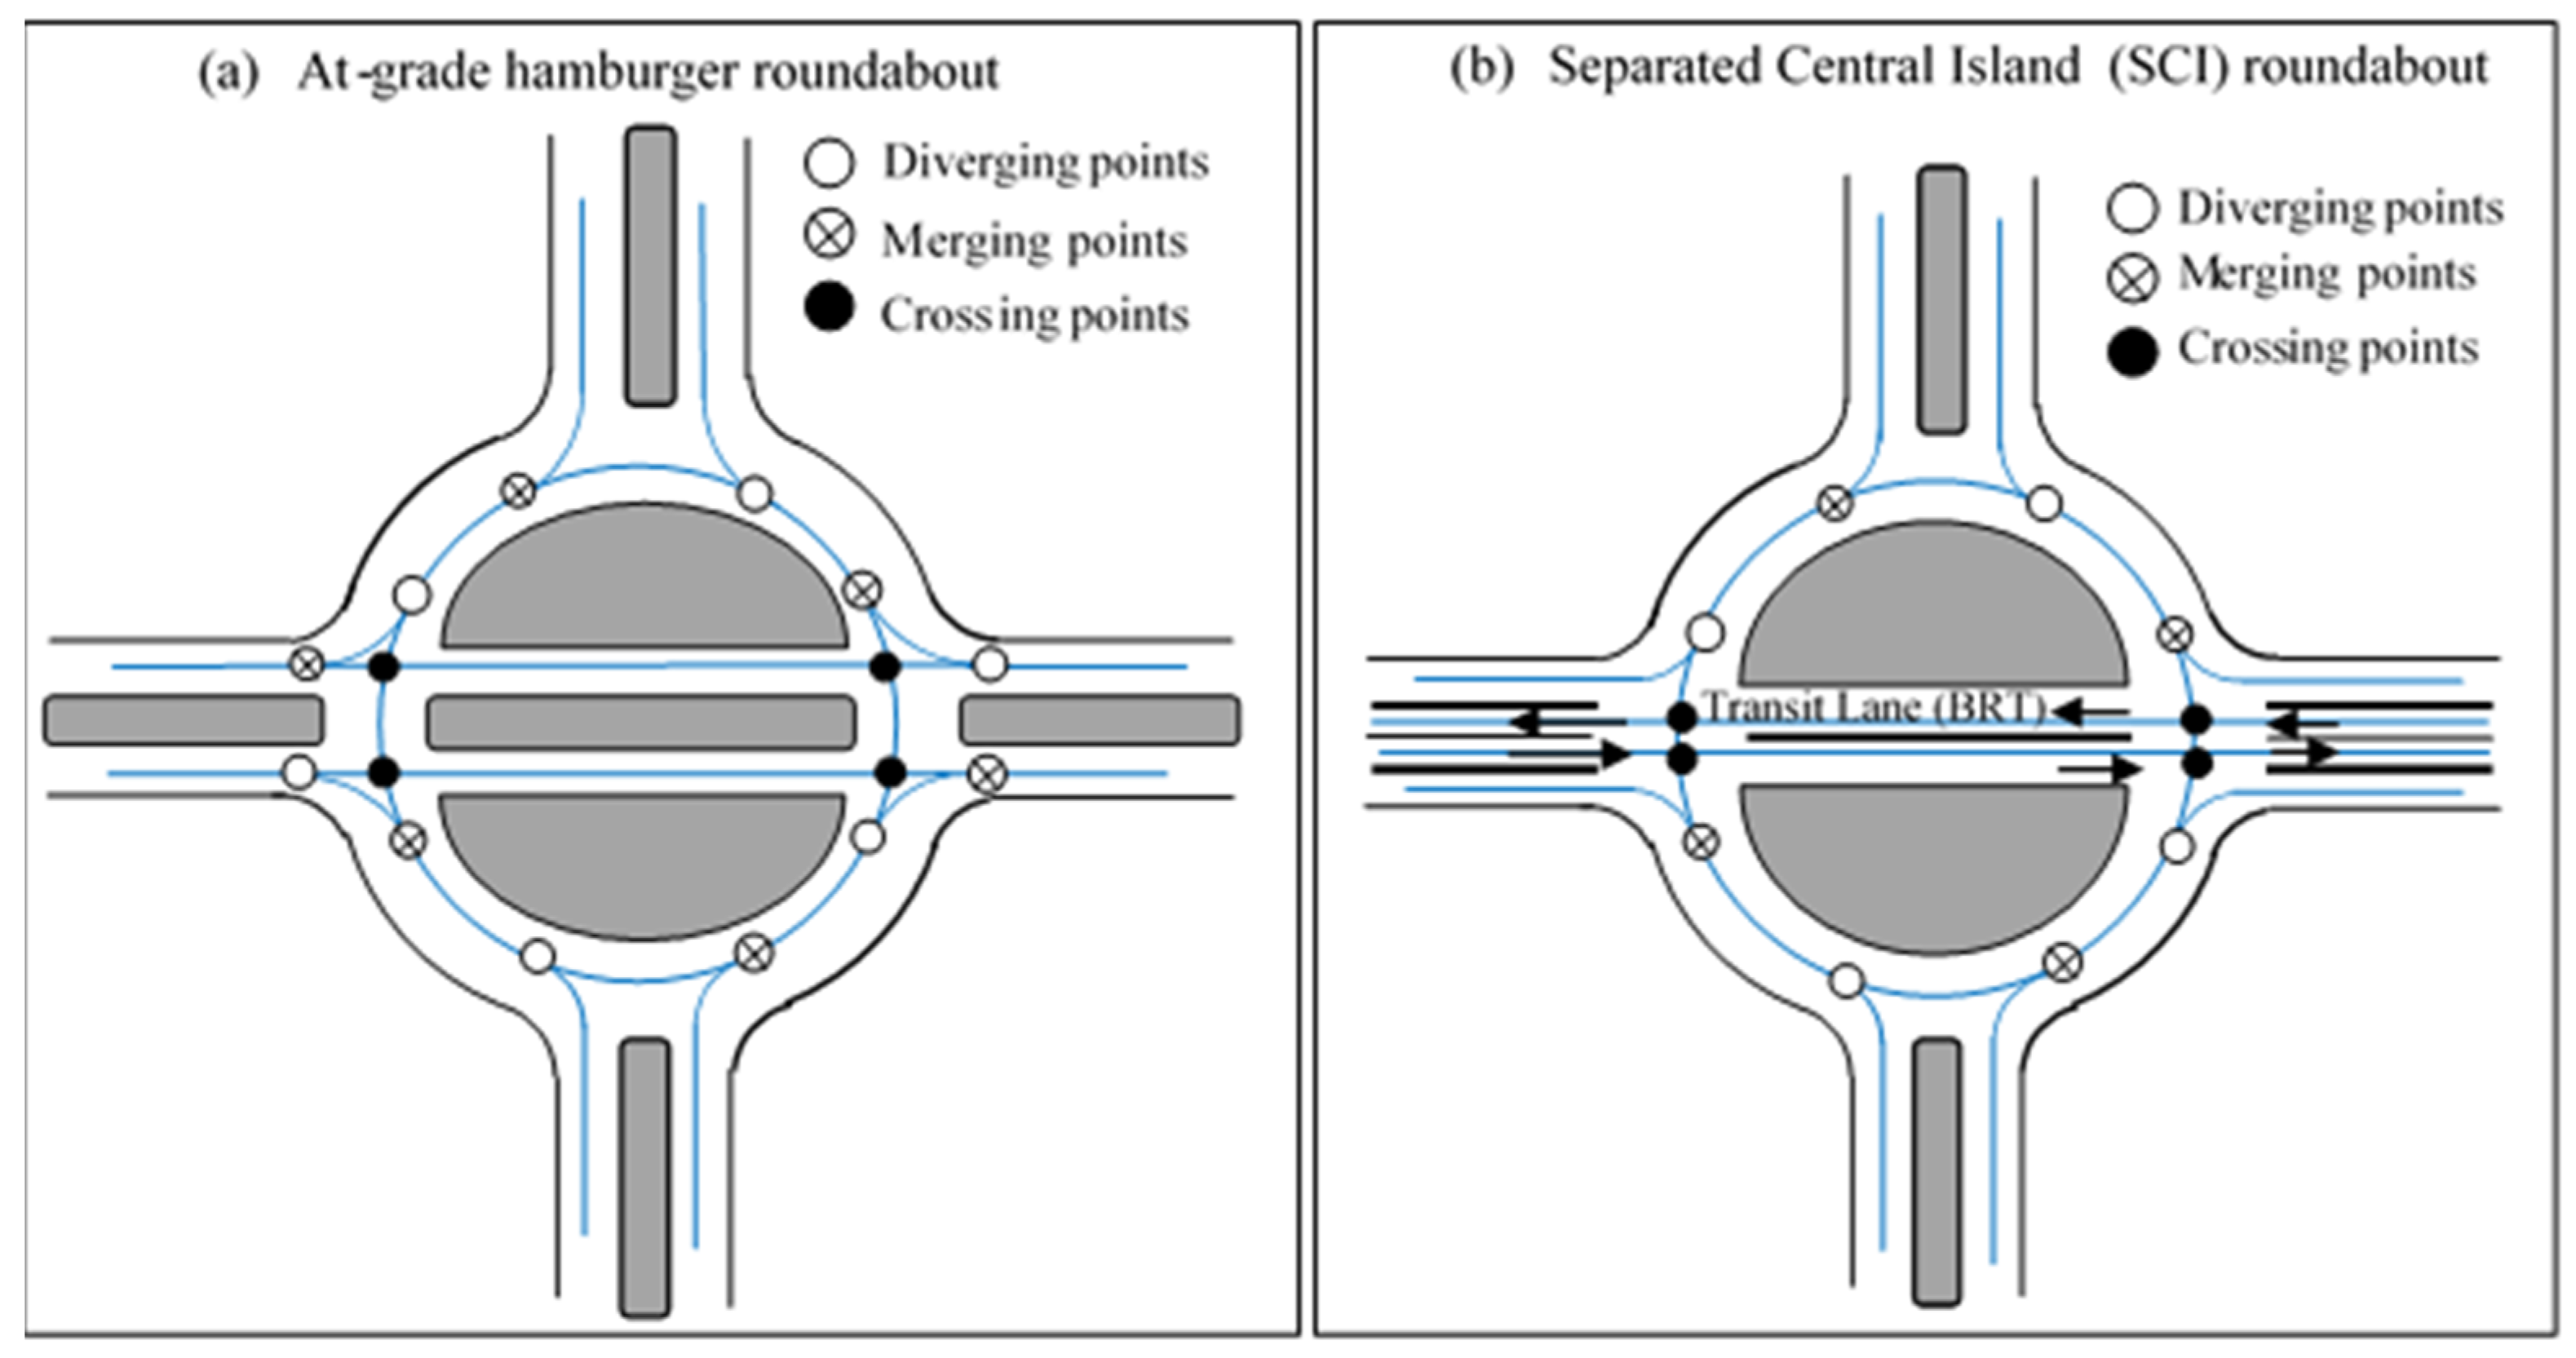
| Current study | Separated Central Island (SCI) roundabout | UAV | SSAM | TTC, MaxS, MaxΔV |
3. Materials and Methods
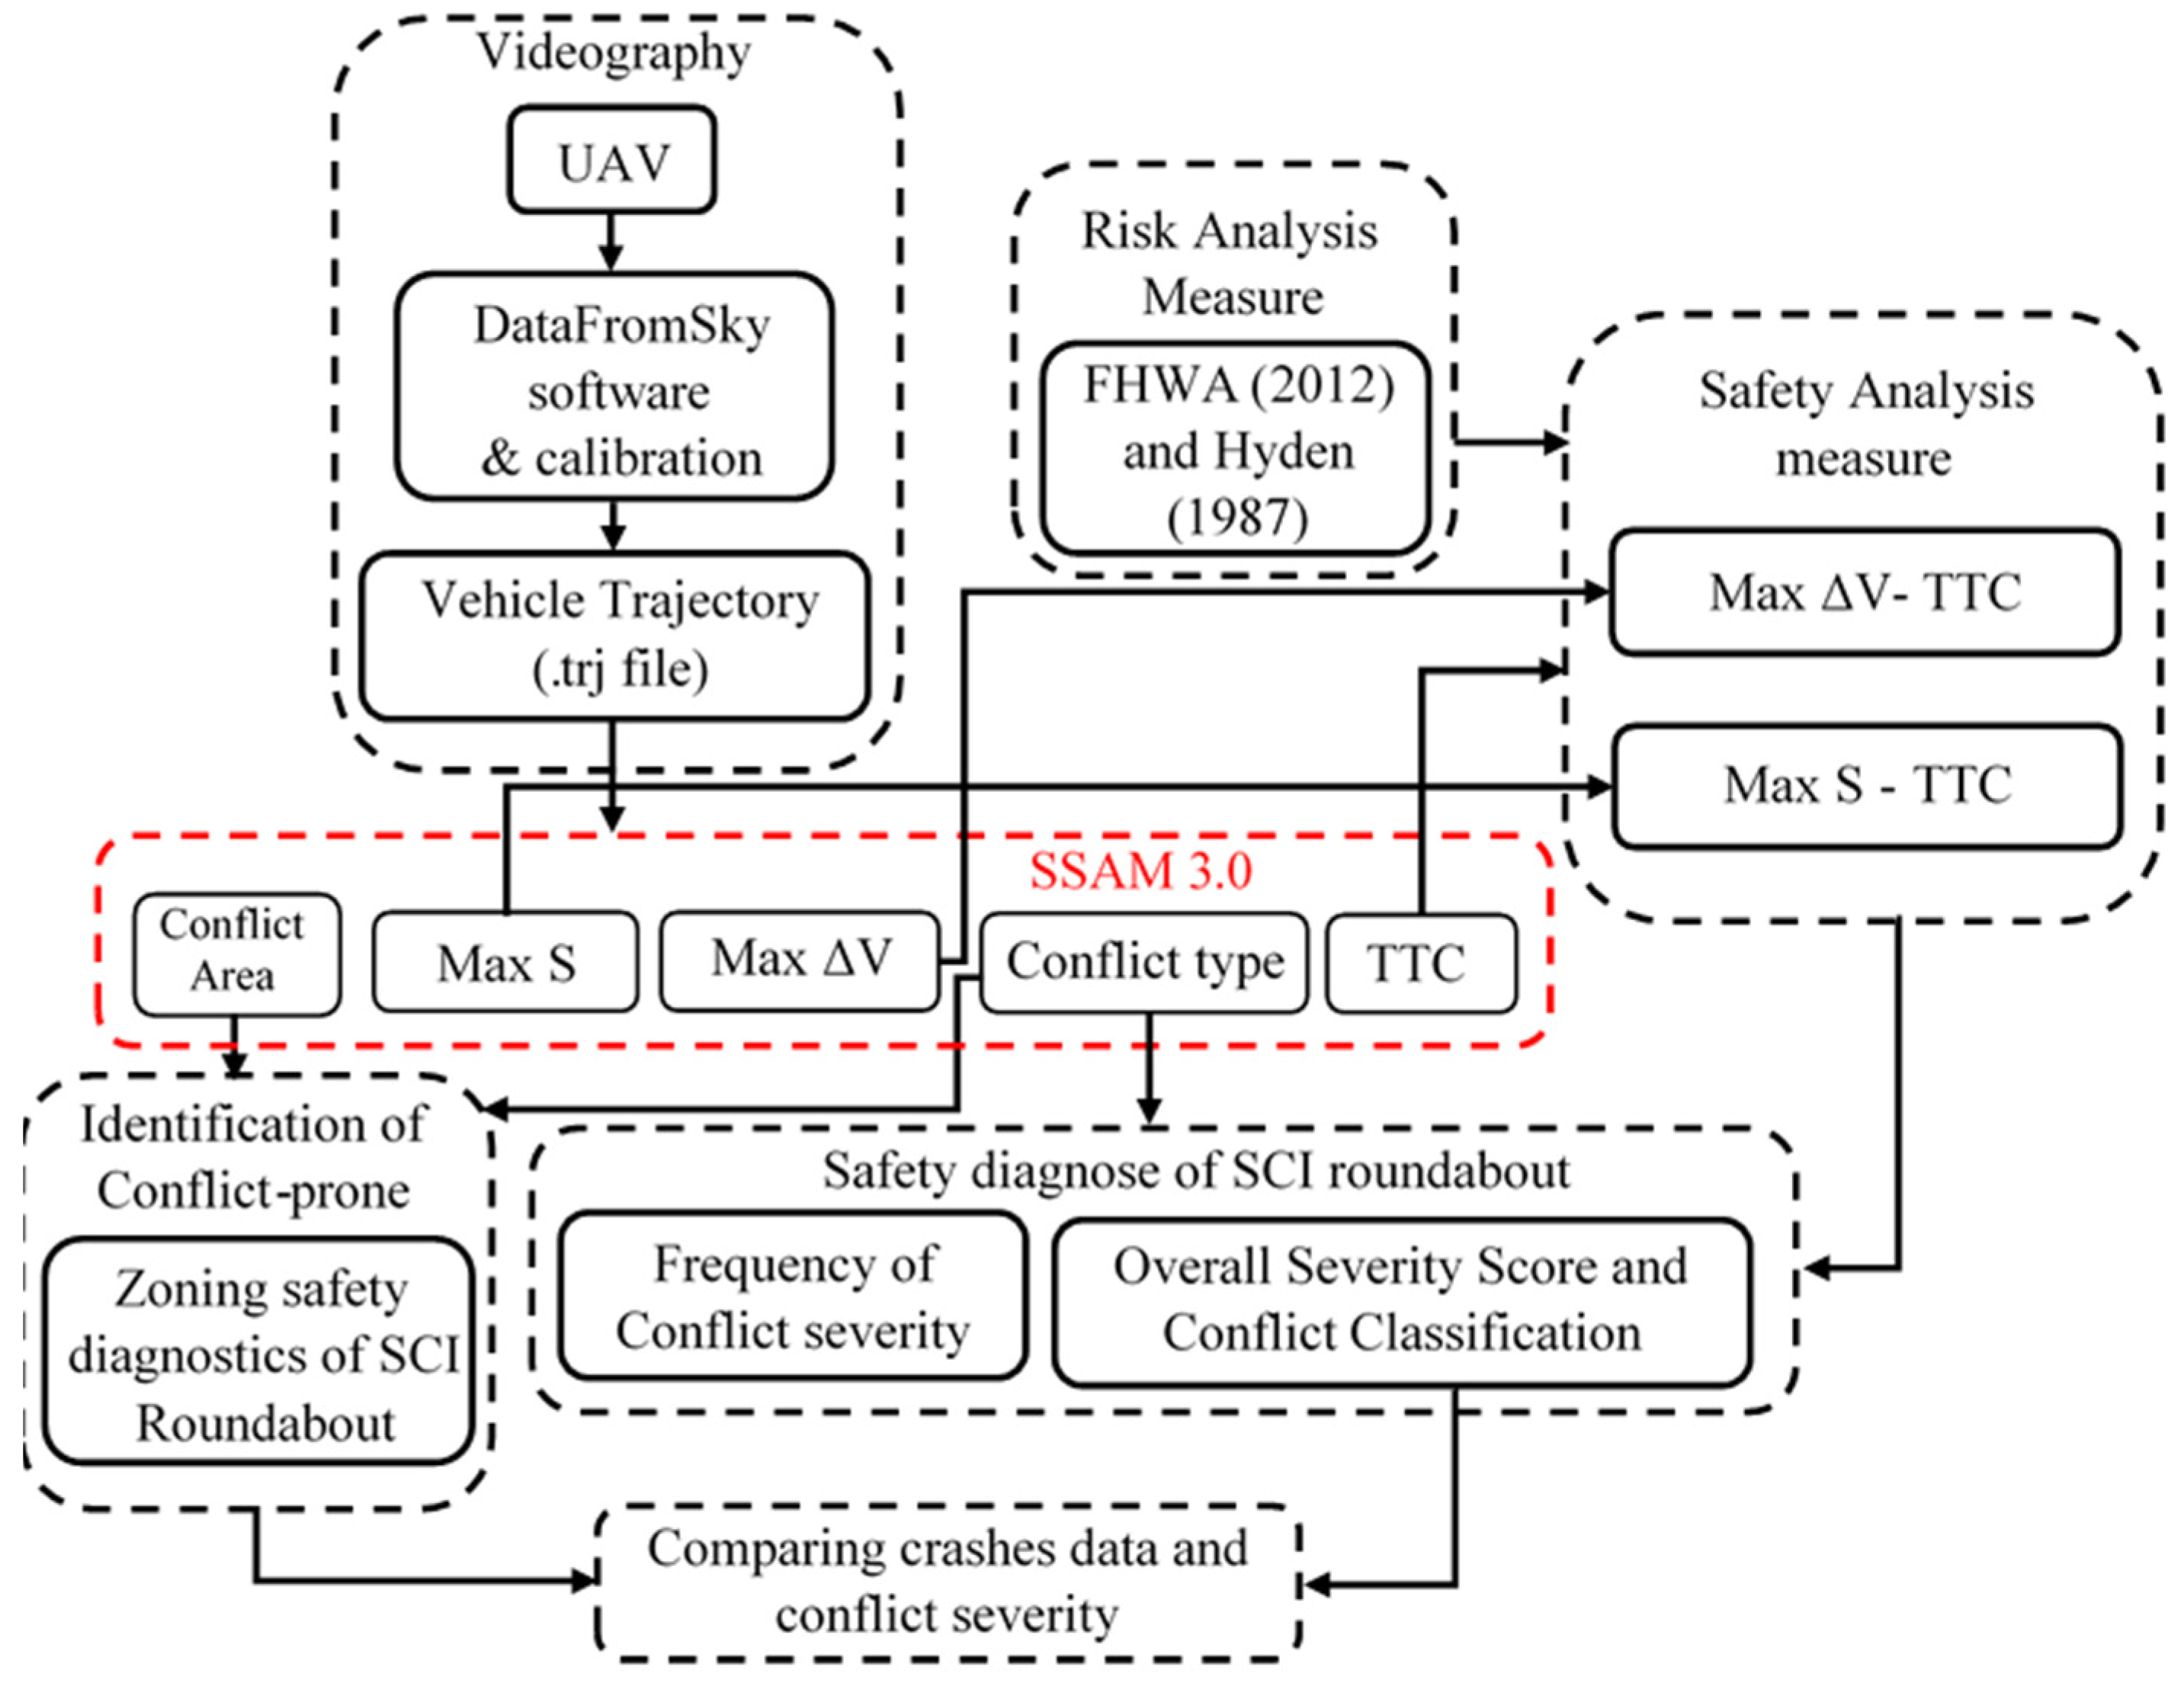
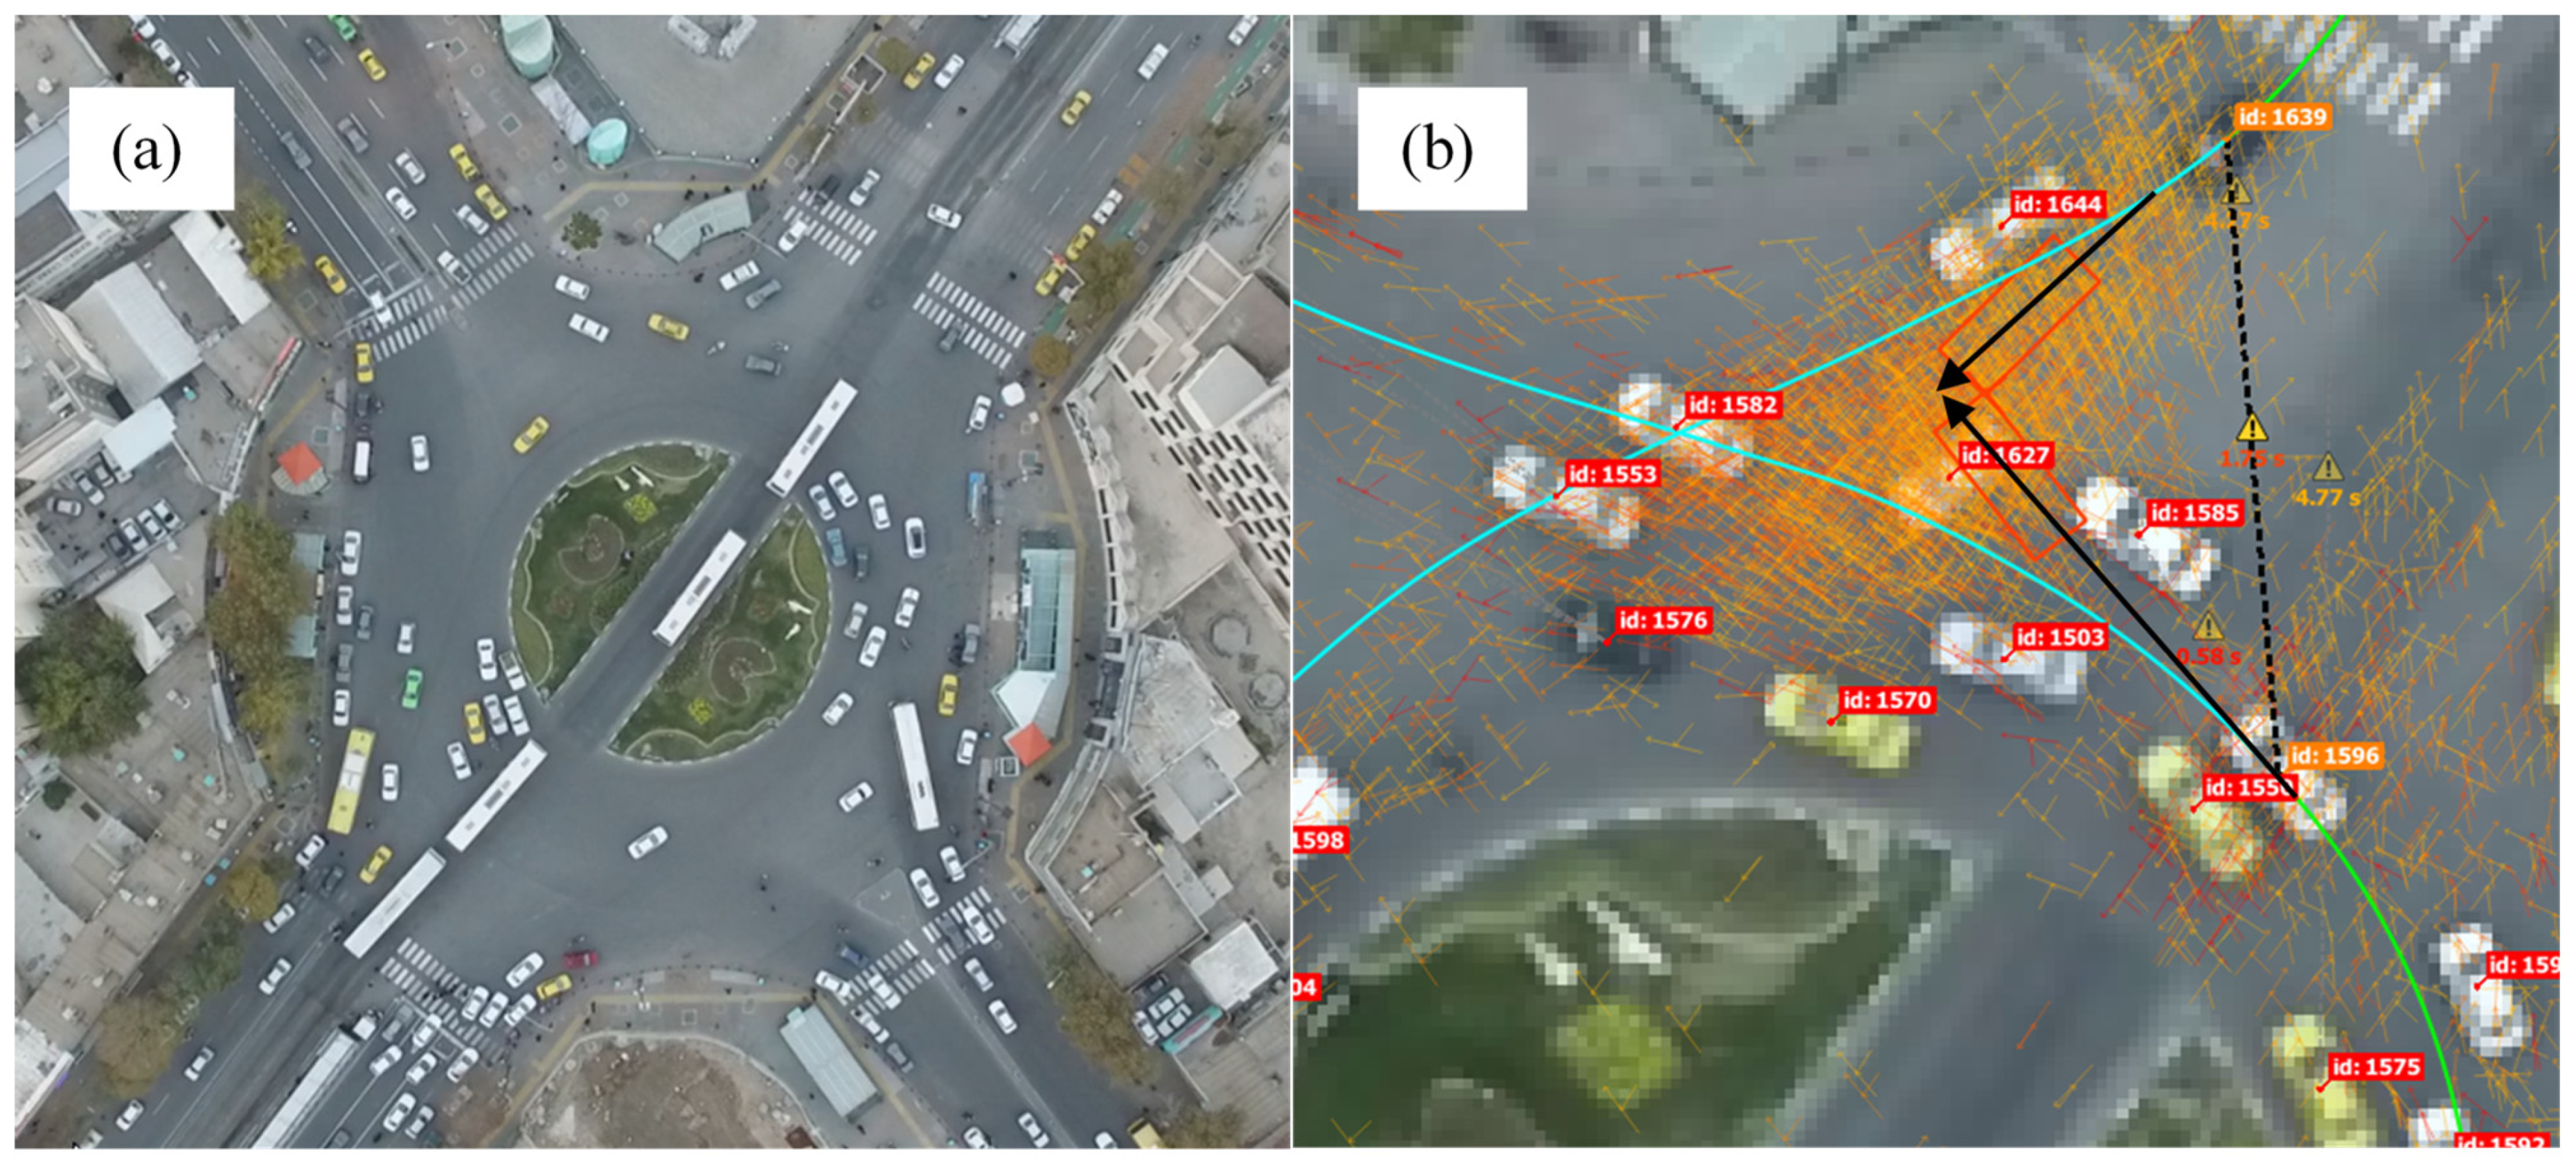
3.1. Field Study of SCI Roundabout by UAV
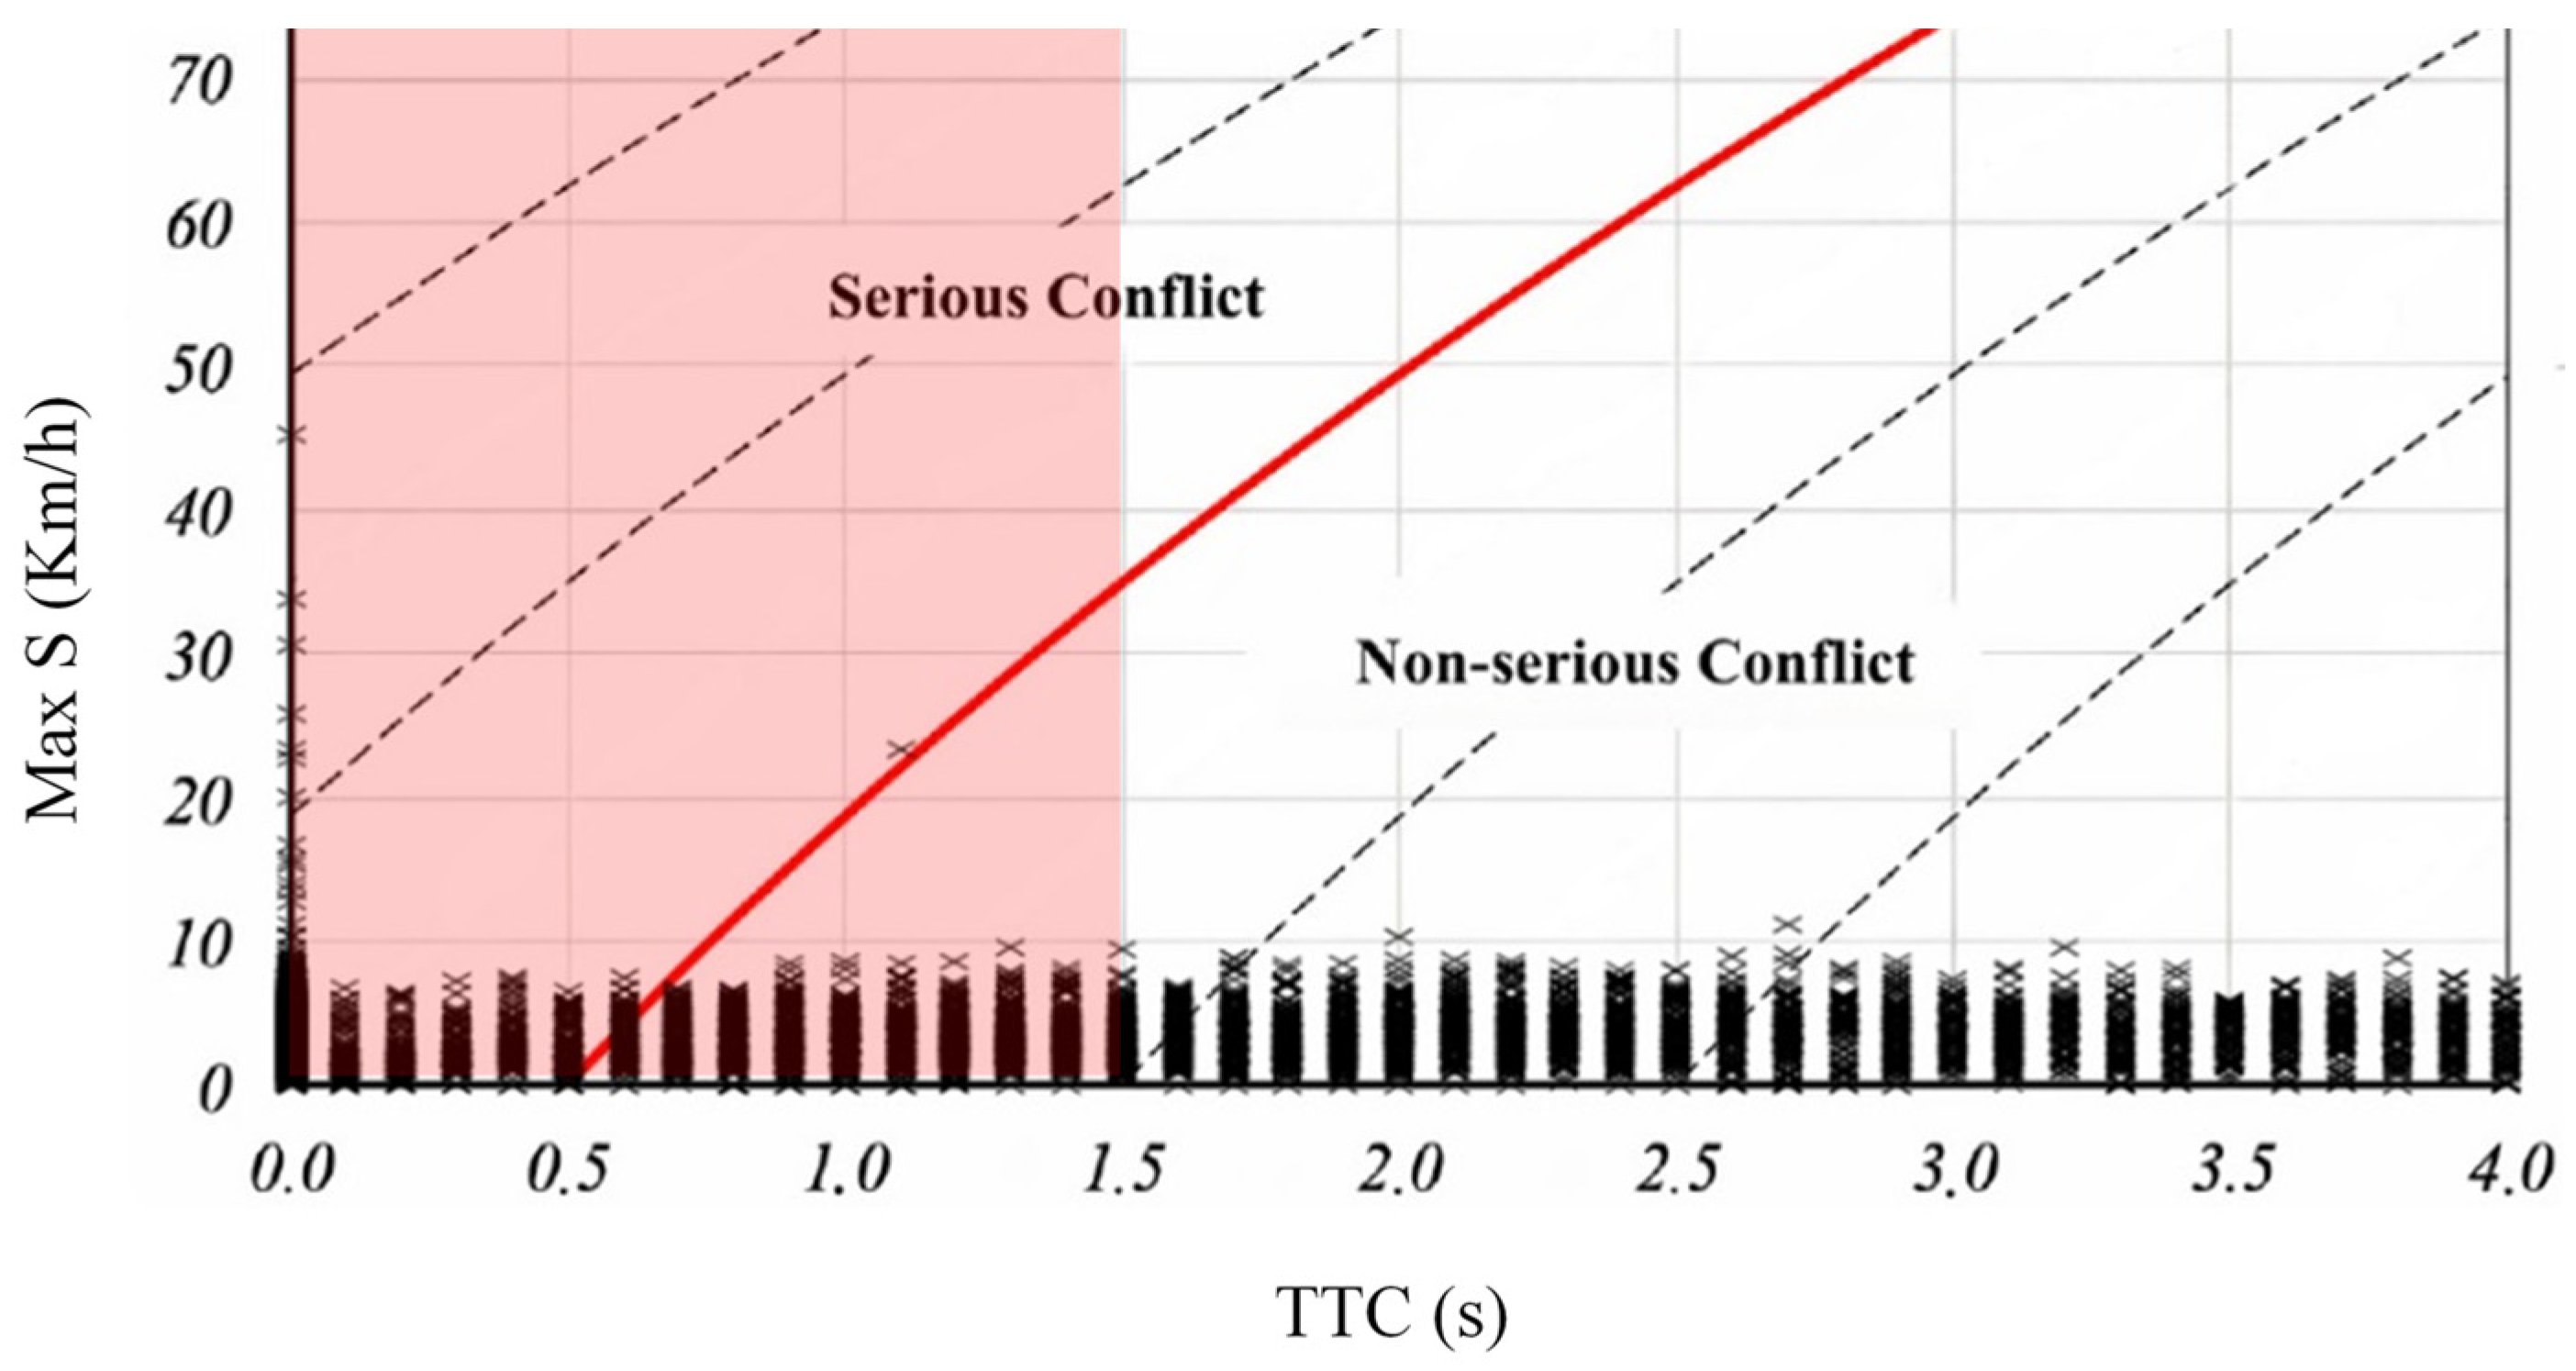
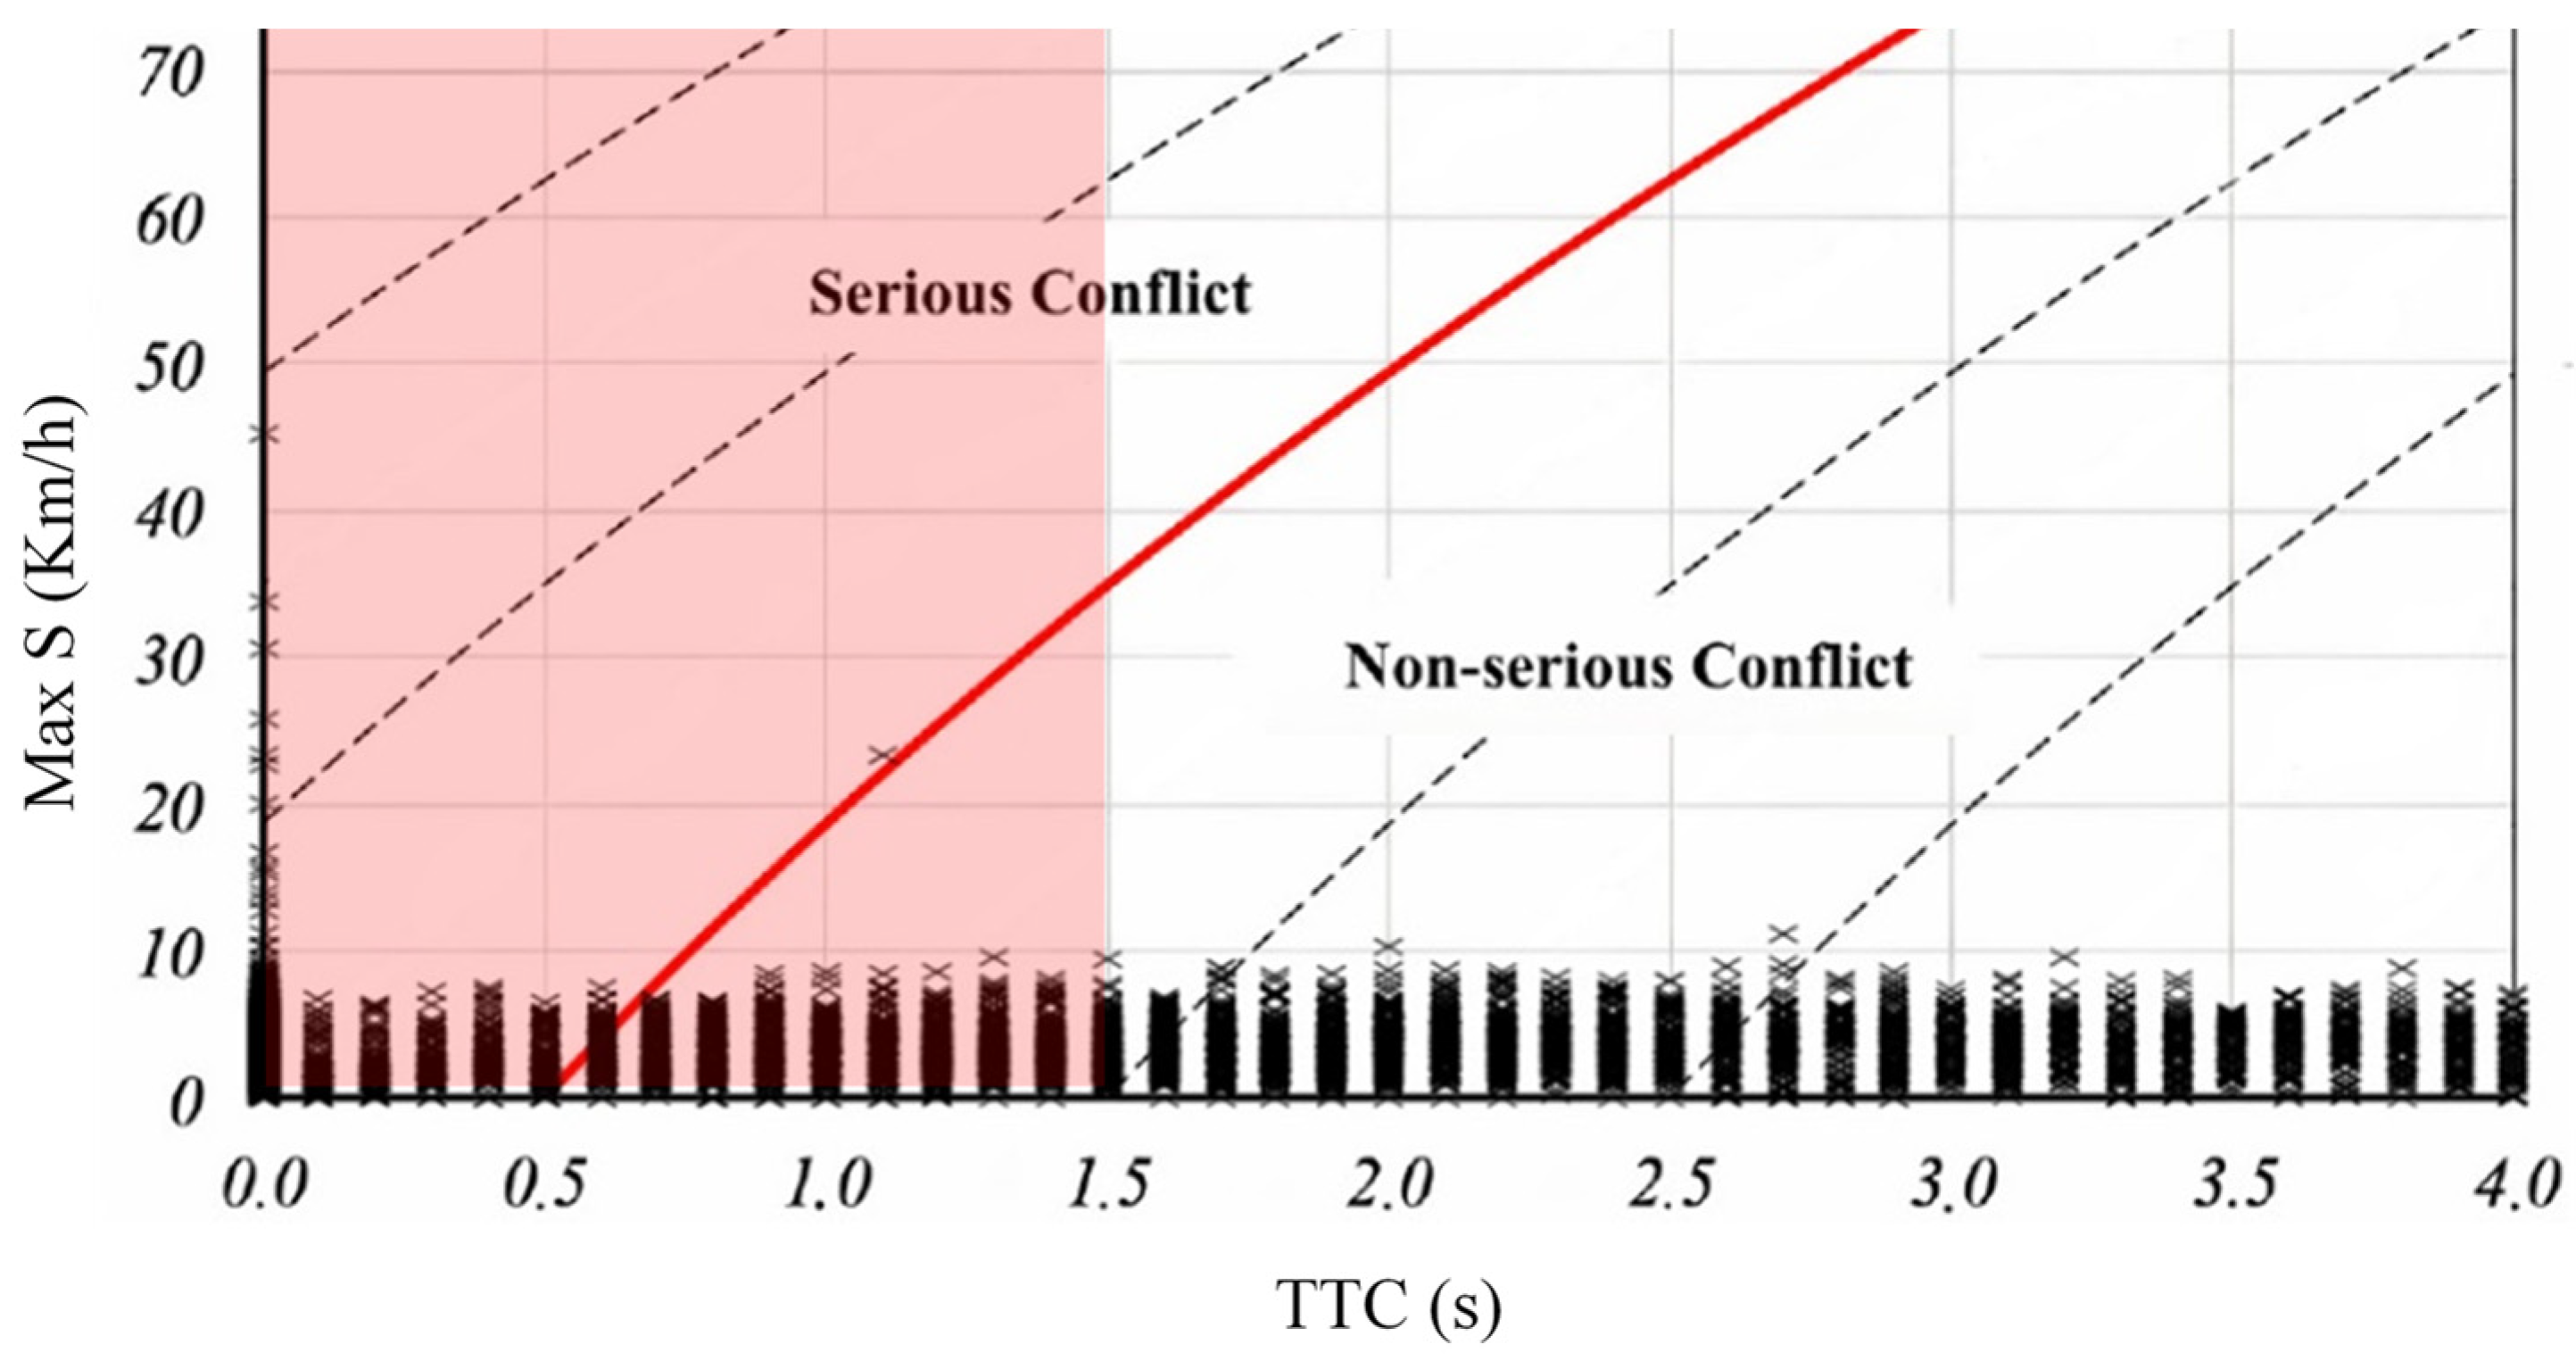
3.2. Safety Analysis Measure
4. Analysis
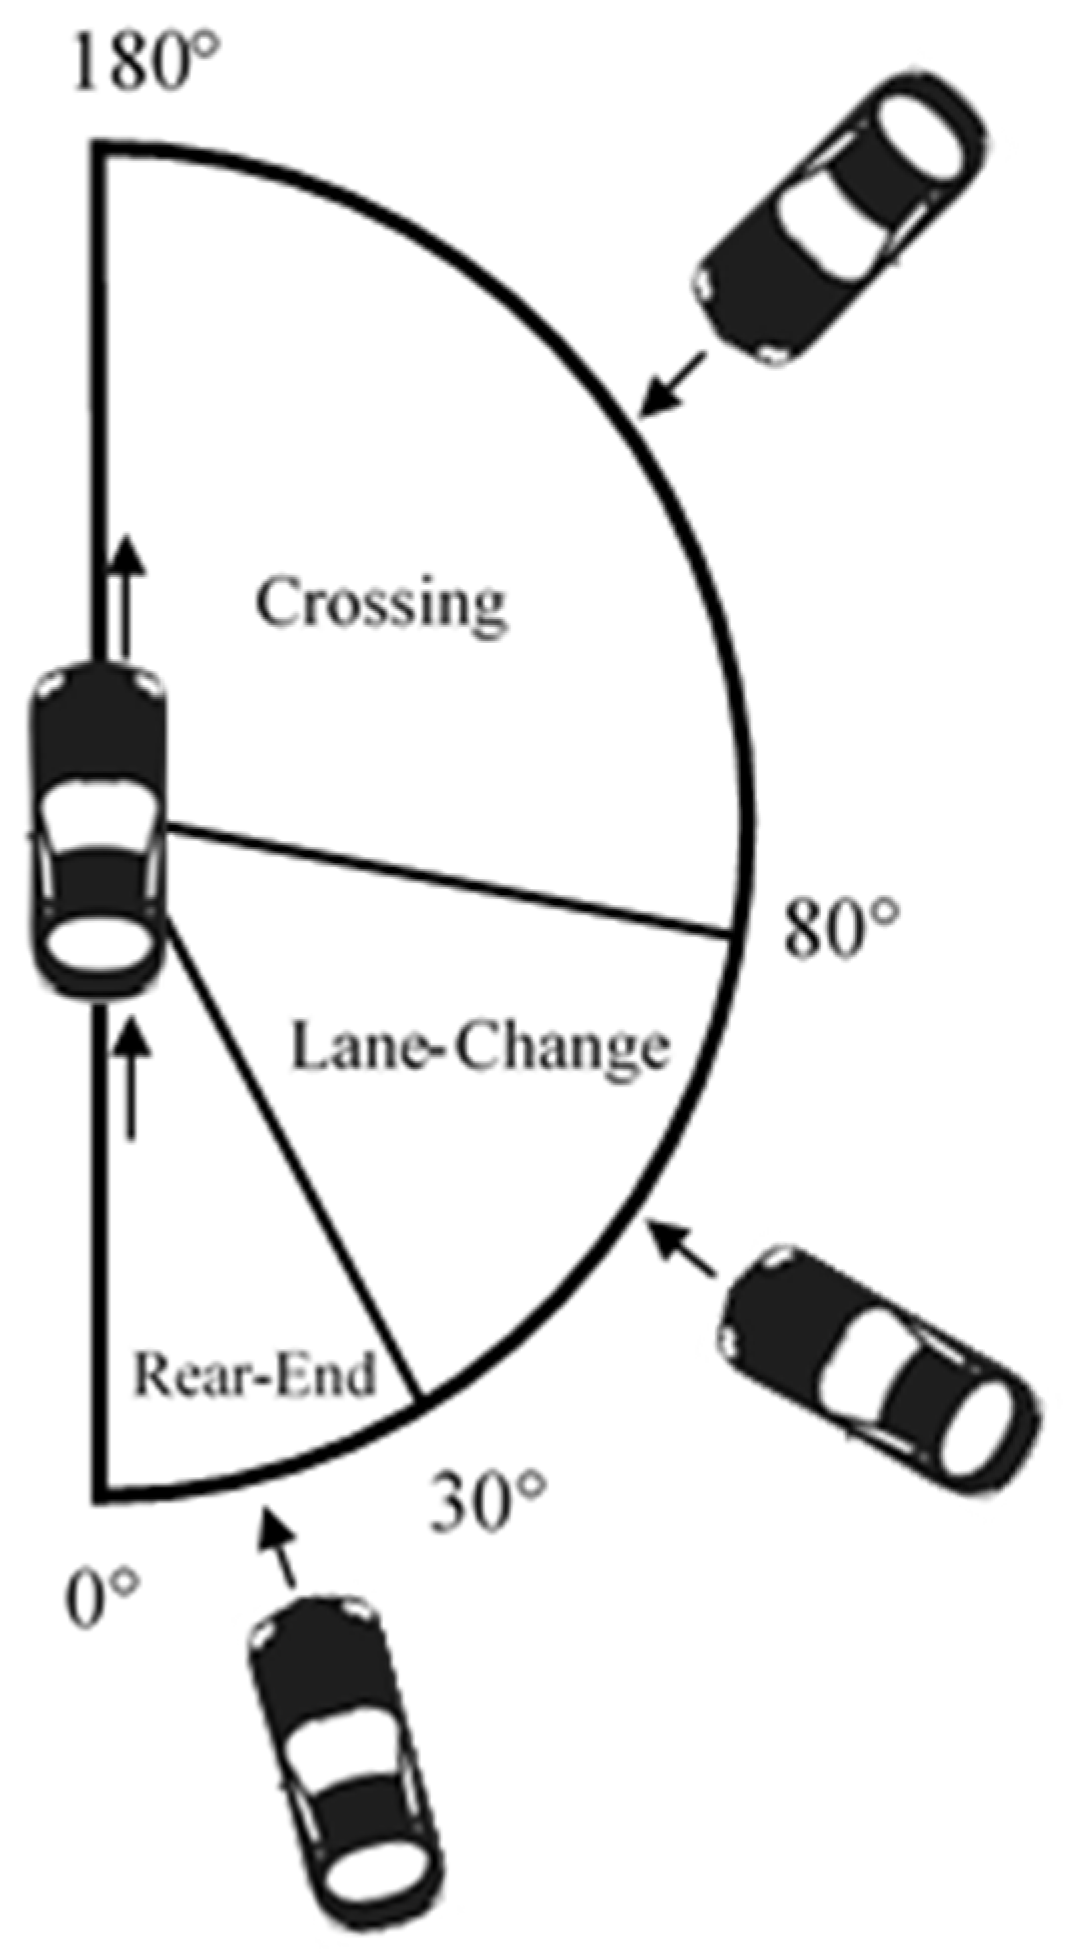
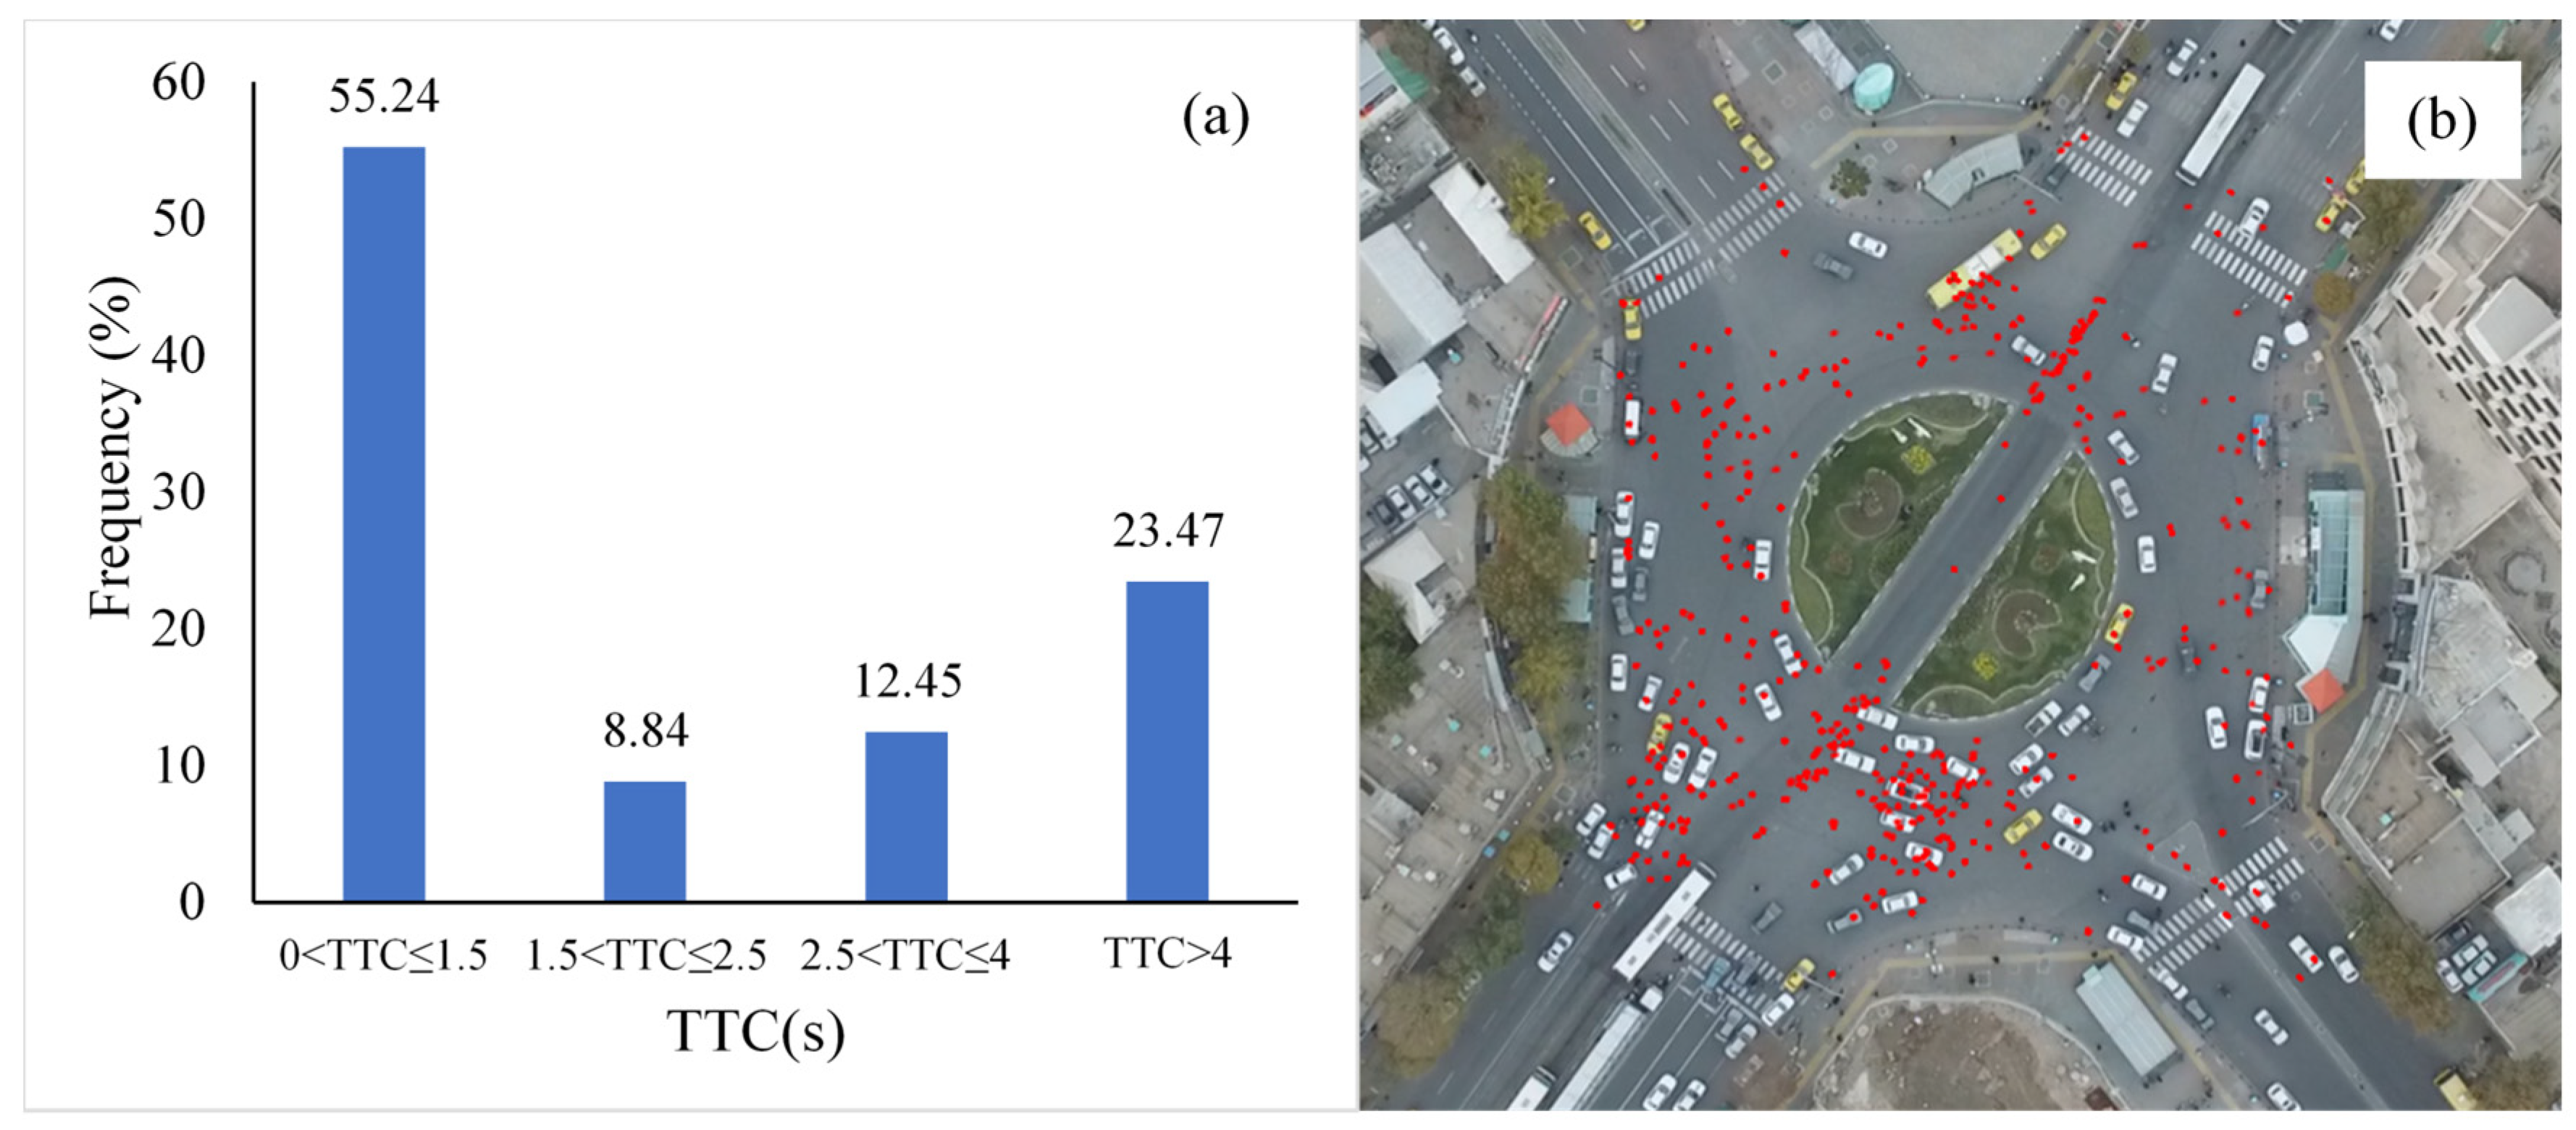
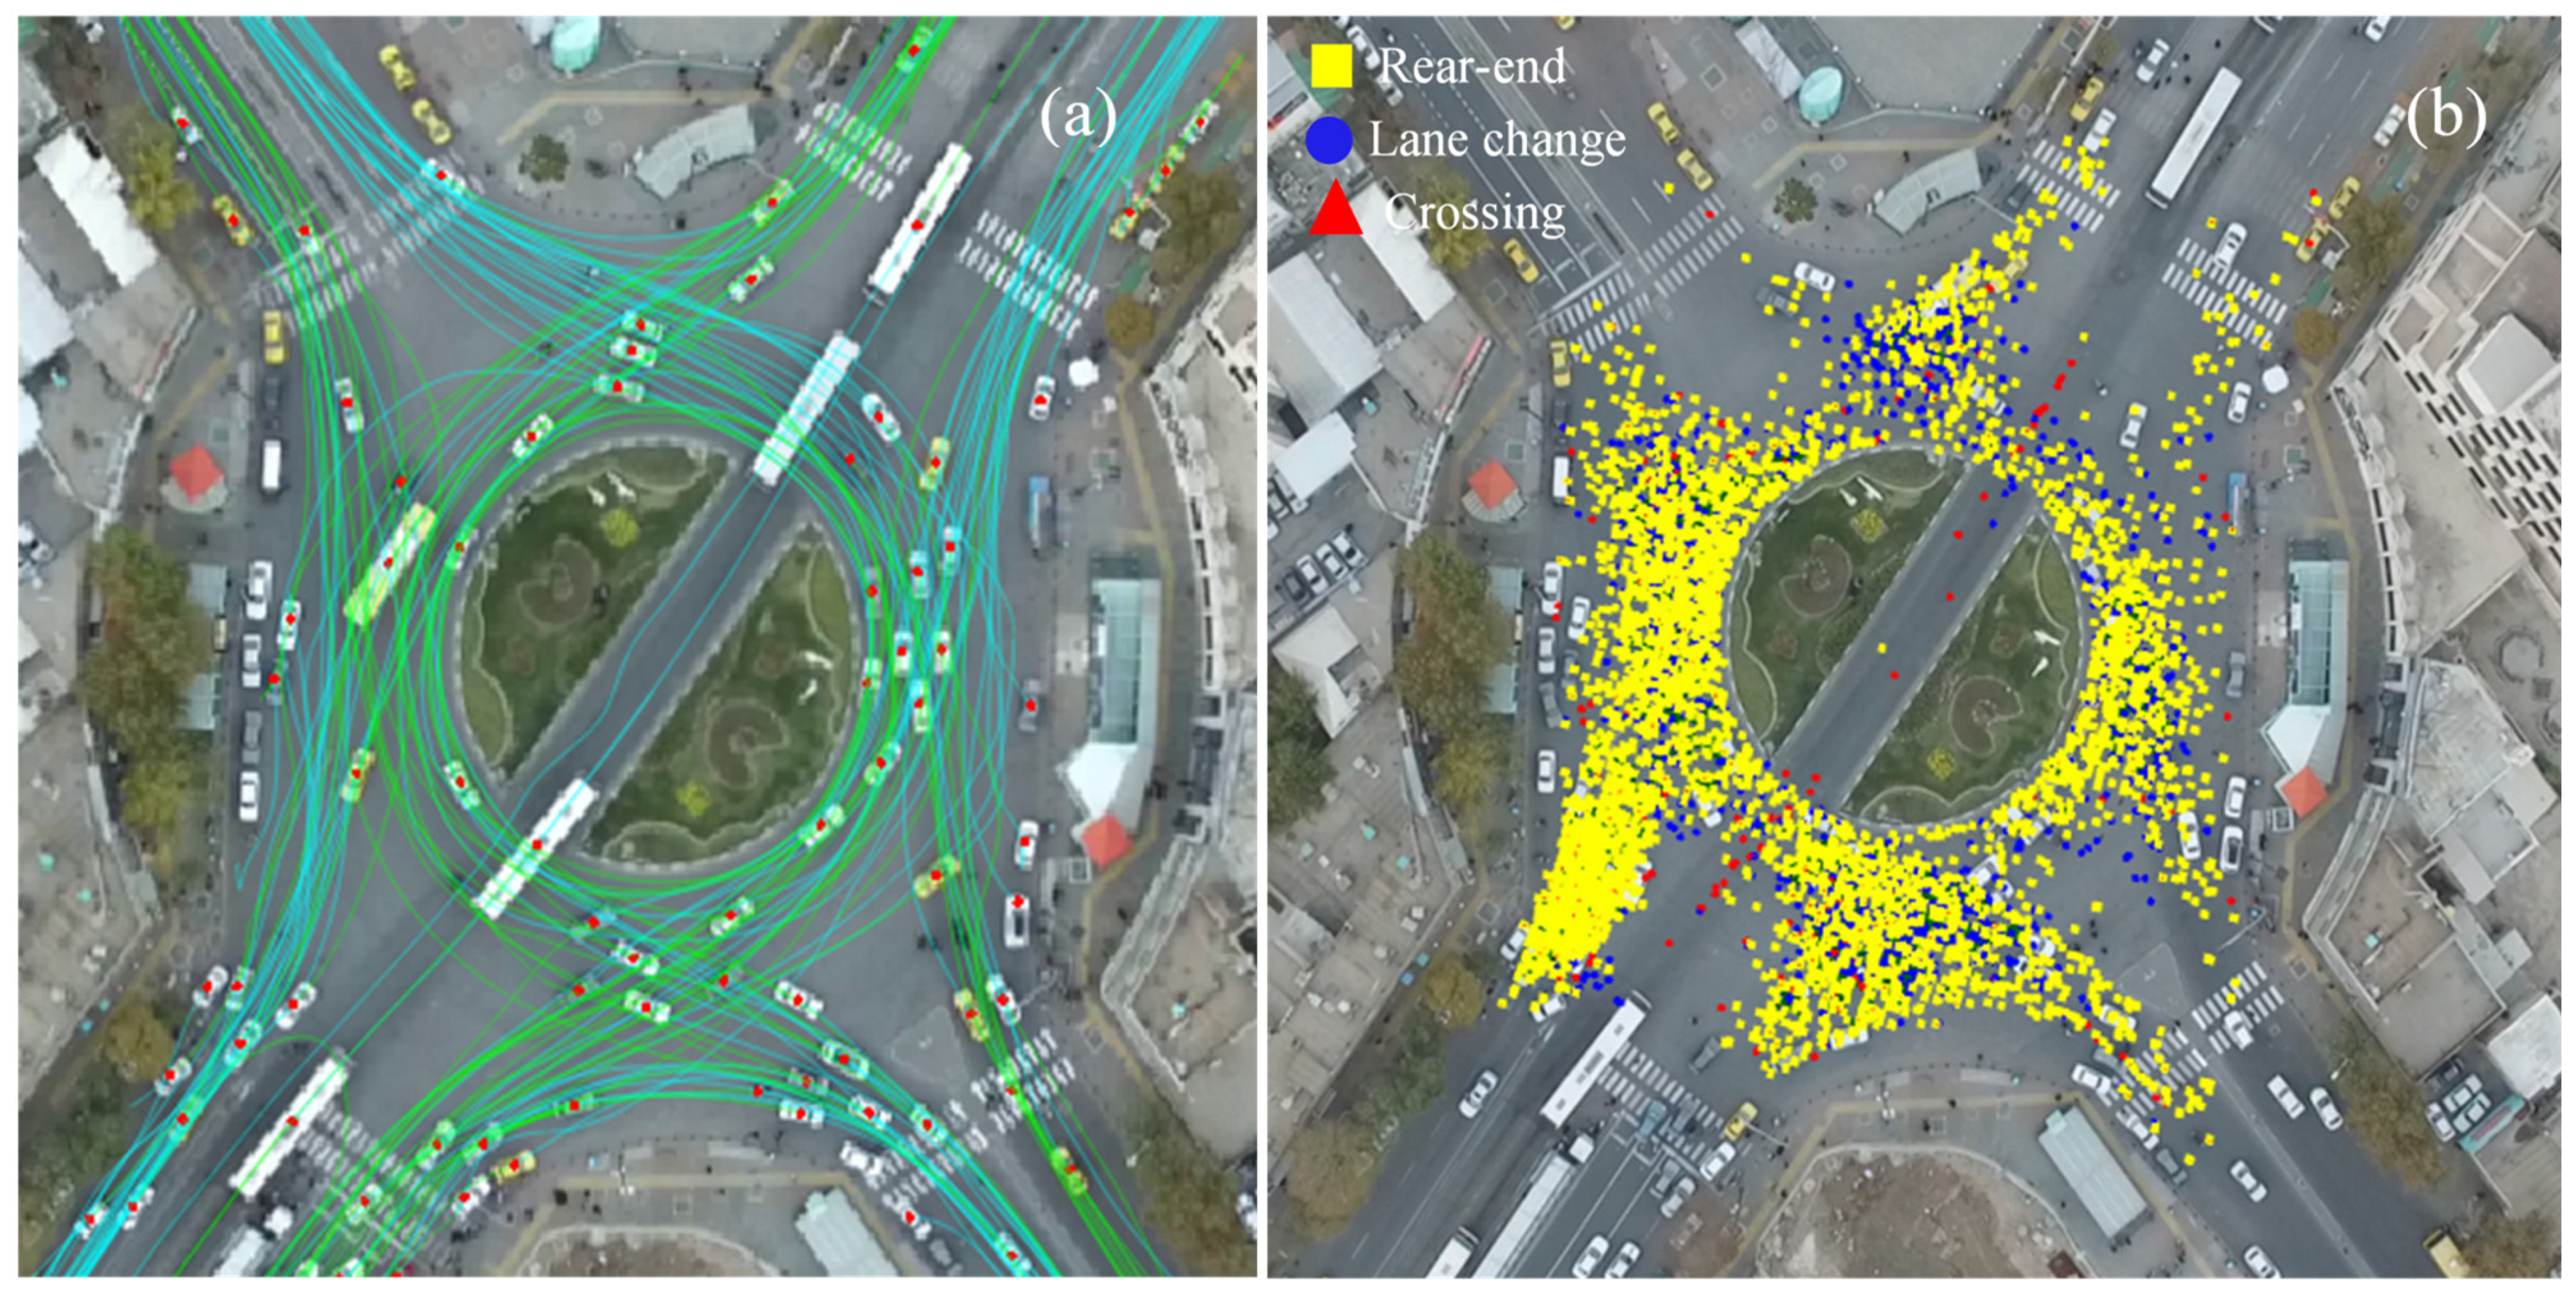
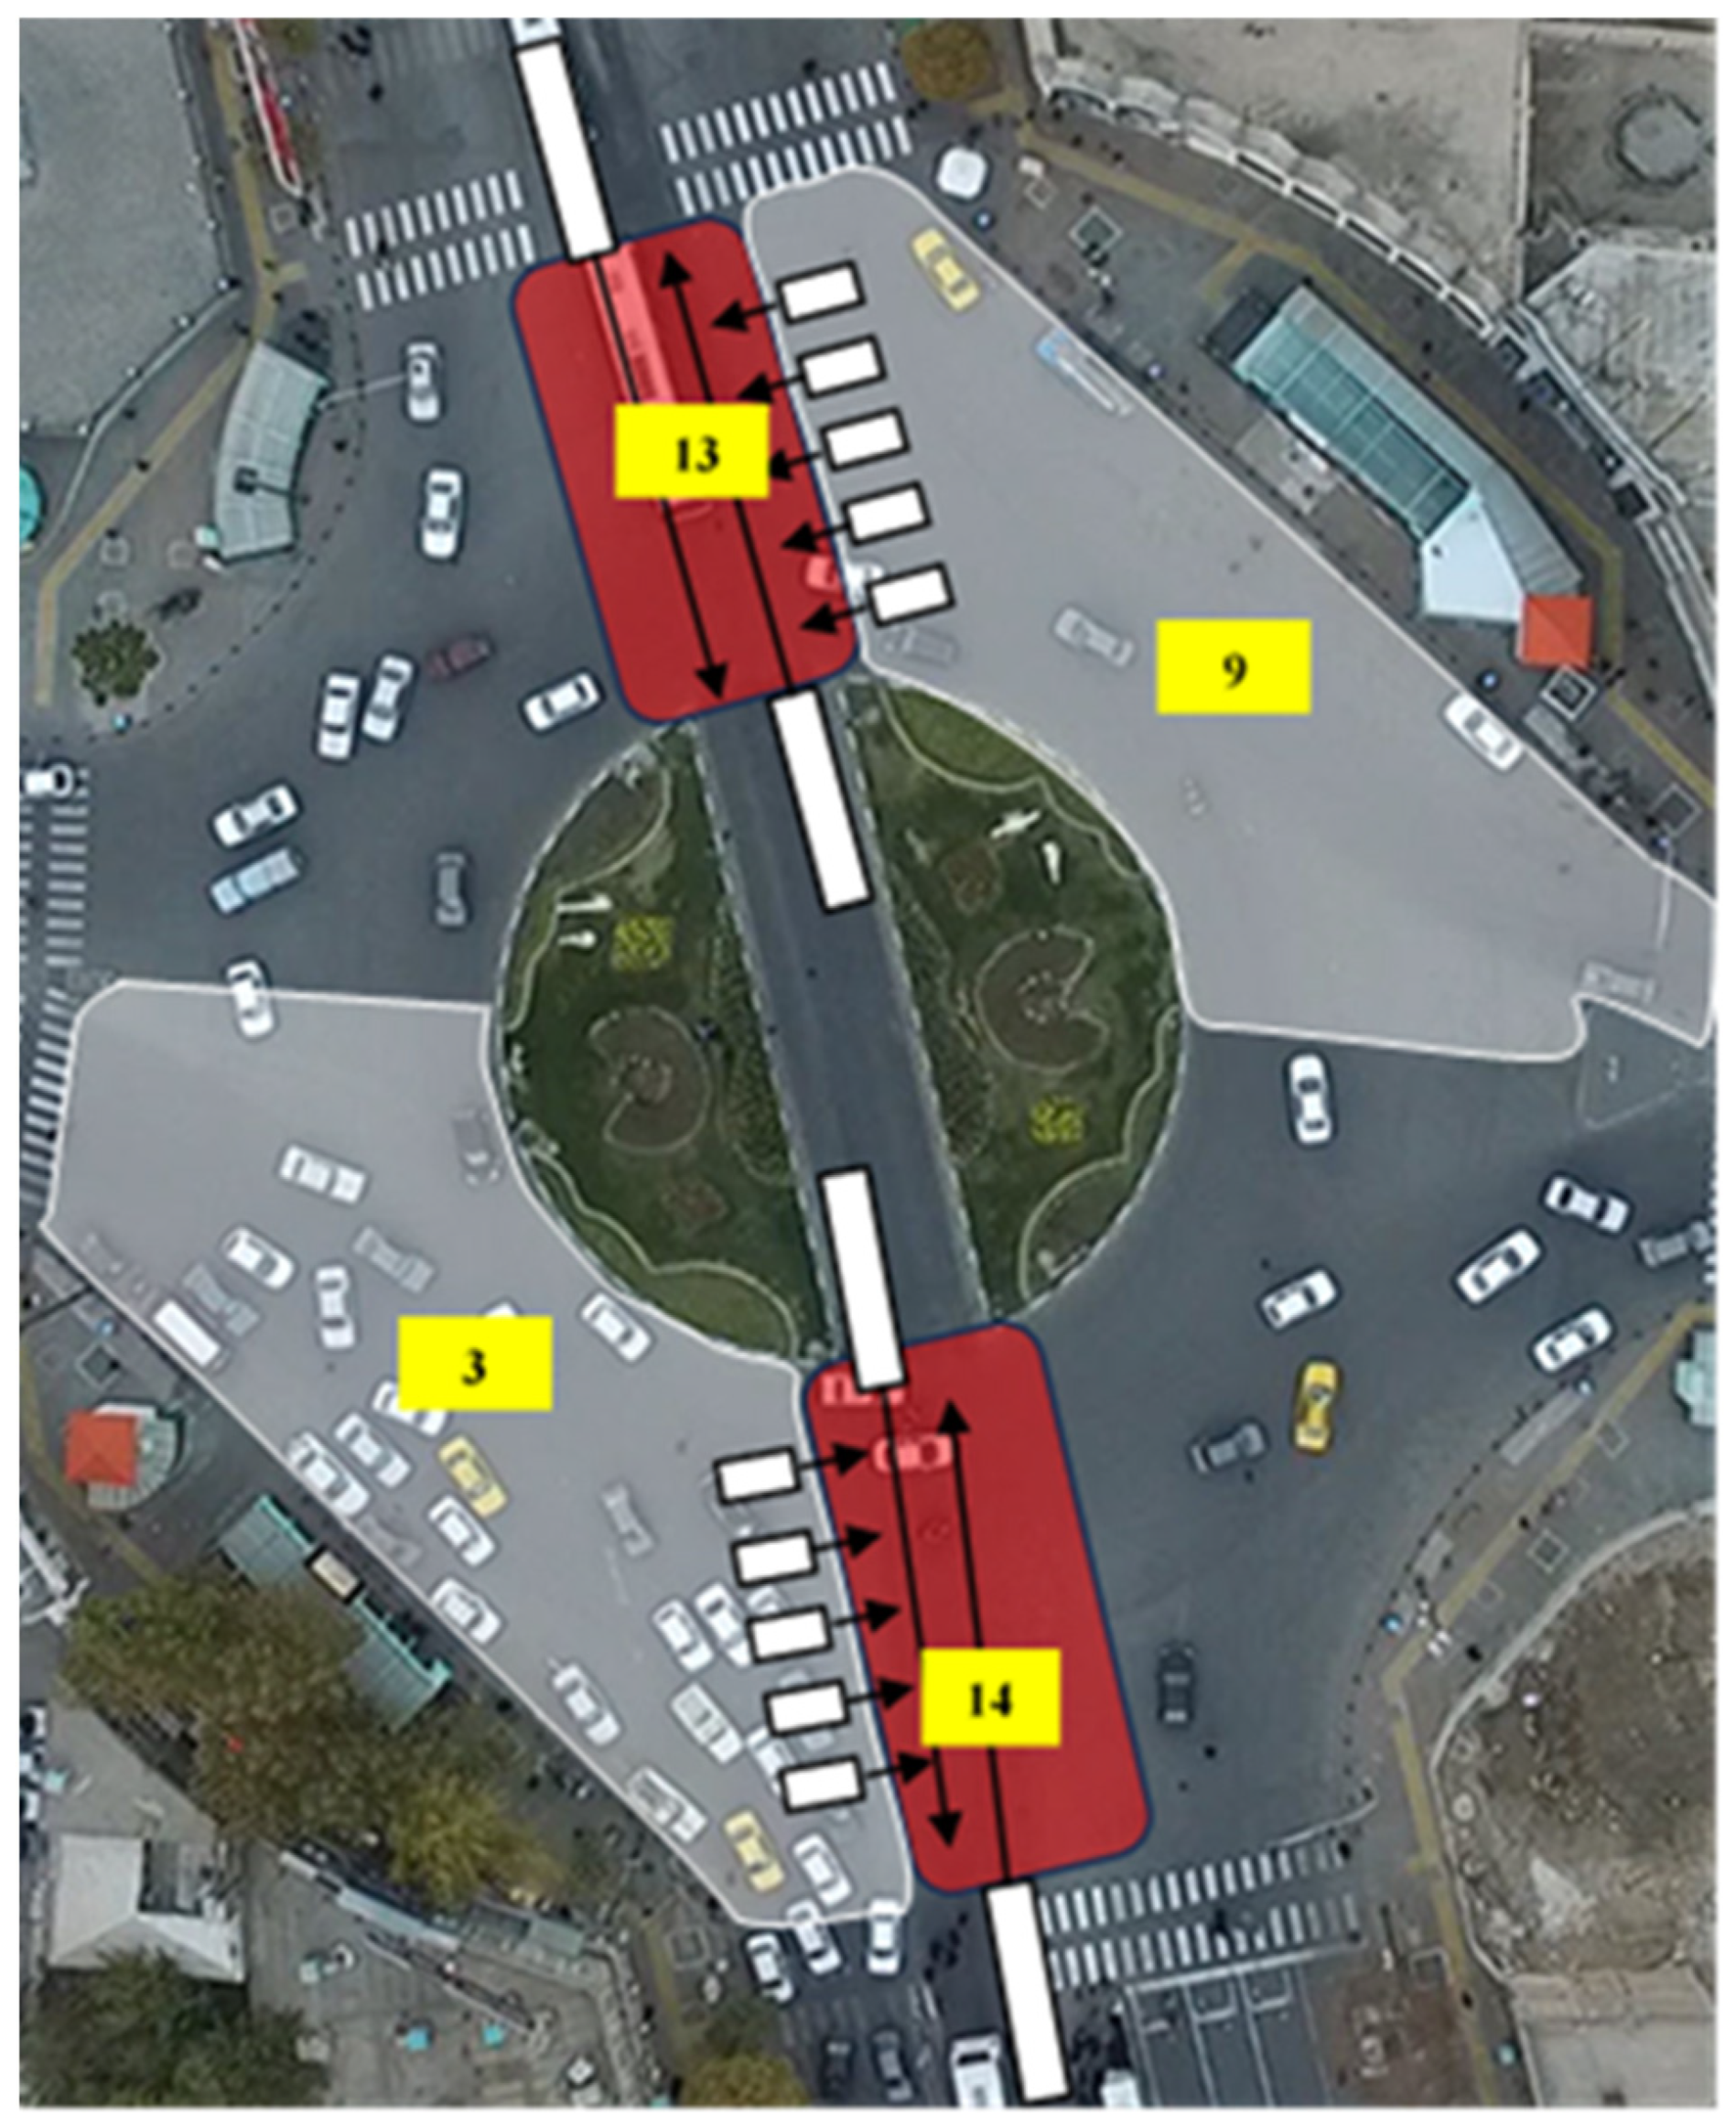
4.1. Crossing Conflicts
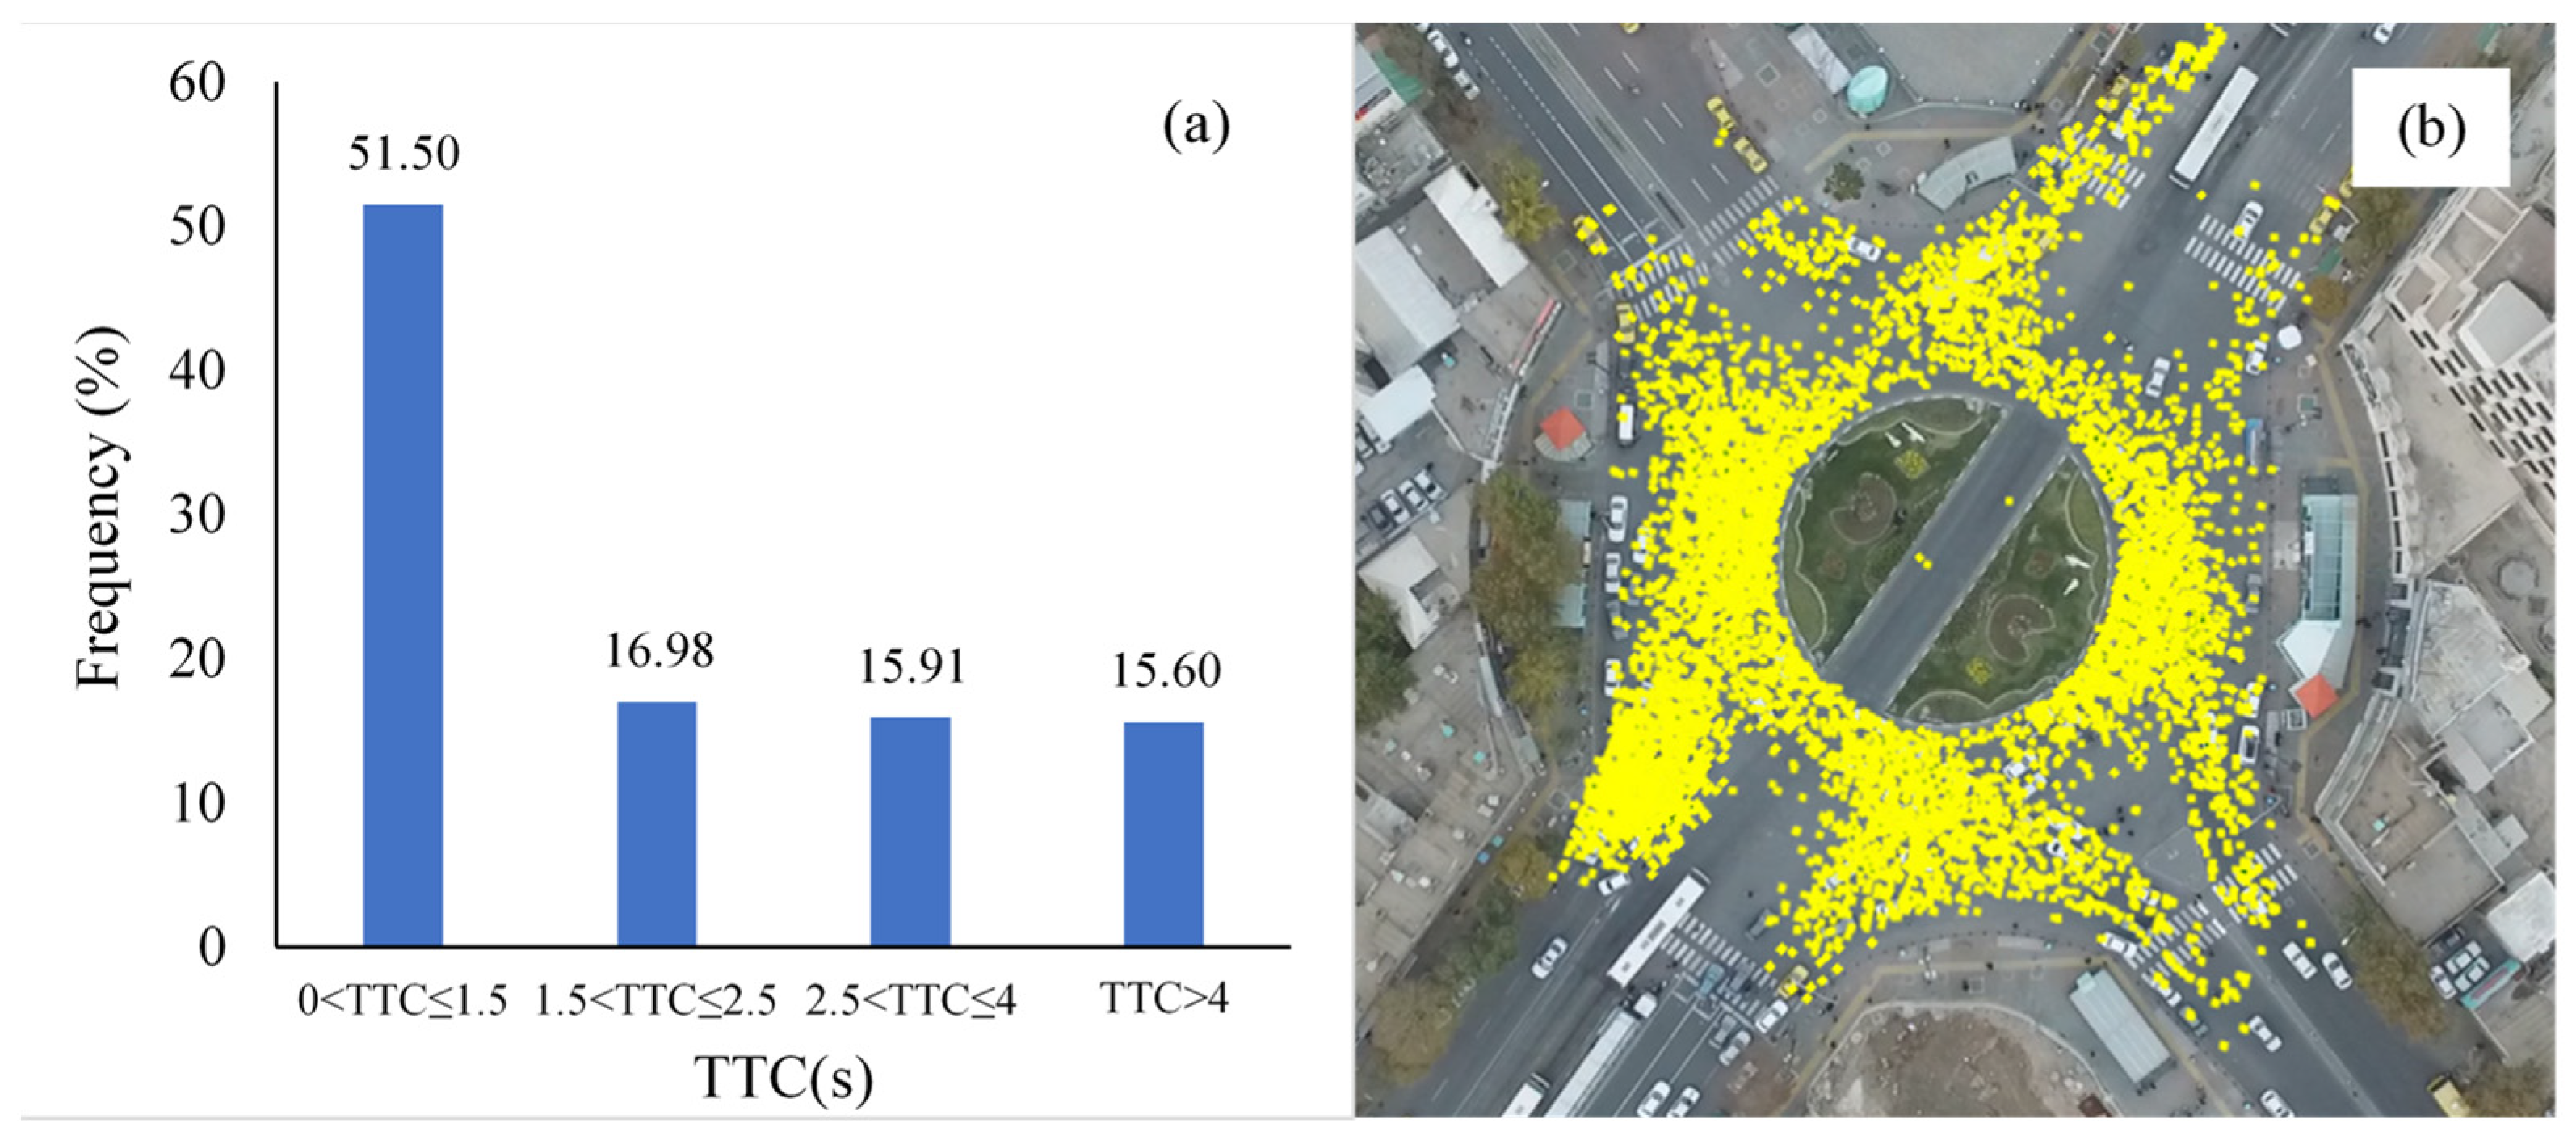
4.2. Rear-End Conflicts
4.3. Lane-Change Conflicts
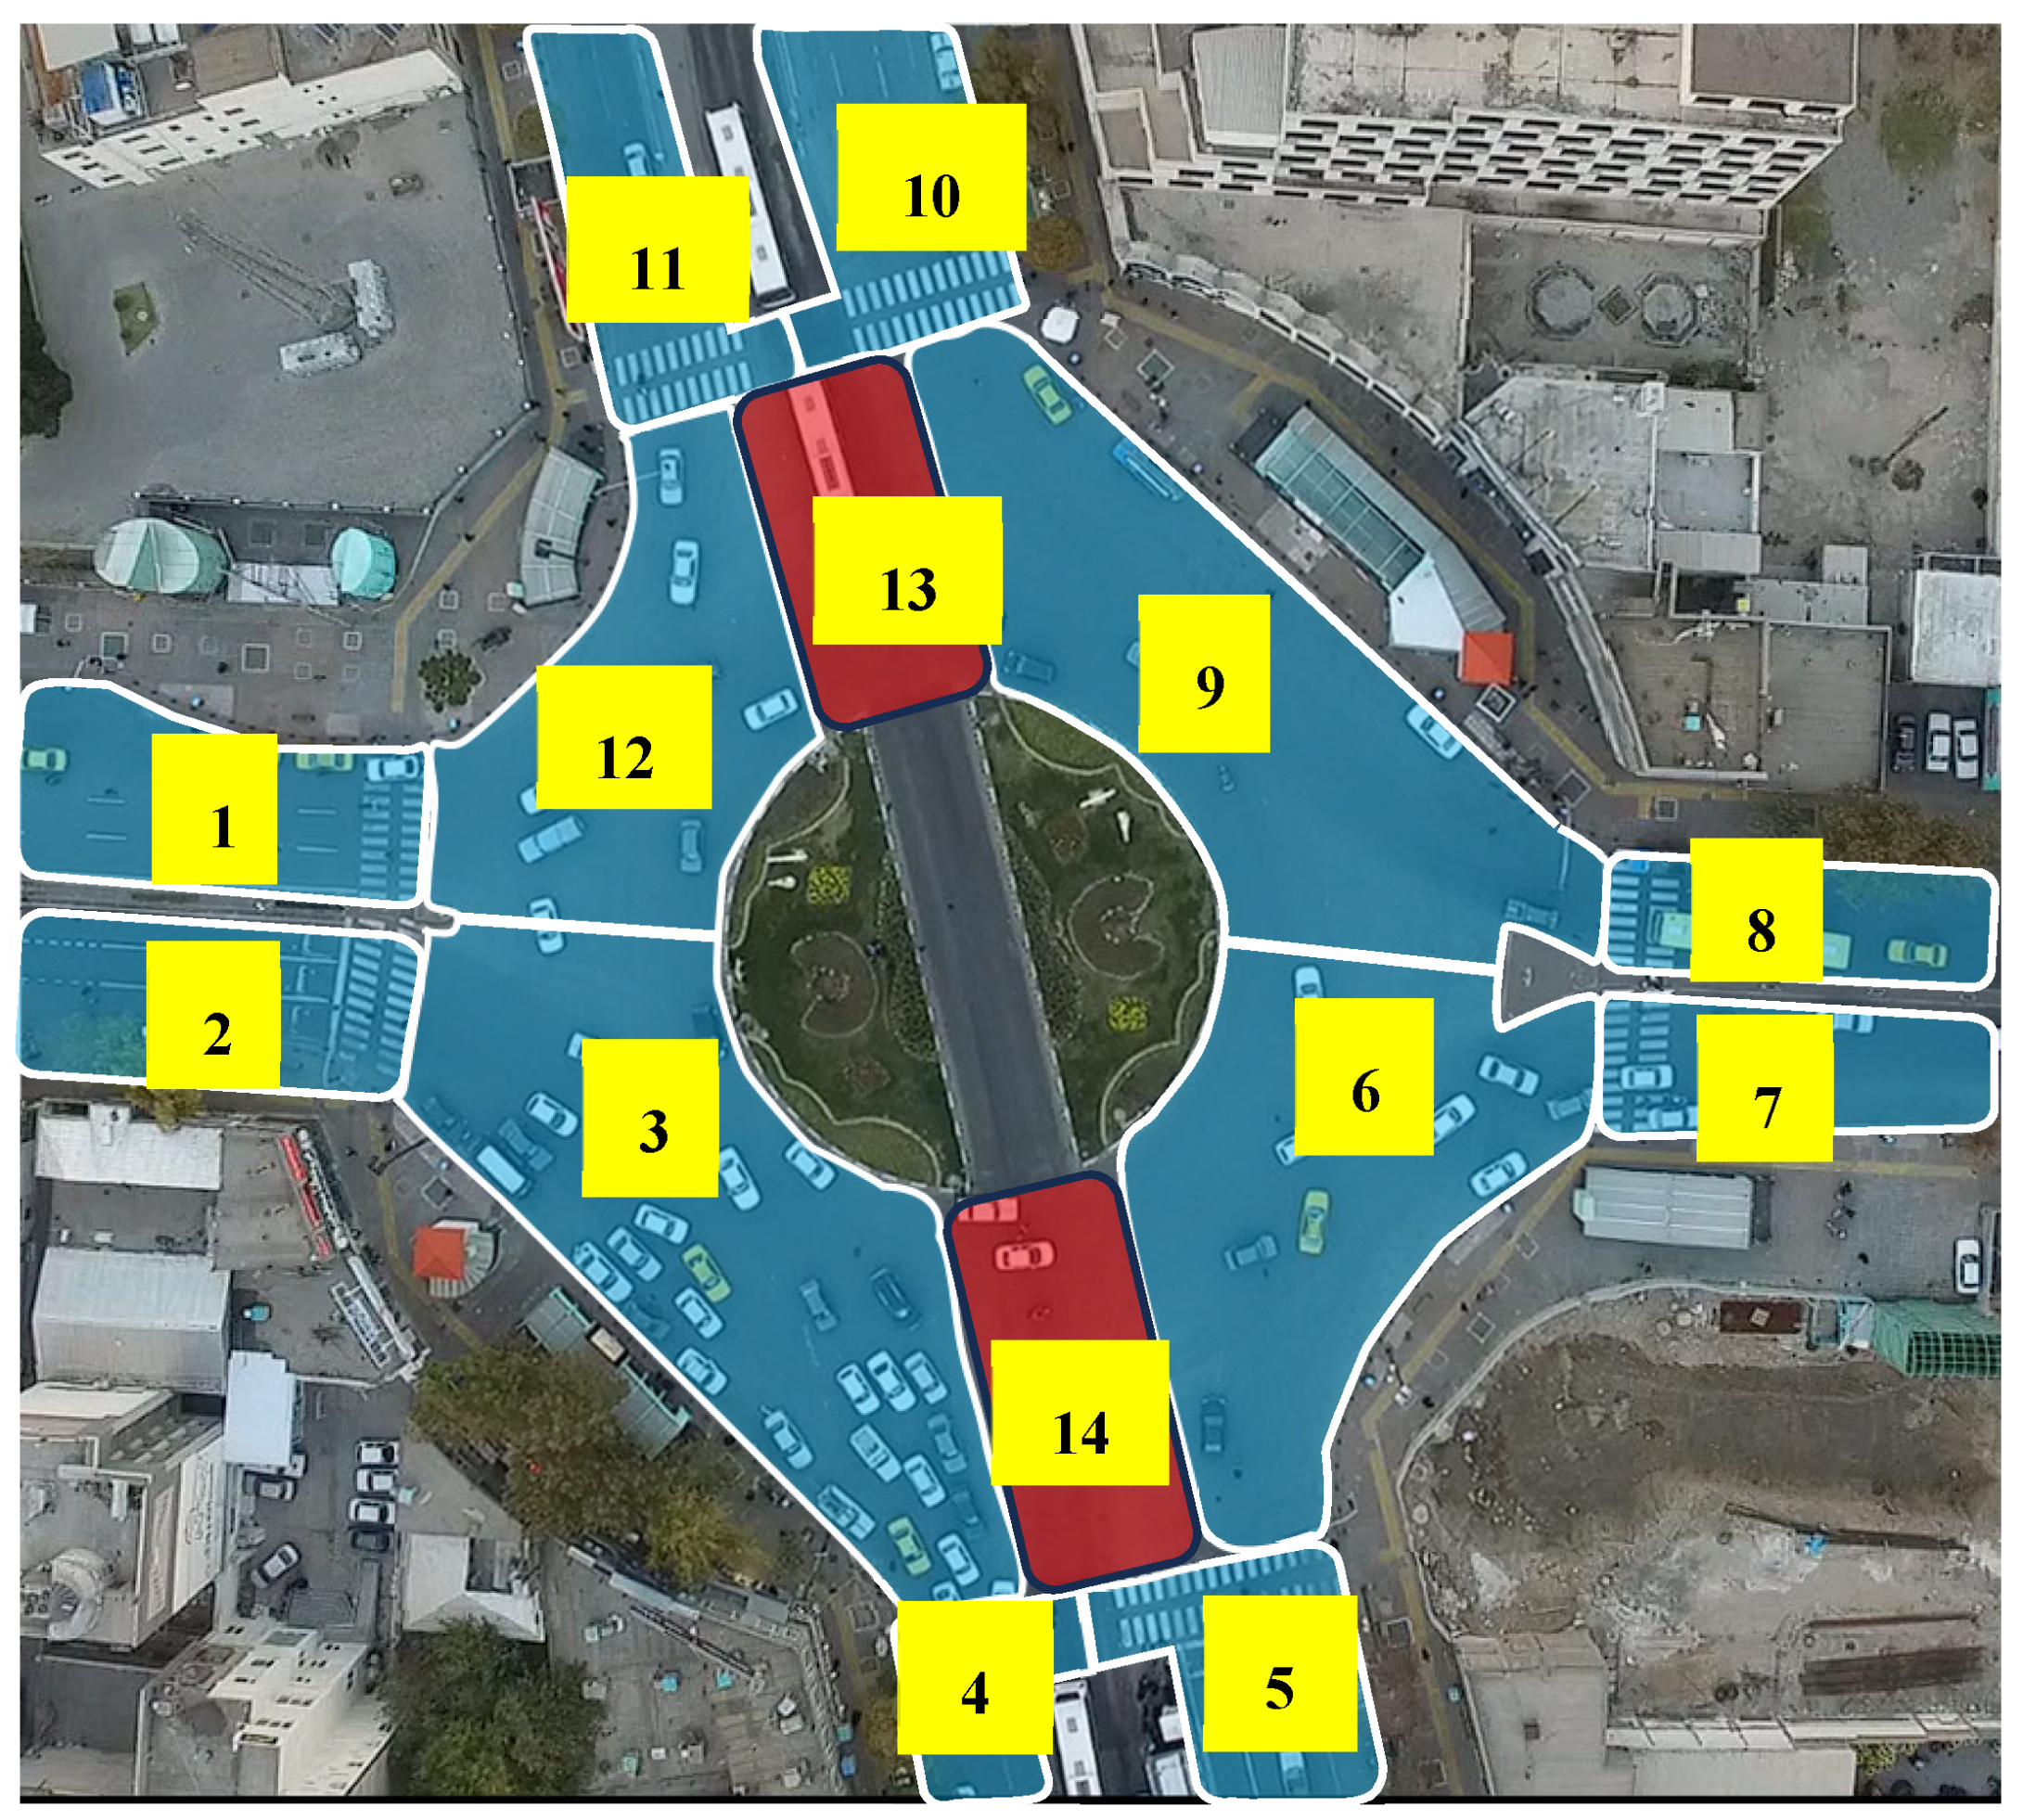
4.4. Zoning Safety Diagnostics of SCI Roundabout
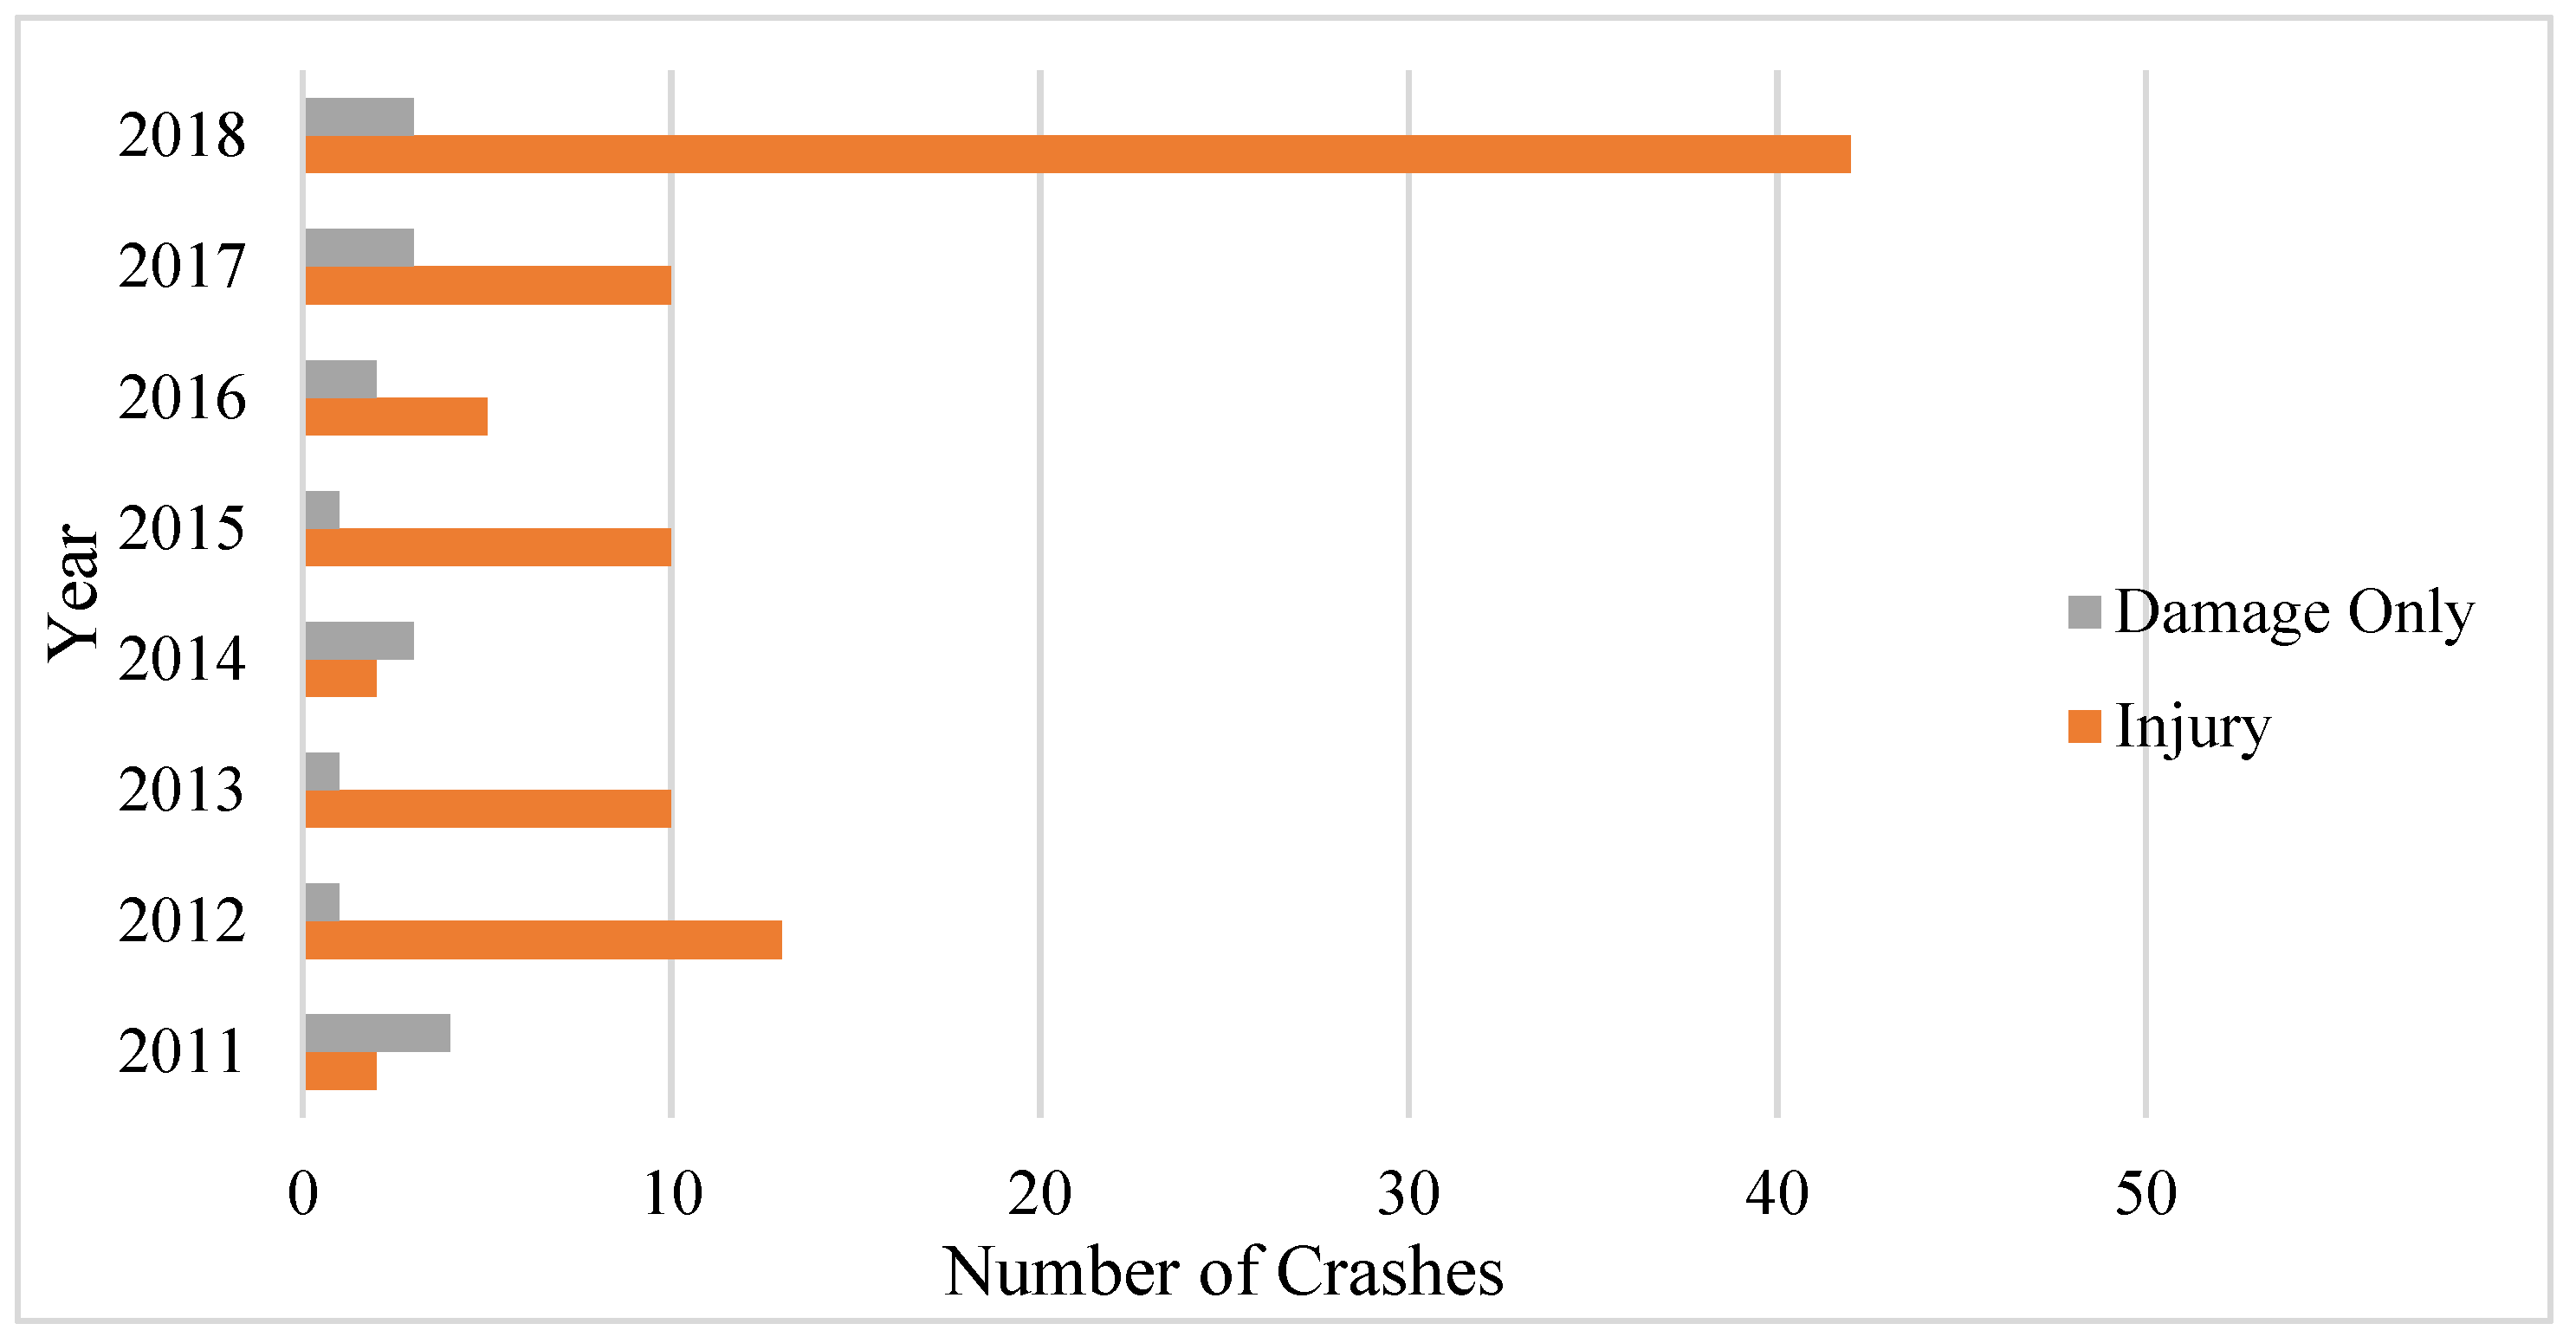
4.5. Comparing Crash Data and Conflict Severity
5. Conclusions
- -
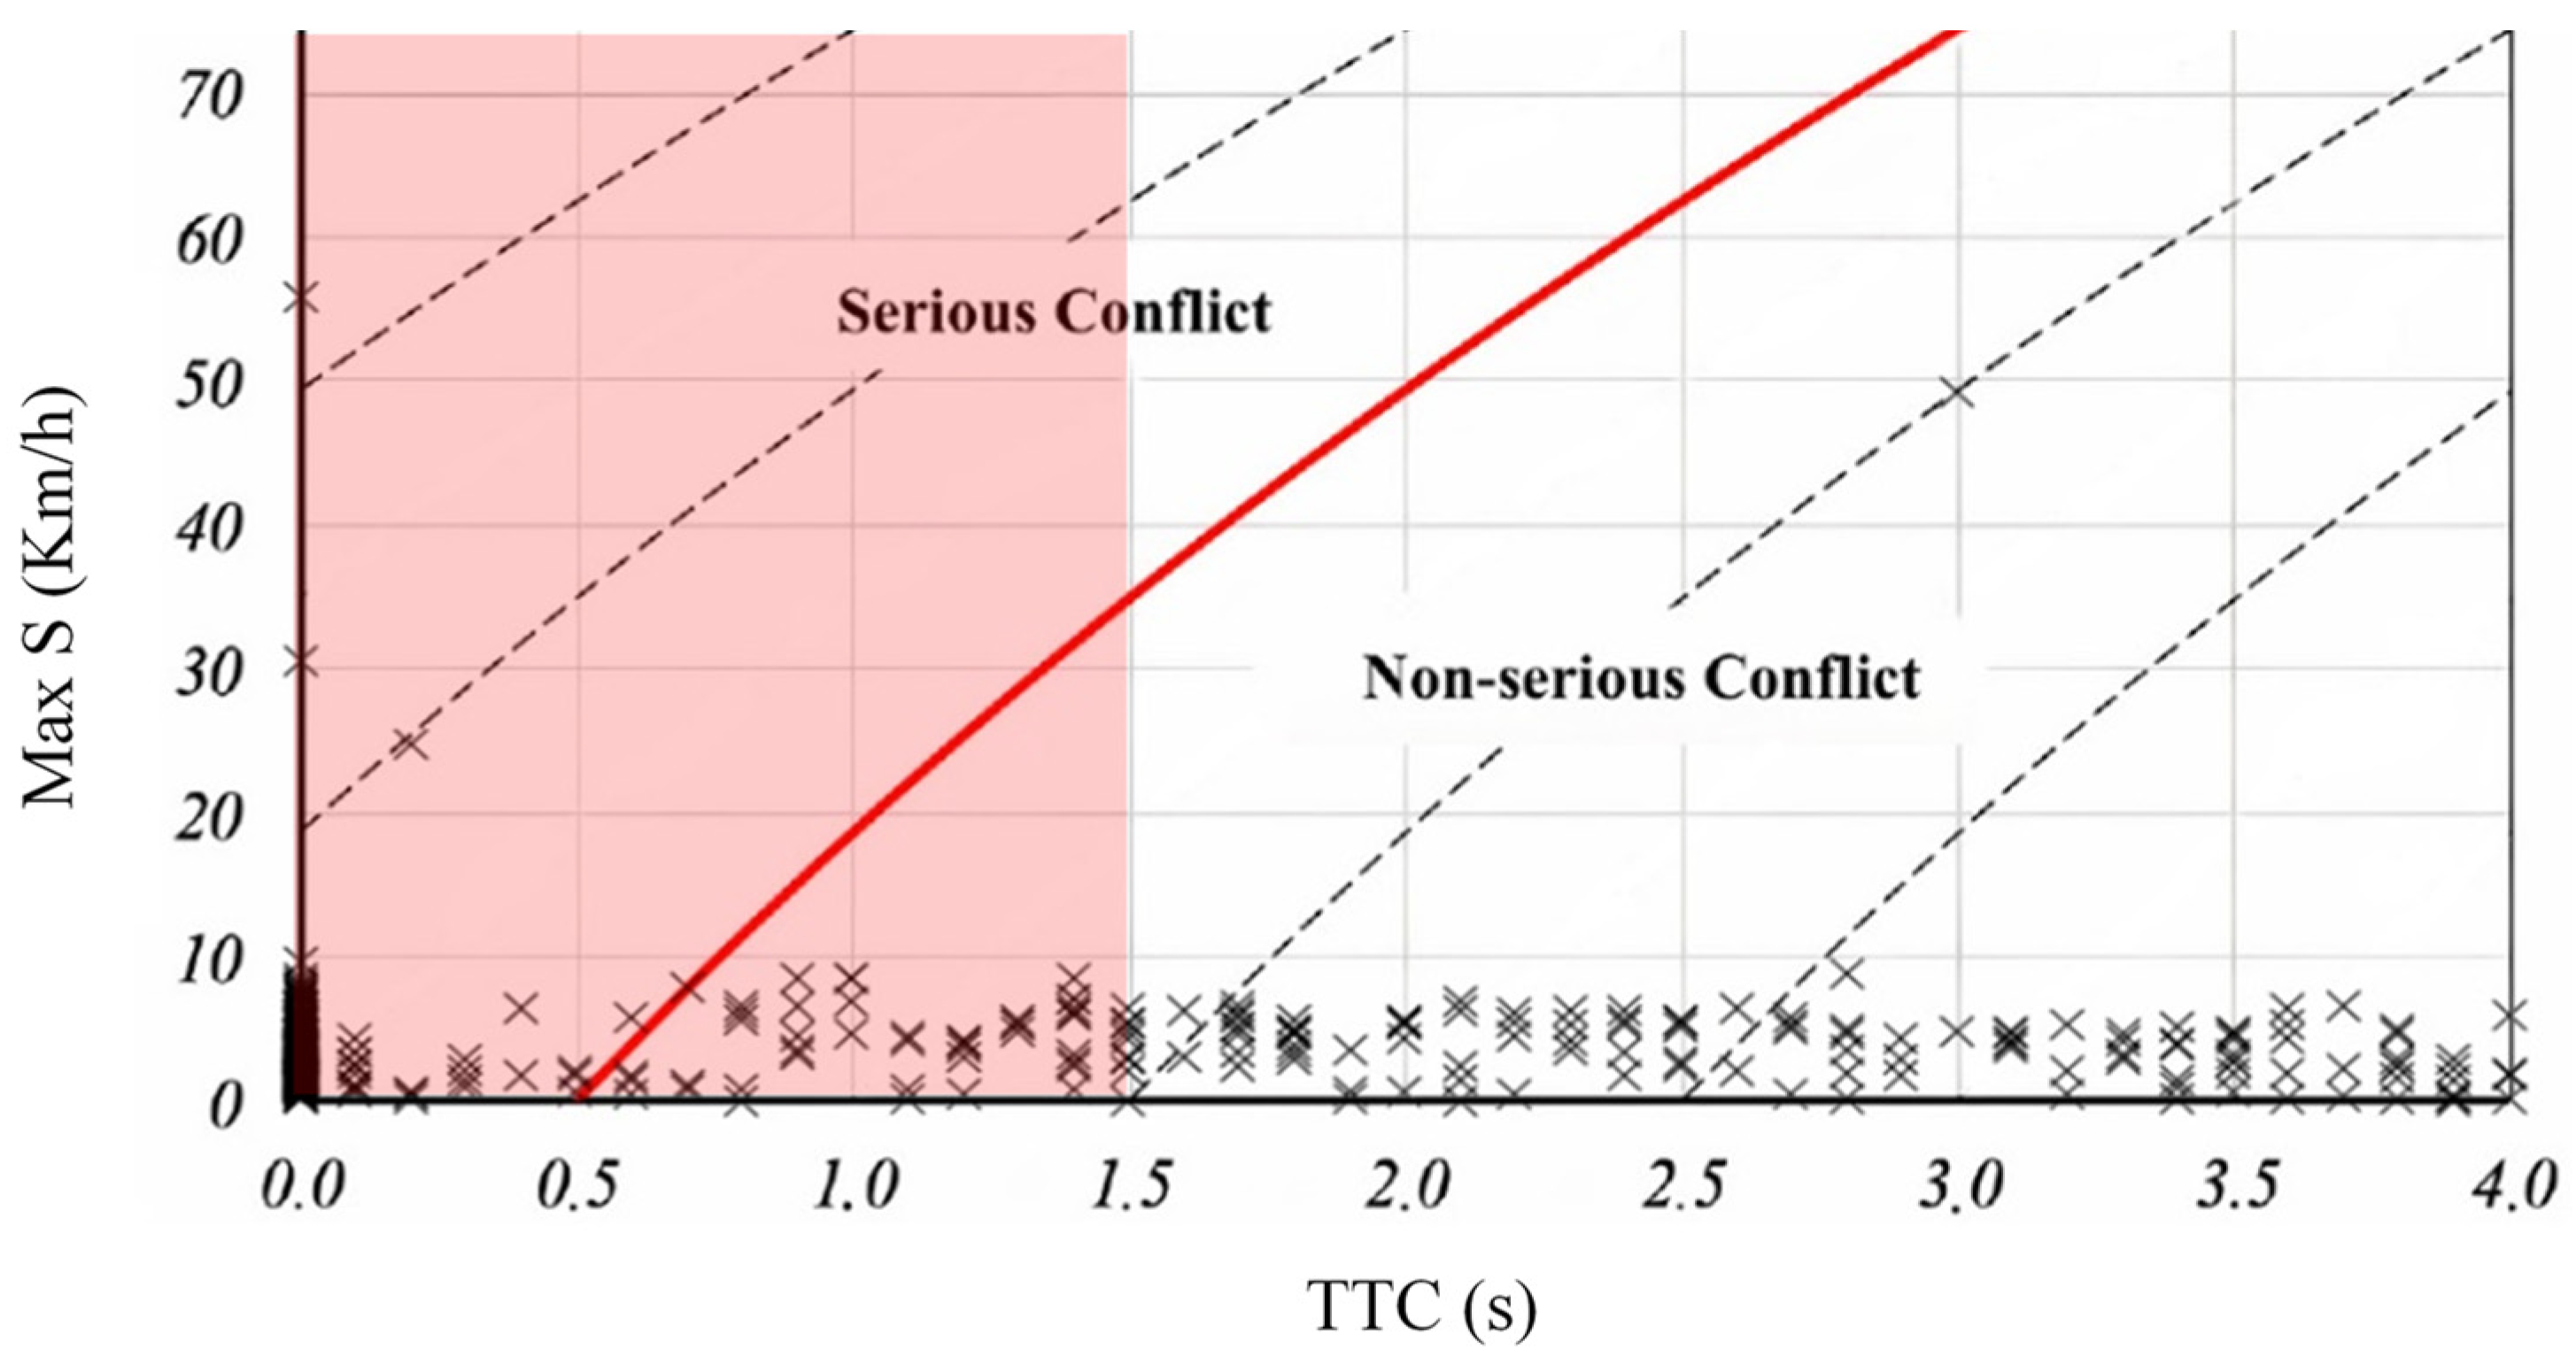
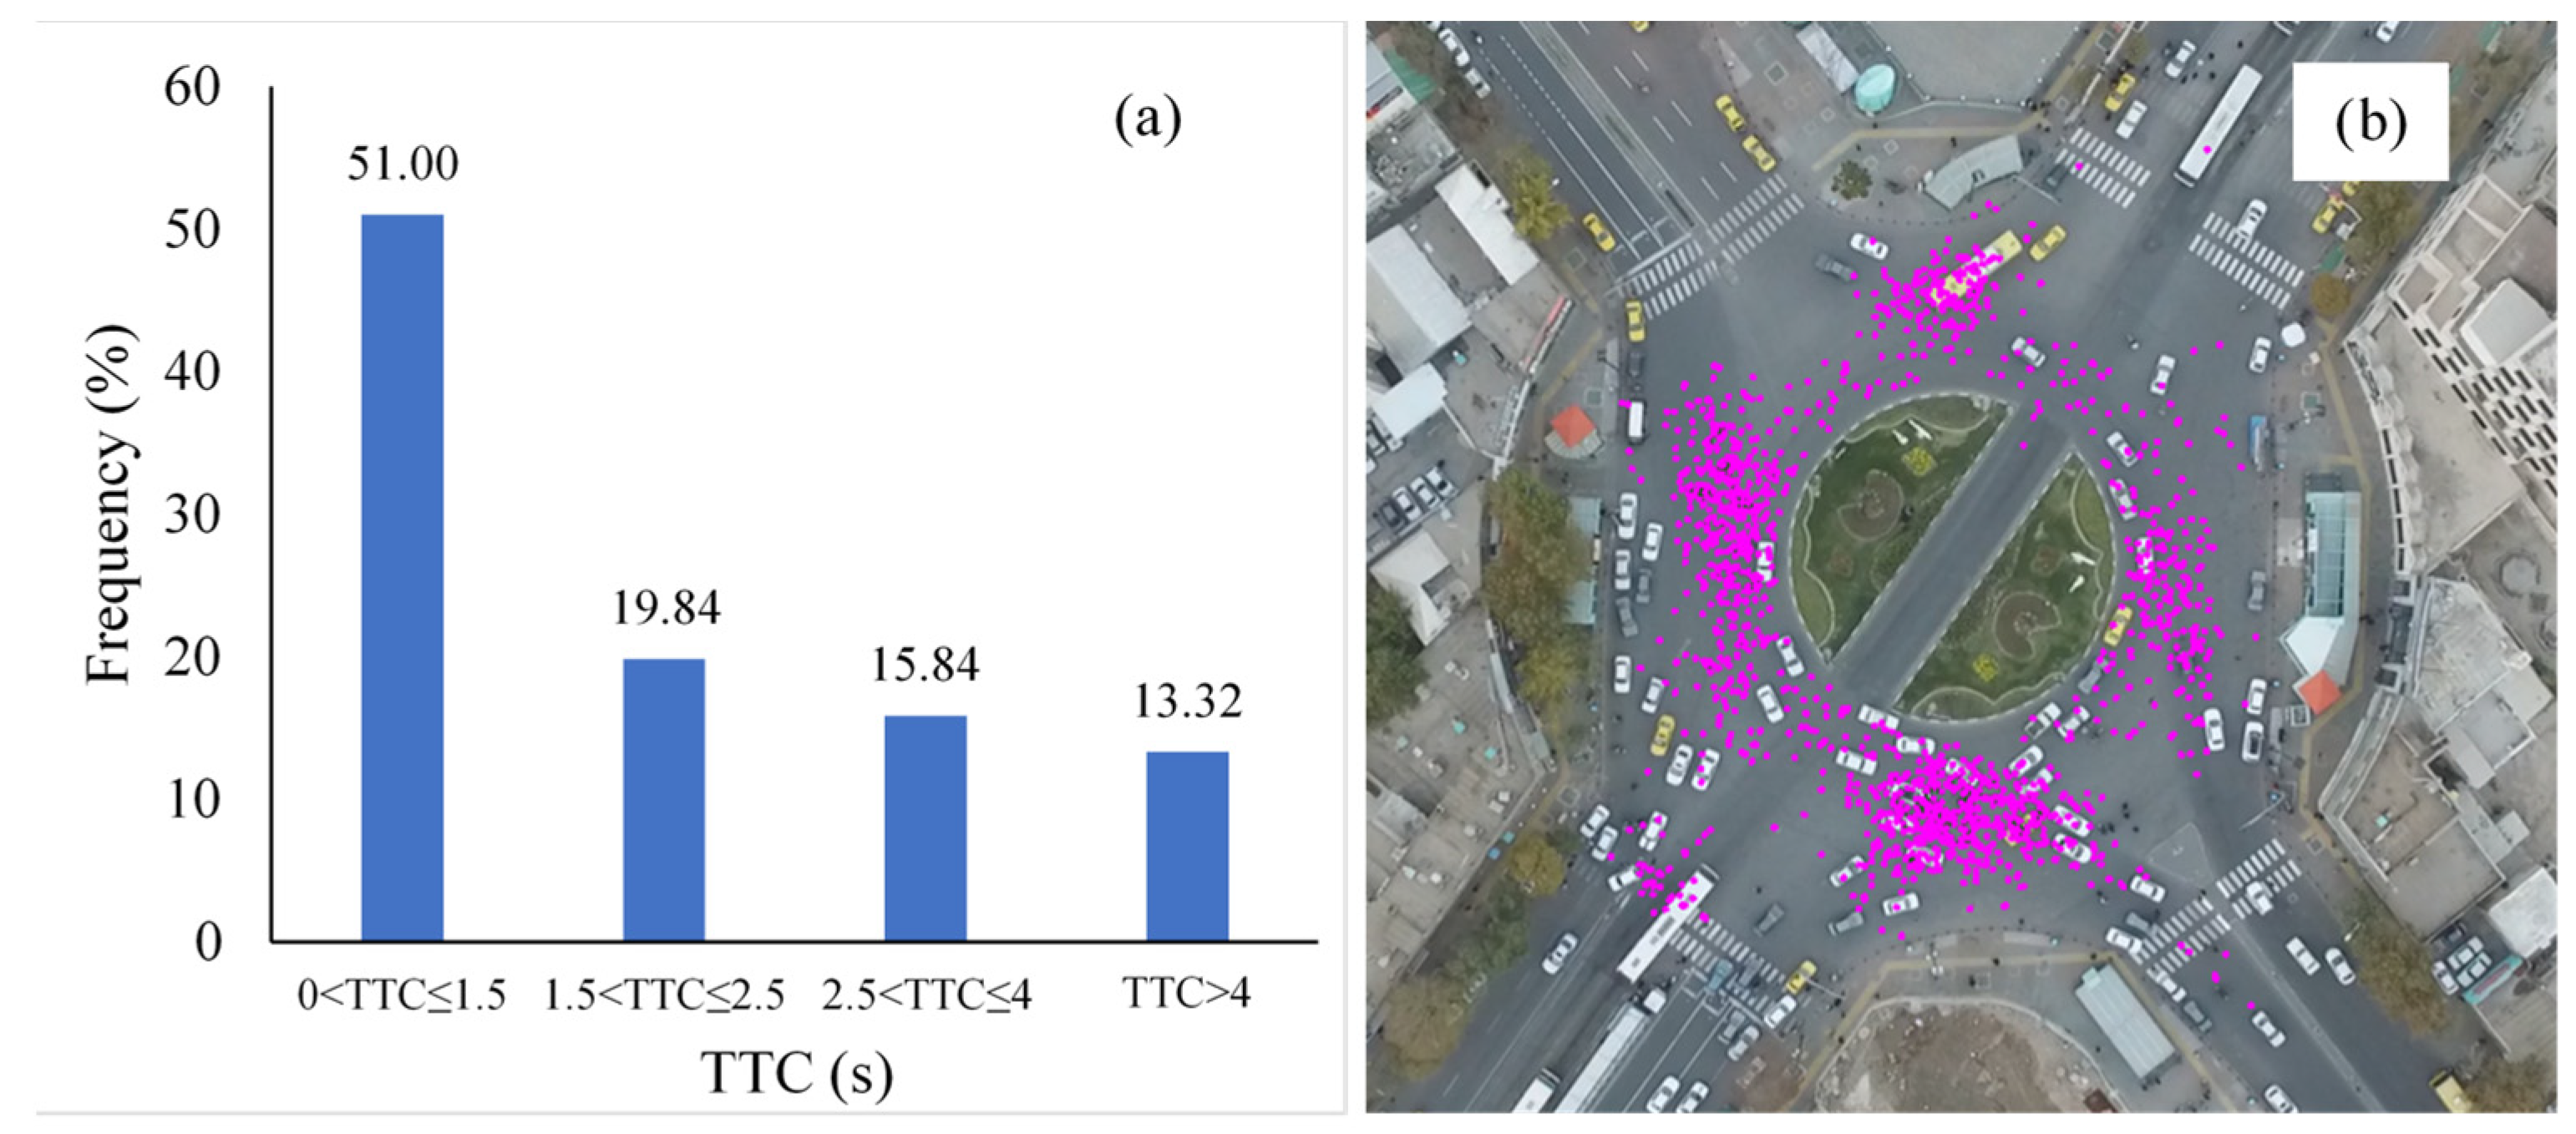
- It is concluded that TTCs between 0 and 1.5 s have the highest frequency compared to other categories. The lowest frequency of the TTC category is related to TTCs that are longer than 4 s. Therefore, more than 50% of conflict points have extreme risk levels.
- -
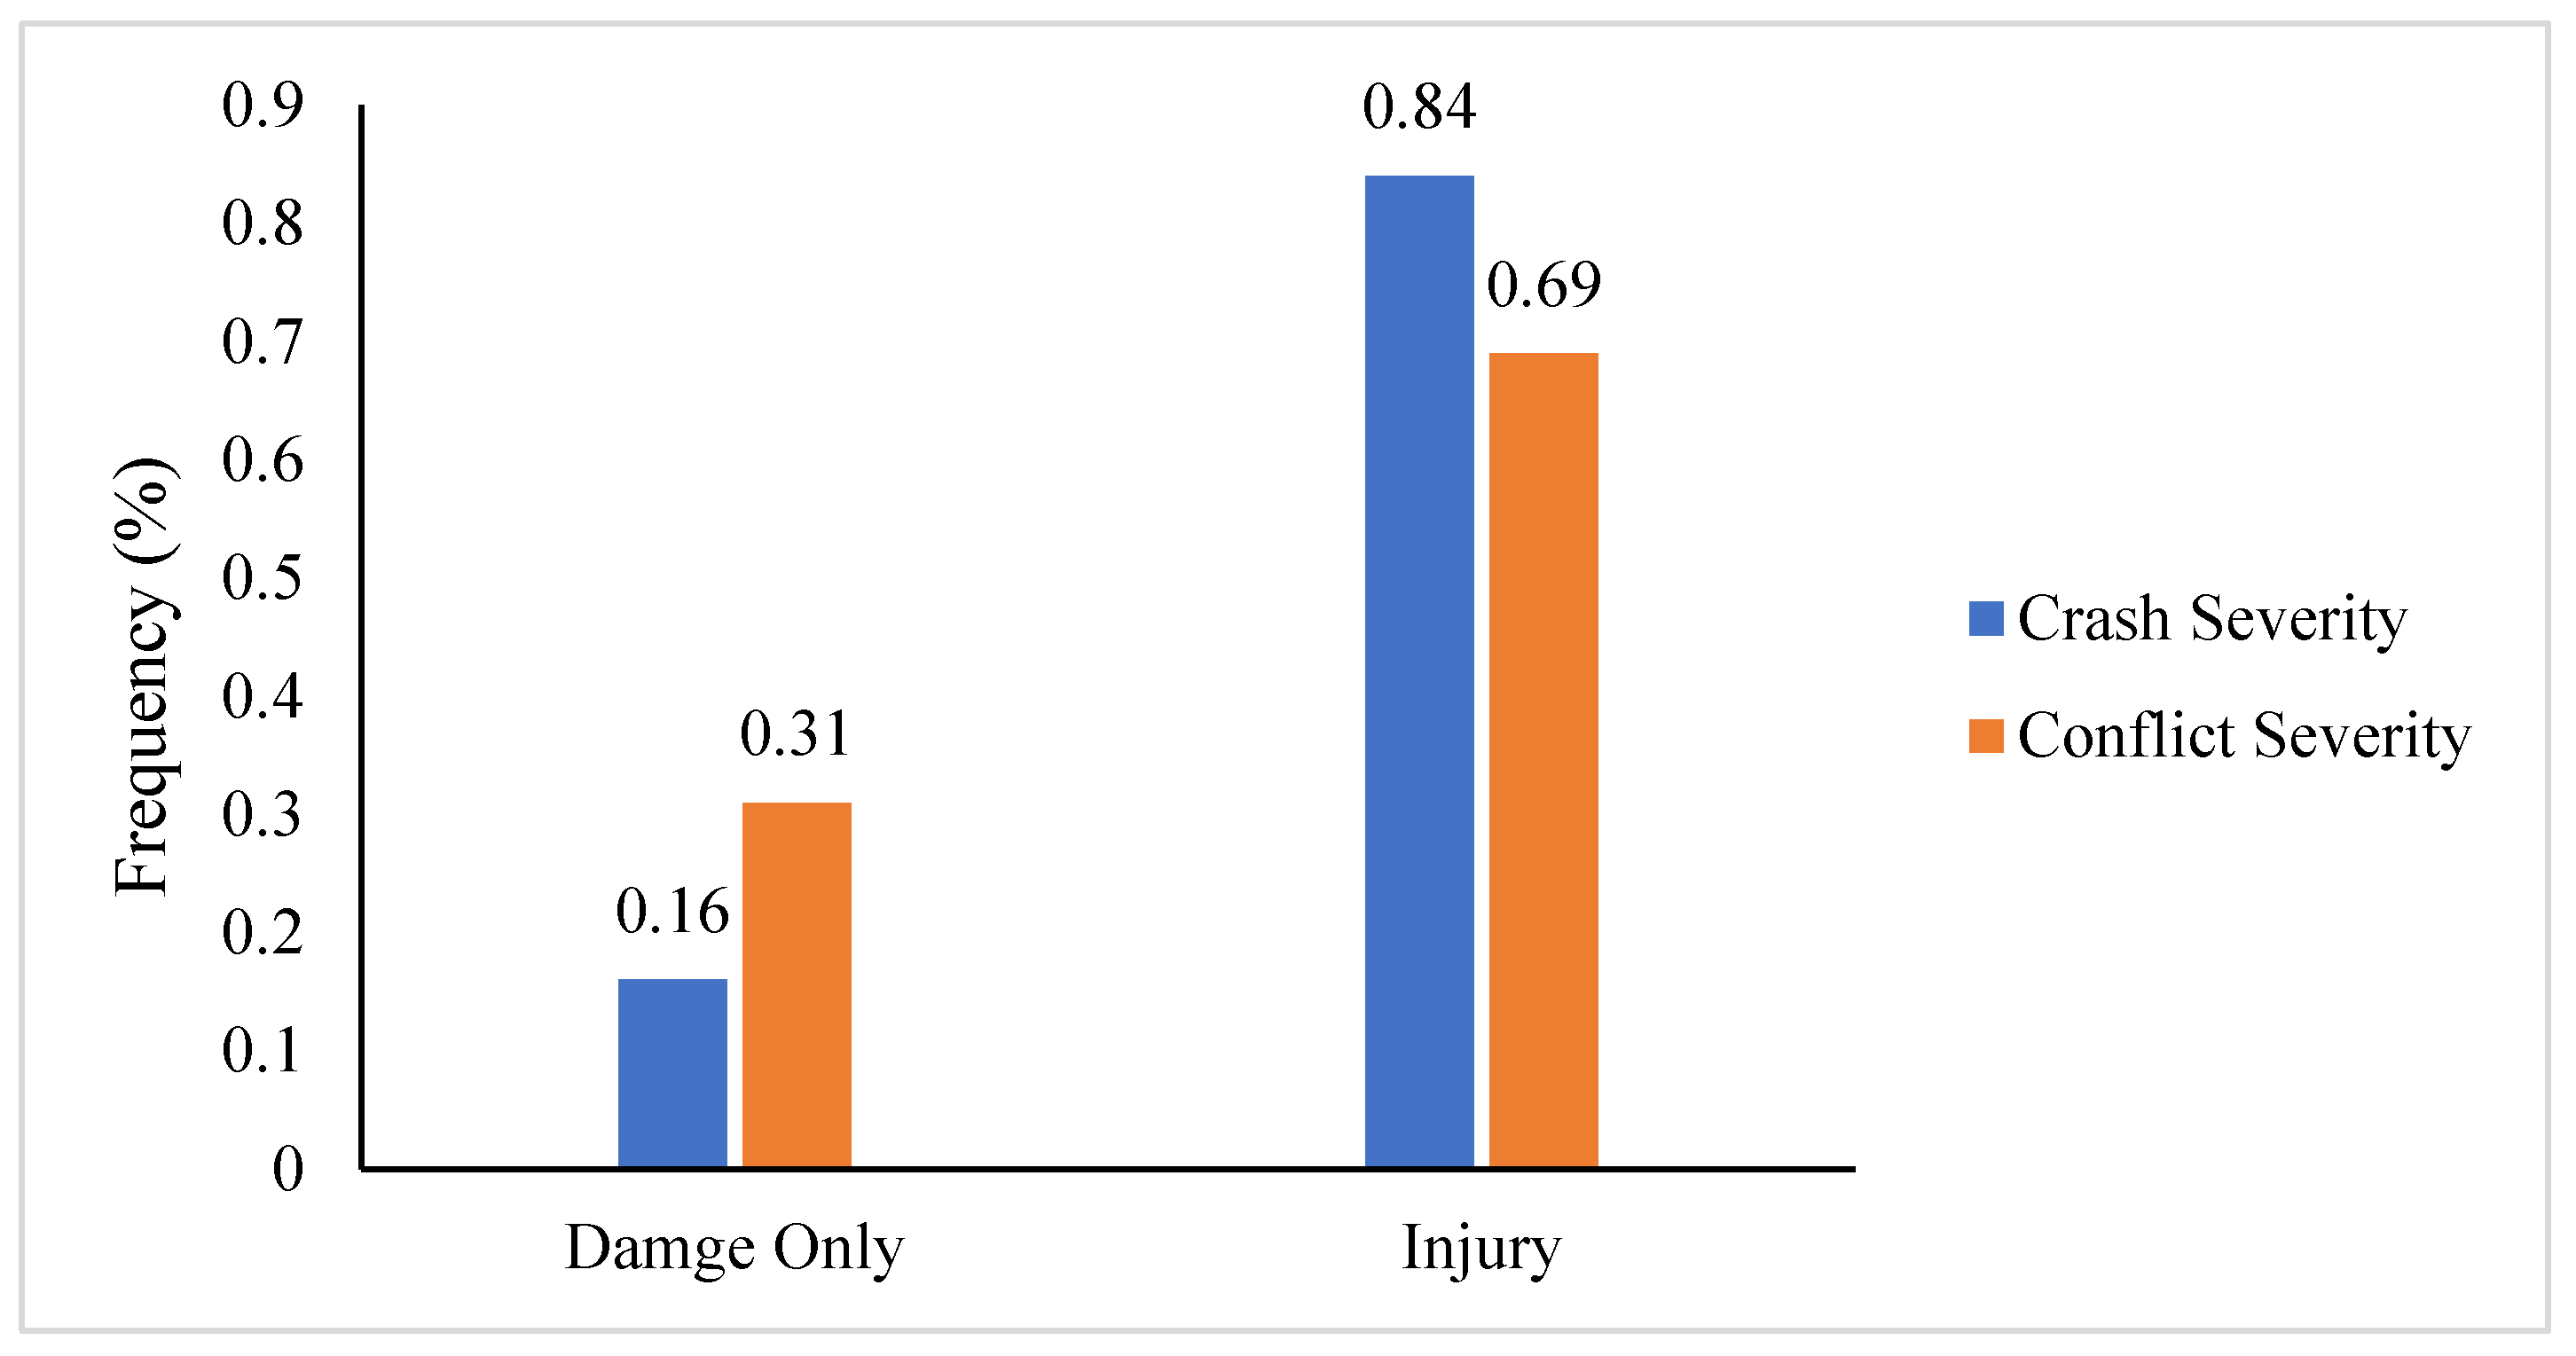
- It was observed that more than 99% of the vehicles in the roundabout are moving with a speed difference of 32 km/h or less. In conclusion, the majority of vehicles in the roundabout are maintaining a safe speed difference. This is likely attributed to the implementation of traffic calming measures and high traffic flow density. The number of conflicts is primarily linked to the injury type, with the lowest number occurring in cases of fatality. Out of all conflicts, 31% are of the damaging type, while 69% are injury-related. When examining conflict types individually, lane-change conflicts have the highest frequency of injury, while rear-end conflicts have the lowest frequency. On the other hand, crossing conflicts have the highest frequency of damage, while lane-change conflicts have the lowest.
- -
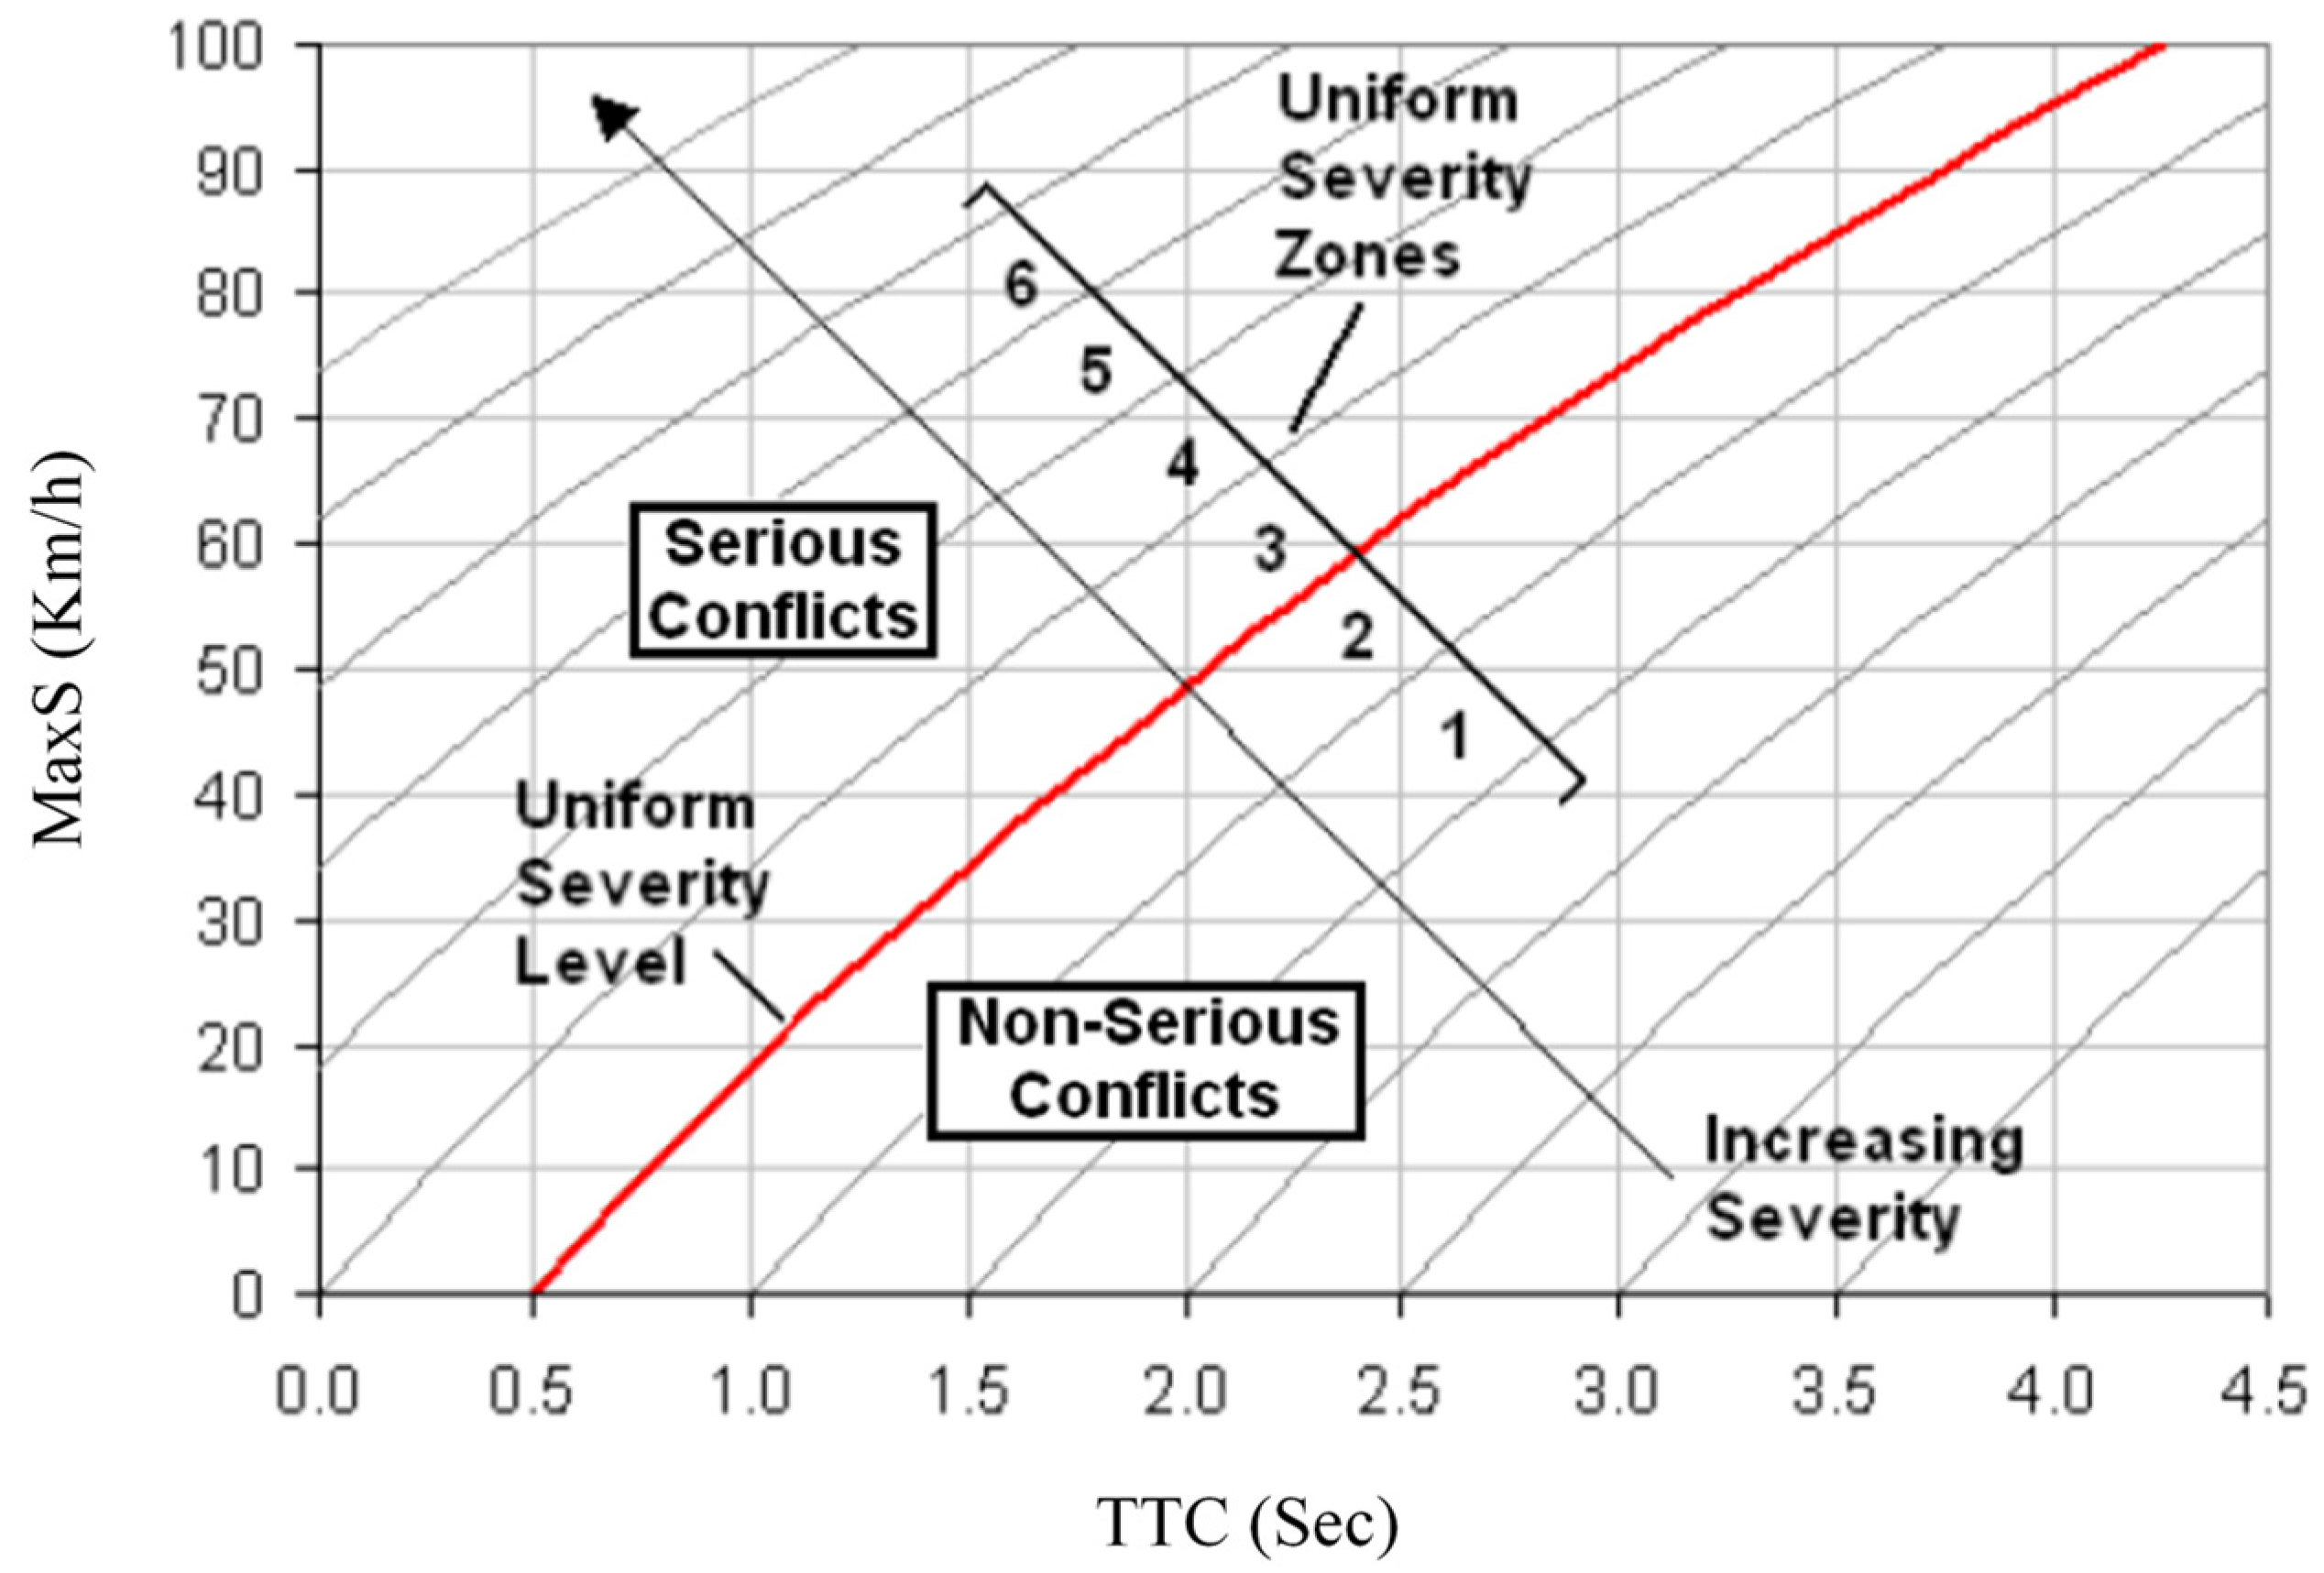
- The MaxS versus TTC diagram was used to categorize conflict points into serious and non-serious conflicts. Among the conflict types, 45.6% of crossing conflicts, 31.9% of rear-end conflicts, and 28.3% of lane-change conflicts fell into the category of serious conflicts. However, when assessing the risk levels in the roundabouts for collisions involving crossing (55.24%), rear-end (51.5%), and lane-change (51%) conflicts, it was found that these types of conflicts have the highest probability of resulting in crashes in this type of roundabout.
- -
- Our analysis of 8-year crash data and the severity of conflicts indicates that crashes and injuries make the most substantial contribution to accidents in these roundabouts. Fortunately, crashes and fatal conflicts represent the lowest quantities, and are negligible for conflicts. In the 8-year crash data this value is zero, which depicts the accuracy of the conflict-based safety assessment approach used in this study. Therefore, if there is a traffic flow in the form of prioritized public transit in similar roundabouts, the findings of this study can be applied. In other words, if traffic and urban safety designers and engineers prioritize TSP and manage to convert conventional roundabouts into SCI roundabouts, the findings of this study can offer valuable insights into both overall and specific implications. Additionally, this analysis can provide an initial forecast of the severity, types, and frequency of conflicts within different areas of SCI roundabouts.
- -
- The use of surrogate safety assessment models has been successfully applied, and appears crucial for future studies on rural and urban roundabouts due to limited and/or inaccurate crash data. For future studies on SCI roundabouts, we propose investigating the influence of the length of the separated area in the central island and the impact of traffic lights on these roundabouts to prioritize the public transit system and improve the safety performance of SCI roundabouts.
Author Contributions
Funding
Institutional Review Board Statement
Informed Consent Statement
Data Availability Statement
Conflicts of Interest
References
- Fernandes, P.; Salamati, K.; Rouphail, N.M.; Coelho, M.C. The effect of a roundabout corridor’s design on selecting the optimal crosswalk location: A multi-objective impact analysis. Int. J. Sustain. Transp. 2017, 11, 206–220. [Google Scholar] [CrossRef]
- Rahmani, O.; Abdollahzadeh Nasiri, A.S.; Aghayan, I. The Effect of the Number of Right-Turn and Left-Turn Lanes on the Performance of Undersaturated Signalized Intersections. J. Adv. Transp. 2023, 2023, 8764498. [Google Scholar] [CrossRef]
- Montella, A. Identifying crash contributory factors at urban roundabouts and using association rules to explore their relationships to different crash types. Accid. Anal. Prev. 2011, 43, 1451–1463. [Google Scholar] [CrossRef]
- Shawky, M.; Alsobky, A.; Al Sobky, A.; Hassan, A. Traffic safety assessment for roundabout intersections using drone photography and conflict technique. Ain Shams Eng. J. 2023, 14, 102115. [Google Scholar] [CrossRef]
- Gettman, D.; Pu, L.; Sayed, T.; Shelby, S.G.; Energy, S. Surrogate Safety Assessment Model and Validation; Turner-Fairbank Highway Research Center: McLean, VA, USA, 2008. [Google Scholar]
- Wang, C.; Xie, Y.; Huang, H.; Liu, P. A review of surrogate safety measures and their applications in connected and automated vehicles safety modeling. Accid. Anal. Prev. 2021, 157, 106157. [Google Scholar] [CrossRef]
- Tollazzi, T. Alternative Types of Roundabouts; Springer: Cham, Switzerland, 2015. [Google Scholar]
- Gitelman, V.; Korchatov, A. Exploring the safety level of a signalized roundabout with crossing BRT: An observational pilot, in Israel. Trans. Transp. Sci. 2022, 12, 44–54. [Google Scholar] [CrossRef]
- Aakre, E.; Aakre, A. Simulating transit priority: Continuous median lane roundabouts. Procedia Comput. Sci. 2017, 109, 849–854. [Google Scholar] [CrossRef]
- Xiao, G.; Xiao, Y.; Ni, A.; Zhang, C.; Zong, F. Exploring influence mechanism of bikesharing on the use of public transportation—A case of Shanghai. Transp. Lett. 2023, 15, 269–277. [Google Scholar] [CrossRef]
- Guangnian, X.; Qiongwen, L.; Anning, N.; Zhang, C. Research on carbon emissions of public bikes based on the life cycle theory. Transp. Lett. 2023, 15, 278–295. [Google Scholar] [CrossRef]
- Leonardi, S.; Distefano, N. Turbo-Roundabouts as an Instrument for Improving the Efficiency and Safety in Urban Area: An Italian Case Study. Sustainability 2023, 15, 3223. [Google Scholar] [CrossRef]
- Sadeq, H.; Sayed, T. Automated roundabout safety analysis: Diagnosis and remedy of safety problems. J. Transp. Eng. 2016, 142, 04016062. [Google Scholar] [CrossRef]
- Feldman, O. The GEH Measure and Quality of the Highway Assignment Models; Association for European Transport and Contributors: London, UK, 2012. [Google Scholar]
- Sha, D.; Gao, J.; Yang, D.; Zuo, F.; Ozbay, K. Calibrating stochastic traffic simulation models for safety and operational measures based on vehicle conflict distributions obtained from aerial and traffic camera videos. Accid. Anal. Prev. 2023, 179, 106878. [Google Scholar] [CrossRef] [PubMed]
- Aminfar, A.; Boroujerdian, A.M.; Karimi, A. Evaluation of Reverse Curves Focusing on the Lateral Friction Demand on Four-lane Divided Highways. Transp. Eng. 2023, 13, 100188. [Google Scholar] [CrossRef]
- Giuffrè, O.; Granà, A.; Tumminello, M.L.; Giuffrè, T.; Trubia, S. Surrogate measures of safety at roundabouts in AIMSUN and VISSIM environment. In Roundabouts as Safe and Modern Solutions in Transport Networks and Systems: 15th Scientific and Technical Conference “Transport Systems. Theory and Practice 2018”, Katowice, Poland, September 17–19, 2018, Selected Papers; Springer International Publishing: Cham, Switzerland, 2019; pp. 53–64. [Google Scholar]
- Bahmankhah, B.; Macedo, E.; Fernandes, P.; Coelho, M.C. Micro driving behaviour in different roundabout layouts: Pollutant emissions, vehicular jerk, and traffic conflicts analysis. Transp. Res. Procedia 2022, 62, 501–508. [Google Scholar] [CrossRef]
- Karwand, Z.; Mokhtar, S.; Suzuki, K.; Oloruntobi, O.; Shah, M.Z.; Misnan, S.H. Impact of Splitter-Island on Pedestrian Safety at Roundabout Using Surrogate Safety Measures: A Comparative Study. Sustainability 2023, 15, 5359. [Google Scholar] [CrossRef]
- Vasconcelos, L.; Silva, A.B.; Seco, Á.M.; Fernandes, P.; Coelho, M.C. Turboroundabouts: Multicriterion assessment of intersection capacity, safety, and emissions. Transp. Res. Rec. 2014, 2402, 28–37. [Google Scholar] [CrossRef]
- Jiang, C.; He, J.; Zhu, S.; Zhang, W.; Li, G.; Xu, W. Injury-Based Surrogate Resilience Measure: Assessing the Post-Crash Traffic Resilience of the Urban Roadway Tunnels. Sustainability 2023, 15, 6615. [Google Scholar] [CrossRef]
- Ding, S.; Abdel-Aty, M.; Zheng, O.; Wang, Z.; Wang, D. Clustering framework to identify traffic conflicts and determine thresholds based on trajectory data. arXiv 2023, arXiv:2303.16651. [Google Scholar]
- Giuffrè, T.; Granà, A.; Trubia, S. Safety evaluation of turbo-roundabouts with and without internal traffic separations considering autonomous vehicles operation. Sustainability 2021, 13, 8810. [Google Scholar] [CrossRef]
- Hydén, C. The Development of a Method for Traffic Safety Evaluation: The Swedish Conflicts Technique; Department of Traffic Planning and Engineering, Lund University: Lund, Sweden, 1987; p. 5. [Google Scholar]
- Souleyrette, R.; Hochstein, J. Development of a Conflict Analysis Methodology Using SSAM (No. InTrans Project10-376); The Institute for Transportation, Iowa State University: Ames, IA, USA, 2012. [Google Scholar]
- Kronprasert, N.; Sutheerakul, C.; Satiennam, T.; Luathep, P. Intersection safety assessment using video-based traffic conflict analysis: The case study of Thailand. Sustainability 2021, 13, 12722. [Google Scholar] [CrossRef]
- Giuffrè, T.; Trubia, S.; Canale, A.; Persaud, B. Using microsimulation to evaluate safety and operational implications of newer roundabout layouts for European Road networks. Sustainability 2017, 9, 2084. [Google Scholar] [CrossRef]
- Tesoriere, G.; Campisi, T.; Canale, A.; Zgrablić, T. The surrogate safety appraisal of the unconventional elliptical and turbo roundabouts. J. Adv. Transp. 2018, 2018, 2952074. [Google Scholar] [CrossRef]
- Giuffrè, O.; Granà, A.; Tumminello, M.L.; Giuffrè, T.; Trubia, S.; Sferlazza, A.; Rencelj, M. Evaluation of roundabout safety performance through surrogate safety measures from microsimulation. J. Adv. Transp. 2018, 2018, 4915970. [Google Scholar] [CrossRef]
- Liu, Q.; Deng, J.; Shen, Y.; Wang, W.; Zhang, Z.; Lu, L. Safety and efficiency analysis of turbo roundabout with simulations based on the Lujiazui roundabout in Shanghai. Sustainability 2020, 12, 7479. [Google Scholar] [CrossRef]
- Gallelli, V.; Guido, G.; Vitale, A.; Vaiana, R. Effects of calibration process on the simulation of rear-end conflicts at roundabouts. J. Traffic Transp. Eng. (Engl. Ed. ) 2019, 6, 175–184. [Google Scholar] [CrossRef]
- Virdi, N.; Grzybowska, H.; Waller, S.T.; Dixit, V. A safety assessment of mixed fleets with connected and autonomous vehicles using the surrogate safety assessment module. Accid. Anal. Prev. 2019, 131, 95–111. [Google Scholar] [CrossRef]
- Ghanim, M.; Kharbeche, M.; Hannun, J.; Hannun, J.; Shamiyeh, K. Safety and operational performance of signalized roundabouts: A case study in doha. Procedia Comput. Sci. 2020, 170, 427–433. [Google Scholar] [CrossRef]
- Morando, M.M.; Tian, Q.; Truong, L.T.; Vu, H.L. Studying the safety impact of autonomous vehicles using simulation-based surrogate safety measures. J. Adv. Transp. 2018, 2018, 6135183. [Google Scholar] [CrossRef]
- Al-Ghandour, M.N.; Schroeder, B.J.; Williams, B.M.; Rasdorf, W.J. Conflict models for single-lane roundabout slip lanes from microsimulation: Development and validation. Transp. Res. Rec. 2011, 2236, 92–101. [Google Scholar] [CrossRef]
- Bulla-Cruz, L.A.; Laureshyn, A.; Lyons, L. Event-based road safety assessment: A novel approach towards risk microsimulation in roundabouts. Measurement 2020, 165, 108192. [Google Scholar] [CrossRef]
- Li, R.; Liang, G.; Chen, Y.; Zhang, D.; Wang, B. Analysis of Conflict Distribution Characteristics between Motor Vehicles and E-Bikes at Roundabouts. Appl. Sci. 2023, 13, 3475. [Google Scholar] [CrossRef]
- Shaaban, K.; Hamad, H. Critical gap comparison between one-, two-, and three-lane roundabouts in Qatar. Sustainability 2020, 12, 4232. [Google Scholar] [CrossRef]
- Elhassy, Z.; Abou-Senna, H.; Shaaban, K.; Radwan, E. The implications of converting a high-volume multilane roundabout into a turbo roundabout. J. Adv. Transp. 2020, 2020, 5472806. [Google Scholar] [CrossRef]
- Shaaban, K.; Hamad, H. Group gap acceptance: A new method to analyze driver behavior and estimate the critical gap at multilane roundabouts. J. Adv. Transp. 2018, 2018, 1350679. [Google Scholar] [CrossRef]
- Osama, A.; Sayed, T.; Zaki, M.H.; Shaaban, K. An inclusive framework for automatic safety evaluation of roundabouts. J. Transp. Saf. Secur. 2016, 8, 377–394. [Google Scholar] [CrossRef]
- Zakeri, S.; Choupani, A.A. Operational Evaluation of a Throughabout to Give Priority to Public Transport at Standard Roundabouts. J. Adv. Transp. 2021, 2021, 1840040. [Google Scholar] [CrossRef]
- Pu, L.; Joshi, R.; Energy, S. Surrogate Safety Assessment Model (SSAM)—Software User Manual; Turner-Fairbank Highway Research Center: McLean, VA, USA, 2008. [Google Scholar]


| TTC Score | TTC Range (s) | Frequency (%) | TTC Risk Level |
|---|---|---|---|
| 3 | 0 ≤ TTC ≤ 1.5 | 51.6 | Extreme |
| 2 | 1.5 ≤ TTC ≤ 2.5 | 17.4 | High |
| 1 | 2.5 ≤ TTC ≤ 4 | 15.7 | Moderate |
| 0 | TTC ≥ 4 | 15.3 | Low |
| MaxΔV Score | MaxΔV Range (km/h) | Frequency (%) | Severity Level |
| 1 | MaxΔV ≤ 32 | 99.98 | Low |
| 2 | 32 ≤ MaxΔV ≤ 64 | 0.01 | Moderate |
| 3 | MaxΔV > 64 | 0.01 | High |
| Conflict Classification | Overall Severity Score | Frequency (%) | Severity Level |
| Potential | 1 | 15.35 | Low ≈ Damage Only |
| 2 | 15.7 | ||
| Slight | 3 | 17.4 | Moderate ≈ Injury |
| 4 | 51.54 | ||
| Serious | 5 | 0 | High ≈ Fatality |
| 6 | 0.01 |
| TTC ROC | ΔV ROC | Overall ROC | Frequency (%) |
|---|---|---|---|
| 0 ≤ TTC ≤ 1.5 | MaxΔV ≤ 32 | 4 | 305 (55.05%) |
| 32 ≤ MaxΔV ≤ 64 | 5 | 0 (0%) | |
| MaxΔV > 64 | 6 | 1 (0.19%) | |
| 1.5 ≤ TTC ≤ 2.5 | MaxΔV ≤ 32 | 3 | 49 (8.84%) |
| 32 ≤ MaxΔV ≤ 64 | 4 | 0 (0%) | |
| MaxΔV > 64 | 5 | 0 (0%) | |
| 2.5 ≤ TTC ≤ 4 | MaxΔV ≤ 32 | 2 | 68 (12.26%) |
| 32 ≤ MaxΔV ≤ 64 | 3 | 1 (0.19%) | |
| MaxΔV > 64 | 4 | 0 (0%) | |
| TTC ≥ 4 | MaxΔV ≤ 32 | 1 | 130 (23.47%) |
| 32 ≤ MaxΔV ≤ 64 | 2 | 0 (0%) | |
| MaxΔV > 64 | 3 | 0 (0%) |
| Conflict Classification | Overall Severity Score | Frequency (%) | Severity Level |
|---|---|---|---|
| Potential | 1 | 198 (35.76%) | Damage Only |
| 2 | |||
| Slight | 3 | 355 (64.05%) | Injury |
| 4 | |||
| Serious | 5 | 1 (0.19%) | Fatality |
| 6 |
| TTC ROC | ΔV ROC | Overall ROC | Frequency (%) |
|---|---|---|---|
| 0 ≤ TTC ≤ 1.5 | MaxΔV ≤ 32 | 4 | 3628 (51.5%) |
| 32 ≤ MaxΔV ≤ 64 | 5 | 0 | |
| MaxΔV > 64 | 6 | 0 | |
| 1.5 ≤ TTC ≤ 2.5 | MaxΔV ≤ 32 | 3 | 1196 (16.98%) |
| 32 ≤ MaxΔV ≤ 64 | 4 | 0 | |
| MaxΔV > 64 | 5 | 0 | |
| 2.5 ≤ TTC ≤ 4 | MaxΔV ≤ 32 | 2 | 1121 (15.92%) |
| 32 ≤ MaxΔV ≤ 64 | 3 | 0 | |
| MaxΔV > 64 | 4 | 0 | |
| TTC ≥ 4 | MaxΔV ≤ 32 | 1 | 1099 (15.6%) |
| 32 ≤ MaxΔV ≤ 64 | 2 | 0 | |
| MaxΔV > 64 | 3 | 0 |
| Conflict Classification | Overall Severity Score | Frequency (%) | Severity Level |
|---|---|---|---|
| Potential | 1 | 2220 (31.52%) | Damage Only |
| 2 | |||
| Slight | 3 | 4824 (68.48%) | Injury |
| 4 | |||
| Serious | 5 | 0 | Fatality |
| TTC ROC | ΔV ROC | Overall ROC | Frequency (%) |
|---|---|---|---|
| 0 ≤ TTC ≤ 1.5 | MaxΔV ≤ 32 | 4 | 1558 (51%) |
| 32 ≤ MaxΔV ≤ 64 | 5 | 0 | |
| MaxΔV > 64 | 6 | 0 | |
| 1.5 ≤ TTC ≤ 2.5 | MaxΔV ≤ 32 | 3 | 606 (19.84%) |
| 32 ≤ MaxΔV ≤ 64 | 4 | 0 | |
| MaxΔV > 64 | 5 | 0 | |
| 2.5 ≤ TTC ≤ 4 | MaxΔV ≤ 32 | 2 | 484 (15.84%) |
| 32 ≤ MaxΔV ≤ 64 | 3 | 0 | |
| MaxΔV > 64 | 4 | 0 | |
| TTC ≥ 4 | MaxΔV ≤ 32 | 1 | 407 (13.32%) |
| 32 ≤ MaxΔV ≤ 64 | 2 | 0 | |
| MaxΔV > 64 | 3 | 0 |
| Conflict Classification | Overall Severity Score | Frequency (%) | Severity Level |
|---|---|---|---|
| Potential | 1 | 891 (29.17%) | Damage Only |
| 2 | |||
| Slight | 3 | 2164 (70.83%) | Injury |
| 4 | |||
| Serious | 5 | 0 | Fatality |
| Sections of SCI Roundabout | Safety Zone Number | Number of Conflict Type (%) | ||
|---|---|---|---|---|
| Crossing | Rear-End | Lane Change | ||
| Exit Section | 1 | 18 | 72.13 | 9.87 |
| 4 | 18.75 | 72.5 | 8.75 | |
| 7 | 21.95 | 41.46 | 36.59 | |
| 10 | 6.6 | 26.6 | 66.8 | |
| Entry Section | 2 | 13.95 | 76.74 | 9.31 |
| 5 | 7.69 | 87.69 | 4.62 | |
| 8 | 20.58 | 55.88 | 23.54 | |
| 11 | 3 | 93.93 | 3.07 | |
| Weaving Section | 3 | 5.65 | 66.07 | 28.28 |
| 6 | 4.93 | 46.71 | 48.36 | |
| 9 | 1 | 70.23 | 28.77 | |
| 12 | 3.82 | 49.36 | 46.82 | |
| Crossing Section | 13 | 14.03 | 56.14 | 29.83 |
| 14 | 13.42 | 68.45 | 18.13 | |
Disclaimer/Publisher’s Note: The statements, opinions and data contained in all publications are solely those of the individual author(s) and contributor(s) and not of MDPI and/or the editor(s). MDPI and/or the editor(s) disclaim responsibility for any injury to people or property resulting from any ideas, methods, instructions or products referred to in the content. |
© 2023 by the authors. Licensee MDPI, Basel, Switzerland. This article is an open access article distributed under the terms and conditions of the Creative Commons Attribution (CC BY) license (https://creativecommons.org/licenses/by/4.0/).
Share and Cite
Hasanvand, M.; Nasiri, A.S.A.; Rahmani, O.; Shaaban, K.; Samadi, H. A Conflict-Based Safety Diagnosis of SCI Roundabouts Using a Surrogate Safety Measure Model. Sustainability 2023, 15, 13166. https://doi.org/10.3390/su151713166
Hasanvand M, Nasiri ASA, Rahmani O, Shaaban K, Samadi H. A Conflict-Based Safety Diagnosis of SCI Roundabouts Using a Surrogate Safety Measure Model. Sustainability. 2023; 15(17):13166. https://doi.org/10.3390/su151713166
Chicago/Turabian StyleHasanvand, Mehrzad, Amir Saman Abdollahzadeh Nasiri, Omid Rahmani, Khaled Shaaban, and Hossein Samadi. 2023. "A Conflict-Based Safety Diagnosis of SCI Roundabouts Using a Surrogate Safety Measure Model" Sustainability 15, no. 17: 13166. https://doi.org/10.3390/su151713166
APA StyleHasanvand, M., Nasiri, A. S. A., Rahmani, O., Shaaban, K., & Samadi, H. (2023). A Conflict-Based Safety Diagnosis of SCI Roundabouts Using a Surrogate Safety Measure Model. Sustainability, 15(17), 13166. https://doi.org/10.3390/su151713166