Article

Development of Artificial Intelligence Based Safety Performance Measures for Urban Roundabouts

1
Civil Engineering Department, College of Engineering, Jouf University, Sakaka 72388, Saudi Arabia
2
Department of Civil Engineering, Kano State Polytechnic, Kano P.M.B 3401, Nigeria
3
Department of Civil Engineering, Bayero University Kano, Kano P.M.B 3011, Nigeria
4
Public Works Engineering Department, Faculty of Engineering, Mansoura University, Mansoura City 35516, Egypt
*
Author to whom correspondence should be addressed.
Sustainability 2023, 15(14), 11429; https://doi.org/10.3390/su151411429
Submission received: 2 July 2023 / Revised: 18 July 2023 / Accepted: 19 July 2023 / Published: 23 July 2023

Abstract

:
A reliable model for predicting crash frequency at roundabouts is an essential tool for evaluating the safety measures of a roundabout. This study developed a hybrid PSO-ANN model by optimizing the modeling parameters of the classical artificial neural network (ANN) model with the particle swarm optimization algorithm (PSO). The performance accuracy of the models was evaluated using the mean absolute error (MAE), root mean square error (RMSE), and determination coefficients (DC). The PSO-ANN model predicted the crash frequency with very good accuracy at the testing stage (DC = 0.7935). The hybrid model could improve the performance of the classical ANN model by up to 23.3% in the training stage and 16.9% in the testing stage. In addition to the statistical measures, graphical approaches (scatter and violin plots) were also used for evaluating the models’ accuracy. Both statistical and graphical evaluation techniques prove the reliability and accuracy of the proposed hybrid model in predicting the crash frequency at roundabouts.

1. Introduction

There is growing public health concern over traffic accidents, which have claimed the lives of about 1.24 million people and resulted in 20–50 million nonfatal injuries. According to the World Health Organization, road accidents accounted for more than 38 million lost disability-adjusted life years (DALYs), or 2.6% of the worldwide burden of illness. Globally, low- and middle-income countries account for 91.8% of DALYs lost due to road traffic injuries [1]. For improved safety and traffic flow at intersections, roundabouts were introduced as an alternative method of controlling intersections without requiring the extension of the existing lanes [2]. The idea of employing roundabouts was first conceived in the United Kingdom to overcome concerns with traffic circles. The effective implementation of modern roundabouts was made possible by changes in driving legislation, such as the need for entering vehicles to yield to circular traffic. Compared to the signalized intersection with a roundabout, this has improved the roundabout’s safety and functionality [3].
Jordan has one of the highest rates of traffic accidents among Middle Eastern nations. The traffic density in the city of Amman is high, with an annual increase of 5.5% in the number of registered vehicles. The capital of Jordan, Amman, sees the bulk of the accidents as it has the country’s largest population density, a congested street system, and a high proportion of roundabouts [3]. In 2015, 9712 accidents occurred, resulting in 608 deaths and 2021 major injuries. These accidents cost the region approximately USD 400 million in the year 2010 alone. Traffic accidents increased by 75% between 2004–2007 as a result of the increase in the number of registered vehicles [3].
Road safety performance measures are indicators of the number of accidents and causalities (fatalities and injuries), the response time, and the public perception of road safety. The performance measures serve as decision-making tools during planning and decision-making processes. Crash prediction models are used for evaluating the safety performance at roundabouts. This is because crash prediction models are used for predicting the number of accidents, fatalities, or injuries at roundabouts. Several studies have developed various crash models at roundabouts; for example, [4] identified the causes of accidents at roundabouts and developed several models for the prediction of accidents at roundabouts. The study also created a crash modification factor for assessing the safety performance of roundabouts in India. The negative binomial was discovered to be the best empirical model for predicting accidents at roundabouts. Another study [5] analyzed roundabout safety measures in Abu Dhabi by evaluating the operating speeds, roundabouts, and a questionnaire survey. From the questionnaire survey, it was found that the drivers preferred not to drive through roundabouts in the city because they perceived the roundabouts to be unsafe. From the operating speed, it was also observed that the drivers drove above the recommended speeds at roundabouts. Using ordinal regression models, drivers below the age of 40 were found to have less understanding of the traffic rules at roundabouts [6].
Although several safety performance measures at roundabouts were proposed in the literature, differences in the traffic characteristics and road geometries between countries make the generalization of the model impossible, especially in countries that have different traffic characteristics. This leads to the application of various artificial intelligence-based models in developing various road safety performance measures. For example, [7] employed a recurrent neural network to forecast the severity of traffic accidents in Malaysia over a 6-year period. The recurrent neural network (RNN) model predicted the accident severity with high accuracy compared to the traditional ANN models. A study used 3-year traffic accident data to develop an ANN model that will serve as a decision-making tool for the stakeholders responsible for infrastructure management in Swiss. The input parameters for the model were the annual average daily traffic, average curve radius, percentage of heavy vehicles, positive/negative mean slopes, speed limits, number of lanes in each direction, road type indicator, surface adhesion, and longitudinal evenness rating of the roads. In terms of the mean absolute error, the model proved reliable in predicting traffic accidents [8]. Another work used the ANN model to predict traffic accidents in Jordan. The predicted accident data generated using the ANN model was found to be close to the actual data, demonstrating the accuracy and reliability of the constructed ANN model. The model accepts the following input parameters: population, GDP, length of paved roads, and number of registered automobiles [9].
Another study trained an ANN model using the Levenberg Marquardt training algorithm and using the sigmoid activation function for modelling the severity of injury accidents in Spain. The model predicted the severity of the accident with high accuracy, and hence can serve as a useful tool for safety and researchers. The ANN model outperformed the multivariate regression model, proving its higher prediction accuracy [10]. A study used 57-year data of the gross domestic product per capita, population, total number of accidents, number of registered vehicles for modelling injury, and fatality index in Nigeria. The ANN models model the injury/fatality index with high accuracy and outperformed the multilinear regression model for both models. The literature shows that the ANN model has a strong ability to model the crash frequency and severity with high accuracy compared with the regression and other empirical models [11].
Although ANN models have been shown to be effective in modeling traffic accidents and their severity, they have shortcomings such as overfitting in forecasting, underestimation, low generalization ability, inability to provide uncertain forecasting, and the requirement to use external data pre-/post-processing techniques outside the framework of the model due to insufficient data samples for model validation. In recent years, nature-inspired algorithms—such as genetic algorithms (GA), ant colony optimization (ACO), bacterial foraging optimization (BFO), artificial bee colony (ABC), and particle swarm optimization (PSO)—have emerged to optimize the ANN parameters [12]. Several studies have found that the PSO outperforms alternative nature-inspired algorithms [13]. As a result, it is used in the current study to optimize the ANN model for crash frequency prediction. Using local traffic data, the current study created a safety performance measure at a roundabout in Amman, Jordan. The specific objectives of the current study include:
  • Identifying the roundabout parameters that are most responsible for improved safety at the roundabouts.
  • Developing an optimized particle swarm optimized-ANN (PSO-ANN) model for the prediction of crash frequency at roundabouts.
The model will provide an accurate and effective model for forecasting the collision frequency at roundabouts after being calibrated with the data from the Jordan Traffic Institute, Greater Amman Municipality, and Traffic Police Department. To the best of the author’s knowledge, the hybrid ANN-PSO model proposed in this study for crash frequency prediction is the first in the literature. Because of its robustness and efficacy in handling severely constrained non-linear optimization problems, the PSO was chosen for the optimization.

2. Materials and Methods

The proposed methodology involves two main stages; the first stage involves the selection of the most dominant input parameters through feature removal sensitivity analysis (FRSA), the maximum relevance minimum redundancy method, and the correlation coefficient values. The ANN and the hybrid ANN-PSO models were developed in the second stage using the dominant parameters. The schematic diagram of the methodology is shown in Figure 1.

2.1. Dataset

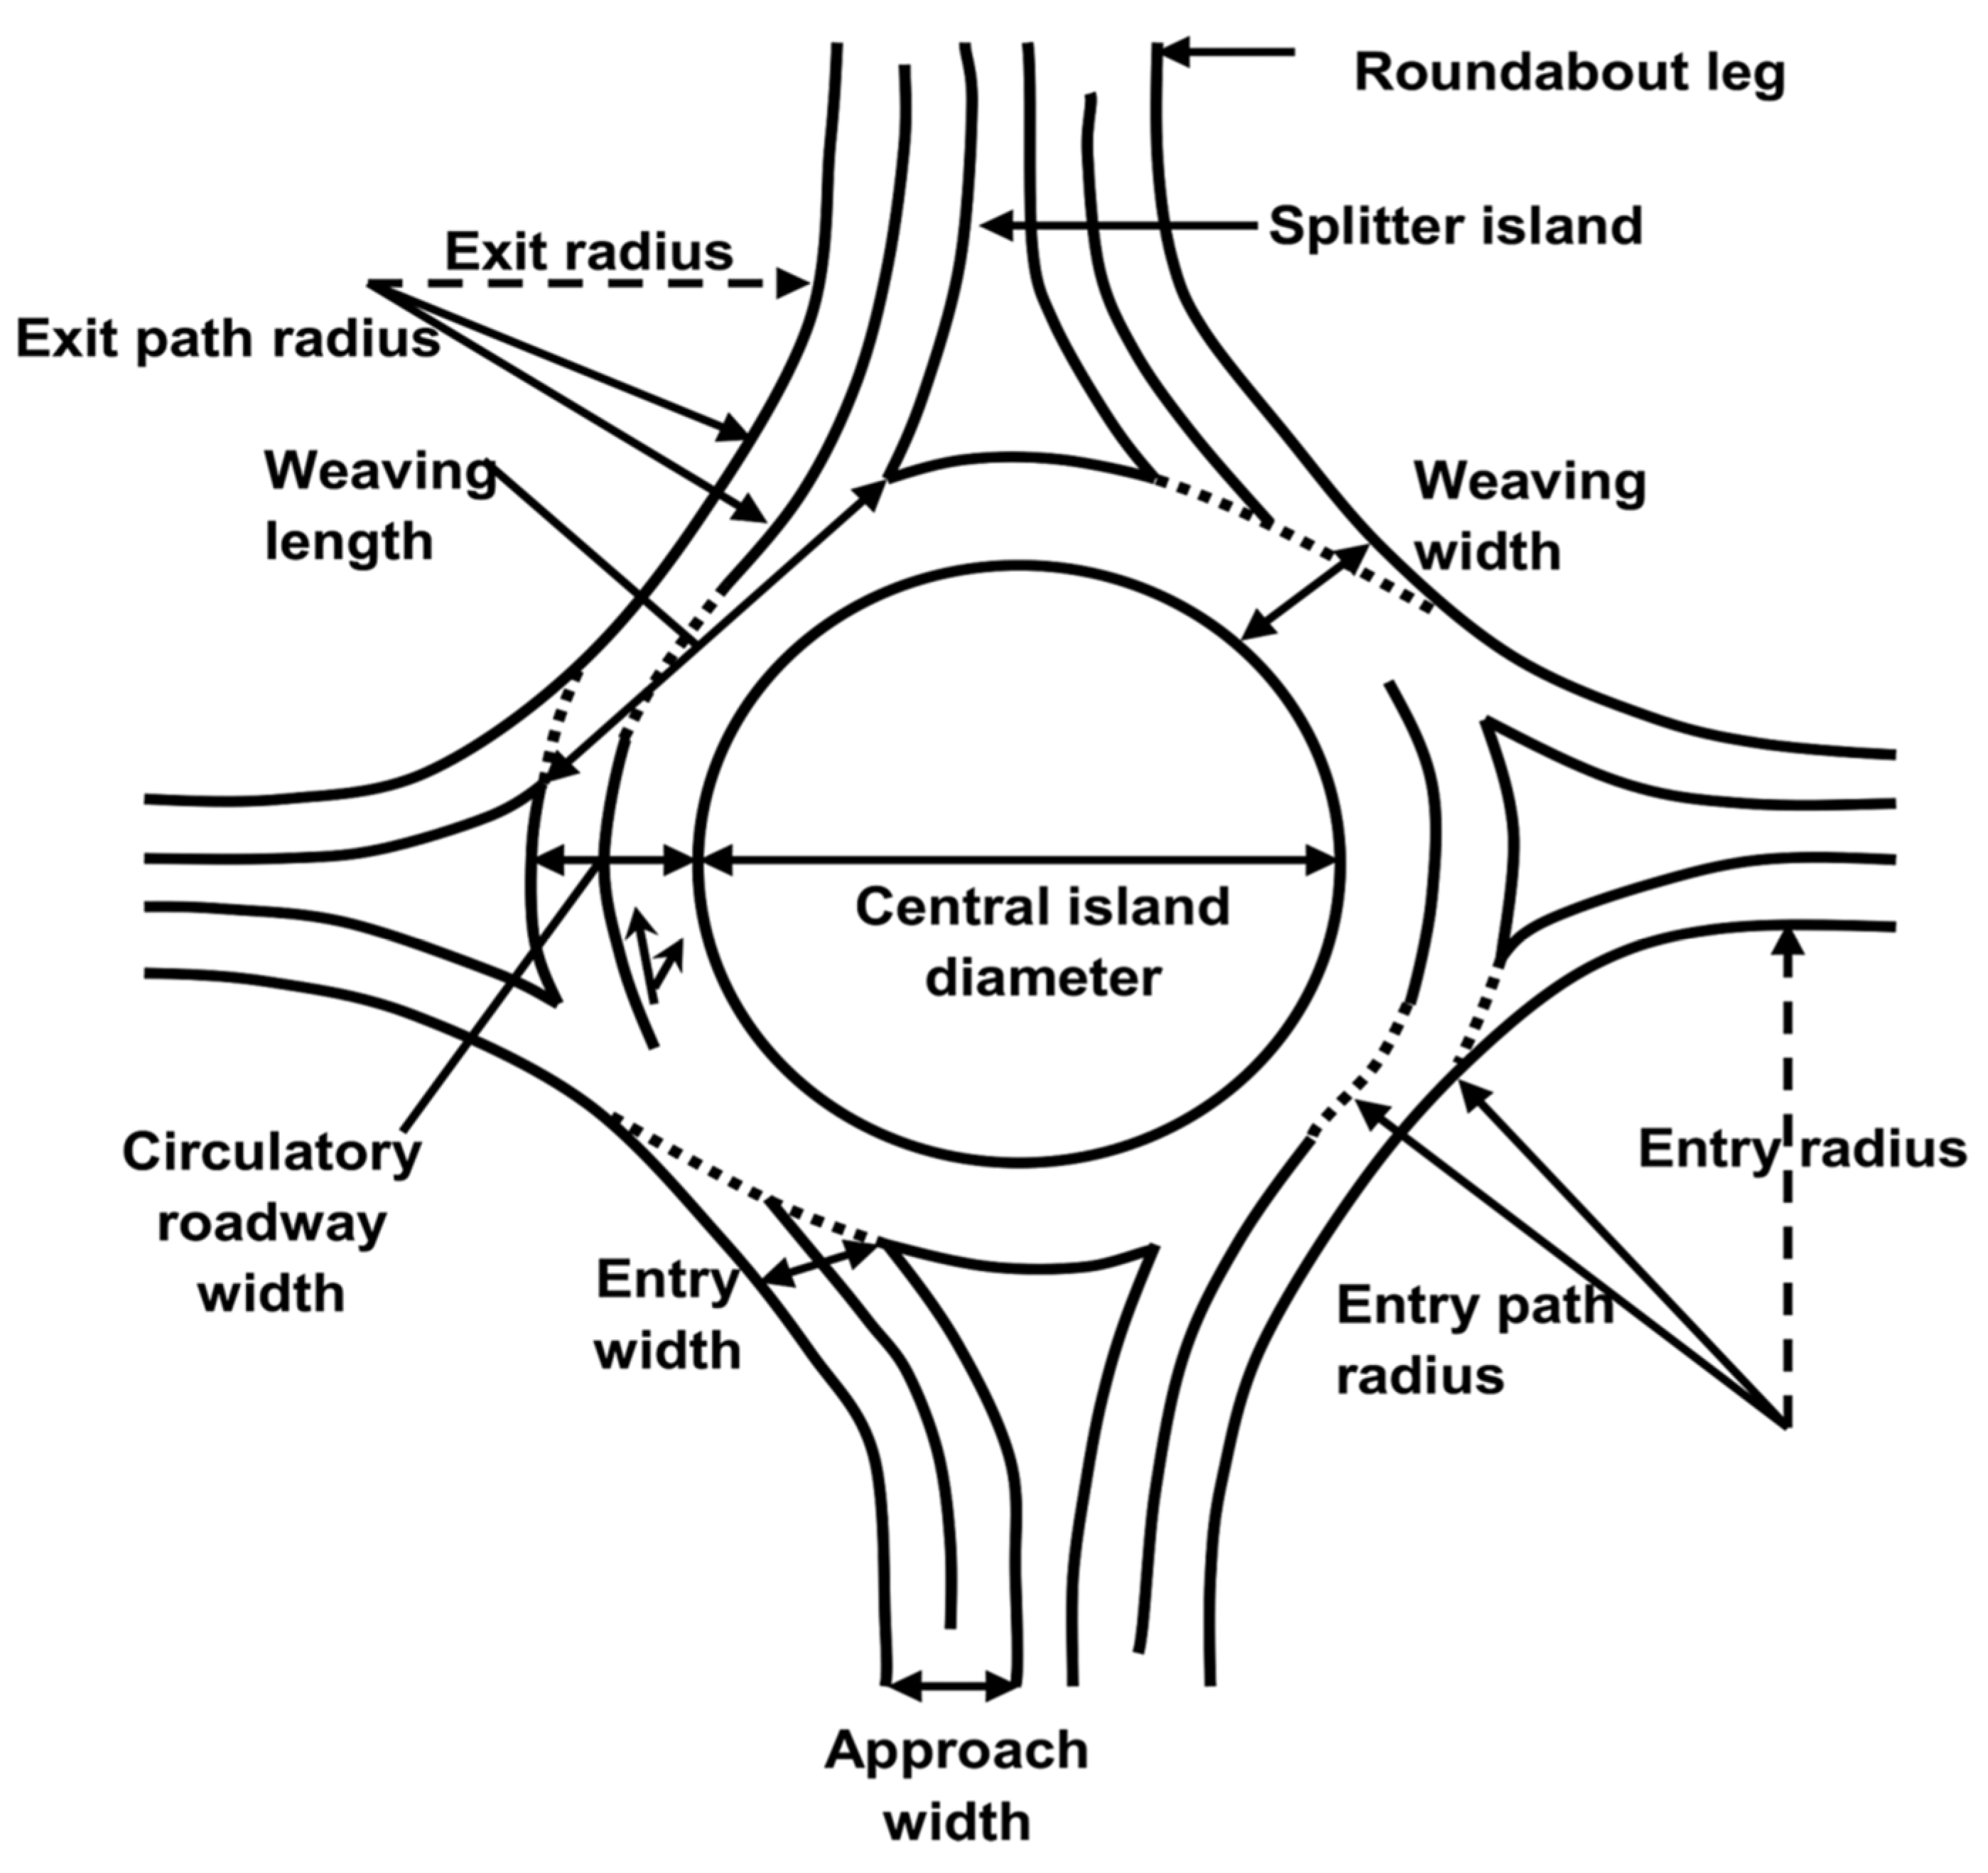
The study makes use of 112 datasets collected from 12 roundabouts (R1-12) in Amman, Jordan. The roundabout parameters include the number of accidents, the average daily traffic (ADT), the land use, the number of legs, the central island diameter (CID), the circling width, the entry angle, the entry/exit width, the entry/exit distance, the free flow speed (FFS), the capacity, the delay, the speed, the v/c, the queue length, and the location. The data were gathered from the Jordan Traffic Institute, the Traffic Police Department, and the Greater Amman Municipality. The descriptive data summary and correlation matrix between the data are given in Table 1 and Table 2, respectively. The maximum number of accidents (327 cases) was recorded at R9, followed by 322 cases at R3. The land use at R9 and R3 is business/office and commercial activities, respectively. The smallest number of accidents (0) was recorded at R1 and R6. The land use at this location is commercial for R1 and mixed use for R6. The highest and least number of accidents were recorded is commercial centers. The Average daily traffic (ADT) in the two locations is different. The ADT at R9 was 138,662 vehicles/day, while that of R1 is 7591 vehicles/day. Likewise, the ADT at R3 was 130,110 vehicles/day, while that of R6 was 16,080 vehicles. This clearly indicates that the ADT value has a significant effect on the number of accidents at the roundabout. From Table 2, it can be seen that ADT has a coefficient value of 0.83, greater than all the parameters. ADT is the most significant factor in estimating the crash frequency around the globe, as seen in several studies, such as [14]. The full data can be found at [3]. Figure 2 presents the roundabout geometry.
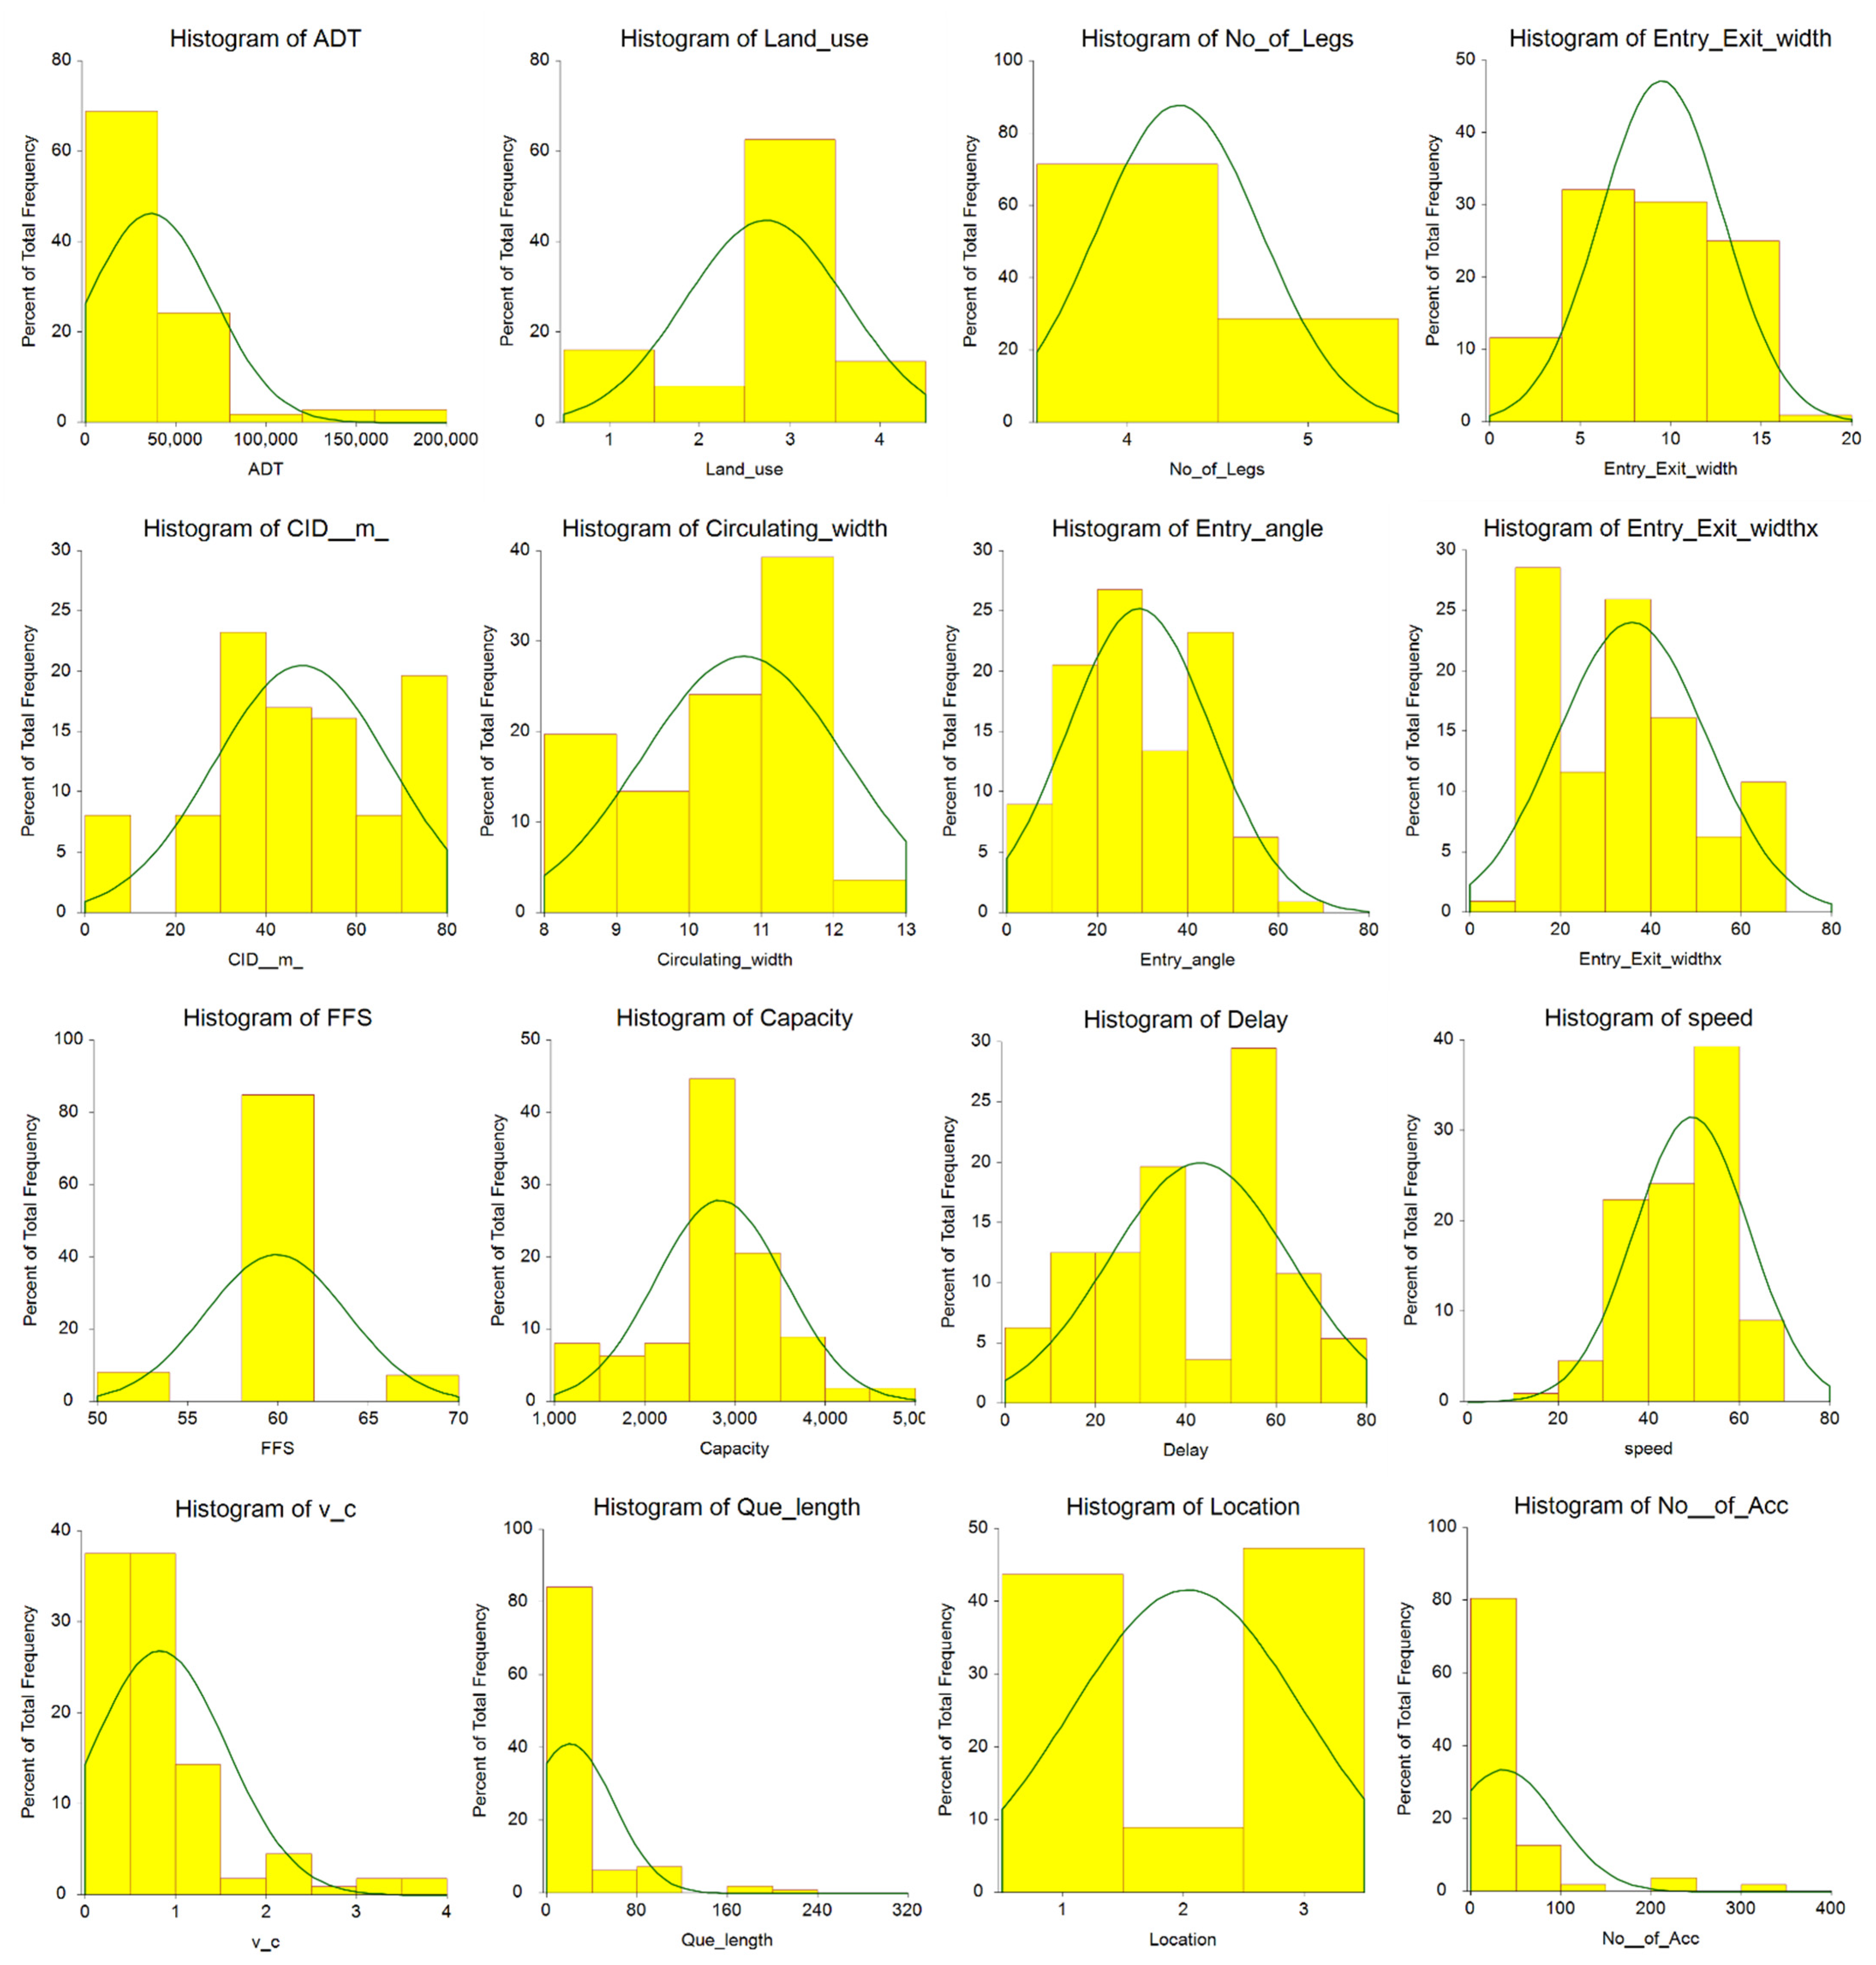
For a clear understanding of the data utilized for the study, a histogram distribution was plotted for all 15 parameters (Figure 3). It can clearly be seen that some of the parameters do not have a normal distribution (Number of accidents, ADT, CID etc.), while a few of the parameters are normally distributed (que length and capacity). The data are good for machine learning parameters as some of the parameters have a linear relationship with the target and some have a nonlinear relationship with the data. This makes the data suitable for the application of machine learning techniques. Shapiro-Wilk and Kolmogorov-Smirnov tests were further used to check the data normality. Normality was rejected in both tests at a 5% alpha value for all the parameters.

2.2. Descriptive Statistics of Data

The correlation matrix between the variable parameters of the study was developed using Ms. Excel 2016 for statistically viewing the interaction between the parameters. The correlation matrix could serve as the first measure for selecting potential input parameters to the model. It also serves as a filter for removing multicollinearity issues in the models, hence choosing only one parameter between two parameters with high correlation values. From the correlation matrix in Table 2, it can be seen that the ADT has a correlation value of 0.83 with the number of accidents, thus making it one of the most influential parameters in modelling the number of accidents. It can clearly be seen, according to the correlation matrix, that 2 potential input parameters have a correlation value of 0.75, which was considered a very good linear correlation. The parameters with a correlation value greater than 0.5 are accident location and speed (0.67), entry/exit width and capacity (0.65), number of legs and CID (0.62), entry/exit width and speed (0.58), entry angle and delay (−0.56). However, these values are not so high that one of the parameters can replace the other parameter in the models.

2.3. Artificial Neural Network

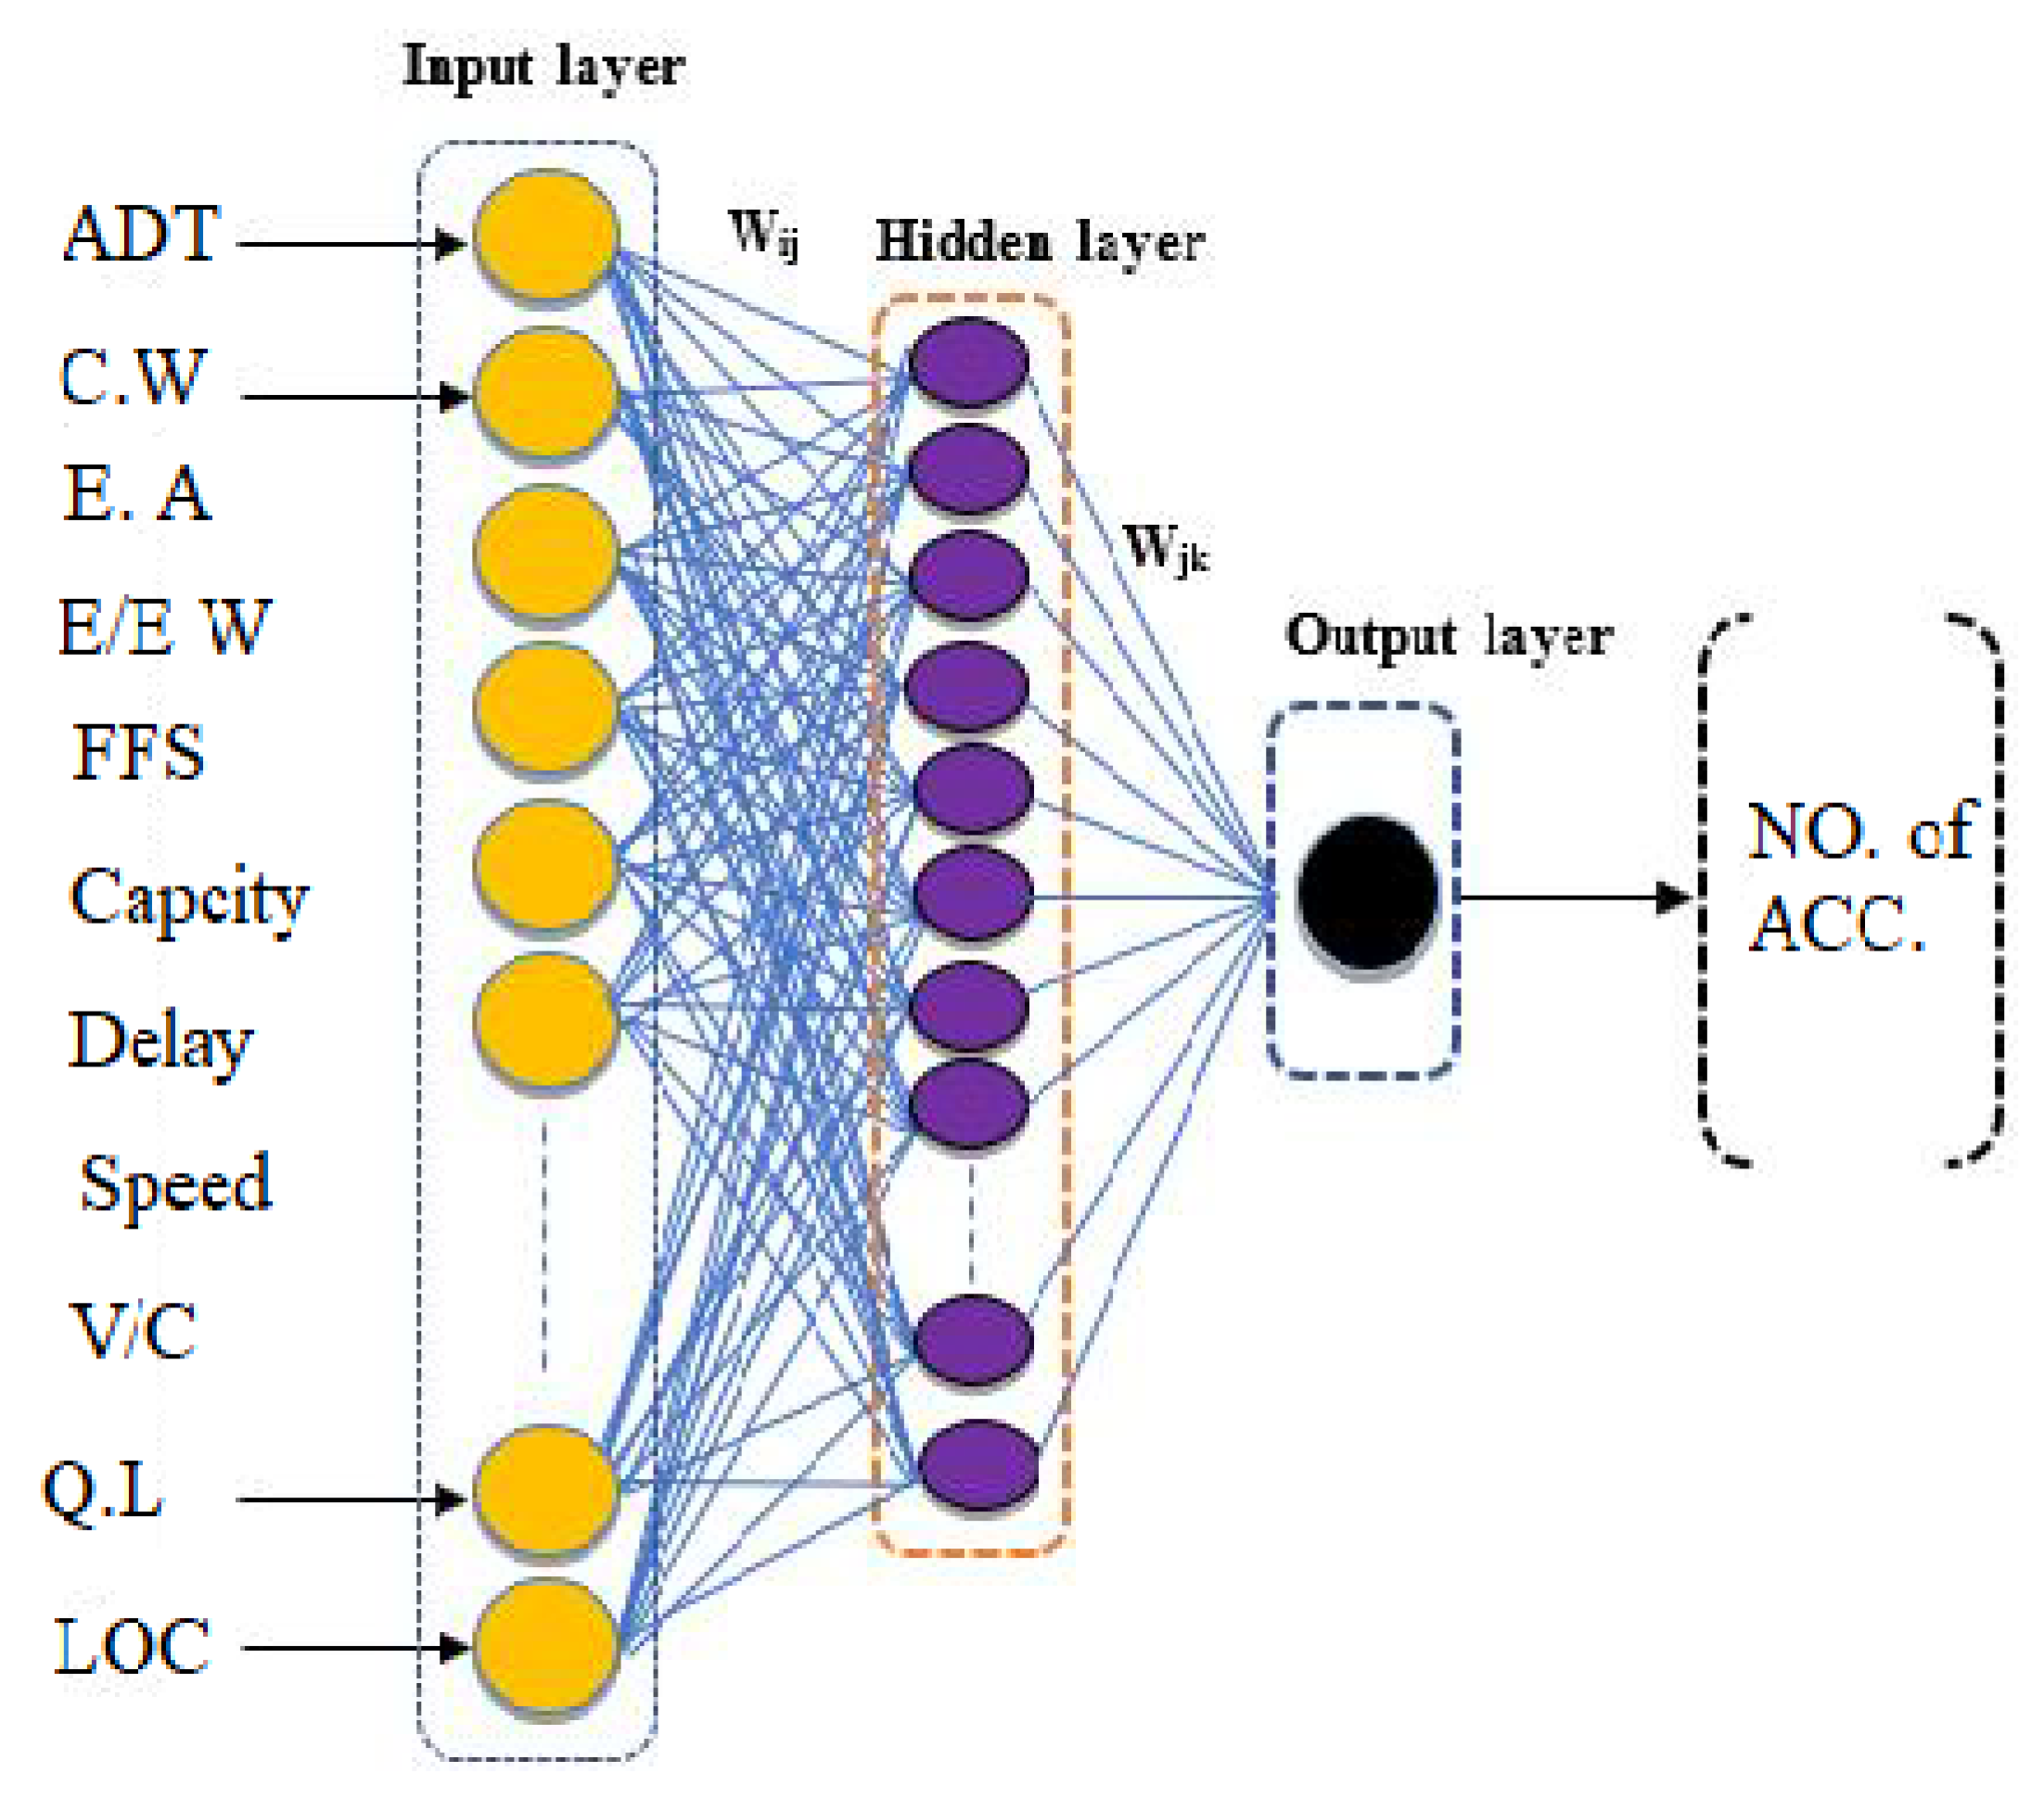
The ANN is a computational model that, in terms of both structure and function, mimics a biological neural network. In almost all engineering, research, and other fields, the neural network model is more reliable and flexible [15]. Back-propagation (BP) neural networks are the most widely used form of neural network due to their simplicity [16]. An artificial neural network is made up of interconnected artificial neurons and has layers such as an input layer, at least one hidden layer, and an output layer. The fundamental processing units of a neural network are its nodes [15]. The inputs are multiplied by a modified weight and then transmitted via a transfer function to create the output for the neurons. The most popular transfer function, the sigmoid function, is then utilized to transform the weighted sum of the inputs from the neurons. The neural network establishes connections to the input data by repeatedly altering the weights. Because it can learn from instances, the neural network excels in circumstances where there is no clear link between the input and output data [17]. The term “feed-forward network” refers to a system that spreads information in a forward direction. As a second-order variation, Levenberg-Marquardt was developed to solve the drawbacks of back-propagation algorithms. For training, it frequently uses the gradient steepest descent method. In order to maximize the weights during training, the Levenberg-Marquardt method combines the stability of the steepest descent technique with the speed advantage of the Gauss-Newton algorithm. The optimal number of hidden neurons is decided upon after a number of trials based on the number of neurons with the highest determination coefficient and the lowest mean square error between the observed and predicted data [15]. The structure of the ANN model is given in Figure 4.

2.4. Particle Swarm Optimization (PSO)

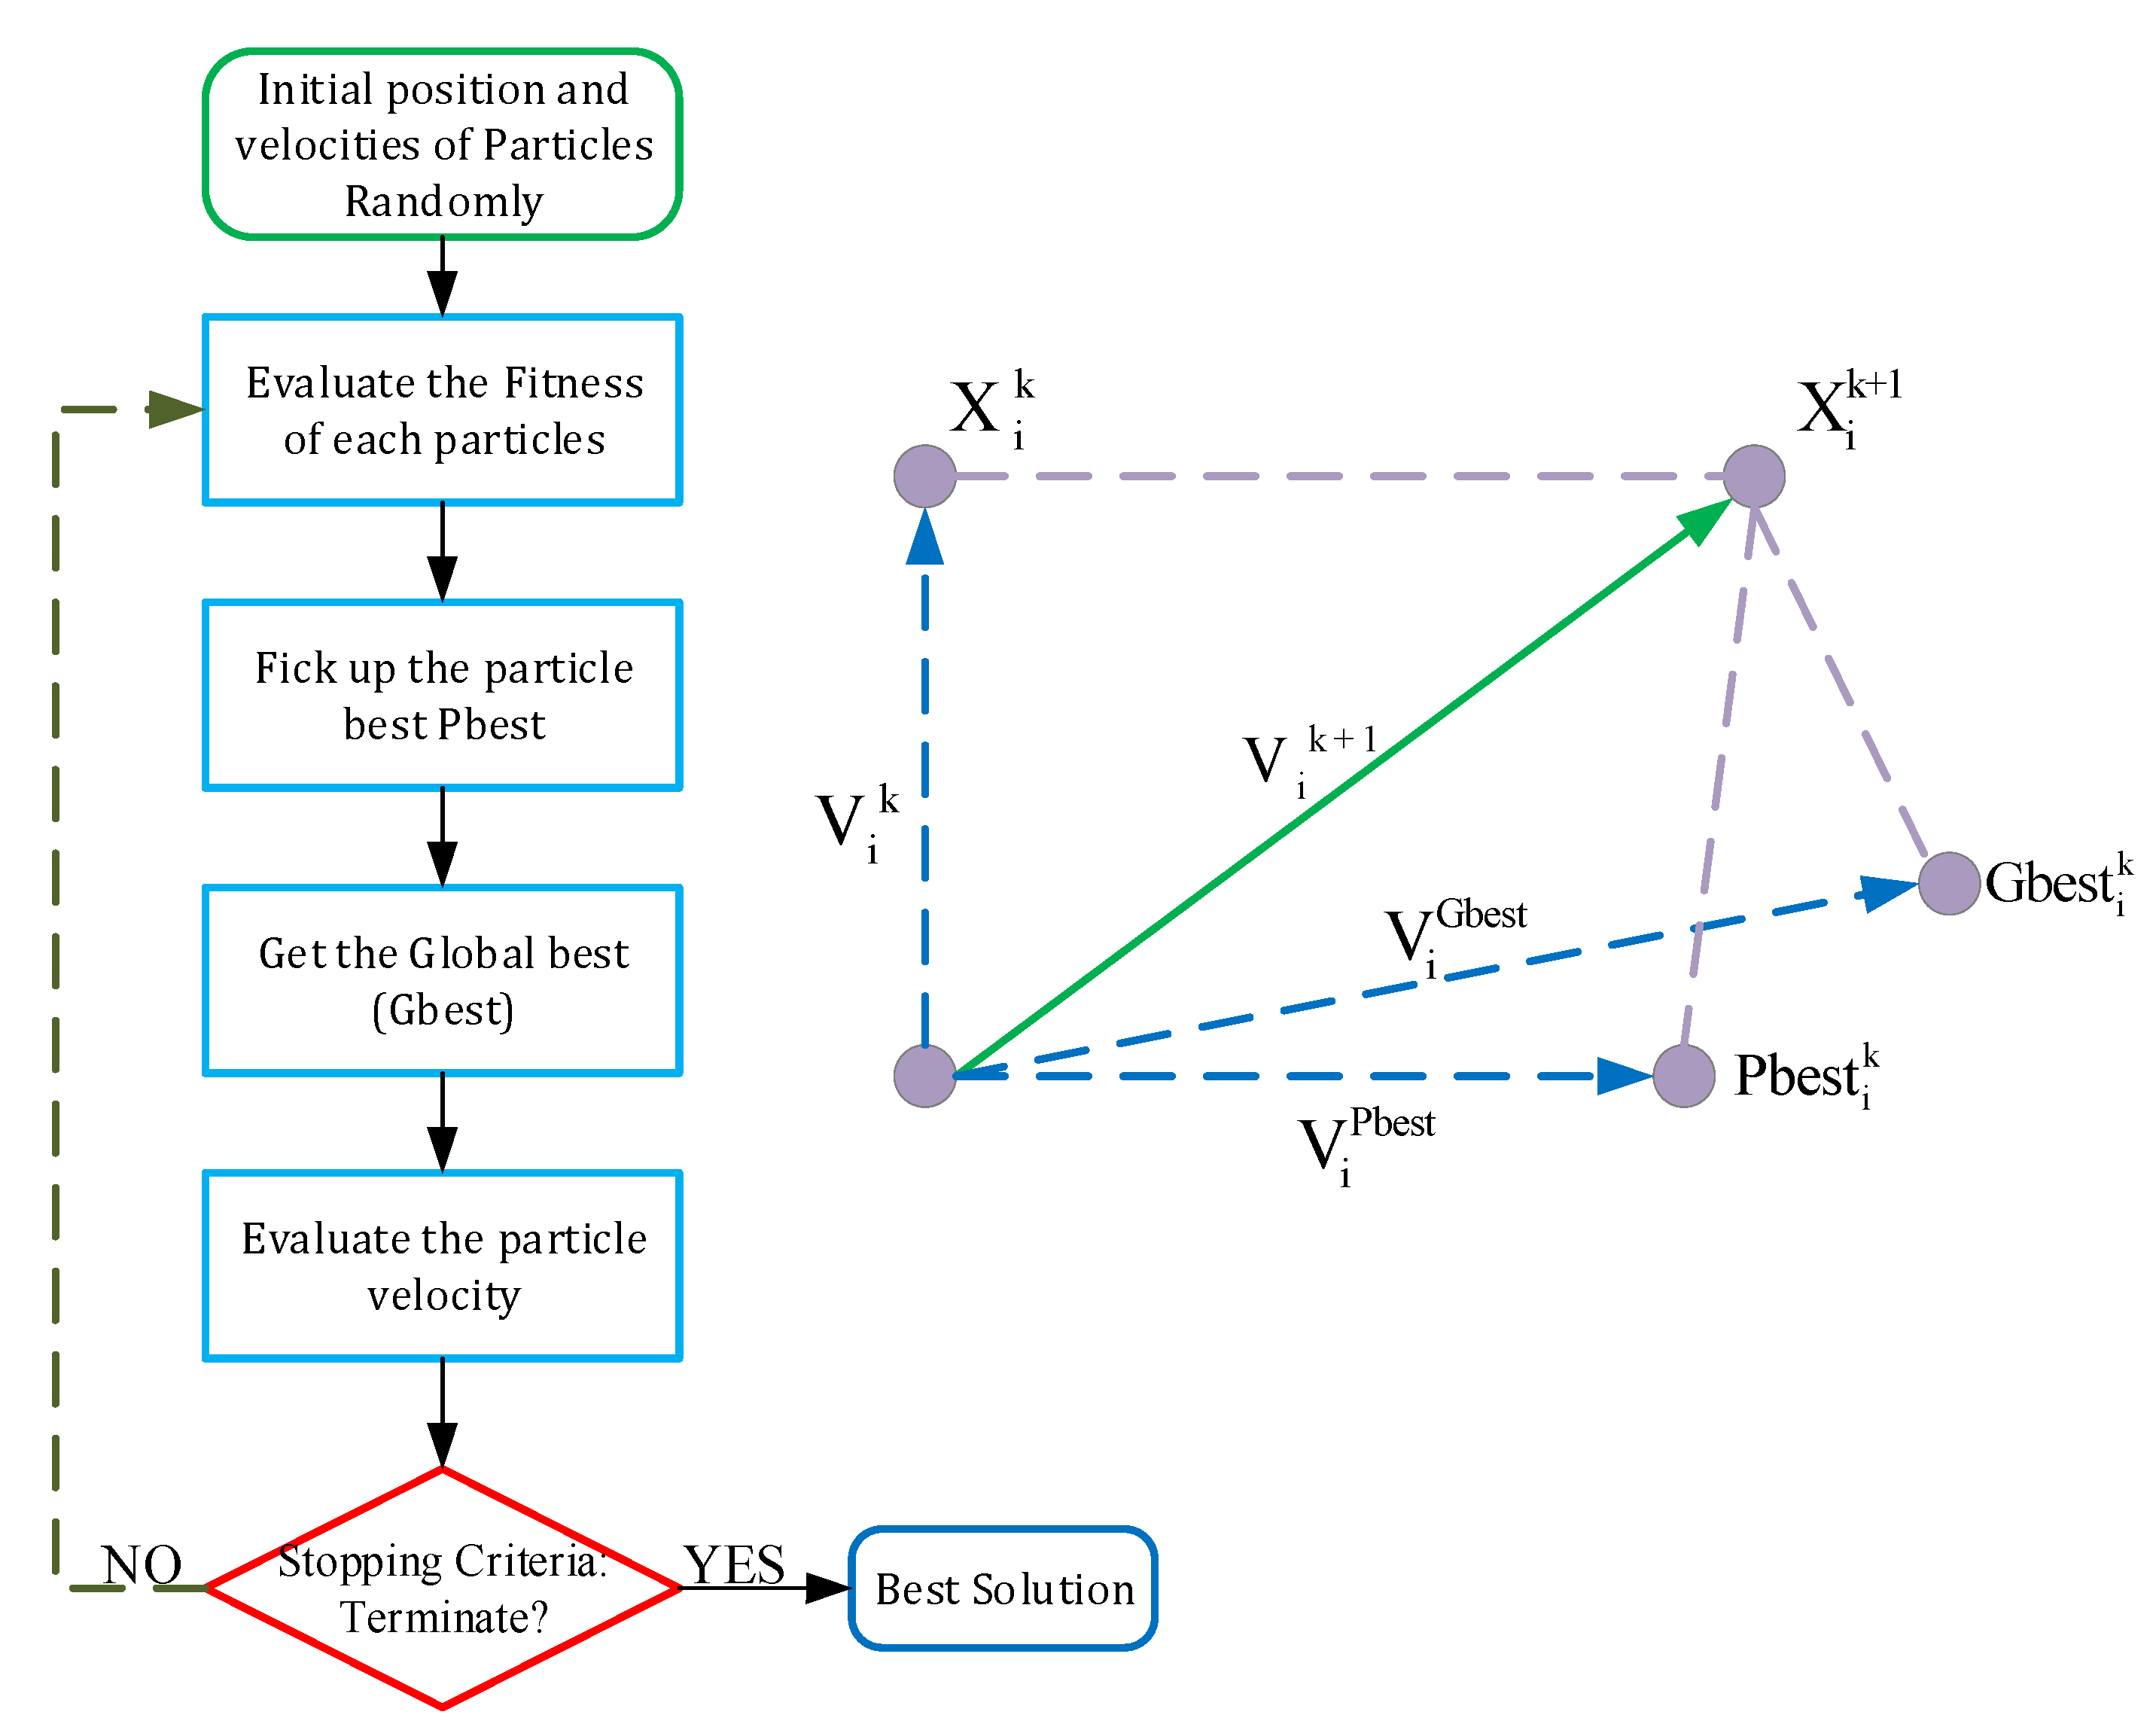
Numerous nature-inspired optimization techniques, such as genetic algorithms (GA) [12], ant colony optimization (ACO) [18], bacterial foraging optimization (BFO) [19], artificial bee colony (ABC) [20], and particle swarm optimization (PSO) [13] have emerged in recent years. For resolving non-linear and non-convex optimization issues with tight constraints, particle swarm optimization (PSO) is a particularly promising and successful optimization technique [13]. PSO is a metaheuristic algorithm introduced by Kennedy and Eberhart [21]. It is based on the cooperative behavior exhibited by various animals, including fish schools and bird flocks. Potential solutions to an optimization problem are represented by the design space’s placements of points (or particles). At the end of each generation, each particle updates its location based on both its own best position and the best position of the entire swarm. PSO offers numerous advantages over other optimization approaches, including possessing fewer parameters to alter several other computing approaches, and the ability to integrate it with other methods to create hybrid tools. Another advantage of the PSO method is its capacity to initiate iterations without relying on the original solution [22]. The PSO algorithm has been widely used in a wide range of technological applications due to its ease of use and high searching speed [22,23]. The particle is represented by the bird, and its flock is a potential result in the search space. Figure 5 shows that each particle is generated at random and moves through space at a constant speed. The personal best (Pbest) and global best (Gbest) particles are saved and compared after each repeat. To generate the latest generation, Equations (1) and (2) are used to modify the velocity and position of each particle.
V i , j k + 1 = w V i , j k + c 1 r 1 P best   i , j k X i , j k + c 2 r 2 G best   i , j k X i , j k V min V i , j k V max
X i , j k + 1 = X i , j k + V i , j k + 1
P best   i , j k represents the ith individual’s personal best jth component, G best   i , j k represents the iteration k’s global best position, and k; Vki,j represents the particle (i,j) velocity at the kth iteration. c1 and c2 are predetermined coefficients; r1 and r2 are pseudo-random numbers (r1, r2 [0, 1]) that are set to keep a particle class.
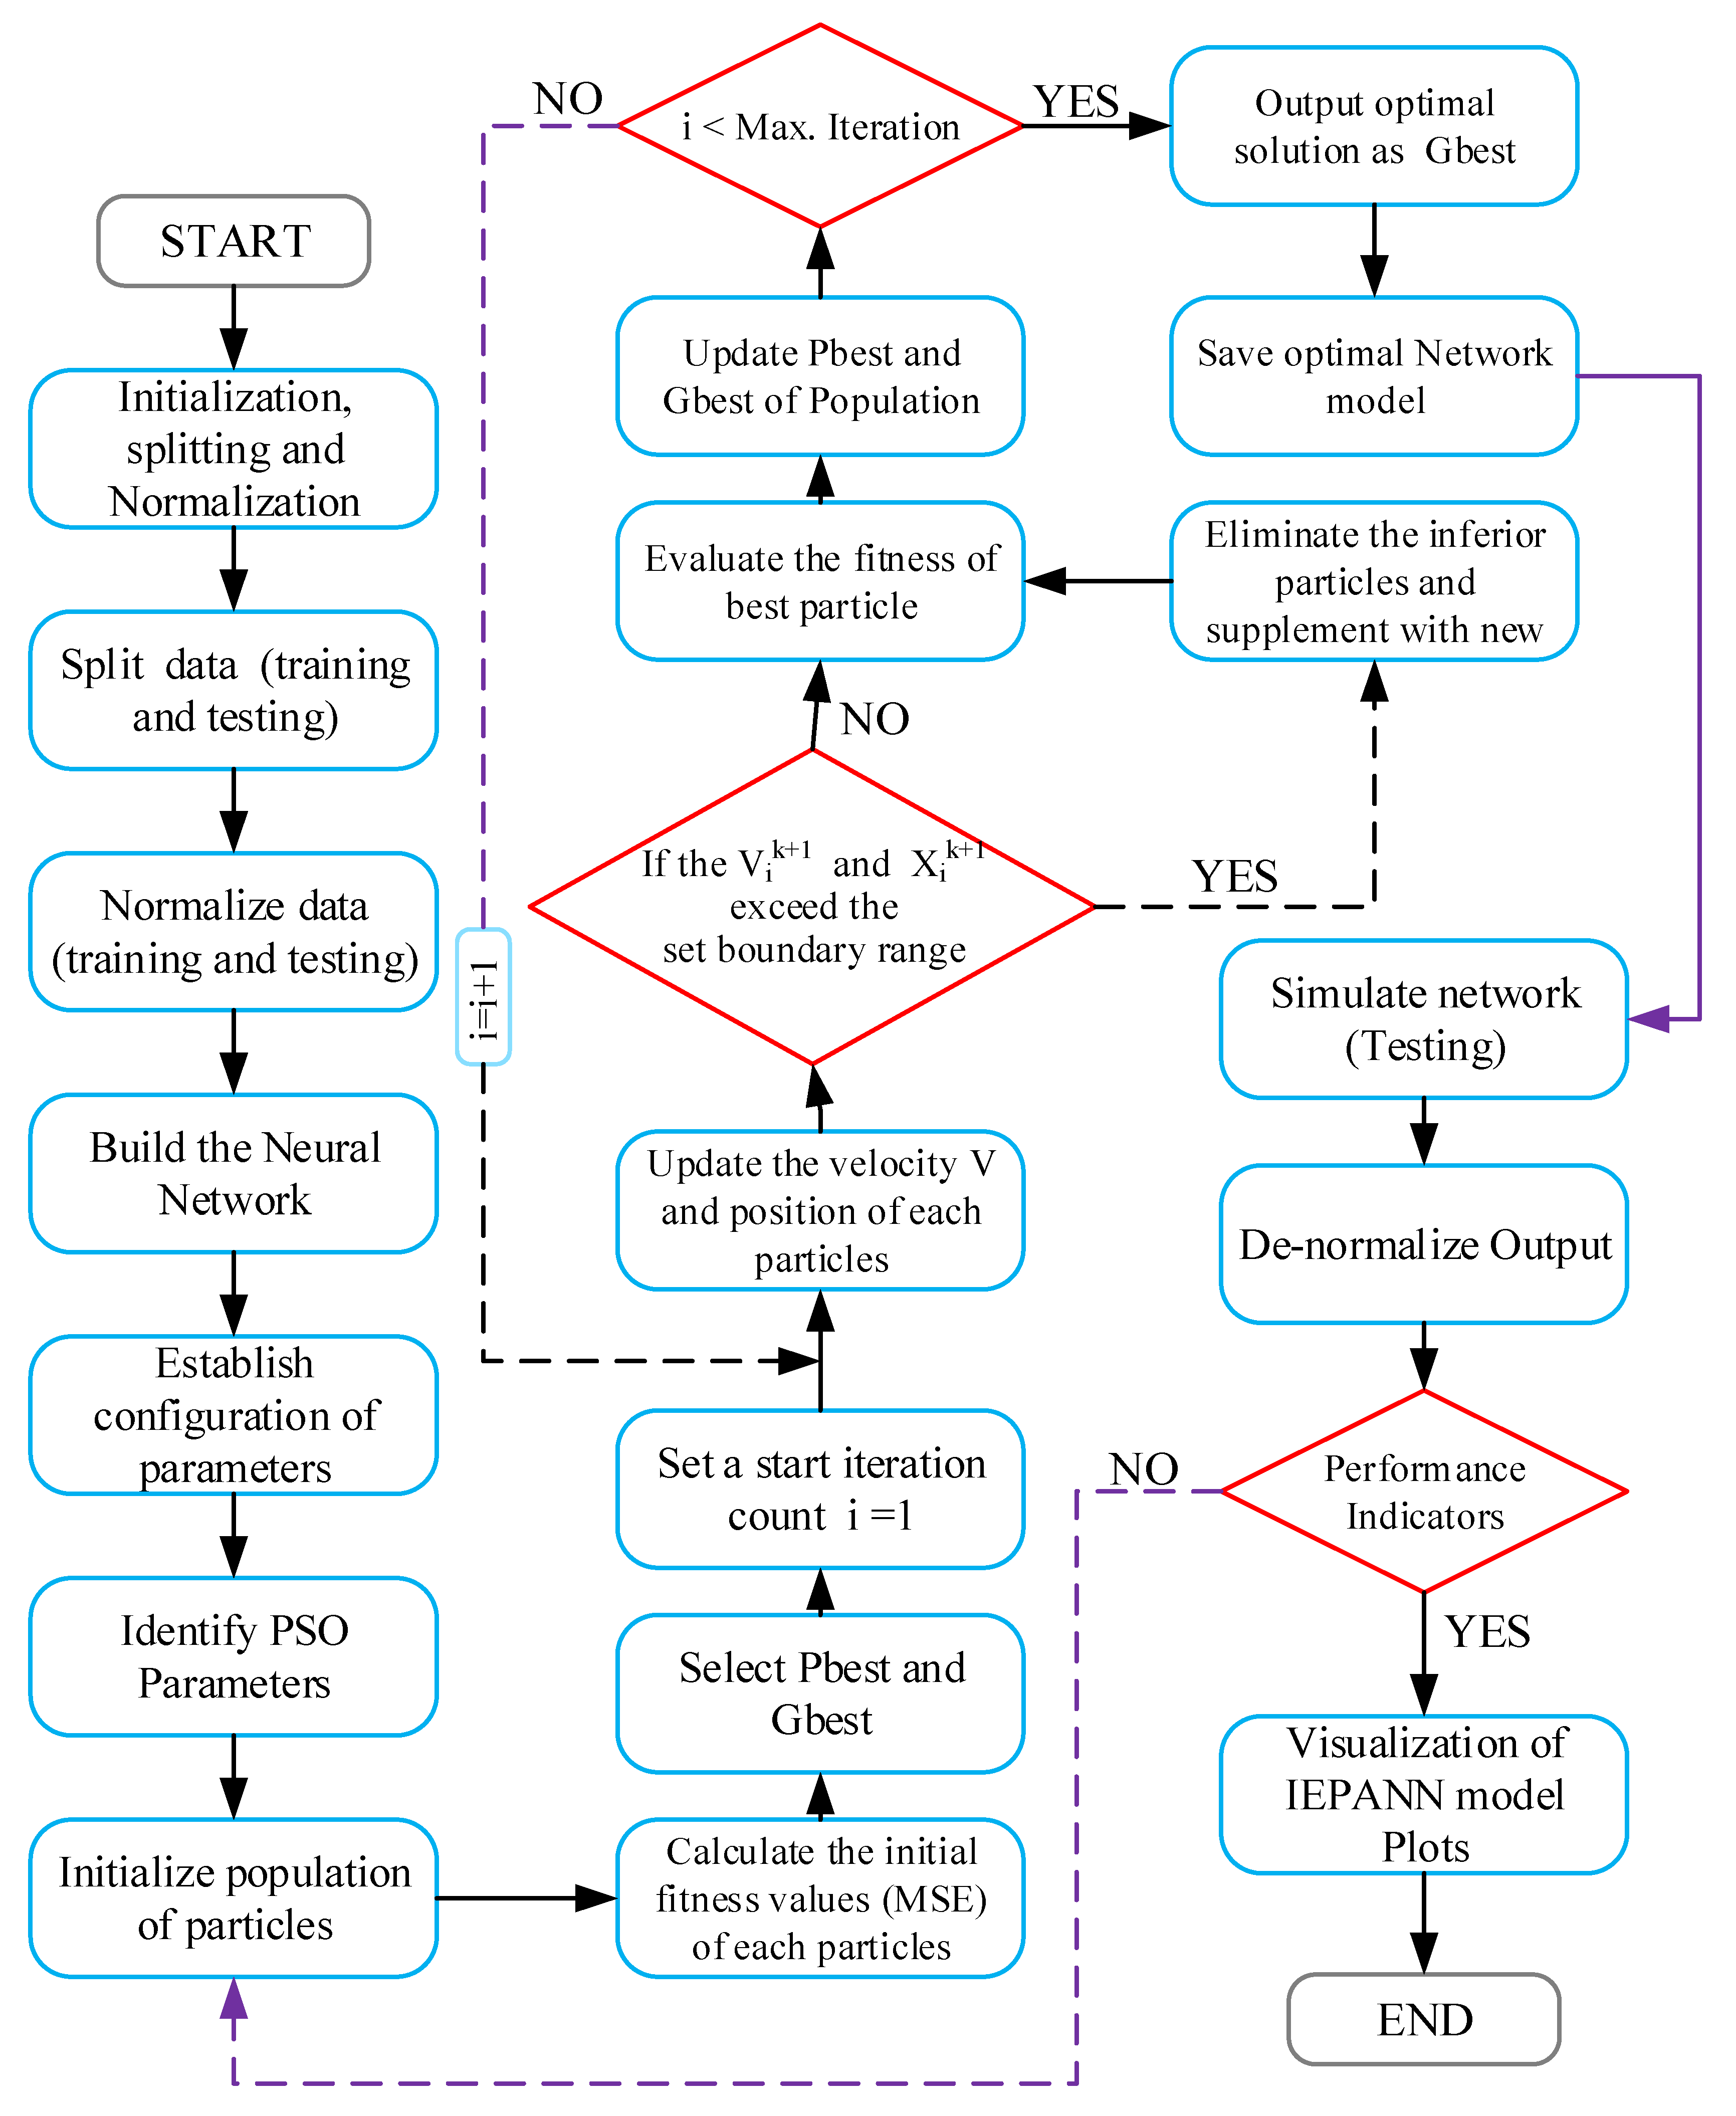
The structure of the PSO-ANN algorithms used in the study is described in Figure 6. The Swarm size, velocity coefficients, inertia weight, and termination criteria are among the PSO parameters that have been optimized. The damping ratio for the inertia weight is 1, and its weight is = 0.729. Equation (10) was used to determine the lower and upper bound velocities, which are −5 and 5, respectively. As there is not a clear method for figuring out the swarm size in the literature, a trial-and-error approach was used with a size range of 50–200 and a 25-point increment. The maximum iteration of 300 epochs was also used in the study. The optimum result was obtained using a swarm size of 200 at 300 epochs.

2.5. Minimum Redundancy Maximum Relevance (mrMR)

In order to fully utilize the advantages of a rich feature store while overcoming the associated problems and expenses, feature selection is a crucial stage in such large-scale machine learning systems. One of the top filtering algorithms is the mRMR, developed by [24]. The mRMR, which penalizes input variable duplication, was used to rate the significance of the input variable sets. mRMR differs from have emerged in recent years [12] previous relevant approaches due to its ability to choose just one relevant feature when two or more relevant features contain the same information. This leads to faster computation and a more accurate prediction. Finding the greatest mutual information-based dependence between the input variables Z and the intended outputs y was the main goal of mRMR. The pursuit of traits that satisfied maximum significance involved:
max D ( Z , y ) ; D = 1 z z i Z I ( Z i ; y )
A minimum redundancy requirement must be introduced as the maximum relevance condition can result in significant redundancy when selecting input variables [25].
min R ( Z , y ) ; R = 1 z z i , z j Z I ( Z i ; Z j )
The mRMR criterion is obtained by combining the criteria D and R in Equations (4) and (5) and then optimizing them. Furthermore, a greedy method can be used in practice, where S is the set of input variables chosen.
max z i s I ( Z i ; y ) 1 S z j s I ( Z i ; Z j )

2.6. Evaluation Criteria

Before modeling, the potential input and target variables were normalized between 0 and unity for increased model accuracy. Normalization reduces the complexity of the model, data redundancy, and computational requirements, such as time and machine specifications, to attain global minima [26]. It also converts the input and output variables to dimensionless units. It also ensures that the input parameters contribute equally, avoiding inputs with greater numeric values from overshadowing those with lower values. The normalization was performed using Equation (6).
X norm = X X m i n X m a x X m i n
Nnorm is the normalized value, and N, Nmax, and Nmin are the observed, maximum, and minimum values, respectively.
Utilizing the determination coefficient (DC), root mean square error (RMSE), and mean absolute error (MAE), the models’ effectiveness was evaluated. The DC values range between—and 1, showing how well the model fits the values that were observed. The effectiveness of a model reduces when the NSE value varies from one, and vice versa, as a perfect model has an NSE value of one [26]. According to the NSE values, the accuracy of the model may be rated as excellent (0.75 NSE 1), good (0.65 NSE 0.75), satisfactory (0.50 NSE 0.65), and bad (NSE 0.50) [27]. Using RMSE, one of the best techniques for measuring the model performance, the average error brought on by the models is calculated. The RMSE ranged between 0 and +, and is zero in the best model [28]. MAE is also taken into account in the study as it is less sensitive to extreme values in the forecast data than RMSE. Equations (7)–(9) can be used to compute the aforementioned performance evaluations.
D C = 1 i = 1 n X o b s i X p r e i 2 i = 1 n X o b s i X o b s i ¯ 2
RMSE = i = 1 n X o b s i X p r e i 2 n
MAE = i = 1 n X o b s i X p r e i n

3. Results and Discussion

Dominant Input Selection

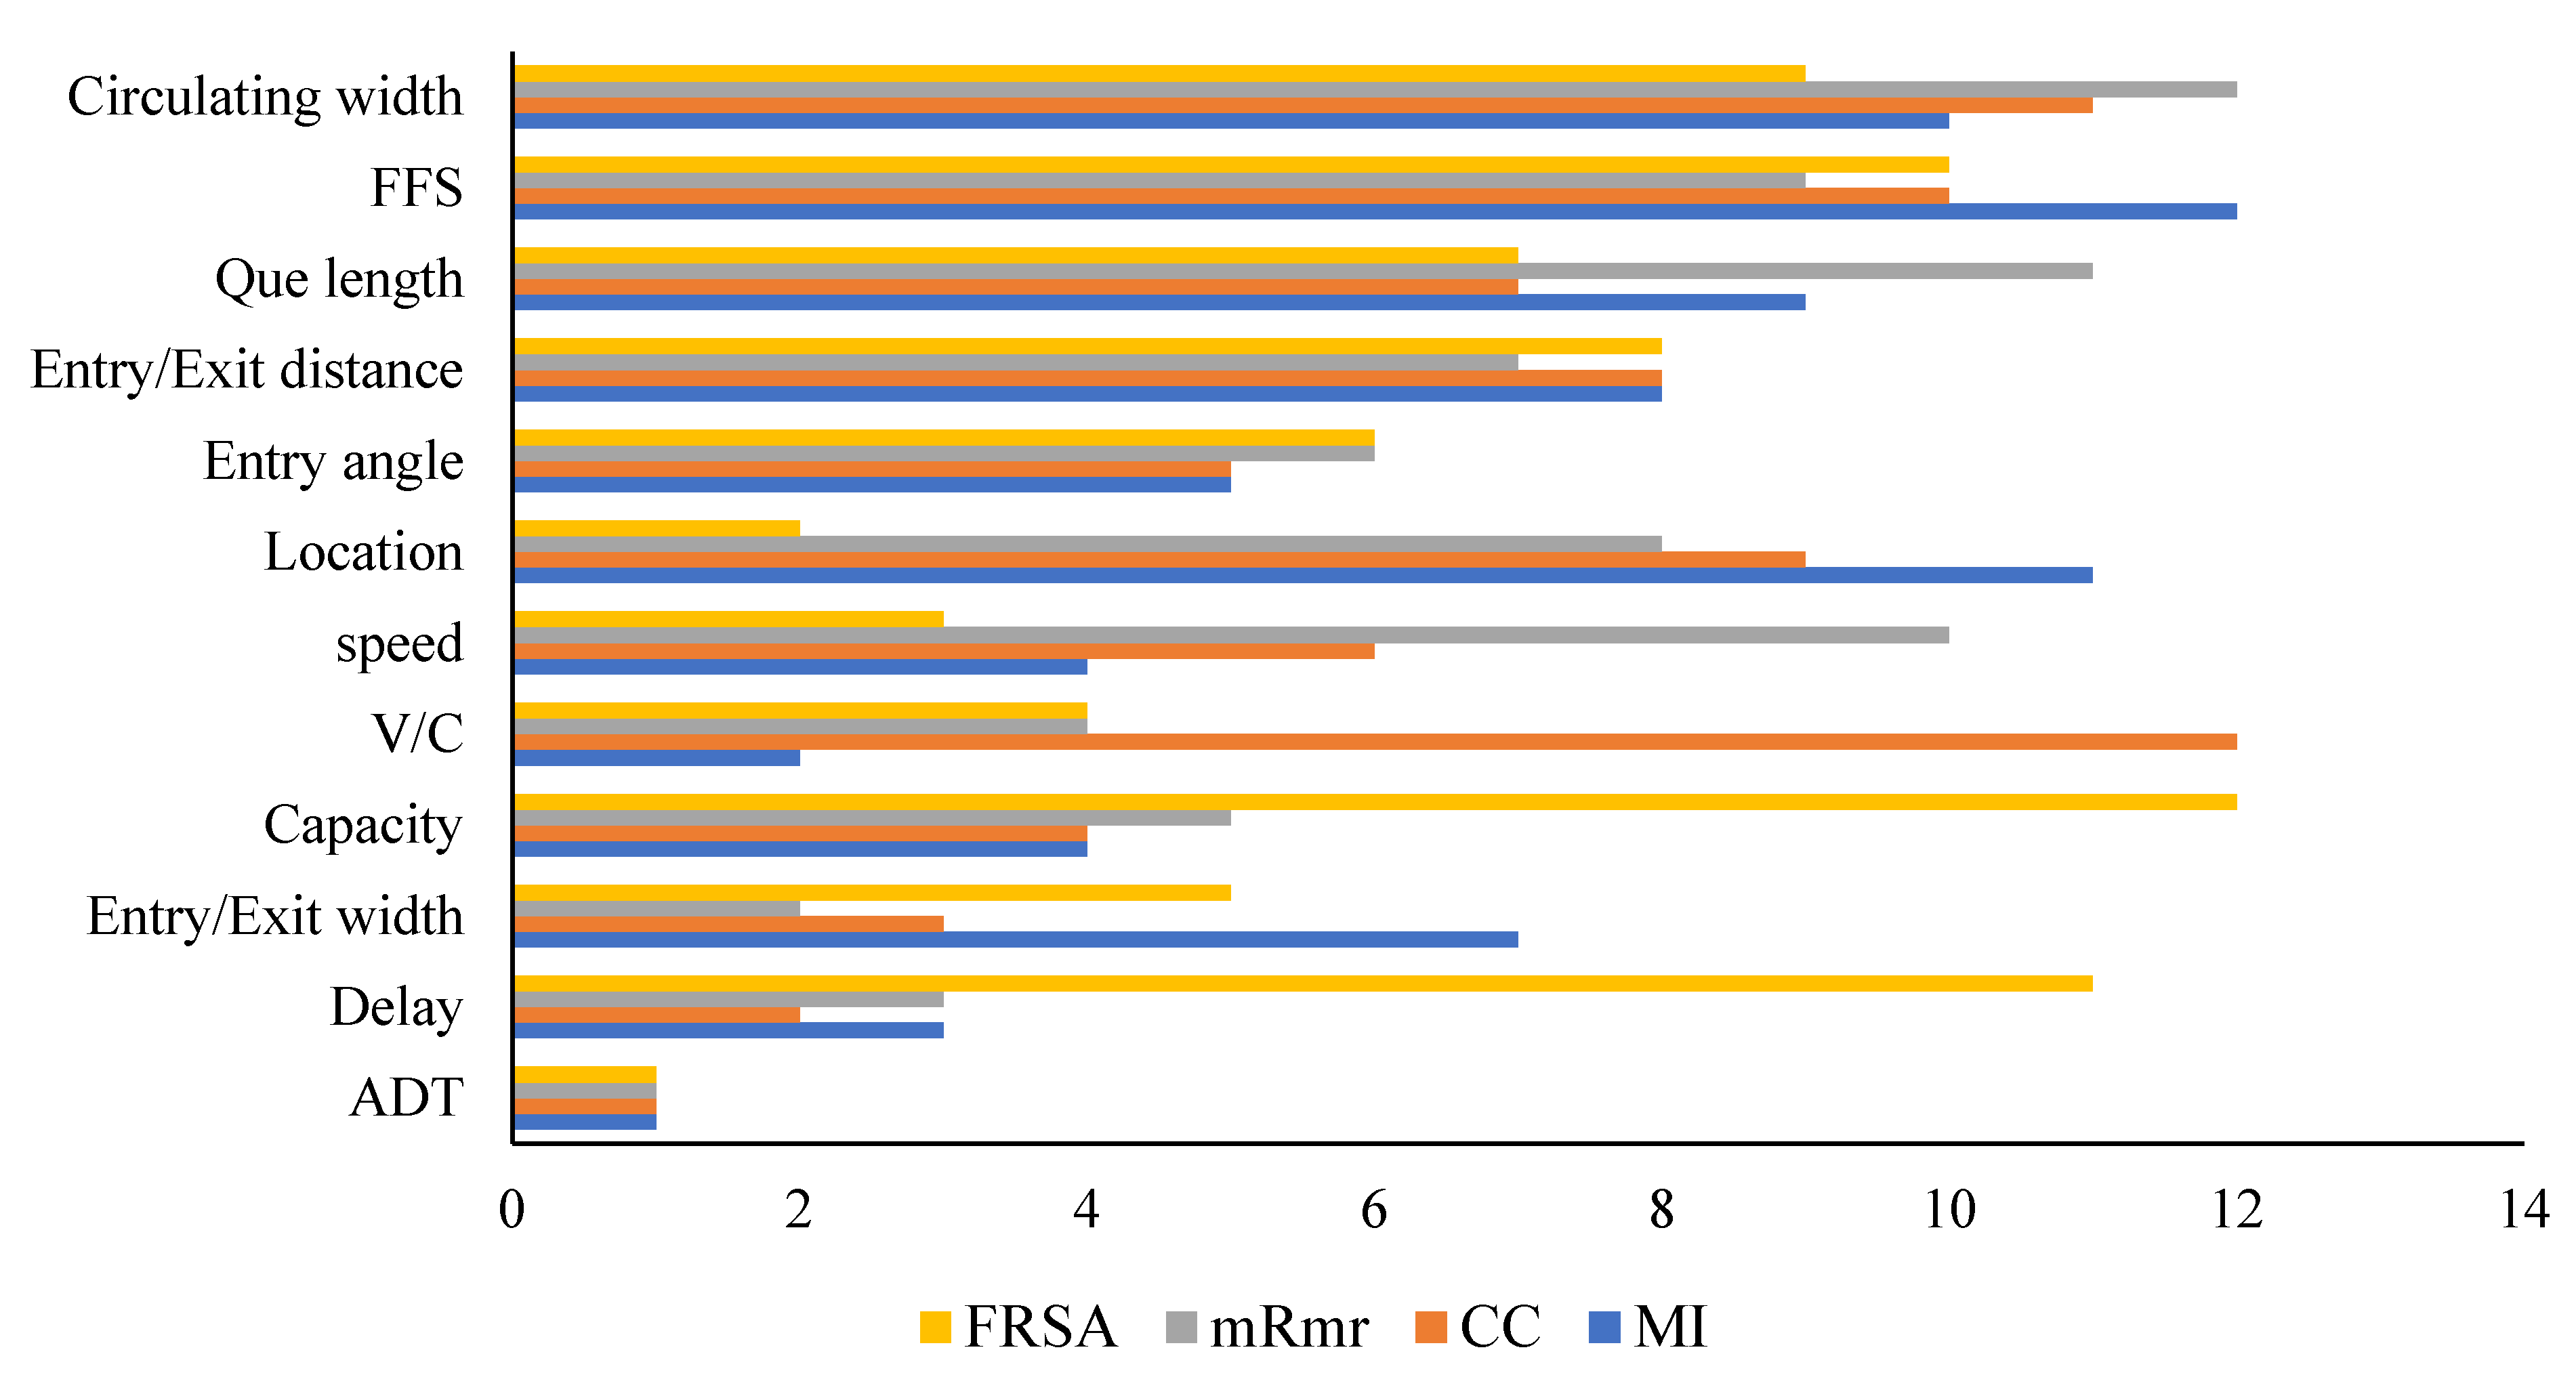
Relevant input selection is essential in obtaining reliable and accurate results in artificial intelligence-based models. For capturing both the linear and non-linear relevance of the potential parameters, four input section techniques—namely feature removal sensitivity analysis (FRSA), mutual information (MI), correlation coefficient (CC), and minimum redundancy maximum relevance—were used in the study. The result obtained in each of the techniques was used to rank the importance of each of the 11 potential parameters. The sensitivity analysis result is presented in Table 3, while the ranking result is presented in Figure 7. On the other hand, the MI technique measures the dependence between two random variables [29]. When the two random variables are independent, MI can measure the non-linear statistical dependency between them, and it is zero otherwise [30]. FRSA is a non-linear sensitivity analysis technique used to determine the relevance and importance of potential input parameters. FRSA proved to be important in finding the non-linear relationship between the input parameters and target parameters [31]. The correlation coefficient is a measure of how linearly related two occurrences are; the value varies between −1 and 1. If two instances are uncorrelated, it is close to zero. X and Y are connected when it is positive. The greater the association, the higher the value. If the value of rx,y is negative, it means that X and Y are inversely correlated. In FRSA, 11 of the potential parameters leaving one parameter were used to model the crash frequency at the roundabout. In each model, the RMSE was computed. The procedure was repeated 12 times until each parameter was removed and used in the modelling. The most relevant parameter gives the highest RMSE once it is excluded in the modelling. A parameter with a rank less than or equal to 5 in any of the techniques was considered relevant and was hence included in the models. Based on the set criteria, eight parameters (ADT, delay, entry/exit width, capacity, v/c ratio, speed, location and entry angle) were found to be relevant and were therefore used to model the crash frequency at roundabouts, while the remaining four (entry/exit distance, que length, FFS and circulating width) were considered irrelevant and hence not included in the model. ADT was the most relevant parameter in all four of the selection criteria, followed by delay, which was the second most relevant parameter, with a strong linear relationship with the crash frequency ranked second by CC and third by MI and MrMR. This is logical as it influences the behavior of drivers. Delays make drivers more aggressive, which makes their driving decision irrational.

4. Modelling Result

MATLAB 2019 was used to develop three different data-driven models, namely ANN, MLR, and a hybrid PSO-ANN model for traffic noise prediction using the dominant input parameters (Delay, Entry/Exit width, Capacity, V/C, Speed, Location, and Entry angle). The data were divided into two 70/30 for the calibration and testing of the models, respectively. As the only definite way of determining the optimal structure for ANN models is through the trial-and-error method, several ANN models were trained using different training algorithms, activation functions (tansig, purelin, logistics), and hidden neurons (5–20), and the optimal structure was selected. The optimal architecture was found to be 7-9-1 (s-input parameters, respectively), 8- hidden neurons and 1 output parameter) trained with the Levenberg Marquardt algorithms using the tansig and purelin function in the input and output layers.
When training an ANN, the number of hidden layer neurons is crucial. Because the large number of neurons leads to overfitting the performance, the optimization technique is used to determine the most useful values for the variables. The PSO is used to modify the ANN model weight and bias to reduce overfitting. At the start of training the PSO-ANN hybrid model, random particles are initialized, and their positions are then randomly assigned to the ANN model’s weights and biases. The MSE between the observed and estimated crash frequency was determined after training the model with the initialization weights and biases. With each iteration, the accuracy of the models improves (MSE value decreases) by modifying the position of the particles. In each cycle, the Pbest and Gbest are utilized to compute and update the velocity. The MSE of the PSO-ANN model was lowered by altering the particle solutions to the best solutions. This method was used to optimize until the stop condition was satisfied. The maximum number of iterations was used as the study’s stop criteria, and the epoch with the lowest MSE was identified as the optimum epoch. The optimum architecture (7-9-1) obtained for the ANN model was applied for the PSO-ANN model.
The PSO algorithms adjusted the weight and bias of the ANN models during the last step of training the PSO-ANN model, eliminating overfitting problems by remembering the parameters that govern how the model adapts to the new dataset. Figure 5 depicts the PSO-ANN algorithm’s learning procedure. Swarm size, velocity coefficients, inertia weight, and termination criteria are among the PSO parameters that have been optimized. The damping ratio for the inertia weight is 1, and its weight is =0.729. Equation (1) was used to determine the lower and upper bound velocities, which are −5 and 5, respectively. As there is not a clear method for figuring out the swarm size in the literature, a trial-and-error approach was used with a size range of 50–200 and a 25-point increment. The maximum iteration of 300 epochs was also used in the study. The optimum result was obtained using a swarm size of 200 at 300 epochs. The modeling results were evaluated using four statistical measures and are presented in Table 4.
The PSO-ANN model performed well in both the training and testing stages, with a DC value greater than 0.75 for estimating the crash frequency at roundabouts. The hybrid model has demonstrated a higher performance over the ANN model in both the training and testing stages in terms of the model’s goodness of fit (DC) and error metric (RMSE and MAE). However, the ANN model has also demonstrated good and satisfactory results in the training and testing stages, with a DC value of 0.7227 and 0.6244, respectively. The hybrid PSO-ANN model improved the performance of the classical model by 22.3% and 16.9%, respectively, in the training and testing stages. This indicates the reliability and accuracy of the proposed hybrid method. The hybrid PSO-ANN achieves its improved accuracy by systematically optimizing the ANN parameters (bias and weights) using the particle swarm optimization algorithm and through altering the particles position. The successful application and improved performance of PSO-ANN over the classical ANN model can be found in several studies, such as [32]. Other studies affirming the efficiency of machine learning approaches in the prediction of complex parameters include the studies by [33,34].
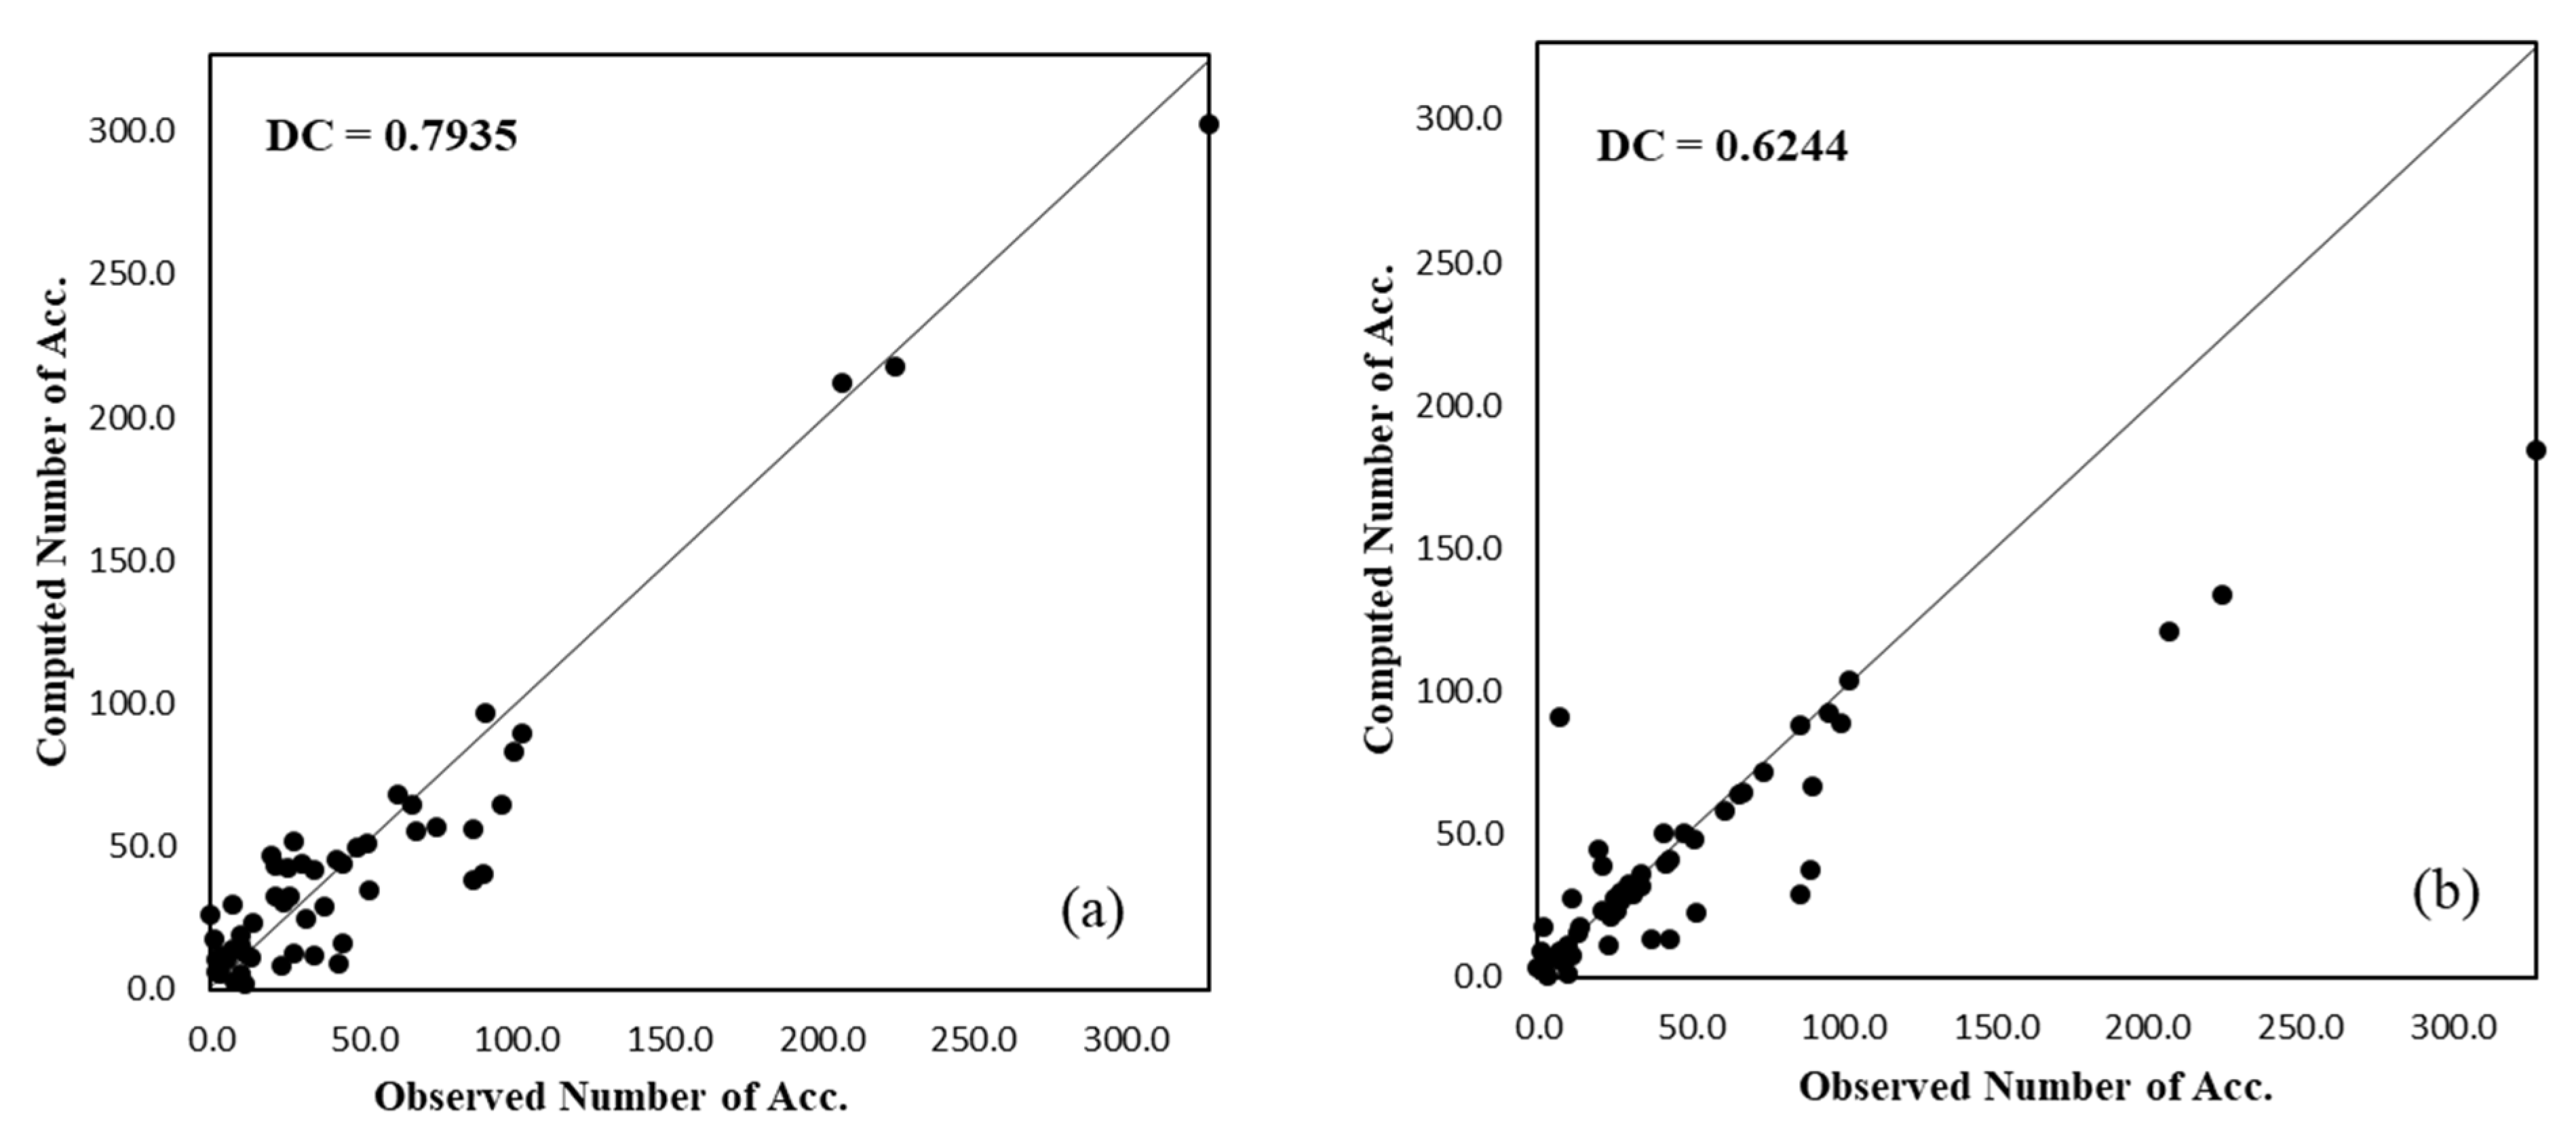
The findings of the investigation were further examined utilizing three graphical charts (scatter plots and violin plots). The scatter plots demonstrate how the observed and anticipated data were compressed along the chart’s diagonal bisector. The denser the data along the diagonal bisector, the more accurate the model, and vice versa. Figure 8 shows that the data in Figure 8a (PSO-ANN) are more along the bisector than in Figure 8b (ANN).
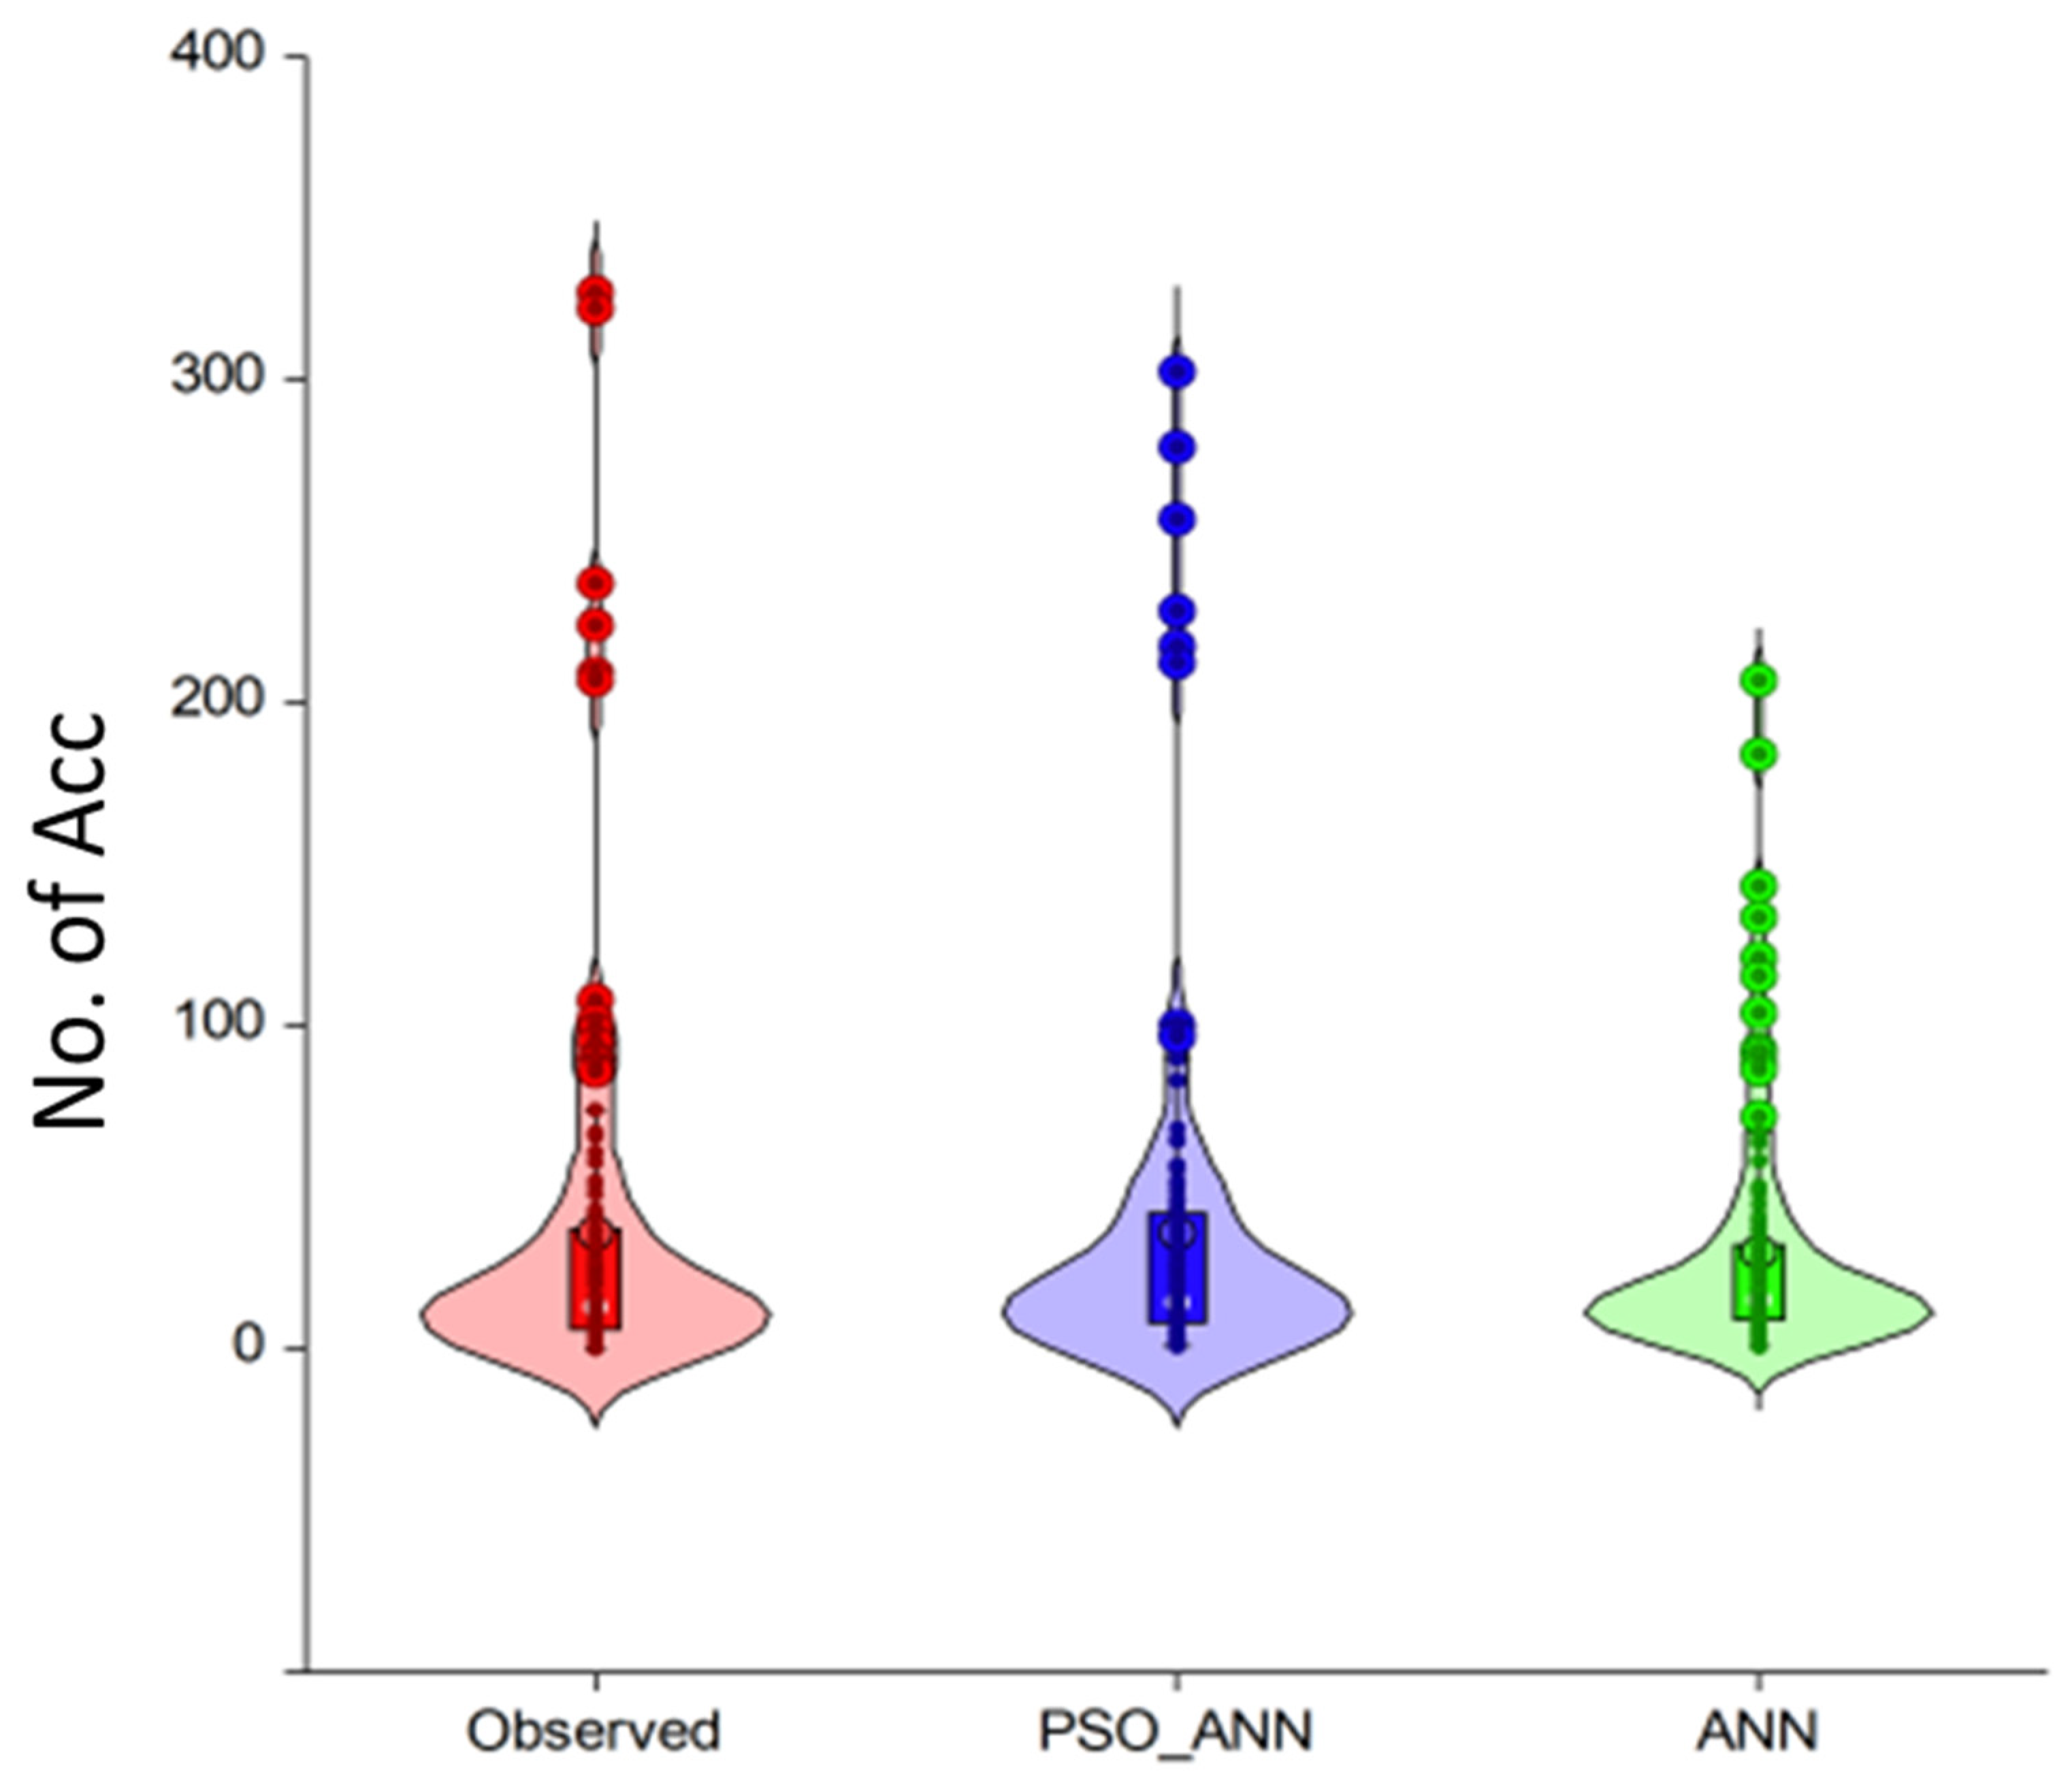
Finally, violin plots (Figure 9) were used to compare the models’ performances further. Violin plots are used because of their advantage in combining distribution and box plots, in addition to the interquartile ranges, median, and spread of the observed data. The figure shows that the violin form and box plot within the violin of the PSO-ANN model more closely resemble the actual data than the other models. PSO-ANN can efficiently simulate the data distribution, interquartile ranges, median, and data range, according to the results. When the ANN parameters are adjusted using the PSO method, the overall assessment of the models using statistical (DC, RMSE, MAE) and graphical measures (scatter plots, violin plots) demonstrated higher prediction accuracy and error reduction in predicting traffic noise.

5. Conclusions

In this study, the crash frequency at urban roundabouts was predicted using an ANN model optimized with PSO. Prior to the development of the models, four different dominant input selection techniques (FRSA, mrMR, MI and CC) were employed for reducing the number of input parameters in the models. In order of importance, the ADT, delay, entry/exit width, capacity, v/c ratio, speed, location, and entry angle were found to be most relevant parameters responsible for accidents prediction at roundabouts. The optimized hybrid model, PSO-ANN, predicted the crash frequency with higher accuracy (DC = 0.7935) and less error (MAE = 0.0322, RMSE = 0.0403) compared with the classical ANN model. The statistical and graphical analysis used in the study proved the suitability of the PSO-ANN model for the prediction of crash frequency with high accuracy. One of the drawbacks of the proposed PSO-ANN approach is that it gives no clue on the most influential variable. Further studies could determine the degree to which each of the dominant parameters contributes to the safety of urban roundabouts.

Author Contributions

Conceptualization, F.A. and S.I.H.; methodology, I.K.U.; software, I.K.U.; validation, A.A.; investigation, F.A.; data curation, I.K.U.; writing—original draft preparation, F.A.; writing—review and editing, A.A. and M.E.-K.; visualization, A.A.; supervision, F.A.; project administration, F.A.; funding acquisition, F.A. All authors have read and agreed to the published version of the manuscript.

Funding

This work was funded by the Deanship of Scientific Research at Jouf University under grant No (DSR2022-NF-08).

Institutional Review Board Statement

Not applicable.

Informed Consent Statement

Not applicable.

Data Availability Statement

Not applicable.

Conflicts of Interest

The authors declare no conflict of interest.

References

  1. Al-Omari, B.; Ghuzlan, K.; Hasan, H. Traffic accidents trends and characteristics in Jordan. Int. J. Civ. Environ. Eng. IJCEE-IJENS 2013, 13, 9–16. [Google Scholar]
  2. Badgley, J.M.; Condon, J.; Rainville, L.; Li, D. FHWA Research and Technology Evaluation: Roundabout Research Final Report (No. FHWA-HRT-17-040). 2018. Available online: http://www.ntis.gov (accessed on 15 March 2023).
  3. Alshannaq, M.; Imam, R. Evaluating the safety performance of roundabouts. Transp. Probl. 2020, 15, 141–152. [Google Scholar] [CrossRef]
  4. Anjana, S.; Anjaneyulu, M.V.L.R. Development of Safety Performance Measures for Urban Roundabouts in India. J. Transp. Eng. 2014, 141, 04014066. [Google Scholar] [CrossRef]
  5. Dabbour, E.; Al Awadhi, M.; Aljarah, M.; Mansoura, M.; Haider, M. Evaluating safety effectiveness of roundabouts in Abu Dhabi. IATSS Res. 2018, 42, 274–283. [Google Scholar] [CrossRef]
  6. Zubaidi, H.A.; Anderson, J.C.; Hernandez, S. Understanding roundabout safety through the application of advanced econometric techniques. Int. J. Transp. Sci. Technol. 2020, 9, 309–321. [Google Scholar] [CrossRef]
  7. Sameen, M.I.; Pradhan, B. Severity prediction of traffic accidents with recurrent neural networks. Appl. Sci. 2017, 7, 476. [Google Scholar] [CrossRef] [Green Version]
  8. García de Soto, B.; Bumbacher, A.; Deublein, M.; Adey, B.T. Predicting road traffic accidents using artificial neural network models. Infrastruct. Asset Manag. 2018, 5, 132–144. [Google Scholar] [CrossRef] [Green Version]
  9. Jadaan, K.S.; Al-Fayyad, M.; Gammoh, H.F. Prediction of Road Traffic Accidents in Jordan using Artificial Neural Network (ANN). J. Traffic Logist. Eng. 2014, 2, 92–94. [Google Scholar] [CrossRef] [Green Version]
  10. Alqatawna, A.; Rivas Alvarez, A.M.; Garcia-Moreno, S.S.C. Comparison of Multivariate Regression models and artificial neural networks for prediction highway traffic accidents in spain: A case study. Transp. Res. Procedia 2021, 58, 277–284. [Google Scholar] [CrossRef]
  11. Umar, I.K.; Gokcekus, H. Modeling severity of road traffic accident in Nigeria using artificial neural network. J. Kejuruter. 2019, 32, 221–227. [Google Scholar] [CrossRef]
  12. Rahmani, S.; Mousavi, S.M.; Kamali, M.J. Modeling of road-traffic noise with the use of genetic algorithm. Appl. Soft Comput. 2011, 11, 1008–1013. [Google Scholar] [CrossRef]
  13. Ibrahim Bibi Farouk, A.; Zhu, J.; Ding, J.; Haruna, S.I. Prediction and uncertainty quantification of ultimate bond strength between UHPC and reinforcing steel bar using a hybrid machine learning approach. Constr. Build. Mater. 2022, 345, 128360. [Google Scholar] [CrossRef]
  14. Sacchi, E.; Bassani, M.; Persaud, B. Comparison of safety performance models for Urban roundabouts in Italy and other countries. Transp. Res. Rec. 2011, 2265, 253–259. [Google Scholar] [CrossRef]
  15. Kumar, P.; Nigam, S.P.; Kumar, N. Vehicular traffic noise modeling using artificial neural network approach. Transp. Res. Part C Emerg. Technol. 2014, 40, 111–122. [Google Scholar] [CrossRef]
  16. Rumelhart, D.E.; Hinton, G.E.; Williams, R.J. Learning representations by back-propagating errors. Nature 1986, 323, 533–536. [Google Scholar] [CrossRef]
  17. Genaro, N.; Torija, A.J.; Requena, I.; Ruiz, D.P. A neural network based model for urban noise prediction. J. Acoust. Soc. Am. 2010, 128, 1738–1746. [Google Scholar] [CrossRef]
  18. Liao, T.; Stützle, T.; Montes De Oca, M.A.; Dorigo, M. A unified ant colony optimization algorithm for continuous optimization. Eur. J. Oper. Res. 2014, 234, 597–609. [Google Scholar] [CrossRef]
  19. Ji, J.; Weng, Y.; Yang, C.; Wu, T. A multi-resolution grid-based bacterial foraging optimization algorithm for multi-objective optimization problems. Swarm Evol. Comput. 2022, 72, 101098. [Google Scholar] [CrossRef]
  20. Moghaddas, S.A.; Nekoei, M.; Golafshani, E.M.; Behnood, A.; Arashpour, M. Application of artificial bee colony programming techniques for predicting the compressive strength of recycled aggregate concrete. Appl. Soft Comput. 2022, 130, 109641. [Google Scholar] [CrossRef]
  21. Kennedy, J.; Eberhart, R. New optimizers using particle swarm theory. In Proceedings of the 6th International Symposium on Micro Machine and Human Science, Nagoya, Japan, 4–6 October 1995; pp. 39–43. [Google Scholar] [CrossRef]
  22. Eberhart, R.; Shi, Y. Particle swarm optimization: Developments, applications and resources. In Proceedings of the 2001 Congress on Evolutionary Computation (IEEE Cat. No.01TH8546), Seoul, Republic of Korea, 27–30 May 2001; Volume 1, pp. 81–86. [Google Scholar] [CrossRef]
  23. Poli, R.; Kennedy, J.; Blackwell, T. Particle swarm optimization. Swarm Intell. 2007, 1, 33–57. [Google Scholar] [CrossRef]
  24. Umar, I.K.; Nourani, V.; Gökçekuş, H.; Abba, S.I. An intelligent hybridized computing technique for the prediction of roadway traffic noise in urban environment. Soft. Comput. 2023, 27, 10807–10825. [Google Scholar] [CrossRef]
  25. Peng, H.; Long, F.; Ding, C. Feature Selection Based on Mutual Information: Criteria of Max-Dependency, Max-Relevance, and Min-Redundancy. IEEE Trans. Pattern Anal. Mach. Intell. 2005, 27, 1226–1238. [Google Scholar] [CrossRef]
  26. Umar, I.K.; Nourani, V.; Gokcekus, H. A novel multi-model data-driven ensemble approach for the prediction of particulate matter concentration. Environ. Sci. Pollut. Res. 2021, 28, 49663–49677. [Google Scholar] [CrossRef] [PubMed]
  27. Moriasi, D.N.; Arnold, J.G.; Liew, M.W.; Van Bingner, R.L.; Harmel, R.D.; Veith, T.L. Model evaluation guidelines for systematic quantification of accuracy in watershed simulations. Trans. ASABE 2007, 50, 885–900. [Google Scholar] [CrossRef]
  28. Umar, I.K.; Gökçekuş, H.; Nourani, V. An intelligent soft computing technique for prediction of vehicular traffic noise. Arab. J. Geosci. 2022, 15, 1571. [Google Scholar] [CrossRef]
  29. Yang, Q.; Koutsopoulos, H.N.; Ben-Akiva, M.E. Simulation laboratory for evaluating dynamic traffic management systems. Transp. Res. Rec. 2000, 1710, 122–130. [Google Scholar] [CrossRef] [Green Version]
  30. Nourani, V.; Khanghah, T.R.; Baghanam, A.H. Application of entropy concept for input selection of wavelet-ANN based rainfall-runoff modeling. J. Environ. Inform. 2015, 26, 52–70. [Google Scholar] [CrossRef] [Green Version]
  31. Nourani, V.; Gökçekuş, H.; Umar, I.K. Artificial intelligence based ensemble model for prediction of vehicular traffic noise. Environ. Res. 2020, 180, 108852. [Google Scholar] [CrossRef]
  32. Nguyen, M.S.T.; Kim, S.E. A hybrid machine learning approach in prediction and uncertainty quantification of ultimate compressive strength of RCFST columns. Constr. Build. Mater. 2021, 302, 124208. [Google Scholar] [CrossRef]
  33. Osman, A.I.A.; Ahmed, A.N.; Huang, Y.F.; Kumar, P.; Birima, A.H.; Sherif, M.; Sefelnasr, A.; Ebraheemand, A.A.; El-Shafie, A. Past, Present and Perspective Methodology for Groundwater Modeling-Based Machine Learning Approaches. Arch. Comput. Methods Eng. 2022, 29, 3843–3859. [Google Scholar] [CrossRef]
  34. Ibrahim, K.S.M.H.; Huang, Y.F.; Ahmed, A.N.; Koo, C.H.; El-Shafie, A. A review of the hybrid artificial intelligence and optimization modelling of hydrological streamflow forecasting. Alex. Eng. J. 2022, 61, 279–303. [Google Scholar] [CrossRef]
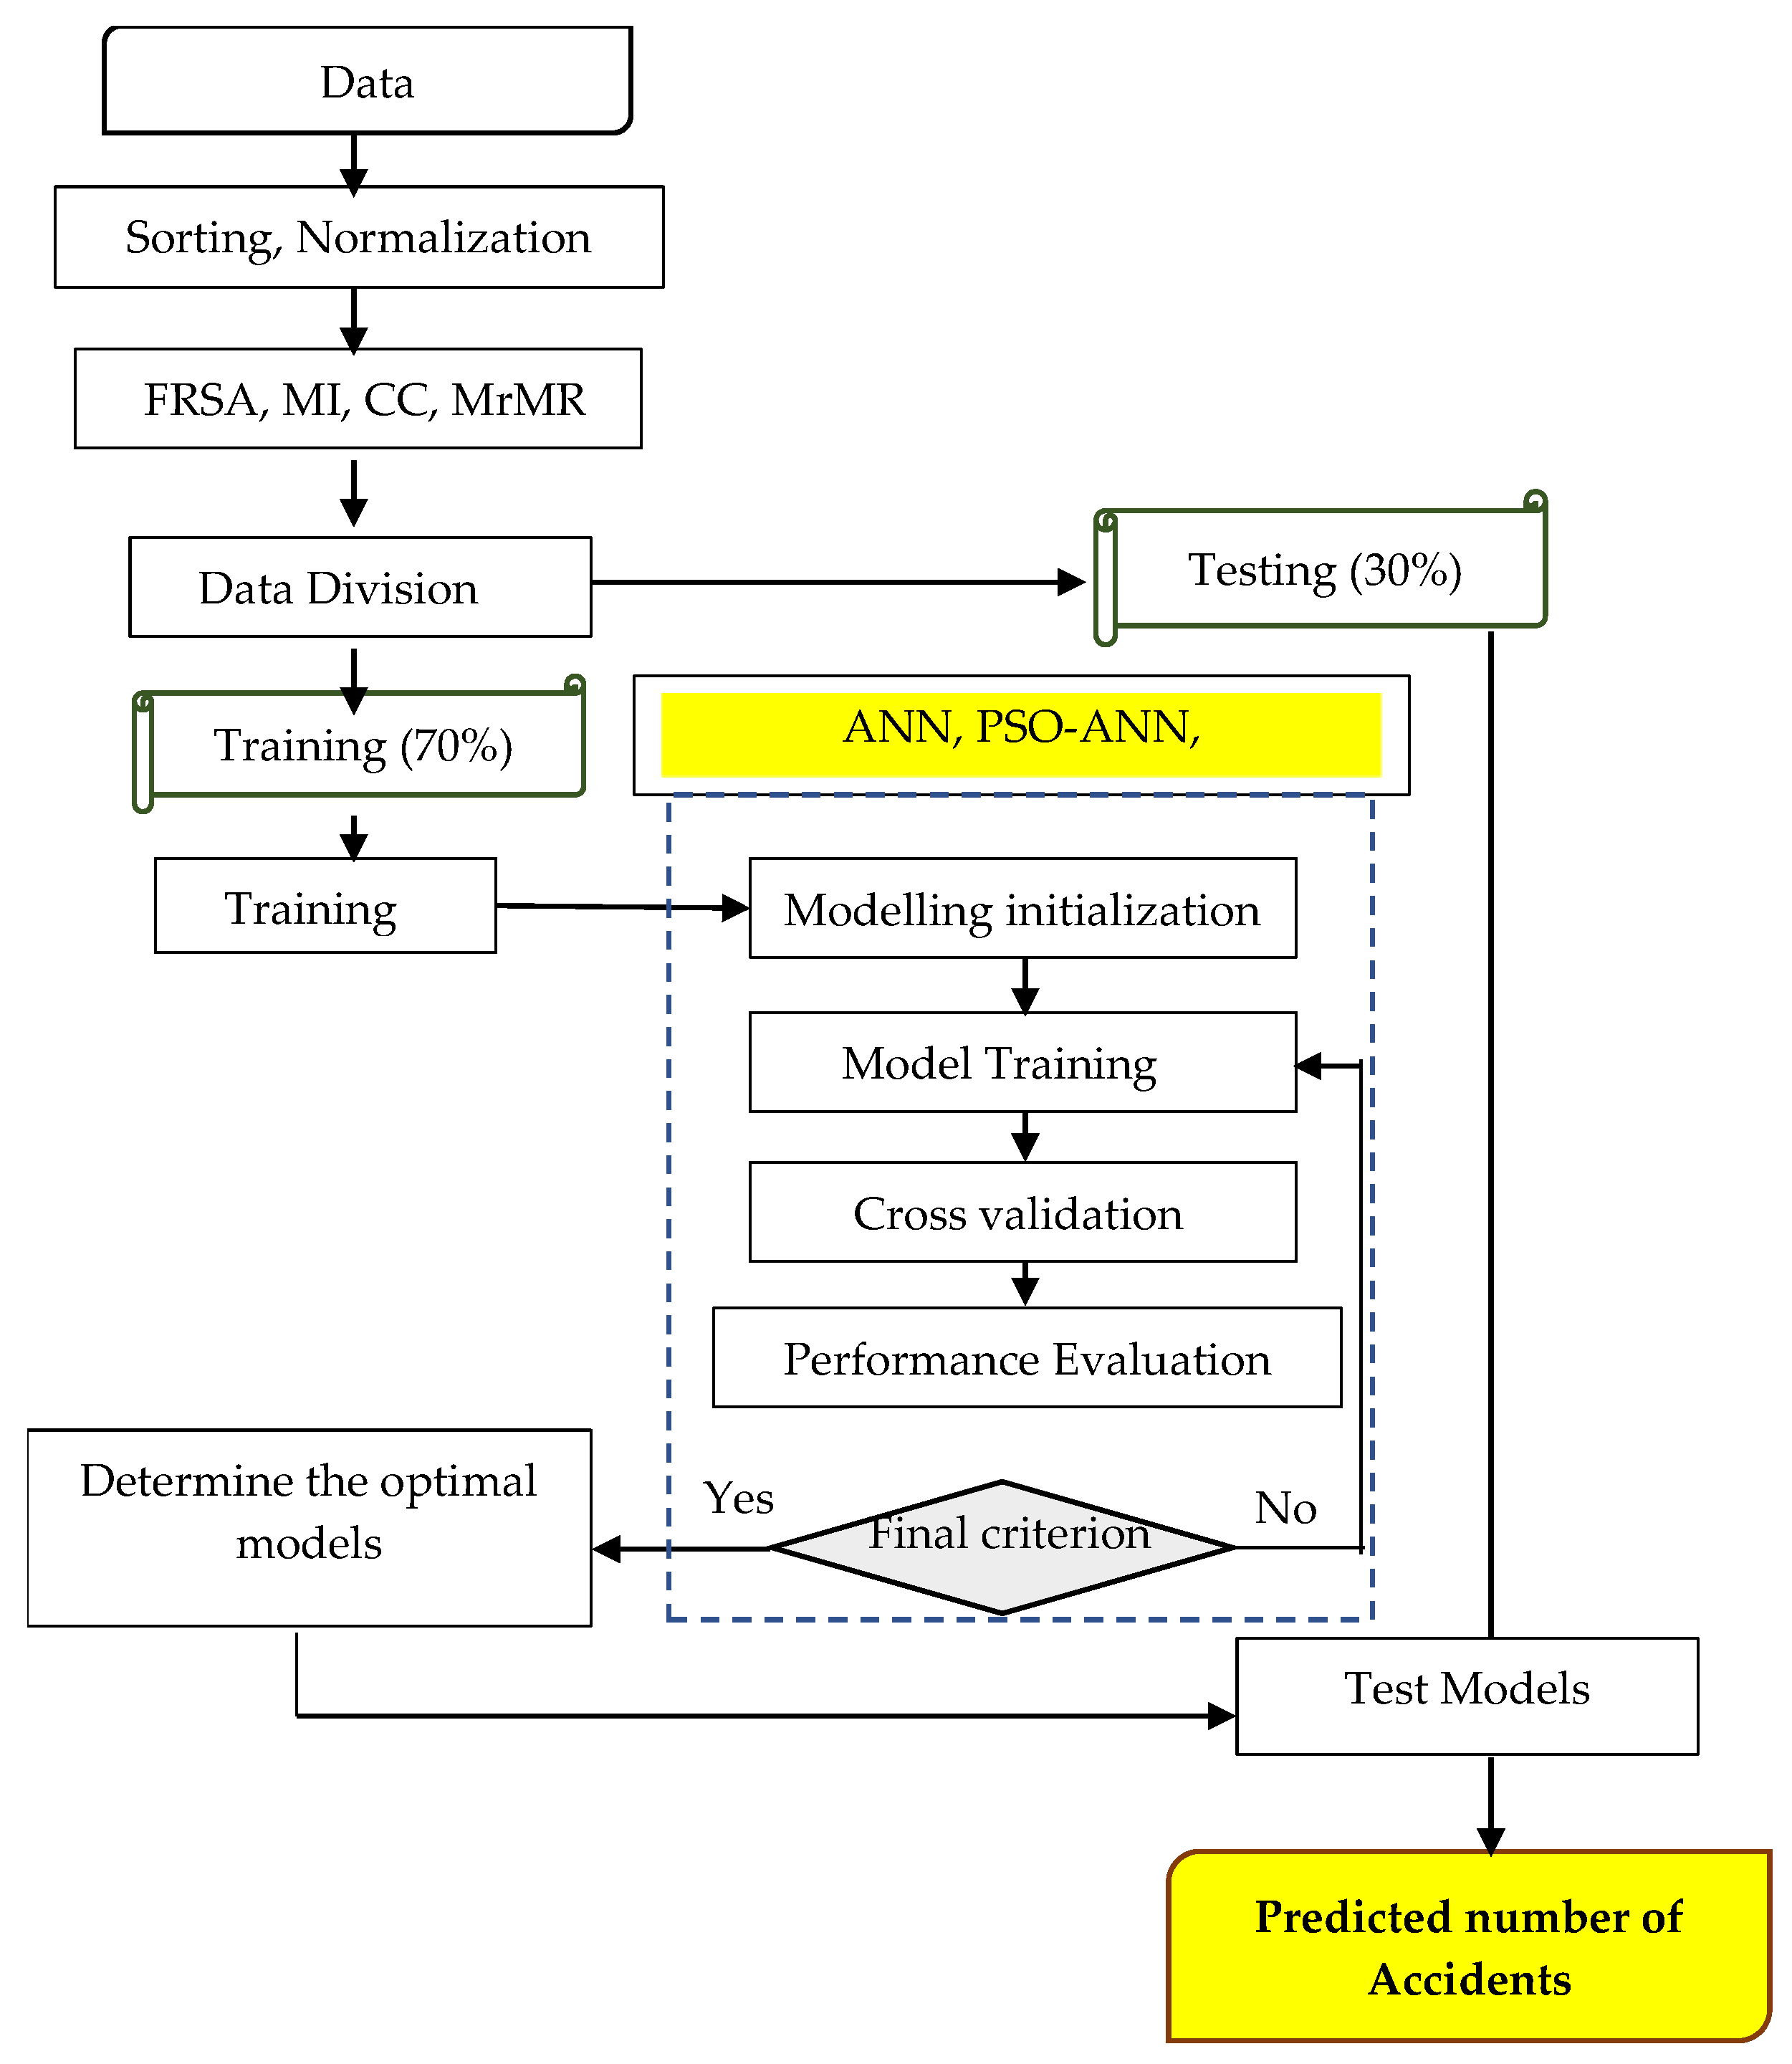
Figure 1. Schematic Diagram of proposed methodology.
Sustainability 15 11429 g001
Figure 2. Roundabout geometry.
Sustainability 15 11429 g002
Figure 3. Normality distribution plot of the data.
Sustainability 15 11429 g003
Figure 4. Structure of the ANN model.
Sustainability 15 11429 g004
Figure 5. PSO flowchart.
Sustainability 15 11429 g005
Figure 6. Flowchart for the ANN-PSO training algorithm.
Sustainability 15 11429 g006
Figure 7. Ranking of parameters importance using three different parameters.
Sustainability 15 11429 g007
Figure 8. Scatter plots showing DC values for (a) PSO-ANN (b) ANN.
Sustainability 15 11429 g008
Figure 9. Violin plots comparing number of observed accidents and the proposed models.
Sustainability 15 11429 g009
Table 1. Statistical summary of the study data.
VariablesMeanStd. Dev.KurtosisSkewnessRangeMinimumMaximum
ADT36,49034,418.766.452.4118,7176.0681.00187,857.0
No of Legs4.290.45−1.100.961.004.005.00
CID (m)48.0119.41−0.54−0.2568.408.2076.60
Circulating width10.761.41−0.77−0.704.808.2013.00
Entry angle29.2915.81−0.740.0364.000.0064.00
Entry/Exit width9.503.38−0.27−0.1617.500.0017.50
Entry/Exit width35.8216.58−0.540.6060.0010.0070.00
FFS59.913.913.81−0.0820.0050.0070.00
Capacity2835.44714.990.47−0.273672.001096.004768.00
Delay43.1719.96−0.99−0.1173.007.0080.00
speed49.5212.65−1.14−0.3151.0019.0070.00
v/c0.830.745.662.223.960.023.97
Que length20.5738.6915.043.60240.000.00240.00
No. of Acc.36.4859.4111.053.18327.000.00327.00
Table 2. Correlation matrix.
VariablesADTLand UseNo of LegsCID (m)Circulating WidthEntry AngleEntry/Exit WidthEntry/Exit WidthFFSCapacityDelaySpeedv/cQue LengthLocationNo. Acc
ADT1.00
Land use−0.011.00
No of Legs−0.030.441.00
CID (m)0.180.490.621.00
Circulating width−0.070.02−0.010.041.00
Entry angle−0.280.230.430.070.381.00
Entry/Exit width0.240.17−0.190.33−0.15−0.371.00
Entry/Exit width−0.070.260.290.290.220.32−0.291.00
FFS0.06−0.210.010.42−0.12−0.150.210.131.00
Capacity0.210.300.200.65−0.08−0.090.650.050.441.00
Delay0.43−0.090.010.41−0.41−0.560.58−0.390.240.451.00
speed−0.17−0.13−0.080.02−0.26−0.200.130.110.240.110.281.00
v/c0.01−0.22−0.18−0.08−0.14−0.210.08−0.150.01−0.040.18−0.081.00
Que length0.09−0.42−0.28−0.37−0.20−0.32−0.10−0.36−0.14−0.310.210.070.171.00
Location0.010.040.00−0.010.000.01−0.030.290.05−0.020.130.67−0.16−0.131.00
No. Acc0.830.100.030.240.02−0.170.230.080.050.210.29−0.160.02−0.110.071.00
Table 3. Sensitivity analysis.
Parameter MICCmrMRFRSA (RMSE)
ADT2.11120.82730.13960.2056
Circulating width0.45130.017800.1462
Entry angle0.8755−0.172500.1479
Entry/Exit width0.75820.22780.0470.1481
Entry/Exit width0.86750.084700.1444
FFS0.09780.045500.1462
Capacity0.88110.205500.1400
Delay0.88340.29250.02250.1421
speed0.6932−0.155600.1606
v/c1.12420.01512.82 × 10−150.1490
Que length0.6168−0.107800.1476
Location0.20120.065000.1843
No unit, the data are normalized.
Table 4. Modelling results.
Models TrainingTesting
DCRMSEMAEDCRMSEMAE
PSO-ANN0.94590.04680.03320.79350.04030.0322
ANN0.72270.10600.04630.62440.05430.0243
Disclaimer/Publisher’s Note: The statements, opinions and data contained in all publications are solely those of the individual author(s) and contributor(s) and not of MDPI and/or the editor(s). MDPI and/or the editor(s) disclaim responsibility for any injury to people or property resulting from any ideas, methods, instructions or products referred to in the content.