
How to Keep Investors’ Confidence after Being Labeled as Polluting Firms: The Role of External Political Ties and Internal Green Innovation Capabilities

Abstract
:1. Introduction
2. Theoretical Framework and Hypothesis Development
2.1. Theoretical Roadmap: Goal, Hypotheses, and Methods
2.2. Investor’s Perception of Polluting Label
2.3. Roles of Political Ties and Green Innovative Capability on Investors’ Perception
2.3.1. Political Ties
2.3.2. Green Innovative Capability
2.4. Interplay between Political Ties and Innovative Capability in Influencing Investors’ Perception
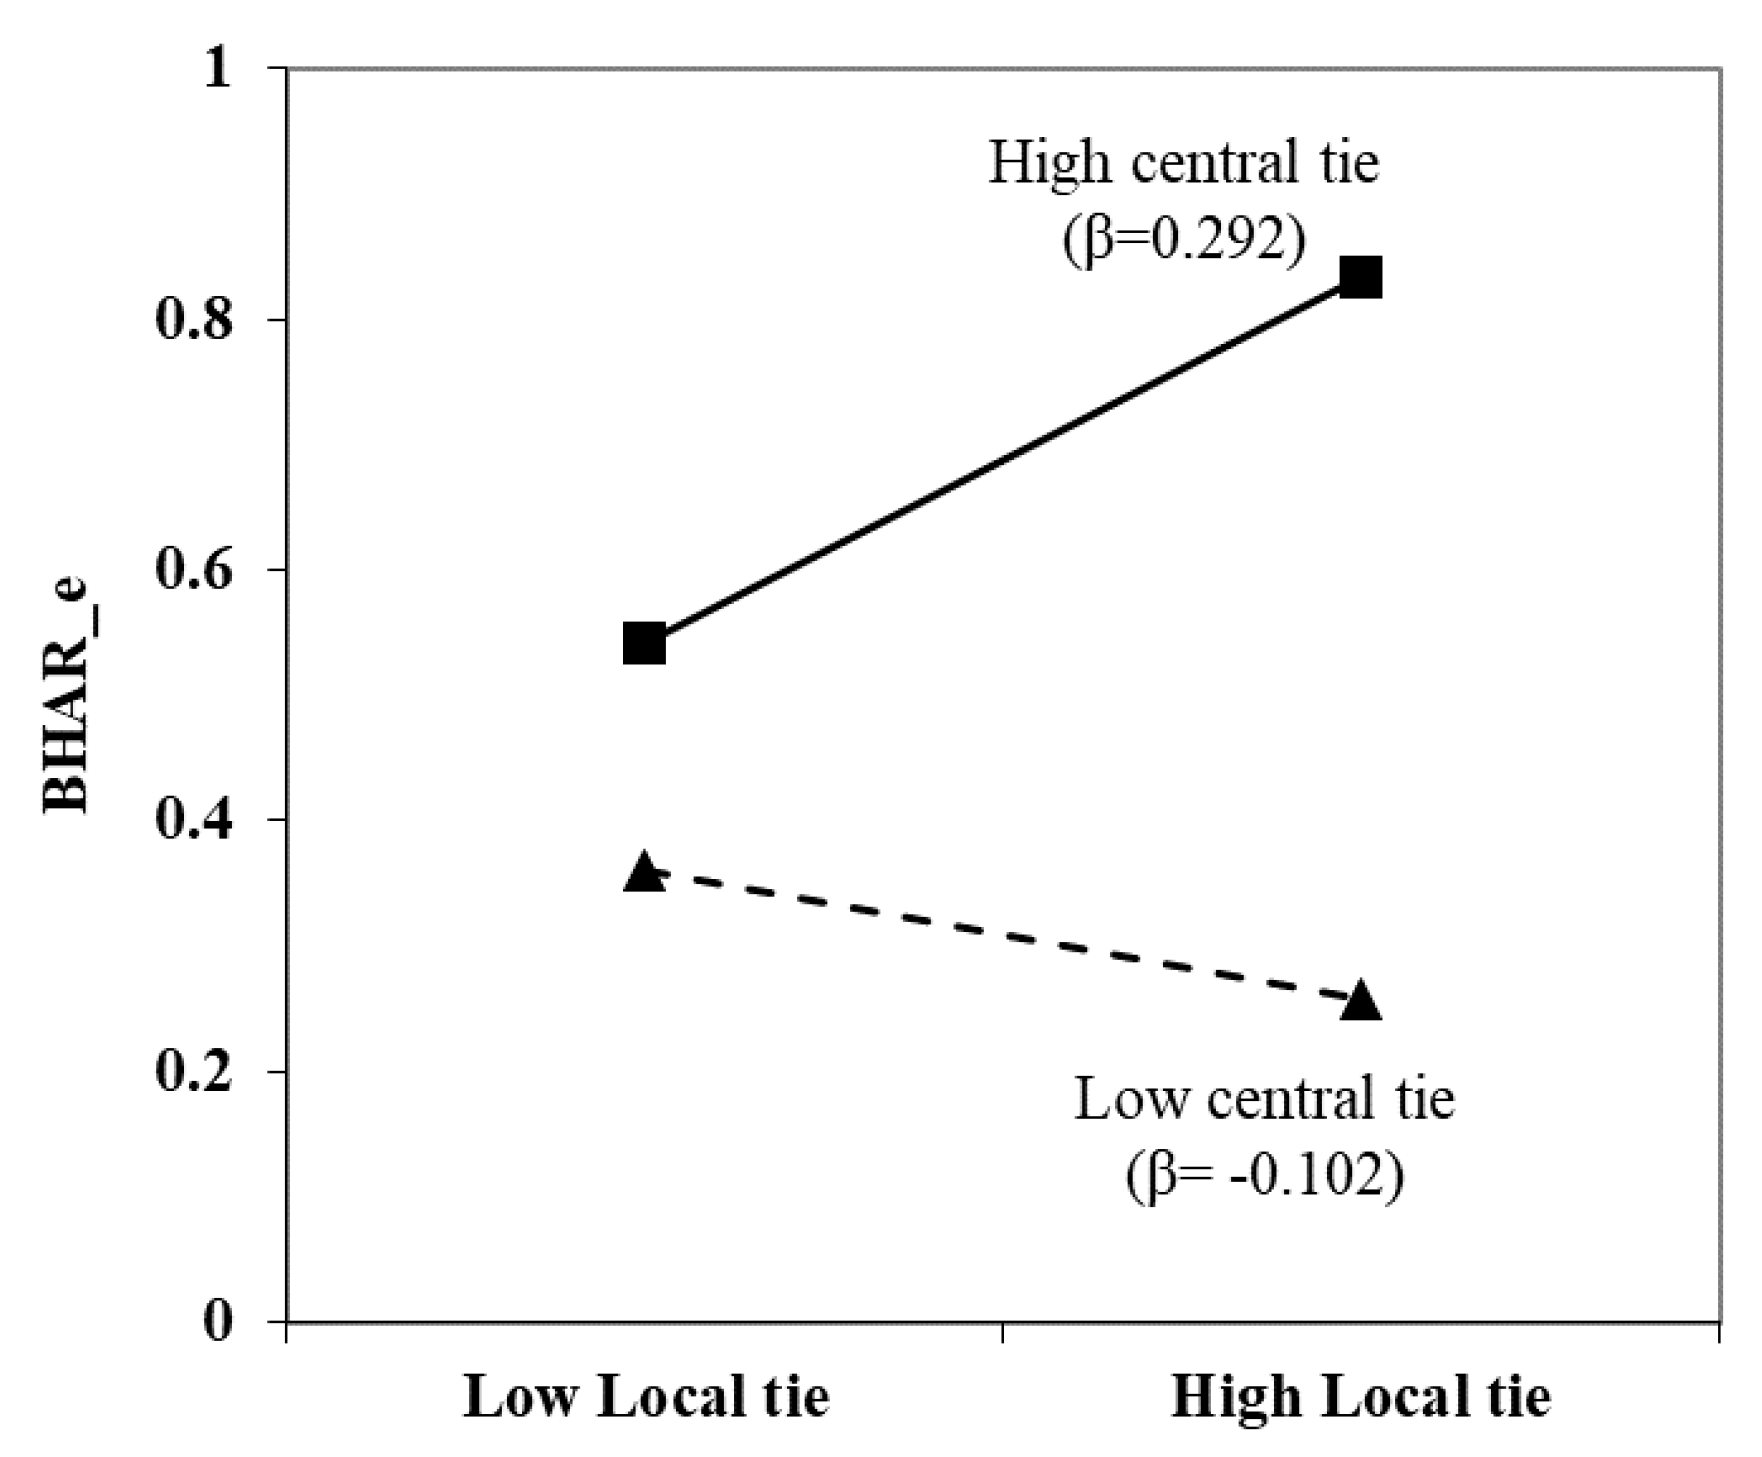
2.4.1. Interaction of Central and Local Political Ties
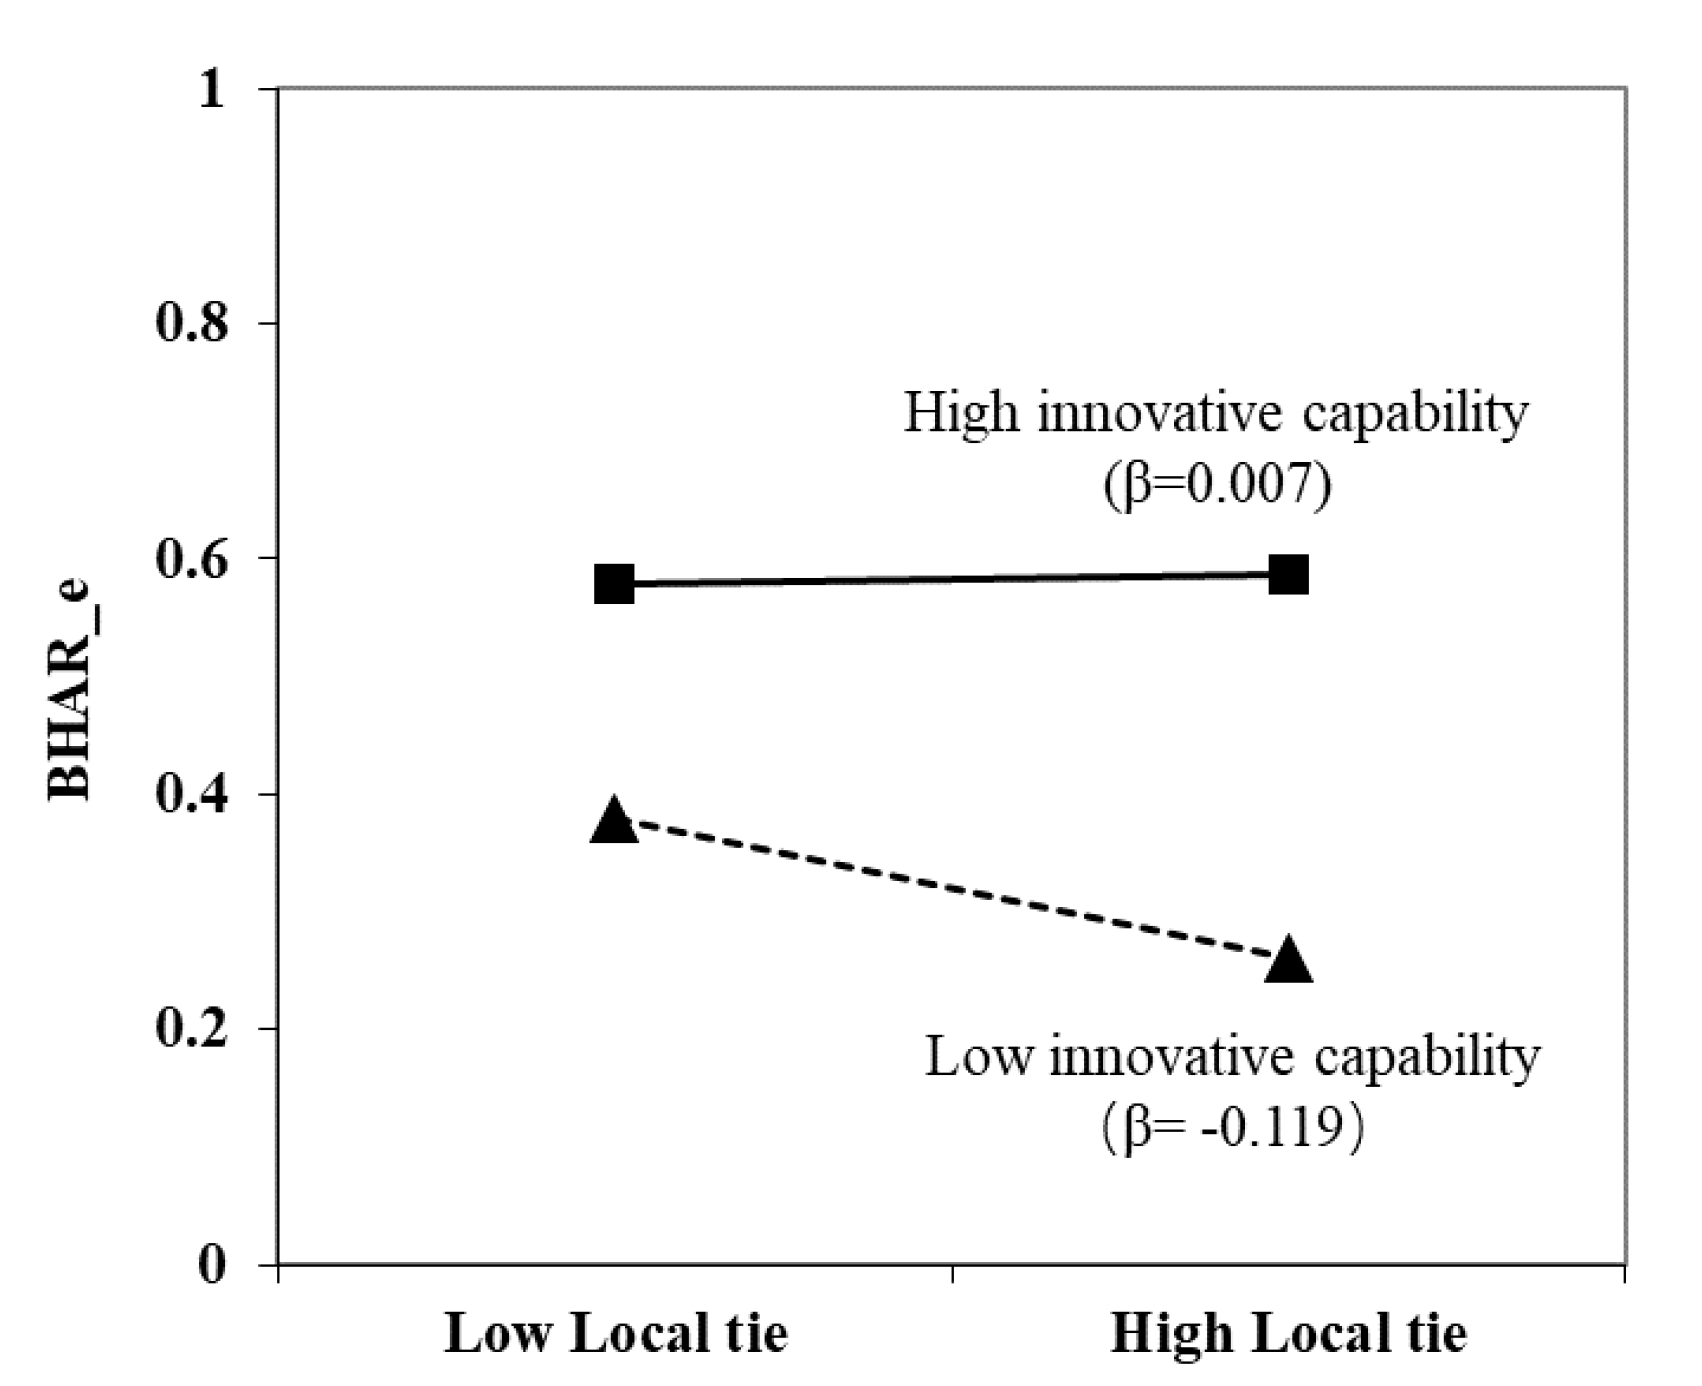
2.4.2. Interaction of Local Ties and Innovative Capability
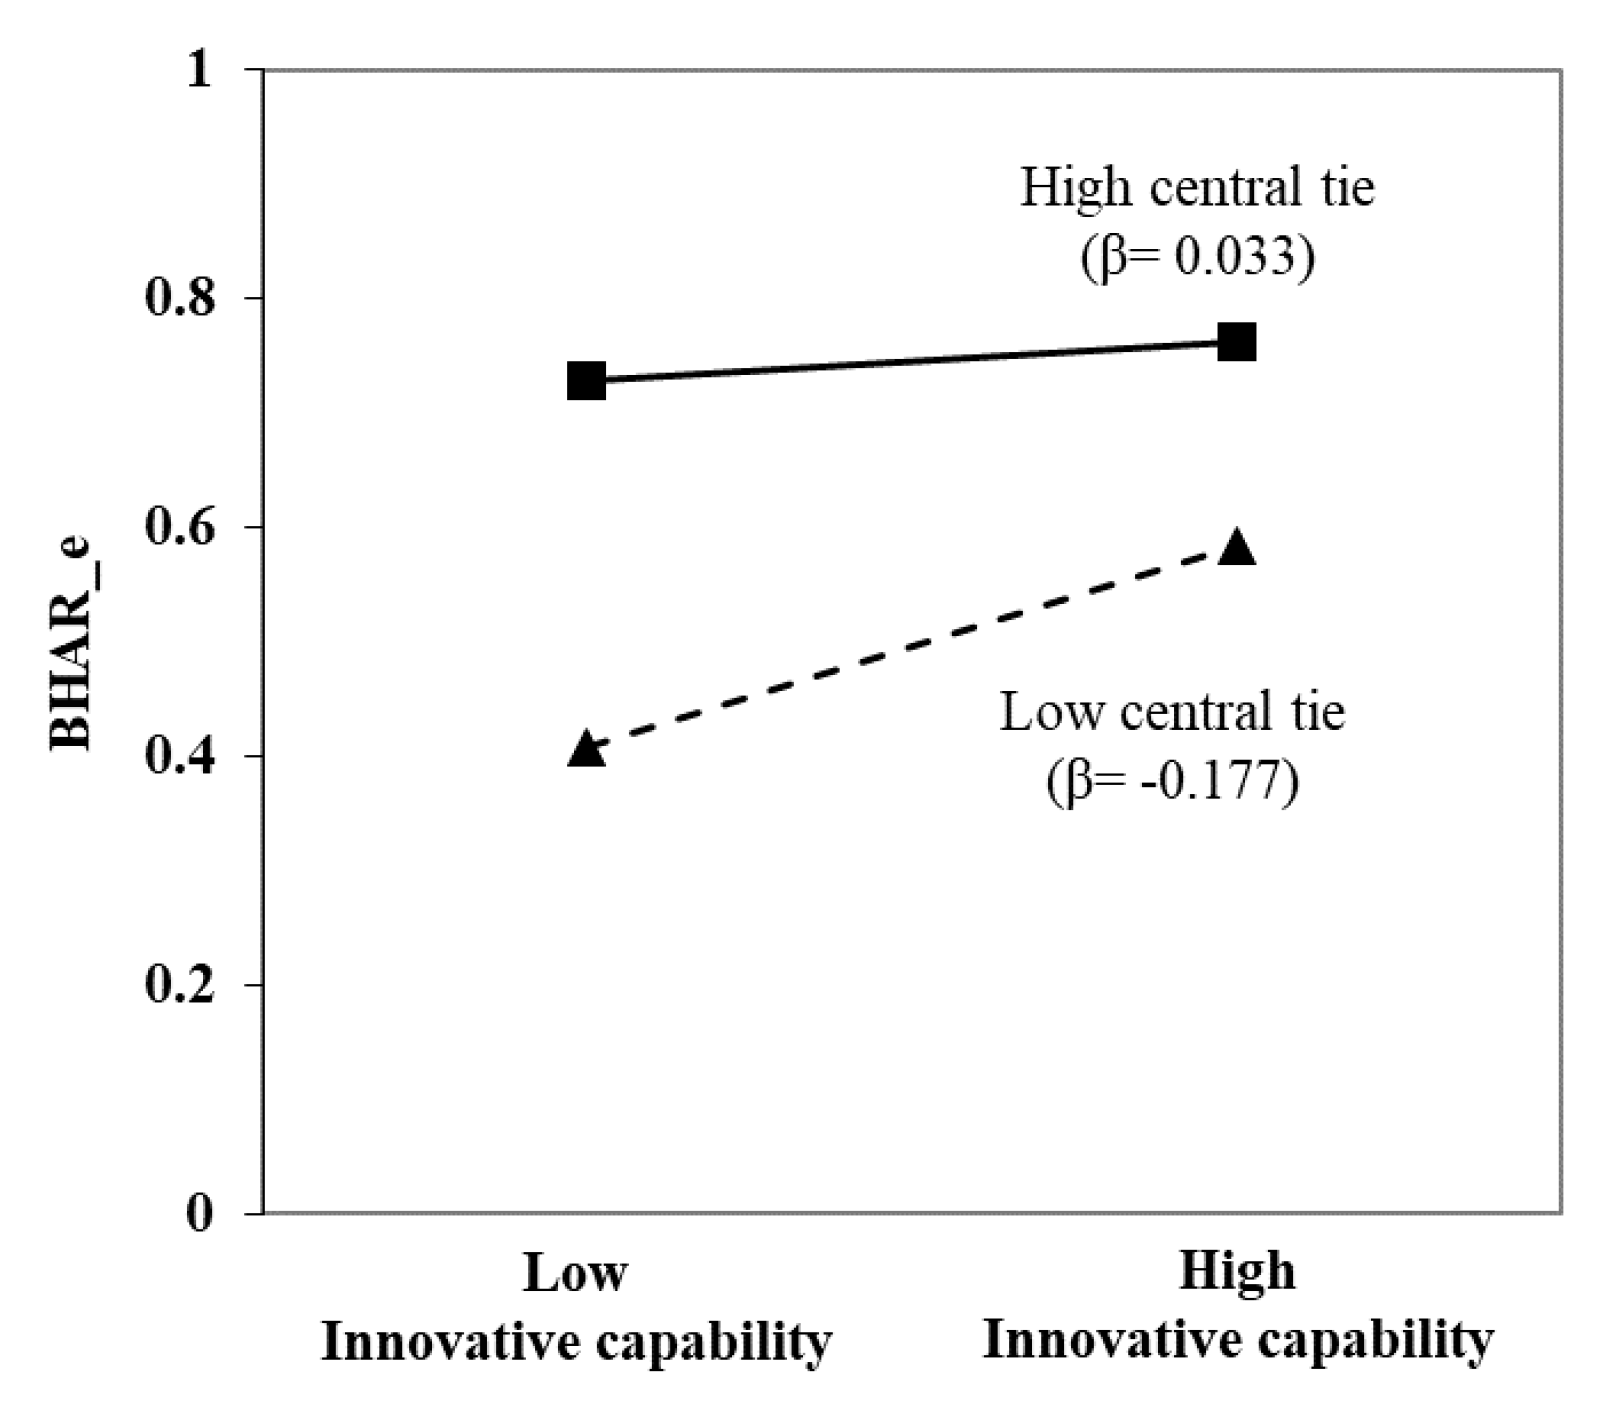
2.4.3. Interaction of Central Ties and Innovative Capability
3. Methodology
3.1. Sample and Data Collection
3.2. Measurement
3.3. Independent Variables
3.4. Control Variables
3.5. Model and Analysis
4. Results
5. Robustness Test
6. Discussion and Conclusions
Author Contributions
Funding
Institutional Review Board Statement
Informed Consent Statement
Data Availability Statement
Conflicts of Interest
References
- Greenwood, R.; Raynard, M.; Kodeih, F.; Micelotta, E.R.; Lounsbury, M. Institutional complexity and organizational responses. Acad. Manag. Ann. 2011, 5, 317–371. [Google Scholar] [CrossRef]
- Maitlis, S.; Christianson, M. Sensemaking in organizations: Taking stock and moving forward. Acad. Manag. Ann. 2014, 8, 57–125. [Google Scholar] [CrossRef]
- Clarkson, P.M.; Li, Y.; Richardson, G.D.; Vasvari, F.P. Revisiting the relation between environmental performance and environmental disclosure: An empirical analysis. Account. Organ. Soc. 2008, 33, 303–327. [Google Scholar] [CrossRef]
- Ameer, R.; Othman, R. Sustainability practices and corporate financial performance: A study based on the top global corporations. J. Bus. Ethics 2012, 108, 61–79. [Google Scholar] [CrossRef]
- Wu, H.; Li, S.; Ying, S.X.; Chen, X. Politically connected CEOs, firm performance, and CEO pay. J. Bus. Res. 2018, 91, 169–180. [Google Scholar] [CrossRef]
- Huang, J.-W.; Li, Y.-H. Green innovation and performance: The view of organizational capability and social reciprocity. J. Bus. Ethics 2017, 145, 309–324. [Google Scholar] [CrossRef]
- Hepburn, C.; Qi, Y.; Stern, N.; Ward, B.; Xie, C.; Zenghelis, D. Towards carbon neutrality and China’s 14th Five-Year Plan: Clean energy transition, sustainable urban development, and investment priorities. Environ. Sci. Ecotechnol. 2021, 8, 100130. [Google Scholar] [CrossRef]
- Kahneman, D.; Tversky, A. Prospect Theory: An Analysis of Decision under Risk. Soc. Sci. Electron. Publ. 1979, 47, 263–292. [Google Scholar] [CrossRef]
- Van Dijk, E.; Van Knippenberg, D. Buying and selling exchange goods: Loss aversion and the endowment effect. J. Econ. Psychol. 1996, 17, 517–524. [Google Scholar] [CrossRef]
- Shogren, J.F.; Shin, S.Y.; Hayes, D.J.; Kliebenstein, J.B. Resolving differences in willingness to pay and willingness to accept. Am. Econ. Rev. 1994, 84, 255–270. [Google Scholar]
- Loewenstein, G.; Issacharoff, S. Source dependence in the valuation of objects. J. Behav. Decis. Mak. 1994, 7, 157–168. [Google Scholar] [CrossRef]
- Salehi, M.; Fahimifard, S.H.; Zimon, G.; Bujak, A.; Sadowski, A. The effect of CO2 gas emissions on the market value, price and shares returns. Energies 2022, 15, 9221. [Google Scholar] [CrossRef]
- Xu, L.; Wu, C.; Qin, Q.; Lin, X. Spillover effects and nonlinear correlations between carbon emissions and stock markets: An empirical analysis of China’s carbon-intensive industries. Energy Econ. 2022, 111, 106071. [Google Scholar] [CrossRef]
- Amel-Zadeh, A.; Serafeim, G. Why and how investors use ESG information: Evidence from a global survey. Financ. Anal. J. 2018, 74, 87–103. [Google Scholar] [CrossRef]
- Hillman, A.J. Politicians on the board of directors: Do connections affect the bottom line? J. Manag. 2005, 31, 464–481. [Google Scholar] [CrossRef]
- Wang, K.; Zhang, Q.; Wang, D.; Yang, D. The impact of political ties on firms’ innovation capability: Evidence from China. Asia Pac. J. Manag. 2023. [Google Scholar] [CrossRef]
- Ma, D.; Parish, W.L. Tocquevillian moments: Charitable contributions by Chinese private entrepreneurs. Soc. Forces 2006, 85, 943–964. [Google Scholar] [CrossRef]
- Okhmatovskiy, I.; David, R.J. Setting your own standards: Internal corporate governance codes as a response to institutional pressure. Organ. Sci. 2012, 23, 155–176. [Google Scholar] [CrossRef]
- Li, H.; Meng, L.; Wang, Q.; Zhou, L.-A. Political connections, financing and firm performance: Evidence from Chinese private firms. J. Dev. Econ. 2008, 87, 283–299. [Google Scholar] [CrossRef]
- Zhang, J.; Marquis, C.; Qiao, K. Do political connections buffer firms from or bind firms to the government? A study of corporate charitable donations of Chinese firms. Organ. Sci. 2016, 27, 1307–1324. [Google Scholar] [CrossRef]
- George, E.; Chattopadhyay, P.; Sitkin, S.B.; Barden, J. Cognitive underpinnings of institutional persistence and change: A framing perspective. Acad. Manag. Rev. 2006, 31, 347–365. [Google Scholar] [CrossRef]
- Boubakri, N.; Guedhami, O.; Mishra, D.; Saffar, W. Political connections and the cost of equity capital. J. Corp. Financ. 2012, 18, 541–559. [Google Scholar] [CrossRef]
- Mamuneas, T.P.; Nadiri, M.I. Public R&D policies and cost behavior of the US manufacturing industries. J. Public Econ. 1996, 63, 57–81. [Google Scholar]
- Zhou, W. Political connections and entrepreneurial investment: Evidence from China’s transition economy. J. Bus. Ventur. 2013, 28, 299–315. [Google Scholar] [CrossRef]
- Peng, M.W.; Luo, Y. Managerial ties and firm performance in a transition economy: The nature of a micro-macro link. Acad. Manag. J. 2000, 43, 486–501. [Google Scholar] [CrossRef]
- Sun, P.; Mellahi, K.; Wright, M. The contingent value of corporate political ties. Acad. Manag. Perspect. 2012, 26, 68–82. [Google Scholar] [CrossRef]
- Zhang, G. Government intervention, environmental pollution and corporate environmental protection investment: Evidence from listed companies of heavy pollution industries. Res. Econ. Manag. 2013, 9, 38–44. [Google Scholar]
- Luo, X.R.; Wang, D.; Zhang, J. Whose call to answer: Institutional complexity and firms’ CSR reporting. Acad. Manag. J. 2017, 60, 321–344. [Google Scholar] [CrossRef]
- Yi, Y.; Demirel, P. The impact of sustainability-oriented dynamic capabilities on firm growth: Investigating the green supply chain management and green political capabilities. Bus. Strategy Environ. 2023. [Google Scholar] [CrossRef]
- Hart, S.-L.; Dowell, G. Invited editorial: A natural-resource-based view of the firm: Fifteen years after. J. Manag. 2011, 37, 1464–1479. [Google Scholar] [CrossRef]
- Schiederig, T.; Tietze, F.; Herstatt, C. Green innovation in technology and innovation management—An exploratory literature review. RD Manag. 2012, 42, 180–192. [Google Scholar]
- Dangelico, R.M.; Pujari, D. Mainstreaming green product innovation: Why and how companies integrate environmental sustainability. J. Bus. Ethics 2010, 95, 471–486. [Google Scholar] [CrossRef]
- Chen, Y.-S.; Lai, S.-B.; Wen, C.-T. The influence of green innovation performance on corporate advantage in Taiwan. J. Bus. Ethics 2006, 67, 331–339. [Google Scholar] [CrossRef]
- Vergne, J.-P.; Wernicke, G.; Brenner, S. Signal incongruence and its consequences: A study of media disapproval and CEO overcompensation. Organ. Sci. 2018, 29, 796–817. [Google Scholar] [CrossRef]
- Salehi, M.; Sadeq Alanbari, S.A. Knowledge sharing barriers and knowledge sharing facilitators in innovation. Eur. J. Innov. Manag. 2023. [Google Scholar] [CrossRef]
- Makadok, R. Toward a synthesis of the resource-based and dynamic-capability views of rent creation. Strateg. Manag. J. 2001, 22, 387–401. [Google Scholar] [CrossRef]
- Rubinstein, M. Markowitz’s “portfolio selection”: A fifty-year retrospective. J. Financ. 2002, 57, 1041–1045. [Google Scholar] [CrossRef]
- Tsai, W. Knowledge transfer in intraorganizational networks: Effects of network position and absorptive capacity on business unit innovation and performance. Acad. Manag. J. 2001, 44, 996–1004. [Google Scholar] [CrossRef]
- De Luca, L.M.; Atuahene-Gima, K. Market knowledge dimensions and cross-functional collaboration: Examining the different routes to product innovation performance. J. Mark. 2007, 71, 95–112. [Google Scholar] [CrossRef]
- Xin, K.K.; Pearce, J.L. Guanxi: Connections as substitutes for formal institutional support. Acad. Manag. J. 1996, 39, 1641–1658. [Google Scholar] [CrossRef]
- Wang, C.; Hong, J.; Kafouros, M.; Wright, M. Exploring the role of government involvement in outward FDI from emerging economies. J. Int. Bus. Stud. 2012, 43, 655–676. [Google Scholar] [CrossRef]
- Wang, T.; Zhang, T.; Shou, Z. The double-edged sword effect of political ties on performance in emerging markets: The mediation of innovation capability and legitimacy. Asia Pac. J. Manag. 2021, 38, 1003–1030. [Google Scholar] [CrossRef]
- Barber, B.M.; Lyon, J.D. Detecting long-run abnormal stock returns: The empirical power and specification of test statistics. J. Financ. Econ. 1997, 43, 341–372. [Google Scholar] [CrossRef]
- Lyon, J.D.; Barber, B.M.; Tsai, C.L. Improved methods for tests of long-run abnormal stock returns. J. Financ. 1999, 54, 165–201. [Google Scholar] [CrossRef]
- Popli, M.; Ladkani, R.M.; Gaur, A.S. Business group affiliation and post-acquisition performance: An extended resource-based view. J. Bus. Res. 2017, 81, 21–30. [Google Scholar] [CrossRef]
- Zheng, W.; Singh, K.; Mitchell, W. Buffering and enabling: The impact of interlocking political ties on firm survival and sales growth. Strateg. Manag. J. 2015, 36, 1615–1636. [Google Scholar] [CrossRef]
- Plummer, L.A.; Allison, T.H.; Connelly, B.L. Better together? Signaling interactions in new venture pursuit of initial external capital. Acad. Manag. J. 2016, 59, 1585–1604. [Google Scholar] [CrossRef]
- Amaeshi, K.; Adegbite, E.; Rajwani, T. Corporate social responsibility in challenging and non-enabling institutional contexts: Do institutional voids matter? J. Bus. Ethics 2016, 134, 135–153. [Google Scholar] [CrossRef]
- Claasen, C.; Roloff, J. The link between responsibility and legitimacy: The case of De Beers in Namibia. J. Bus. Ethics 2012, 107, 379–398. [Google Scholar] [CrossRef]
- McWilliams, A.; Siegel, D.S. Creating and capturing value: Strategic corporate social responsibility, resource-based theory, and sustainable competitive advantage. J. Manag. 2011, 37, 1480–1495. [Google Scholar] [CrossRef]
- Ortiz-de-Mandojana, N.; Bansal, P. The long-term benefits of organizational resilience through sustainable business practices. Strateg. Manag. J. 2016, 37, 1615–1631. [Google Scholar] [CrossRef]
- Beck, T.; Levine, R.; Levkov, A. Big bad banks? The winners and losers from bank deregulation in the United States. J. Financ. 2010, 65, 1637–1667. [Google Scholar] [CrossRef]
- Chaudhary, S.; Dhir, A.; Ferraris, A.; Bertoldi, B. Trust and reputation in family businesses: A systematic literature review of past achievements and future promises. J. Bus. Res. 2021, 137, 143–161. [Google Scholar] [CrossRef]
- Dhaliwal, D.S.; Li, O.Z.; Tsang, A.; Yang, Y.G. Voluntary nonfinancial disclosure and the cost of equity capital: The initiation of corporate social responsibility reporting. Account. Rev. 2011, 86, 59–100. [Google Scholar] [CrossRef]
- Certo, S.T. Influencing initial public offering investors with prestige: Signaling with board structures. Acad. Manag. Rev. 2003, 28, 432–446. [Google Scholar] [CrossRef]
- Shane, S.; Stuart, T. Organizational endowments and the performance of university start-ups. Manag. Sci. 2002, 48, 154–170. [Google Scholar] [CrossRef]

| Objective 1: Examine investors’ perception of polluting labels and how this perception changes over time. |
|
| Objective 2: Understand the perception of a firm’s political ties and green innovative capabilities by investors, especially in the context of the polluting label. |
|
| Objective 3: Uncover how these political ties and innovation capabilities, when combined, mold investors’ understanding of the polluting label. |
|
| Year | Number of Listed Manufacturing Firms Newly on the List | Monitor Duration (Years) | Total Number of Listed Manufacturing Firms in That Year (Excluding Firms That Have Stopped Production) | Sample Size after 1:1 PSM Matching Year by Year | ||||||||
|---|---|---|---|---|---|---|---|---|---|---|---|---|
| 1 | 2 | 3 | 4 | 5 | 6 | 7 | 8 | 9 | ||||
| 2010 | 114 | 114 | 44 | |||||||||
| 2011 | 143 | 81 | 224 | 81 | ||||||||
| 2012 | 142 | 95 | 43 | 280 | 104 | |||||||
| 2013 | 131 | 78 | 51 | 19 | 279 | 112 | ||||||
| 2014 | 155 | 83 | 49 | 11 | 12 | 310 | 172 | |||||
| 2015 | 160 | 74 | 46 | 28 | 18 | 11 | 337 | 209 | ||||
| 2016 | 183 | 65 | 36 | 21 | 20 | 17 | 8 | 350 | 201 | |||
| 2017 | 276 | 97 | 47 | 22 | 17 | 5 | 9 | 4 | 477 | 232 | ||
| 2018 | 253 | 123 | 80 | 36 | 15 | 7 | 15 | 5 | 4 | 538 | 239 | |
| 2019 | 154 | 114 | 49 | 53 | 12 | 2 | 5 | 6 | 2 | 397 | 186 | |
| 2020 | 24 | 25 | 13 | 5 | 22 | 3 | 1 | 5 | 5 | 2 | 105 | 90 |
| Total | 1735 | 835 | 414 | 195 | 116 | 45 | 38 | 20 | 11 | 2 | 3411 | 1670 |
| Hypothesis | Sample Description |
|---|---|
| H1 | All listed manufacturing firms (i.e., Industries C13–C42 under the China Securities Regulatory Commission classification system) on the NSM list. The total amount of firms is 269. |
| H2,3 | According to the research design, the PSM processing group in this paper were manufacturing firms listed as NSM firms from 2010 to 2020. The control group were listed manufacturing firms that had never been listed as NSM firms from 2010 to 2020. Then, the probit model was used to estimate the propensity score, kernel matching was used to determine the weight, and common support conditions were applied for matching year by year. The final number of observations is 1580, including 1670 NSM firms and 1670 non-NSM firms. |
| H4 | 1670 observations that are NSM-listed manufacturing firms from 2010 to 2020. |
| Variable name | Measurement |
|---|---|
| 1. Market value | BHAR. |
| 2. Polluting label (dummy) | 1 = focal manufacturing firm is NSM firm; 0 = otherwise, annual. |
| 3. Central tie | where i = (1, n), n is the number of TMT executives who served as delegates to central institutions; is the administrative level of the executive’s position: 5 = national level; 4 = provincial level; 3 = bureau level; 2 = county level; and 1 = township and other levels. |
| 4. Local tie | where i = (1, n), n is the number of TMT executives who served as a delegate to local institutions; is the administrative level of the executive’s position: 5 = national level; 4 = provincial level; 3 = bureau level; 2 = county level; and 1 = township and other levels. |
| 5. Green innovative capability | Log(number of green invention patents + number of green utility patents + 1). |
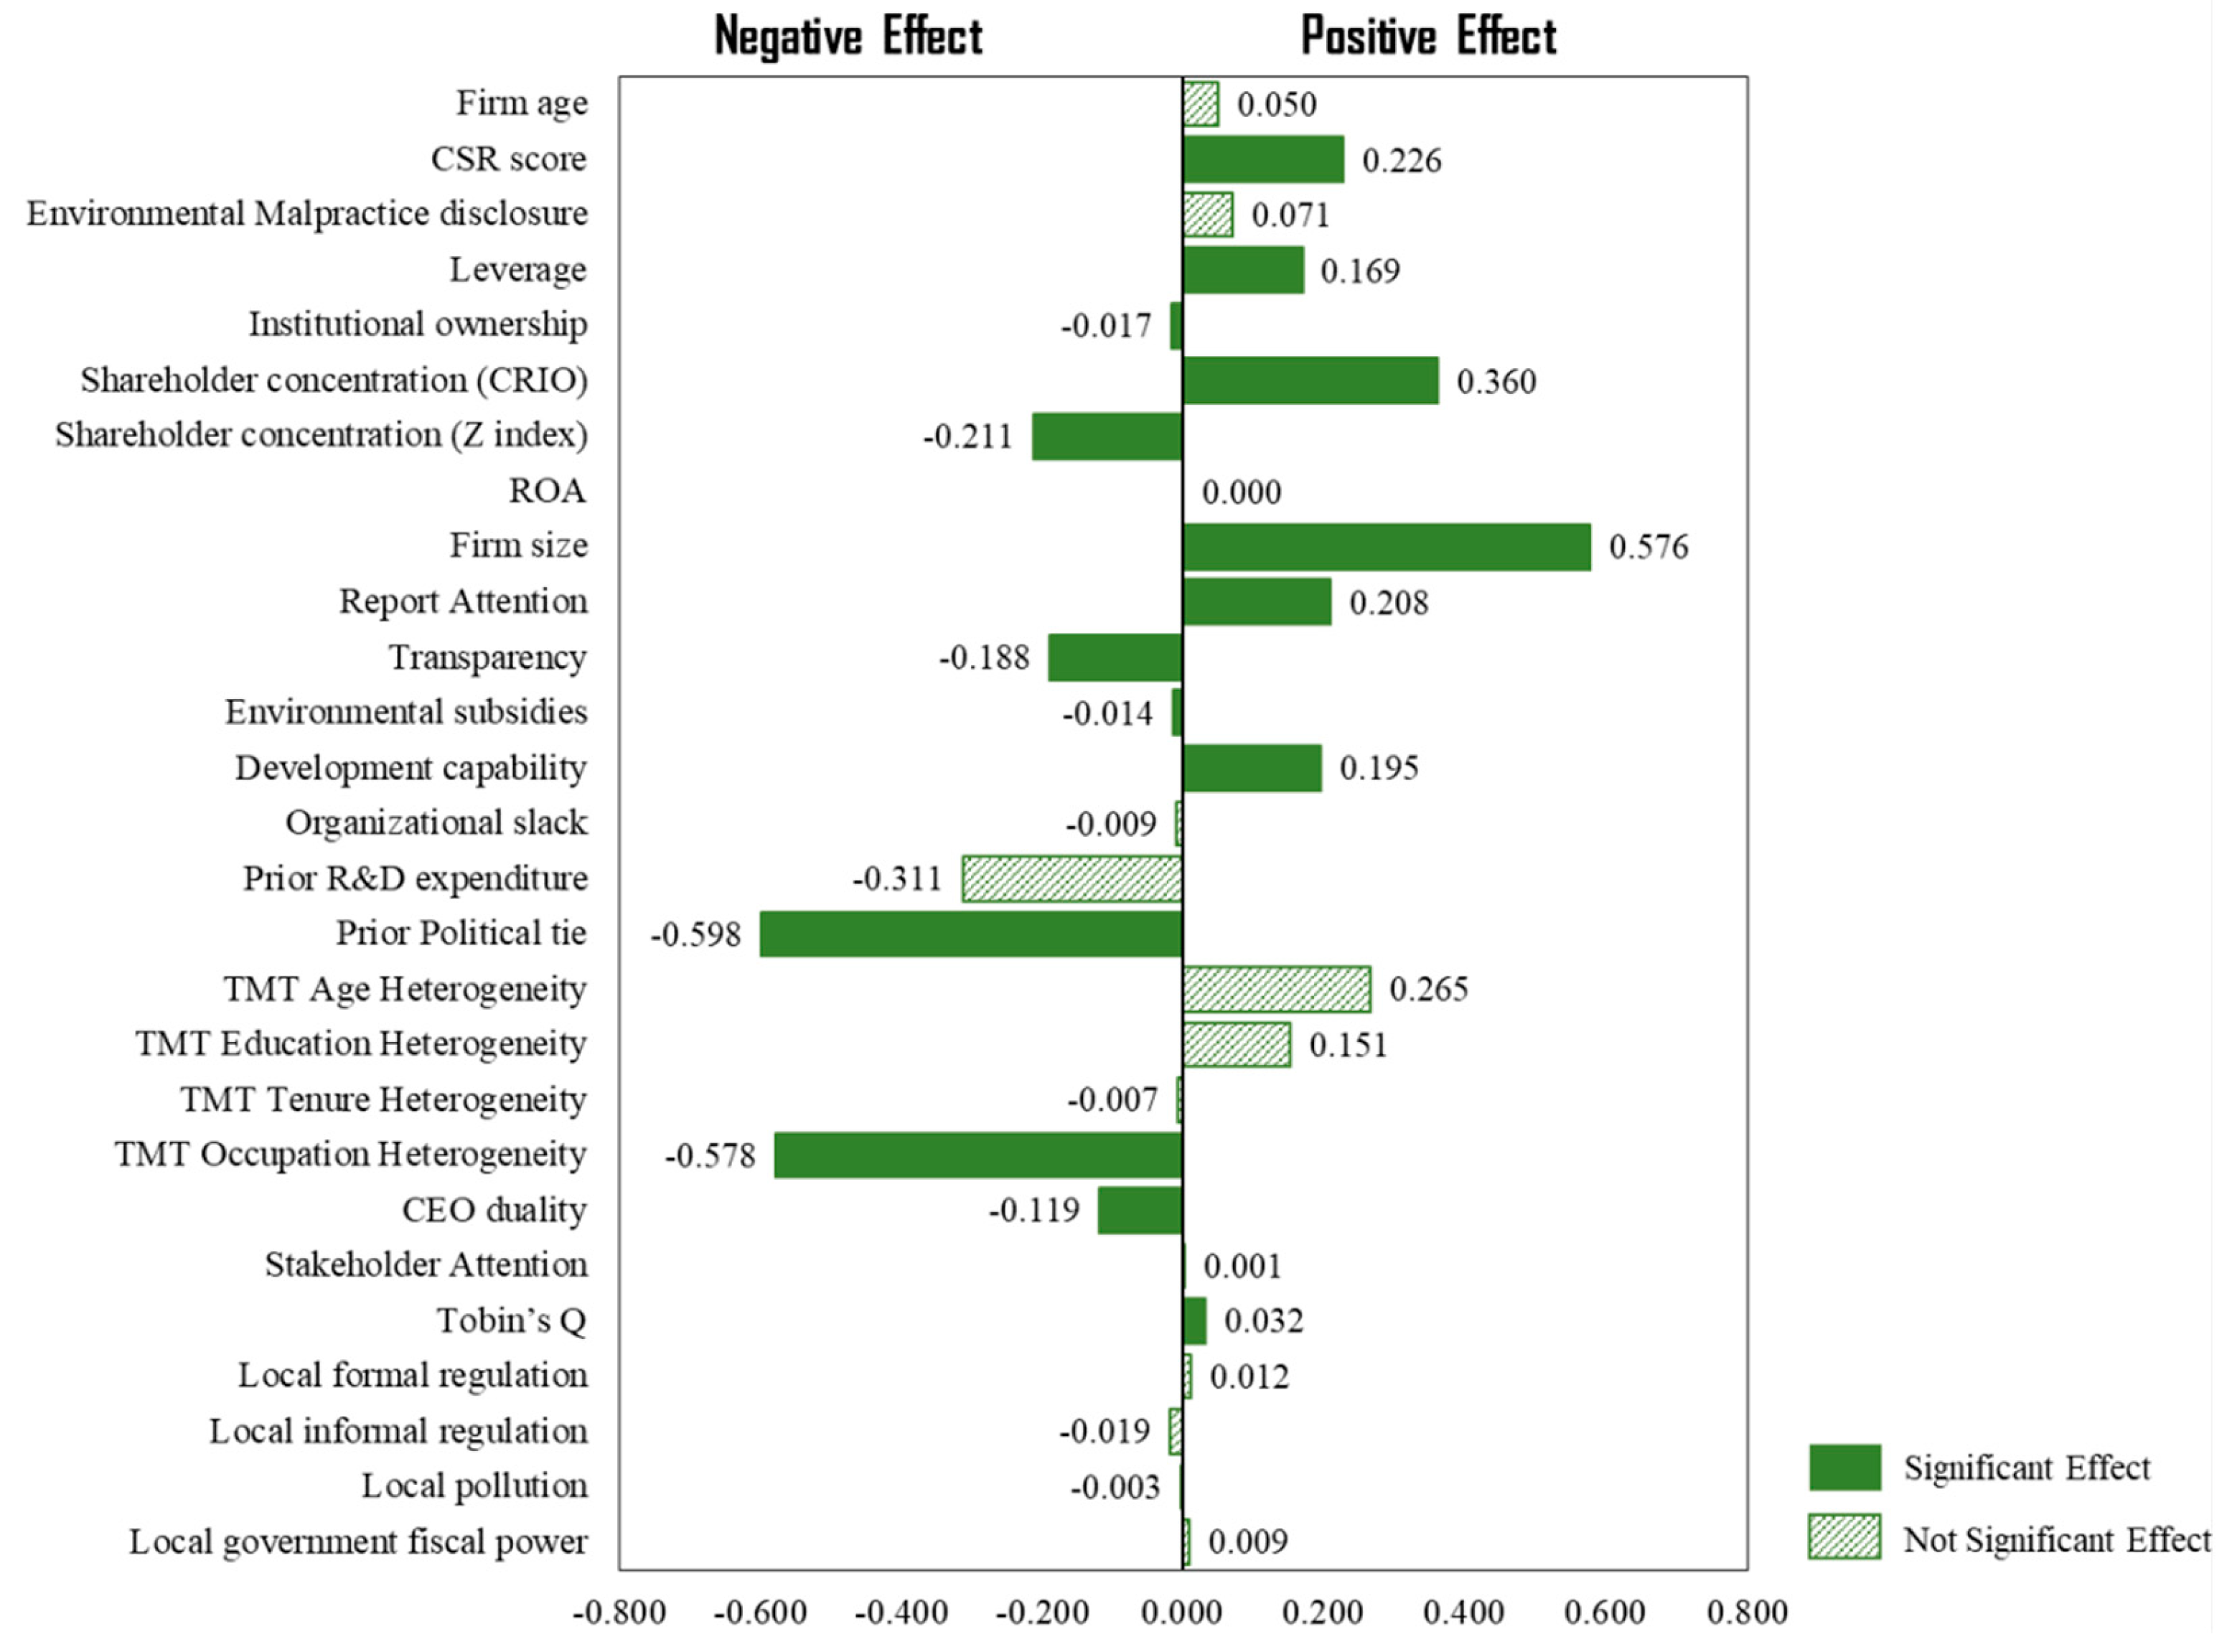
| 6. Firm age | Log[(year that the firm was monitored by MEP year that the firm was founded), 10]. |
| 7. CSR score | Log(CSR grade disclosed by HEXUN in that year + 1, 10), annual. |
| 8. Environmental Malpractice disclosure | The number of times the firm was disclosed by local environmental protection bureaus (EPBs) or MEP to have violated environmental regulations. |
| 9. Leverage | Debt/Assets, annual. |
| 10. Institutional ownership | Percentage of shares owned by all institutional owners, annual. |
| 11. Shareholder concentration (CRIO) | Percentage of shares owned by the top ten largest shareholders, annual. |
| 12. Shareholder concentration (Z index) | Percentage of shares owned by the largest shareholder/percentage of shares owned by the second largest shareholder, annual. |
| 13. ROA | Return on assets in that year, annual. |
| 14. Firm size | Log(total assets, 10), annual. |
| 15. Report Attention | Log(number of research reports that have tracked and analyzed the focal firm + 1,10), annual. |
| 16. Transparency | Log(the total number of announcements published by the focal firm, 10), annual. |
| 17. Environmental subsidies | Variable was retrieved and calculated from tables specifying “details for subsidies from the government,” which are provided in the firm’s annual reports. |
| 18. Development capability | Revenue growth rate in that year, annual. |
| 19. Organizational slack | Log(major repair fund, 10) + log(inventory fund, 10) + log(accounts payables, 10), annual. |
| 20. TMT Age Heterogeneity | Age standard deviation/mean age, annual. |
| 21. TMT Education Heterogeneity | where i = (1, N), N is the number of academic qualifications. This paper examines five types of educational background: doctor or above, master’s degree, bachelor’s degree, junior college degree, high school degree or below; represents the percentage of the executive team with a certain degree, annual. |
| 22. TMT Tenure Heterogeneity | Tenure standard deviation/mean tenure, annual. |
| 23. TMT Occupation Heterogeneity | where i = (1, N), N is the number of functional experience categories. This paper examines nine types of career background: production, research and development, design, human resources, management, marketing, finance, finance, and law. represents the percentage of the executive team with experience in a specific function, annual. |
| 24. CEO duality | 1 = CEO is also the chairman of the board; 0 = otherwise, annual. |
| 25. Stakeholder Attention | Stock turnover in that year, annual. |
| 26. Tobin’s Q | Tobin’s Q in that year, annual. |
| 27. Local formal regulation | Entropy-weighted average of number of firms punished for environmental pollution, total revenue of sewage charge fees, number of public complaints completed, and number of laws and regulations, annual. |
| 28. Local informal regulation | Entropy-weighted average of number of environmental protection initiatives submitted by the National People’s Congress, number of environmental protection initiatives submitted by the Chinese People’s Political Consultative Conference, and number of public environmental complaints, annual. |
| 29. Local pollution | Entropy-weighted average of total volume of wastewater discharged, total volume of COD discharged, total volume of ammonia nitrogen discharged, total volume of sulfur dioxide discharged, total volume of soot and dust discharged, and total volume of nitrogen oxide discharged, annual. |
| 30. Local government fiscal power | Log(total provincial government revenue,10), annual. |
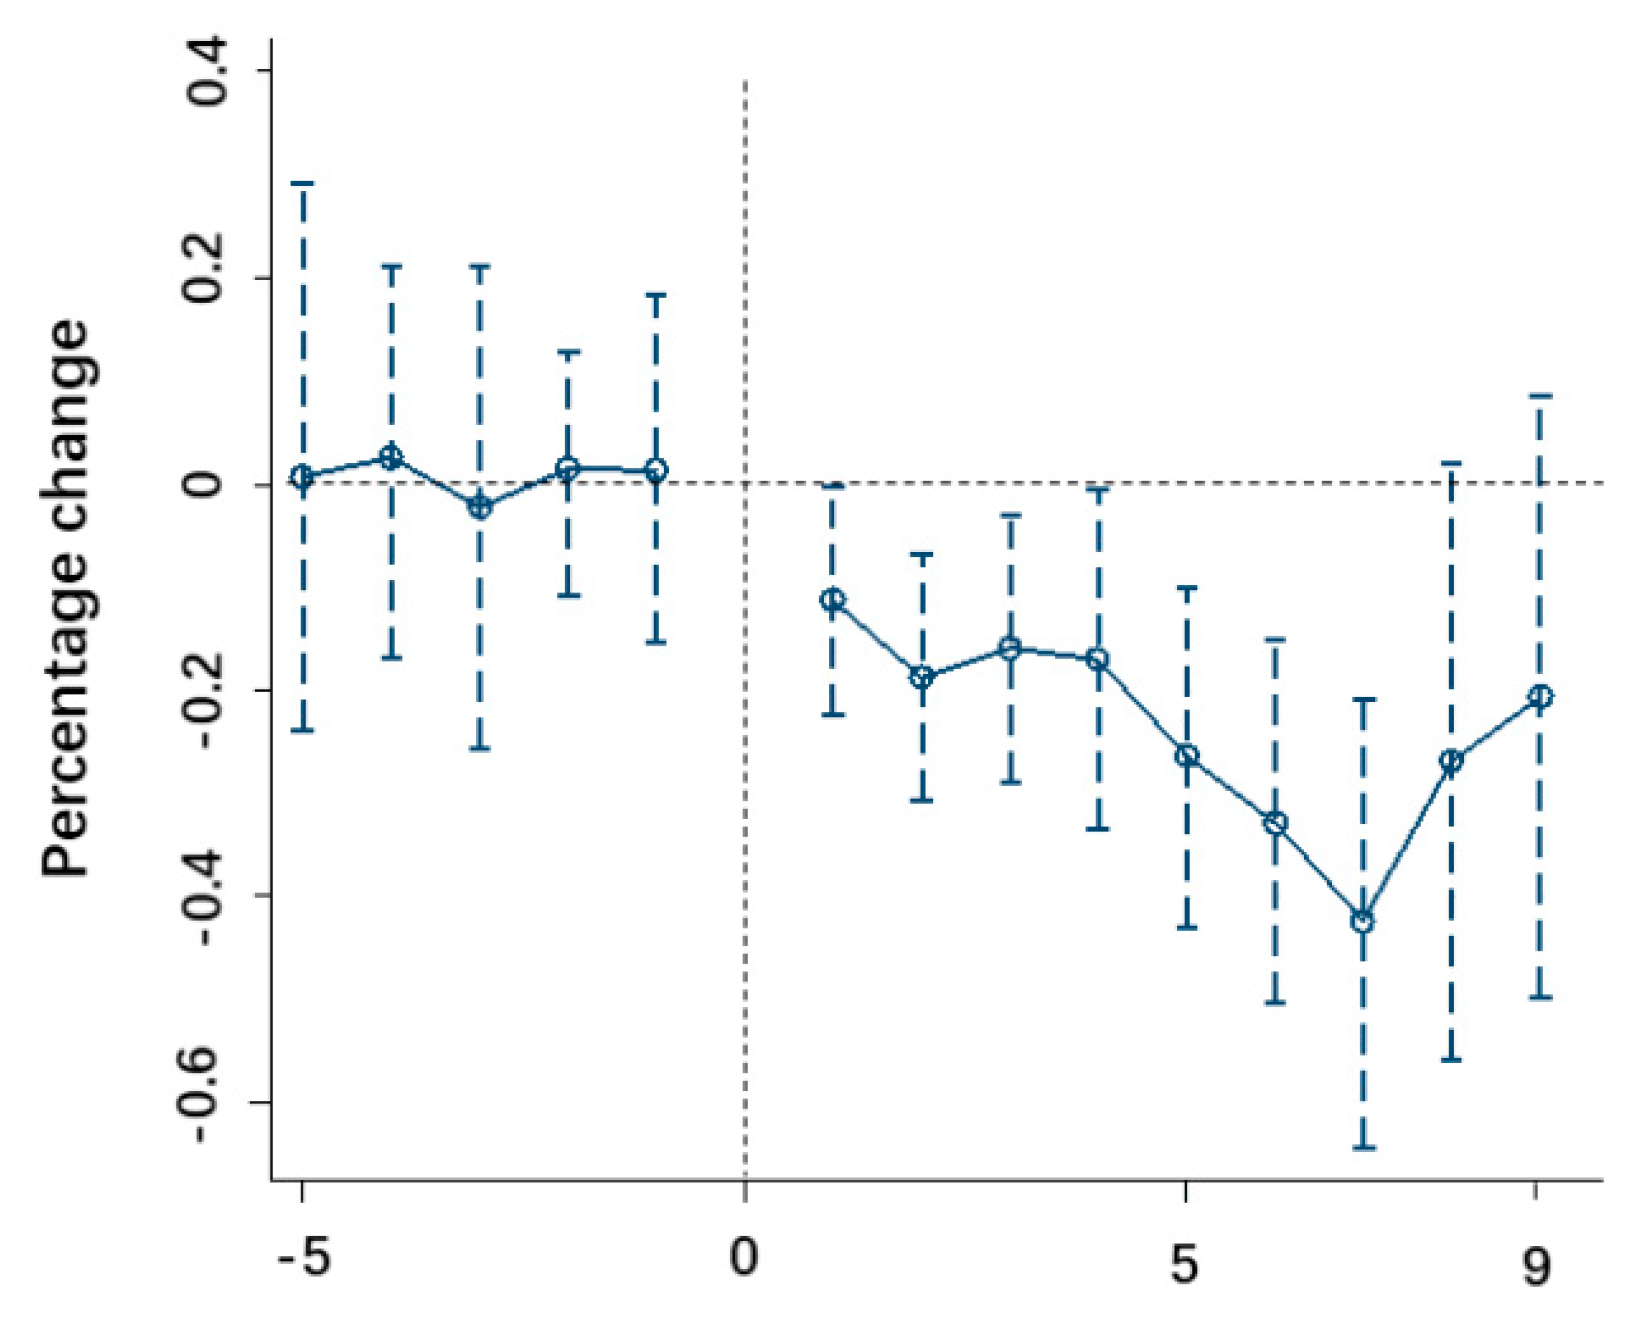
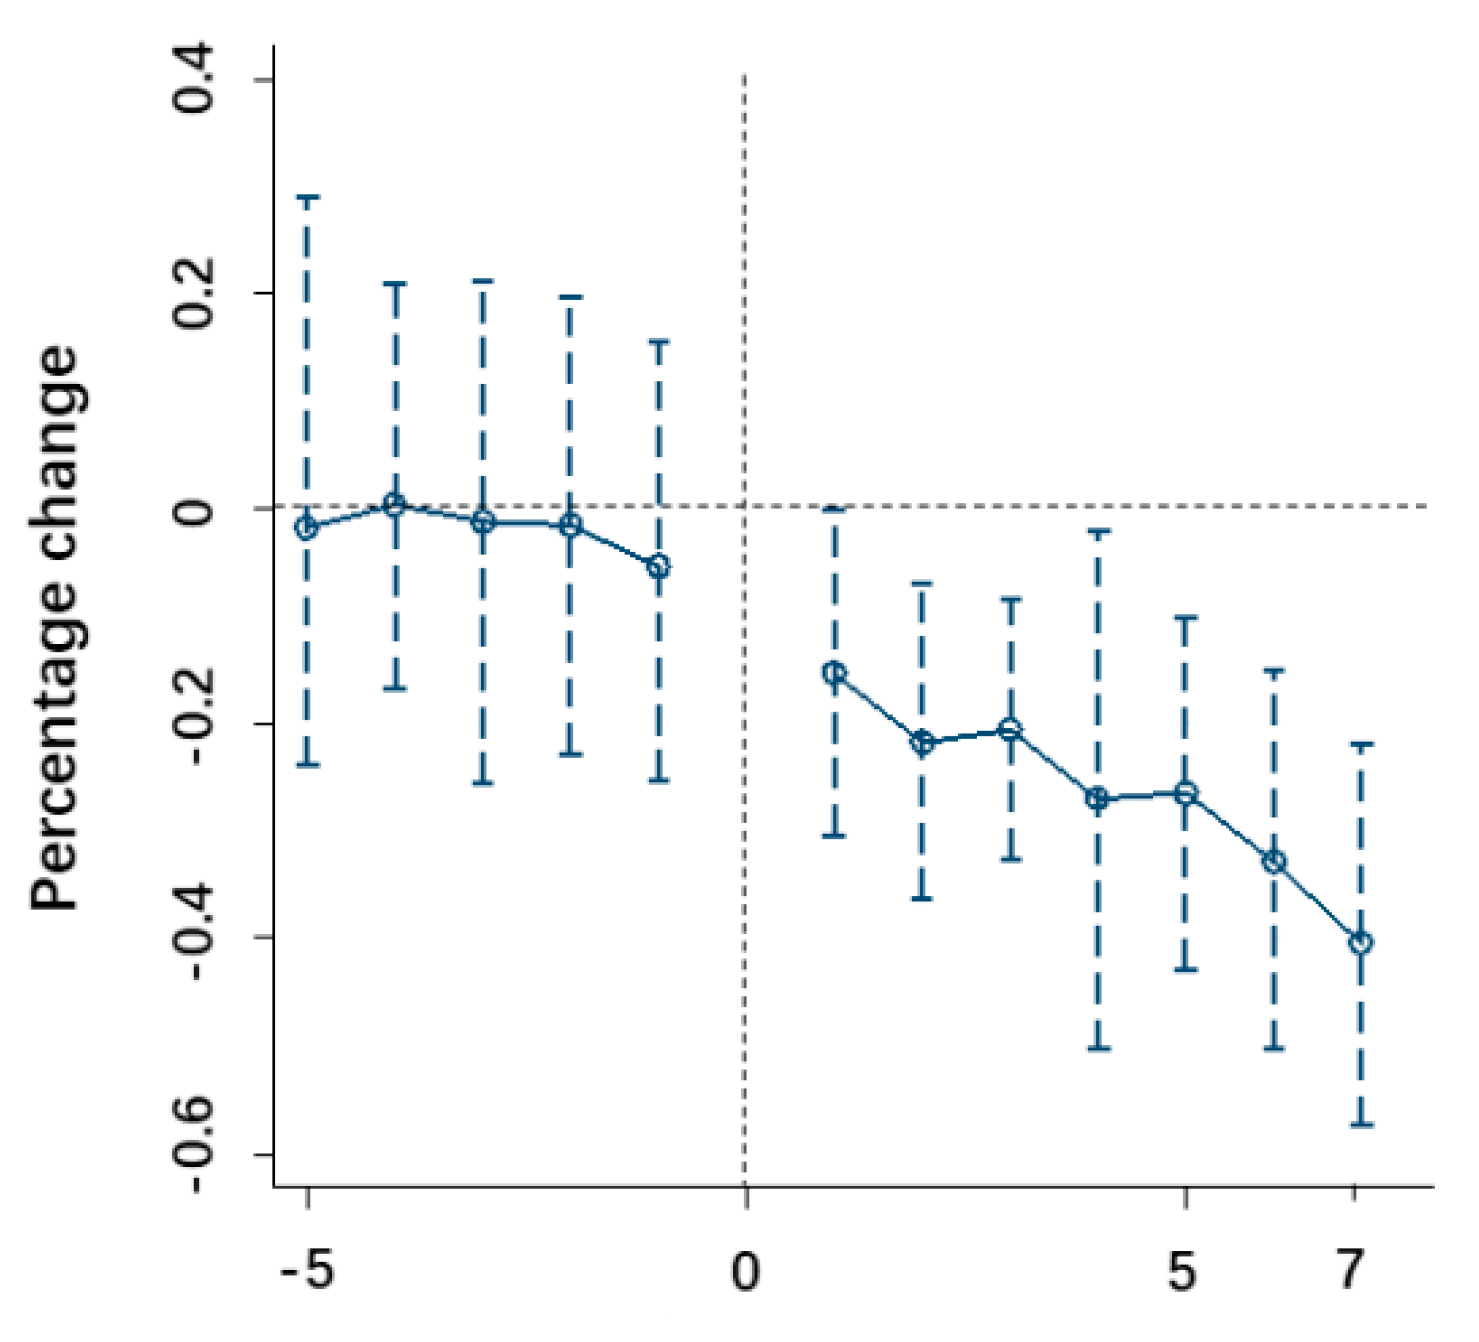
| Coefficient | Coefficient | ||
|---|---|---|---|
| Before5 | 0.002 (0.166) | After3 | 0.179 (0.055) *** |
| Before4 | 0.010 (0.079) | After4 | 0.182 (0.072) ** |
| Before3 | −0.008 (0.159) | After5 | 0.264 (0.074) *** |
| Before2 | 0.006 (0.052) | After6 | 0.328 (0.081) *** |
| Before1 | 0.004 (0.070) | After7 | 0.415 (0.105) *** |
| Current | - | After8 | 0.266 (0.166) |
| After1 | 0.112 (0.053) ** | After9 | 0.201 (0.174) |
| After2 | 0.191 (0.052) *** | ||
| Constant | −0.936 (0.268) *** | ||
| Obs. | 3340 | ||
| R2 | 0.289 | ||
| NO. | Variable | Mean | Std.dev. | 1 | 2 | 3 | 4 | 5 | 6 | 7 | 8 | 9 | 10 | 11 |
|---|---|---|---|---|---|---|---|---|---|---|---|---|---|---|
| 1 | Market value | 0.738 | 5.997 | |||||||||||
| 2 | Polluting label (dummy) | 0.500 | 0.500 | −0.055 ** | ||||||||||
| 3 | Central tie | 0.410 | 0.363 | 0.019 | 0.432 *** | |||||||||
| 4 | Local tie | 0.213 | 0.920 | 0.090 *** | −0.296 *** | −0.653 *** | ||||||||
| 5 | Green innovative capability | 0.353 | 0.307 | −0.049 ** | 0.211 *** | 0.295 *** | −0.179 *** | |||||||
| 6 | Firm age | 1.148 | 0.157 | 0.050 ** | 0.062 ** | −0.086 *** | 0.115 *** | −0.100 *** | ||||||
| 7 | CSR score | 2.47 | 1.664 | −0.03 | 0.113 *** | 0.064 ** | −0.03 | 0.073 ** | −0.056 ** | |||||
| 8 | Malpractice disclosure | 0.095 | 0.223 | −0.027 | 0.315 *** | 0.132 *** | −0.062 ** | 0.044 * | 0.187 *** | 0.012 | ||||
| 9 | Leverage | 0.405 | 0.307 | 0.01 | 0.355 *** | 0.122 *** | −0.073 ** | 0.078 ** | 0.002 | −0.052 ** | 0.132 *** | |||
| 10 | Institutional ownership | 0.208 | 0.219 | −0.008 | 0.070 ** | −0.078 ** | 0.050 ** | −0.006 | 0.069 ** | 0.039 | 0.112 *** | −0.01 | ||
| 11 | CRIO | 0.652 | 0.135 | −0.005 | −0.347 *** | −0.098 *** | 0.02 | −0.042 * | −0.239 *** | 0.159 *** | −0.165 *** | −0.152 *** | 0.144 *** | |
| 12 | Z index | 1.07 | 1.137 | −0.053 ** | 0.226 *** | 0.102 *** | −0.112 *** | 0.03 | 0.017 | −0.003 | 0.082 *** | 0.135 *** | −0.062 ** | −0.097 *** |
| 13 | ROA | 0.044 | 0.069 | 0 | −0.176 *** | −0.080 *** | 0.039 | 0.019 | −0.01 | 0.319 *** | −0.091 *** | −0.355 *** | 0.095 *** | 0.274 *** |
| 14 | Firm size | 9.421 | 0.466 | −0.096 *** | 0.471 *** | 0.191 *** | −0.117 *** | 0.142 *** | −0.067 ** | 0.231 *** | 0.324 *** | 0.442 *** | 0.137 *** | −0.044 * |
| 15 | Report Attention | 0.929 | 0.571 | −0.033 | −0.035 | 0.056 ** | −0.034 | 0.071 ** | −0.119 *** | 0.361 *** | 0.029 | −0.045 * | 0.124 *** | 0.226 *** |
| 16 | Transparency | 2.427 | 1.067 | 0.046 * | −0.203 *** | 0.012 | 0.014 | 0.012 | 0.018 | 0.055 ** | 0.033 | −0.208 *** | −0.027 | 0.108 *** |
| 17 | Environmental subsidies | 2.393 | 2.958 | −0.065 ** | 0.369 *** | 0.075 ** | −0.053 ** | 0.035 | 0.093 *** | −0.032 | 0.196 *** | 0.177 *** | 0.068 ** | −0.150 *** |
| 18 | Development capability | 0.167 | 0.886 | 0.004 | −0.007 | 0.014 | 0.004 | 0.017 | 0.021 | 0.012 | −0.026 | 0.043 * | 0.038 | 0.028 |
| 19 | Organizational slack | 6.744 | 4.433 | 0.015 | −0.144 *** | −0.073 ** | 0.041 * | 0.027 | −0.085 *** | 0.273 *** | −0.109 *** | −0.241 *** | 0.087 *** | 0.241 *** |
| 20 | Prior R&D expenditure | 0.42 | 0.042 | 0.093 *** | −0.389 *** | −0.181 *** | 0.145 *** | −0.125 *** | 0.029 | −0.061 ** | −0.111 *** | −0.266 *** | 0.029 | 0.111 *** |
| 21 | Prior Political tie | 0.13 | 0.095 | −0.015 | 0.168 *** | 0.171 *** | −0.03 | 0.580 *** | −0.028 | 0.074 ** | −0.029 | 0.042 * | −0.084 *** | −0.019 |
| 22 | TMT Age Heterogeneity | 0.178 | 0.045 | 0.056 ** | −0.412 *** | −0.083 *** | 0.087 *** | 0.014 | −0.026 | −0.090 *** | −0.175 *** | −0.209 *** | −0.085 *** | 0.135 *** |
| 23 | TMT Education Heterogeneity | 0.259 | 0.126 | 0.023 | −0.039 | −0.001 | −0.031 | 0.036 | −0.060 ** | 0.022 | 0.022 | −0.059 ** | 0.081 *** | 0.164 *** |
| 24 | TMT Tenure Heterogeneity | 0.388 | 0.284 | 0.036 | 0.192 *** | 0.067 ** | 0.041 * | −0.047 * | 0.291 *** | −0.084 *** | 0.230 *** | 0.176 *** | 0.064 ** | −0.335 *** |
| 25 | TMT Occupation Heterogeneity | 0.476 | 0.117 | 0.006 | 0.073 ** | 0.034 | 0.033 | 0.001 | 0.031 | −0.009 | 0.129 *** | 0.190 *** | −0.016 | −0.085 *** |
| 26 | CEO duality | 0.353 | 0.478 | 0.024 | −0.307 *** | −0.160 *** | 0.109 *** | −0.085 *** | −0.043 * | −0.080 *** | −0.114 *** | −0.140 *** | 0.017 | 0.099 *** |
| 27 | Stakeholder Attention | 4.475 | 4.981 | 0.02 | −0.298 *** | −0.160 *** | 0.028 | −0.081 *** | −0.133 *** | −0.062 ** | −0.136 *** | −0.131 *** | −0.044 * | 0.209 *** |
| 28 | Tobin‘s Q | 2.675 | 2.214 | 0.100 *** | −0.377 *** | −0.217 *** | 0.145 *** | −0.132 *** | 0.127 *** | −0.017 | −0.175 *** | −0.341 *** | 0.090 *** | 0.199 *** |
| 29 | Formal regulation | 4.289 | 0.307 | −0.03 | −0.109 *** | −0.107 *** | 0.095 *** | −0.045 * | 0.015 | −0.065 ** | −0.017 | −0.099 *** | −0.013 | 0.027 |
| 30 | Informal regulation | 3.193 | 0.435 | 0.001 | −0.089 *** | 0.007 | −0.011 | −0.011 | −0.147 *** | 0.052 ** | −0.097 *** | −0.082 *** | −0.158 *** | 0.091 *** |
| 31 | Local pollution | 1.684 | 0.273 | −0.003 | 0.094 *** | 0.060 ** | −0.03 | −0.003 | 0 | −0.019 | −0.016 | −0.059 ** | −0.129 *** | −0.062 ** |
| 32 | Local government fiscal power | 3.532 | 0.312 | 0.067 ** | −0.500 *** | −0.263 *** | 0.219 *** | −0.176 *** | 0.090 *** | −0.067 ** | −0.043 * | −0.124 *** | 0.072 ** | 0.204 *** |
| NO. | Variable | 12 | 13 | 14 | 15 | 16 | 17 | 18 | 19 | 20 | 21 | 22 | ||
| 13 | ROA | — | — | −0.063 ** | ||||||||||
| 14 | Firm size | — | — | 0.250 *** | −0.02 | |||||||||
| 15 | Report Attention | — | — | −0.033 | 0.382 *** | 0.348 *** | ||||||||
| 16 | Transparency | — | — | −0.163 *** | 0.136 *** | −0.203 *** | 0.172 *** | |||||||
| 17 | Environmental subsidies | — | — | 0.071 ** | −0.115 *** | 0.176 *** | −0.049 ** | −0.034 | ||||||
| 18 | Development capability | — | — | −0.036 | 0.097 *** | 0.003 | 0.060 ** | 0.011 | −0.041 * | |||||
| 19 | Organizational slack | — | — | −0.103 *** | 0.600 *** | 0.004 | 0.318 *** | 0.151 *** | −0.080 *** | 0.080 *** | ||||
| 20 | Prior R&D expenditure | — | — | −0.134 *** | 0.091 *** | −0.179 *** | 0.065 ** | 0.197 *** | −0.196 *** | −0.023 | 0.101 *** | |||
| 21 | Prior Political tie | — | — | −0.016 | 0.080 *** | 0.075 ** | 0.073 ** | 0.029 | 0.039 | 0.012 | 0.051 ** | −0.113 *** | ||
| 22 | TMT Age Heterogeneity | — | — | −0.148 *** | 0.078 ** | −0.334 *** | −0.062 ** | 0.121 *** | −0.134 *** | −0.002 | 0.080 *** | 0.101 *** | 0.050 ** | |
| 23 | TMT Education Heterogeneity | — | — | −0.014 | 0.019 | 0.027 | 0.063 ** | 0.219 *** | −0.017 | 0.075 ** | 0.058 ** | 0.114 *** | 0.009 | 0.012 |
| 24 | TMT Tenure Heterogeneity | — | — | 0 | −0.191 *** | 0.208 *** | −0.111 *** | 0.008 | 0.125 *** | −0.015 | −0.157 *** | 0.047 * | −0.060 ** | −0.147 *** |
| 25 | TMT Occupation Heterogeneity | — | — | 0.107 *** | −0.072 ** | 0.172 *** | 0.042 * | 0.028 | 0.065 ** | 0.017 | −0.084 *** | −0.009 | 0.043 * | −0.148 *** |
| 26 | CEO duality | — | — | −0.113 *** | 0.051 ** | −0.205 *** | −0.026 | 0.124 *** | −0.140 *** | 0.002 | 0.063 ** | 0.220 *** | −0.060 ** | 0.132 *** |
| 27 | Stakeholder Attention | — | — | −0.123 *** | 0.069 ** | −0.320 *** | −0.097 *** | −0.023 | −0.074 ** | −0.012 | 0.075 ** | −0.011 | −0.072 ** | 0.203 *** |
| 28 | Tobin‘s Q | — | — | −0.151 *** | 0.300 *** | −0.444 *** | −0.005 | 0.050 ** | −0.135 *** | 0.073 ** | 0.112 *** | 0.240 *** | −0.049 ** | 0.157 *** |
| 29 | Formal regulation | — | — | −0.111 *** | 0.042 * | −0.130 *** | 0.018 | 0.117 *** | 0.034 | −0.027 | 0.027 | 0.002 | −0.037 | 0.031 |
| 30 | Informal regulation | — | — | −0.080 *** | 0.050 ** | −0.163 *** | 0.093 *** | 0.165 *** | −0.033 | −0.003 | 0.064 ** | −0.038 | 0.022 | 0.042 * |
| 31 | Local pollution | — | — | −0.050 ** | −0.022 | −0.104 *** | −0.044 * | 0.125 *** | 0.085 *** | −0.021 | −0.036 | −0.062 ** | 0.003 | −0.035 |
| 32 | Local government fiscal power | — | — | −0.183 *** | 0.084 *** | −0.151 *** | 0.026 | 0.184 *** | −0.081 *** | 0.004 | 0.116 *** | 0.271 *** | −0.145 *** | 0.152 *** |
| NO. | Variable | 23 | 24 | 25 | 26 | 27 | 28 | 29 | 30 | 31 | ||||
| 24 | TMT Tenure Heterogeneity | — | — | −0.110 *** | ||||||||||
| 25 | TMT Occupation Heterogeneity | — | — | 0.029 | 0.172 *** | |||||||||
| 26 | CEO duality | — | — | 0.041 * | −0.049 ** | −0.080 *** | ||||||||
| 27 | Stakeholder Attention | — | — | 0.076 ** | −0.398 *** | −0.175 *** | 0.112 *** | |||||||
| 28 | Tobin’s Q | — | — | 0 | −0.120 *** | −0.067 ** | 0.123 *** | 0.267 *** | ||||||
| 29 | Formal regulation | — | — | 0.025 | −0.102 *** | −0.044 * | 0.074 ** | 0.087 *** | 0.018 | |||||
| 30 | Informal regulation | — | — | 0.058 ** | −0.323 *** | −0.051 ** | 0.072 ** | 0.219 *** | 0.076 ** | 0.551 *** | ||||
| 31 | Local pollution | — | — | 0.035 | −0.070 ** | −0.091 *** | 0.031 | 0.016 | −0.088 *** | 0.754 *** | 0.570 *** | |||
| 32 | Local government fiscal power | — | — | 0.101 *** | 0.084 *** | 0.022 | 0.229 *** | 0.068 ** | 0.170 *** | 0.537 *** | 0.240 *** | 0.267 *** |
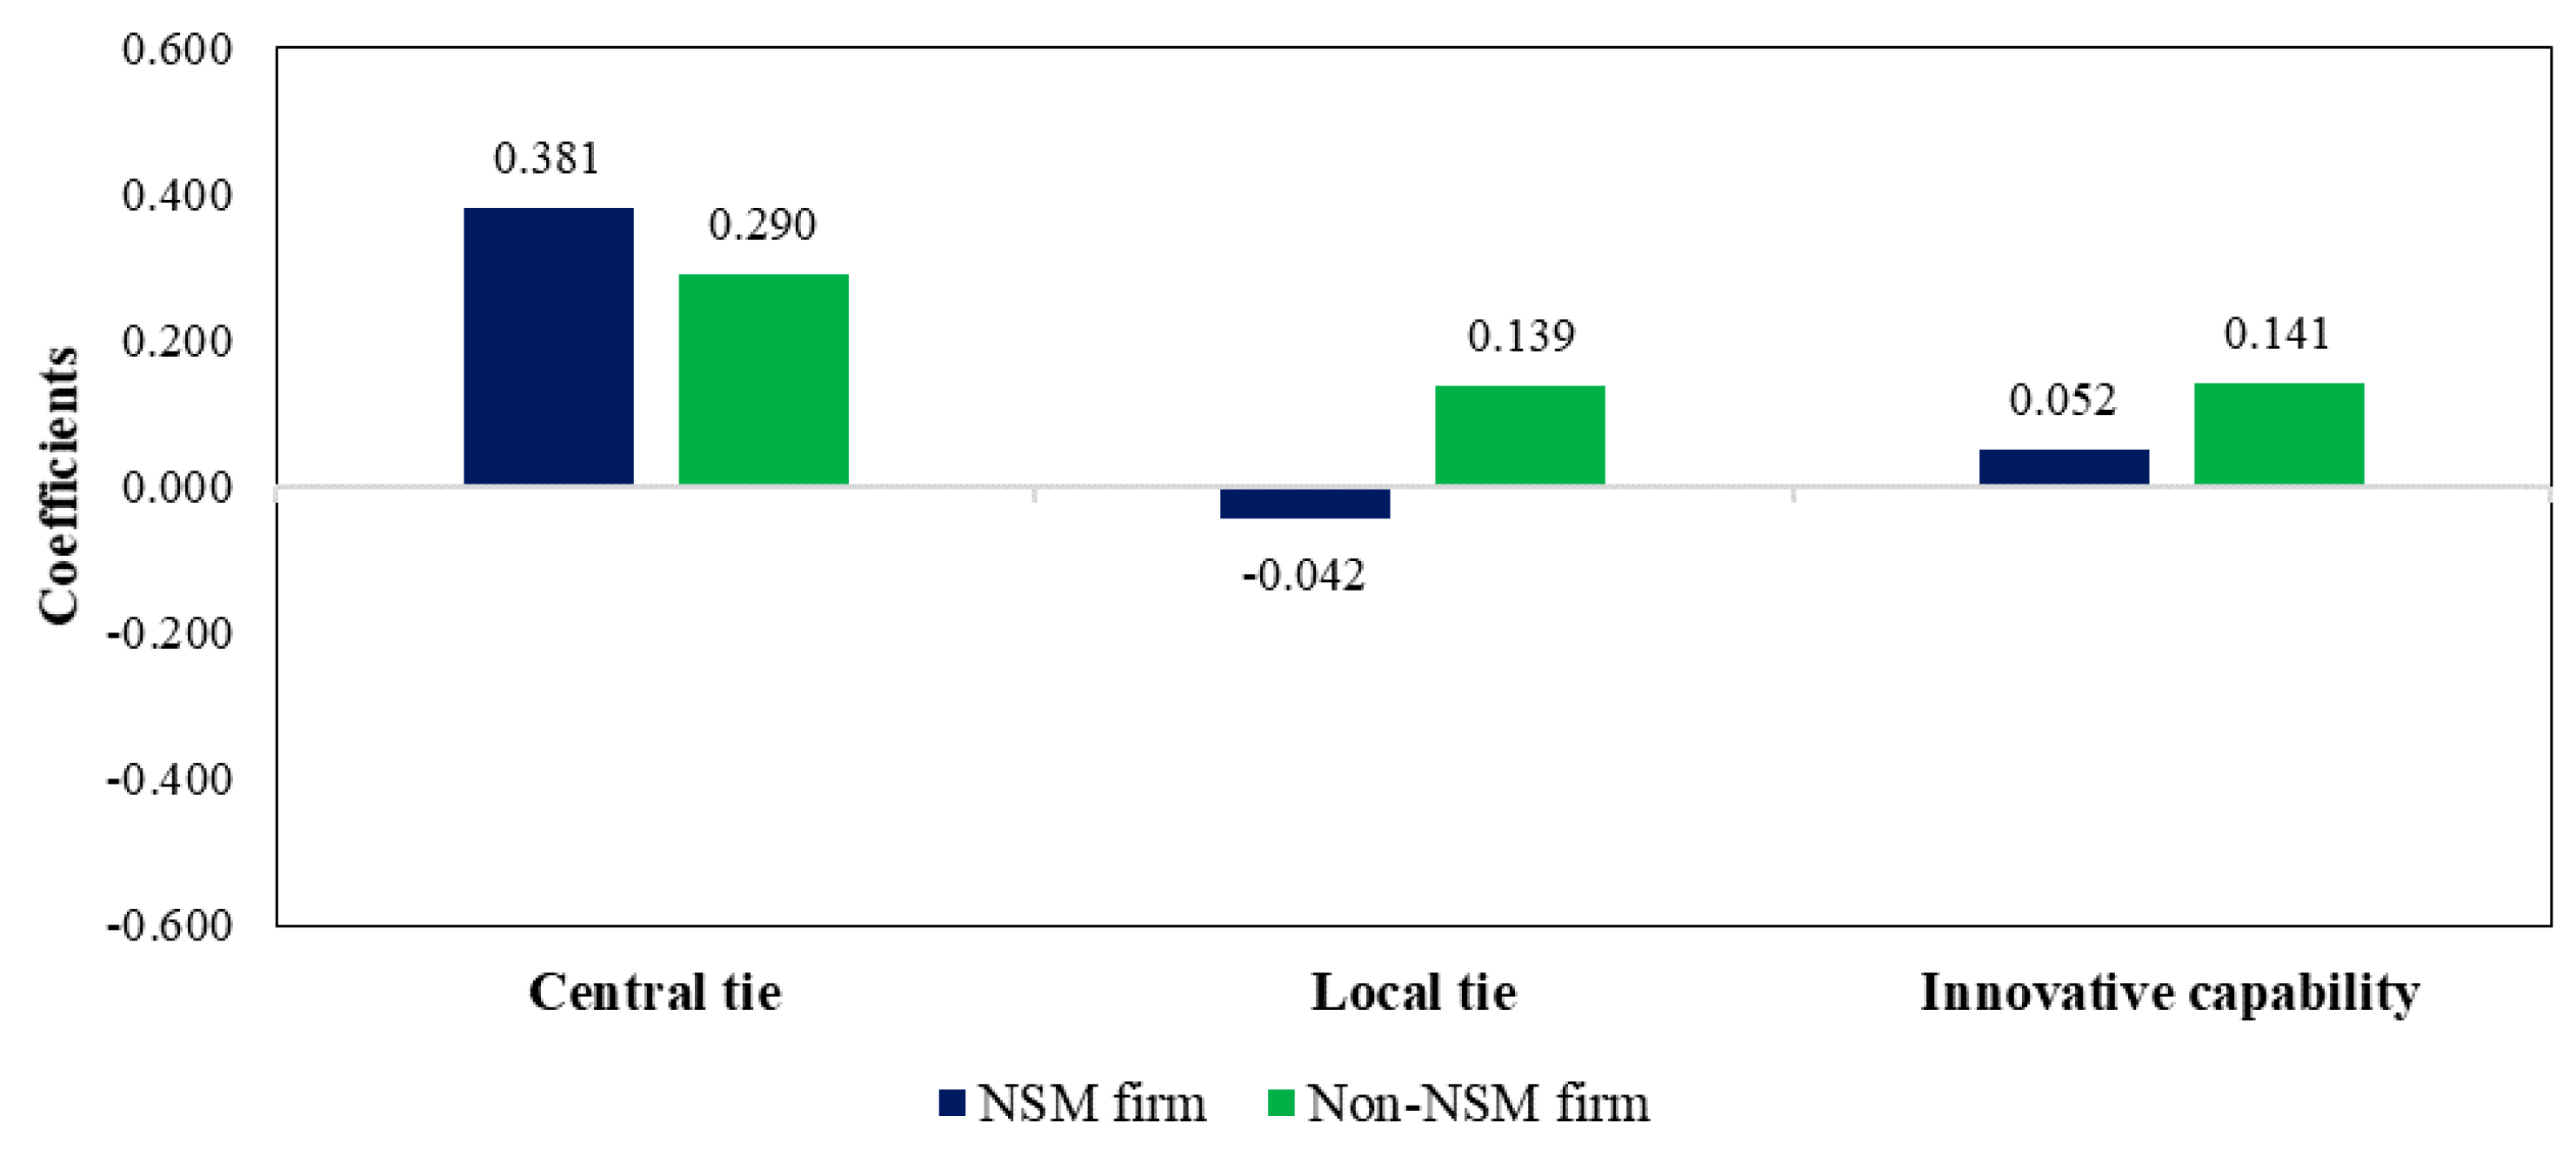
| Variables | Model 1 | Model 2 | Model 3 | Model 4 | Model 5 |
|---|---|---|---|---|---|
| Intercept | 0.046 (0.016) ** | 0.043 (0.016) ** | 0.046 (0.016) ** | 0.047 (0.016) ** | 0.038 (0.016) ** |
| Central tie | 0.422 (0.060) *** | 0.439 (0.064) *** | 0.411 (0.060) *** | 0.424 (0.060) *** | 0.461 (0.081) *** |
| Local tie | −0.065 (0.003) *** | −0.057 (0.003) *** | −0.076 (0.003) *** | −0.062 (0.003) *** | −0.070 (0.004) *** |
| Green innovative capability | 0.421 (0.032) *** | 0.425 (0.034) *** | 0.442 (0.034) *** | 0.438 (0.032) *** | 0.405 (0.045) *** |
| Central tie × Local tie | 0.307 (0.061) *** | 0.297(0.052) *** | |||
| Green innovative capability × Local tie | 0.121 (0.077) * | 0.112 (0.067) * | |||
| Central tie × Green innovative capability | −0.284 (0.125) ** | −0.326 (0.138) ** | |||
| Type of actual controller (dummy) | Included | Included | Included | Included | Included |
| Year (dummy) | Included | Included | Included | Included | Included |
| Model F-value | 16.52 *** | 15.38 *** | 13.20 *** | 14.20 *** | 10.07 *** |
| R2 | 0.235 | 0.254 | 0.235 | 0.244 | 0.278 |
| Adjusted R2 | 0.226 | 0.243 | 0.225 | 0.234 | 0.262 |
| Variables | Model 1 | Model 2 | Model 3 | Model 4 | Model 5 |
|---|---|---|---|---|---|
| Intercept | 0.087 (0.022) *** | 0.088 (0.022) *** | 0.085 (0.022) *** | 0.087 (0.022) *** | 0.081 (0.023) *** |
| Central tie | 0.213 (0.065) *** | 0.221 (0.064) *** | 0.218 (0.065) *** | 0.214 (0.064) *** | 0.244 (0.074) *** |
| Local tie | −0.098 (0.051) * | −0.097 (0.051) * | −0.116 (0.052) * | −0.098 (0.051) * | −0.102 (0.052) * |
| Green innovative capability | 0.144 (0.035) *** | 0.147 (0.039) *** | 0.145 (0.033) *** | 0.171 (0.051) *** | 0.153 (0.033) *** |
| Central tie × Local tie | 0.222 (0.088) ** | 0.176 (0.071) ** | |||
| Green innovative capability × Local tie | 0.196 (0.074) ** | 0.198 (0.088) ** | |||
| Central tie × Green innovative capability | −0.299 (0.053) *** | −0.260 (0.043) *** | |||
| Type of actual controller (dummy) | Included | Included | Included | Included | Included |
| Year (dummy) | Included | Included | Included | Included | Included |
| Model F-value | 18.70 *** | 18.88 *** | 18.12 *** | 12.14 *** | 12.44 *** |
| R2 | 0.341 | 0.334 | 0.331 | 0.345 | 0.369 |
| Adjusted R2 | 0.331 | 0.323 | 0.322 | 0.335 | 0.362 |
Disclaimer/Publisher’s Note: The statements, opinions and data contained in all publications are solely those of the individual author(s) and contributor(s) and not of MDPI and/or the editor(s). MDPI and/or the editor(s) disclaim responsibility for any injury to people or property resulting from any ideas, methods, instructions or products referred to in the content. |
© 2023 by the authors. Licensee MDPI, Basel, Switzerland. This article is an open access article distributed under the terms and conditions of the Creative Commons Attribution (CC BY) license (https://creativecommons.org/licenses/by/4.0/).
Share and Cite
Lu, L.; Wang, M.; Xu, J. How to Keep Investors’ Confidence after Being Labeled as Polluting Firms: The Role of External Political Ties and Internal Green Innovation Capabilities. Sustainability 2023, 15, 13167. https://doi.org/10.3390/su151713167
Lu L, Wang M, Xu J. How to Keep Investors’ Confidence after Being Labeled as Polluting Firms: The Role of External Political Ties and Internal Green Innovation Capabilities. Sustainability. 2023; 15(17):13167. https://doi.org/10.3390/su151713167
Chicago/Turabian StyleLu, Liangdong, Mengyao Wang, and Jia Xu. 2023. "How to Keep Investors’ Confidence after Being Labeled as Polluting Firms: The Role of External Political Ties and Internal Green Innovation Capabilities" Sustainability 15, no. 17: 13167. https://doi.org/10.3390/su151713167
APA StyleLu, L., Wang, M., & Xu, J. (2023). How to Keep Investors’ Confidence after Being Labeled as Polluting Firms: The Role of External Political Ties and Internal Green Innovation Capabilities. Sustainability, 15(17), 13167. https://doi.org/10.3390/su151713167