1. Introduction
In recent decades, with the continuous development of the economy, the urban motor vehicle traffic volume has increased dramatically, which not only brings about the increase in the load of the urban road system, leading to traffic congestion, but also causes problems such as insufficient parking spaces and difficult parking. This has caused the phenomena of disorderly parking and illegal parking of motor vehicles, which have a serious negative impact on dynamic traffic [
1]. Therefore, it is particularly important to study the reasonable relationship between urban parking supply and demand, and actively seek solutions to resolve urban parking issues [
2]. Among these, accurate prediction of parking demand plays a crucial role [
3].
The parking generation rate model is commonly used in parking demand forecasting to estimate the number of parking spaces needed based on various factors. This model establishes a relationship between the intensity of land uses or activities (such as commercial, residential, or industrial) and the demand for parking spaces.
Accurate predictions of the parking generating rate can contribute significantly to urban planning and management in several ways [
4]:
Efficient parking infrastructure: Urban planning authorities and developers can use accurate predictions to determine the appropriate number and distribution of parking spaces in new development projects. Matching the parking supply with the actual parking demand helps avoid oversupply or undersupply of parking, optimizing land use and reducing the costs of constructing unnecessary parking facilities.
Traffic management: Accurate parking predictions enable effective traffic management strategies. These predictions help identify areas with high parking demand and congestion, allowing transportation planners to implement measures such as parking restrictions or pricing mechanisms to discourage private vehicle use and promote alternative modes of transportation. This, in turn, can help reduce traffic congestion and improve overall traffic flow.
Impact assessments: Accurate parking predictions can be used in impact assessments for proposed developments or changes in land use. They allow planners to assess the potential parking demand and evaluate the impact on neighboring areas. This information enables informed decision making and helps mitigate potential negative consequences, such as the burden on existing parking facilities or increased traffic congestion.
Sustainable mobility planning: Accurate parking predictions support the development of sustainable mobility plans. By understanding the parking demand patterns and the factors influencing them, urban planners can prioritize investments in public transportation, walking, and cycling infrastructure. This promotes a shift towards sustainable modes of transport, reduces reliance on private vehicles, and contributes to a more environmentally friendly and livable city.
Revenue generation: Accurate parking predictions can help optimize parking pricing strategies and generate revenue for urban authorities. By understanding the demand patterns and adjusting prices based on peak hours or high-demand areas, cities can ensure a fair and efficient use of parking spaces while generating income that can be reinvested in urban development and transportation projects.
Overall, accurate predictions of the parking generating rate allow for better planning and management of parking infrastructure, traffic flow, and sustainable mobility in cities. Accurate predictions help optimize resource allocation, reduce congestion, promote alternative transportation modes, and contribute to the overall livability and efficiency of urban areas.
The process typically involves collecting data on land use characteristics, such as the development type, size, and function, as well as relevant trip generation rates. These rates indicate the number of trips generated by a specific land use type. The parking generation rate is then applied to estimate the parking demand based on the generated trips.
The parking generation rate model may also consider additional factors such as the time of day, day of the week, and specific events that affect parking demand. It is important to note that parking generation rates can vary based on local factors and context, so the model should be calibrated to the specific area or region of interest.
By applying the parking generation rate model, planners and researchers can estimate the parking demand for different land uses and support decision making regarding parking infrastructure and management strategies.
At present, parking demand forecasting models mainly include the parking generation rate model, land use analysis model [
5], land use and traffic impact analysis model, travel attraction model, regression analysis prediction model, and parking generating rate model [
6,
7].
Among the above models, the parking generating rate model is more common. The parking generating rate is defined as the parking attraction generated by a certain land use unit index. The basic idea of the model is to replace the classified survey statistics with the collection of partition data within the scope of the survey in the process of data collection. In the process of data analysis, the model algorithm is used to determine the parking generating rate of different land uses.
The advantage of this model is that the calculation of parking demand can be based on the combination of large samples having a similar nature and scale, and relatively independent proportion of land use function in the study area, which not only reduces the difficulty of investigation, but also improves the utilization rate of typical data. For the research area, not only can the total parking demand be obtained, but the parking generation of each land use can also be calculated according to the proportion of land use function [
8].
The disadvantage of this model is that, in the actual use process, because the change rule of the parking generating rate in future years cannot be determined, the current parking generating rate or the parking generating rate corrected according to experience can only be used as the incidence rate parameter in the future years [
9]. Obviously, the development of the city leads to changes in the economic level and people’s ideas, and these factors affect the parking attraction on the unit land index, that is, the parking generating rate. Therefore, it is unscientific to use the current parameters to predict the next year.
This article utilizes the sparrow search algorithm to optimize the hyperparameters of generalized neural networks, reducing the influence of human factors in the model construction process. The article proposes a grey correlation analysis and SSA-GRNN model for predicting parking generation rates and adjusting the initial weights and thresholds of the network. Because fewer iterations are required to meet the error requirements, the network convergence speed is accelerated, resulting in higher prediction accuracy. This can provide a reference for predicting urban parking generation rates for electricity.
The remaining sections of this paper are organized as follows:
Section 2 provides a literature review of existing research, highlighting the shortcomings of previous studies and laying the foundation for this paper’s research.
Section 3 introduces the methods, theories, and evaluation metrics applied in this paper, and presents the proposed prediction model.
Section 4 demonstrates the feasibility of the proposed prediction model through empirical experiments. Finally,
Section 5 concludes the paper by providing a summary of the entire study.
2. Literature Review
2.1. Influencing Factors of Parking Generating Rate
The development of parking facilities is a crucial element within modern urban transportation. With the rapid growth in the economy and the subsequent increase in urban car ownership, alongside the emergence of a substantial number of private vehicles, the issue of parking has become increasingly severe, especially in large cities. It is imperative to conduct comprehensive and effective planning to address this pressing matter. Accurately and comprehensively predicting parking demand serves as a fundamental prerequisite for urban parking facility planning.
Yang [
10] used an unbiased data-driven approach to examine the impact of built environment factors (including building density, population density, commercialization rate, etc.) on shared transportation travel.
Research reports from scholars have highlighted the significant impact of five factors on the occurrence of urban static traffic: urban vehicle quantity, urban scale, urban economic index, land use development index, and regional spatial structure have a significant impact on the incidence of urban static traffic [
11].
- (1)
Urban vehicle quantity
The number of urban motor vehicles is the most important factor affecting parking demand. From a static point of view, the increase in motor vehicle ownership directly leads to the increase in parking demand.
- (2)
City size
City size is an important indicator affecting the parking generation rate and is commonly characterized by parameters such as urban population and urban land area. With the growth in the city center area and the increase in the number of jobs, traffic intensity will increase sharply. The population status is a direct reflection of the size of the city. The change in the total population of the city leads to changes in consumption and transportation, the traffic attraction in the city center, and the parking demand.
- (3)
Urban economical index [
12]
The level of urban economic development has a significant impact on the city’s traffic. The level of social and economic development determines the degree of people’s demand for transportation and facilities, and the frequency of traffic travel, which are closely related to parking demand. Judging from the development of many cities in China in recent years, the higher the level of economic development, the greater the number of motor vehicles, the greater the demand for parking facilities, and the greater the urgency to solve parking problems.
- (4)
Land use development index [
13]
Land use development indicators mainly include plot ratio, building density, building layers, and green space rate [
11]. The plot ratio mainly reflects the intensity of land use, which refers to the ratio of building area to land area in a piece of urban development land. The greater the land use intensity, the higher the plot ratio, and the greater the possibility of parking demand. Therefore, the land use index affects the change in parking generating rate.
- (5)
Spatial structure of the region
Different areas of space have different characteristics in parking demand. For example, the central business district is different from the peripheral area of the city. Even if other indicators are the same, if the parking lot is located in different areas, there will be different static traffic rates. The commercial, service, and office business land in the core area of the city is highly concentrated, and the traffic activities are the most frequent. The parking characteristics are characterized by large demand, a high parking space utilization rate, and a high turnover rate.
2.2. Parking Demand Forecasting Model
Regarding the parking demand forecasting model, AL-SAHILI [
14] studied the peak hours of typical working days, and a simple and common regression analysis method was used to establish a land use model to predict parking demand. HS [
15] used the gravity model to predict the parking demand in urban peak hours based on land use and employment data. EI [
16] studied the problem from two different perspectives, average idle time and berth occupancy rate, and it was found that the Weibull function model can better predict the parking demand every 30 min in the future. Based on the method of the parking generation rate, Xue [
17] considered the sharing of parking resources and shared parking spaces between different land types, and established a shared parking space prediction model.
Through a parking demand survey, Qin [
8] analyzed the parking demand characteristics of typical mixed land in Beijing Trade Center, and established a parking demand superposition model and a parking demand sharing model based on a single purpose. Chen [
18] summarized the regression analysis and type analysis, established the static traffic incidence model, and used the model algorithm to determine the static traffic incidence of different land use areas. Wu [
19] considered the influence factors of price and parking service level on parking demand, and predicted parking demand. Based on the incidence model, a parking demand supply prediction model was established.
However, due to the large number of influencing factors, the interaction between them is complex, and no quantitative model has been studied to determine their future changes. In order to solve the above problems, this paper takes the parking generating rate as the research object. The SSA is used to optimize the GRNN model to study the change in the parking generating rate with the related factors, thereby addressing the grey and complex problems, which has certain practical value and feasibility.
3. Theories and Methods
3.1. Index Screening Based on Grey Correlation Analysis
Grey correlation analysis is a method used to measure the correlation between factors according to the development trend of factors [
8]. In order to more comprehensively analyze the related factors affecting the parking generating rate, this paper selects as many sample factors as possible. The parking generating rate data are used as the reference sequence
. The data of all parking generating rate influencing factors are selected as the comparison sequence
. The grey correlation degree between the reference sequence and the comparison sequence is calculated according to the following steps:
Procedure (1) Data dimensionless.
In the formula, is the value of the th influencing factor and is the initial value of the th influencing factor.
Procedure (2) Calculating grey correlation coefficient.
In the formula, is the resolution coefficient and the value range is (0, 1), where 0.5 is generally taken.
Procedure (3) Calculating the grey correlation degree.
Among these, the greater the correlation factor
, the closer the relationship with parking generation rate
, and vice versa. Based on this, the primary and secondary factors affecting static traffic occurrence rate can be judged [
19], so as to screen out the main related factors.
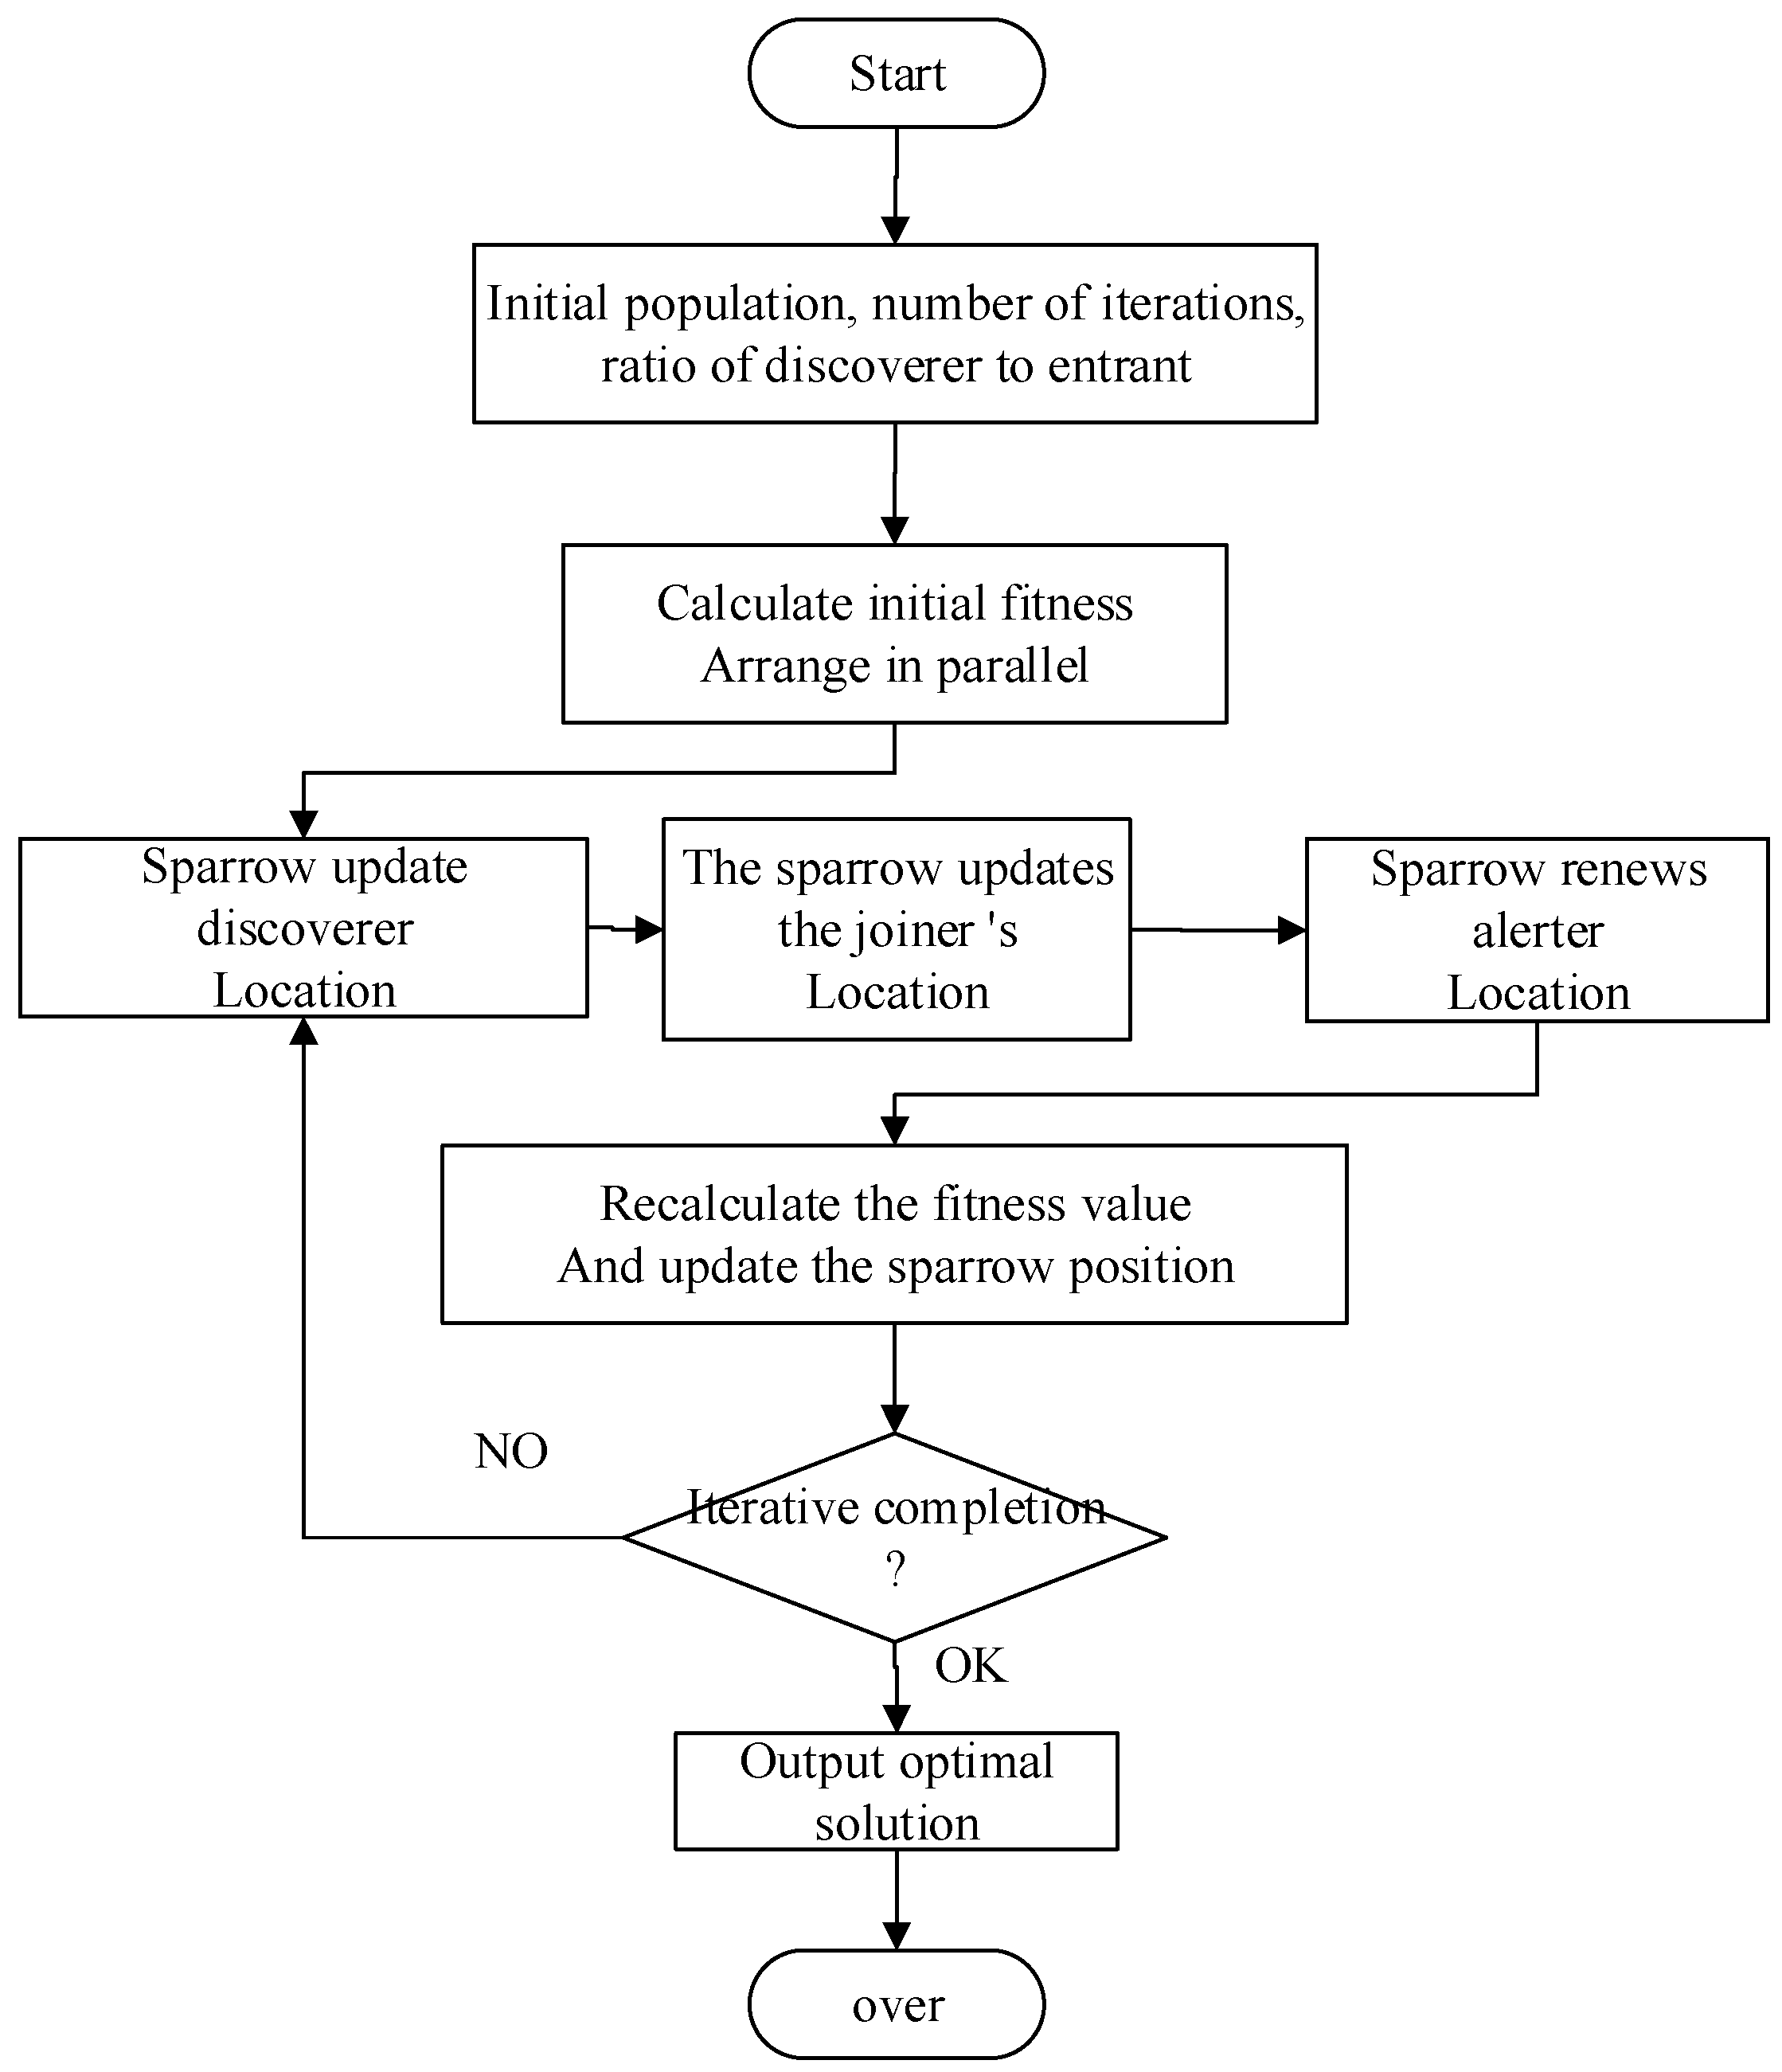
3.2. Sparrow Search Algorithm (SSA) [20]
The SSA is inspired by the foraging behavior and anti-hunting behavior of sparrows. It adds a reconnaissance search mechanism. The process of simulating sparrows to find things is the process of optimization. The population composed of
sparrows is represented as follows:
In the formula, is the dimension of the variables to be optimized.
The fitness values of all sparrows are expressed as follows:
In the formula, is the dimension of the variables to be optimized.
The location of the discoverer is updated as follows:
In the formula, is the current number of iterations; is the maximum number of iterations; is a random number distributed in the interval (0,1); ; and T are warning value and safety value, respectively, ; is a random number obeying a normal distribution; is a matrix, and each element in the matrix is 1. indicates that there is no predator around the population, and the discoverer can perform an extensive search; when , some sparrows in the population have found predators and need to move to a safe place.
The location of the participant is updated as follows:
In the formula, is the global worst position of the sparrow individual in the th iteration of the population; is the local optimal position of the sparrow individual in the iteration; is a matrix, where each element is randomly assigned 1 or −1, and . When , the th sparrow does not get anything and needs to fly elsewhere to forage.
The location of the alerter is updated as follows:
In the formula, is the global optimal position of the current sparrow population; is a random number that obeys the normal distribution with a mean value of 0 and a variance of 1, and is a step control parameter; is a minimal constant; is a random number indicating the direction of motion of the sparrow; are the fitness values of the current individual i, and the optimal and worst fitness values of the current sparrow population, respectively. When , the sparrow is at the edge of the population and vulnerable to attack; when , the sparrow is in the middle of the population and is aware of the danger. It is necessary to move closer to the position of other sparrows to reduce the risk of being attacked by predators.
The specific structural process of SSA is shown in
Figure 1.
3.3. GRNN Model
GRNN has the advantages of strong nonlinear mapping ability, simple structure, and single parameter setting. The structure of GRNN is shown in
Figure 2. It consists of four layers: input layer, mode layer, summation layer, and output layer.
The GRNN algorithm steps are as follows:
- (1)
The input layer is used to receive the input vector, and the number of nodes is equal to the dimension of the input vector in the learning sample.
- (2)
The number of mode layer nodes is equal to the number of input layer nodes. The activation function on the node often uses the Gaussian function as follows:
In the formula,
X is the network input vector;
is the output on the node of the
th mode layer;
is the vector on the node of the
th mode layer;
is a smoothing factor;
is the number of training samples.
- (3)
The number of nodes in the summation layer is more than the dimension of the output vector. There are two kinds of functions,
and
, in the summation layer:
In the formula,
is the number of nodes in the pattern layer;
is the dimension of the output vector; and
is the
th value of the real result vector in the
th training sample.
- (4)
The number of nodes in the output layer is equal to k, and the output result is:
In the formula,
is the output of the
th node in the output layer, that is, the prediction result.
3.4. Model Solving Steps
Procedure 1: Data standardization processing and division. The parking generating rate and its associated data are mapped to the interval [0, 1] to remove the limitation of data units and accelerate the convergence speed and prediction accuracy of the neural network. The standardized formula is shown in Equation (13).
In the formula, is the maximum value of the sample data, is the minimum value of the sample data, is the range.
Procedure 2: Calculating the grey correlation degree. The closer the factors with greater correlation to the development direction and the parking generating rate, the closer the relationship, and vice versa. Based on this, the primary and secondary factors affecting parking generating rate can be judged, so as to screen out the main related factors.
Procedure 3: Determining the structure of the combined model. The training samples are input into the SSA-GRNN model to train the model and find the optimal smoothing factor. The smoothing factor is substituted into the GRNN prediction model to obtain the optimal GRNN model, and the test samples are substituted into the model for probability prediction.
Procedure 4: Evaluation of model indicators. The effect of the model is quantitatively evaluated and indicators are selected, and the model to achieve the desired effect is finally obtained.
The SSA-GRNN parking generating rate prediction model based on grey correlation analysis is shown in
Figure 3.
3.5. Model Evaluation Index
When the model training is completed, the model needs to be evaluated using the data. Determining how to quantitatively evaluate and select the effect of the model, and finally obtain the optimal model to achieve the desired effect, is also one of the key issues of deep learning. When comparing the ability of different models, different performance measurement methods often lead to different evaluation results. In order to better analyze the experimental results, the mean absolute error (
MAE), mean square error (
MSE), root mean square error (
RMSE), and coefficient of determination (
R2) are used as the performance indicators of the experiment, as shown in (14)–(17).
In the formula, represents the actual parking generating rate, represents the predicted parking generating rate, and represents the number of predicted samples. The larger the MAPE, RMSE, and MAE values, the greater the model error; the value range of R2 is [0, 1]. Generally speaking, the larger the value of R2, the better the model fitting effect.
5. Conclusions
The parking generating rate is affected by many factors. Based on the grey correlation analysis, this paper discusses the relationship between various factors and the parking generating rate. Based on the grey correlation analysis and SSA-GRNN model, the parking generating rate is predicted, the selection of network input variables is optimized, and the initial weights and thresholds of the network are corrected. When the error requirement is met, the number of iterations is less, the network convergence is accelerated, and the prediction accuracy is higher. This model can thus provide a reference for predicting the parking generating rate in cities.
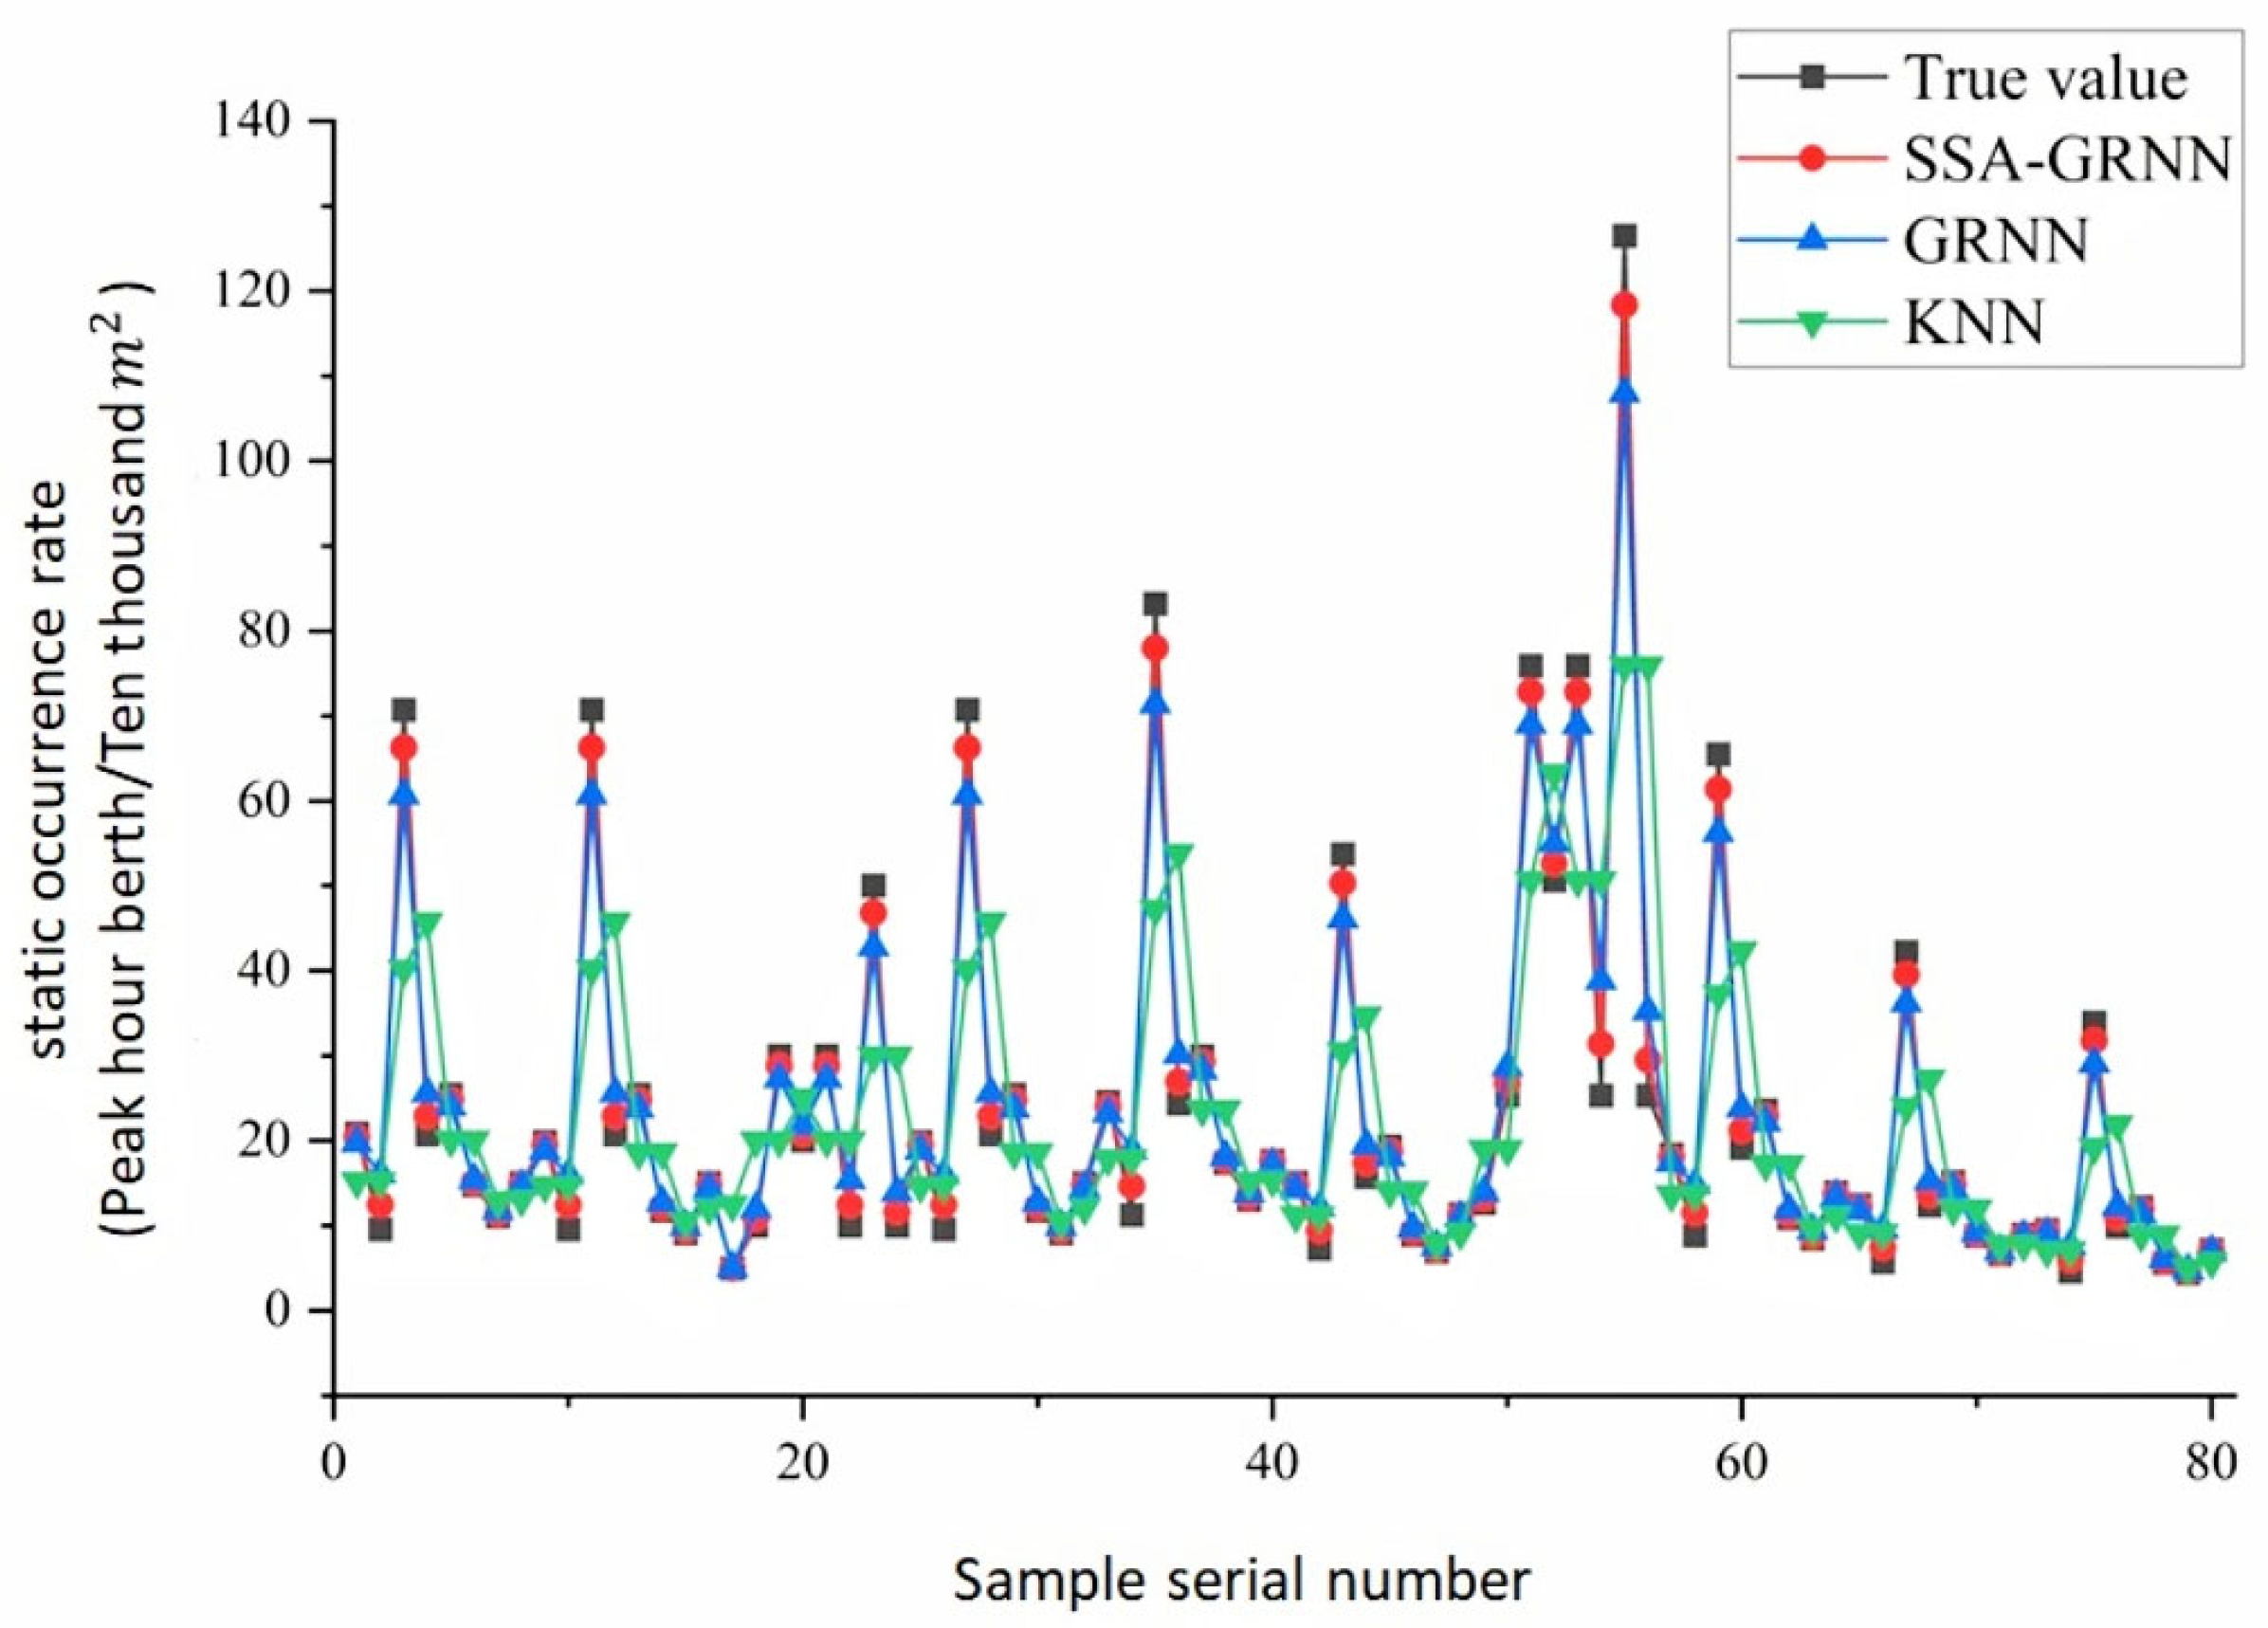
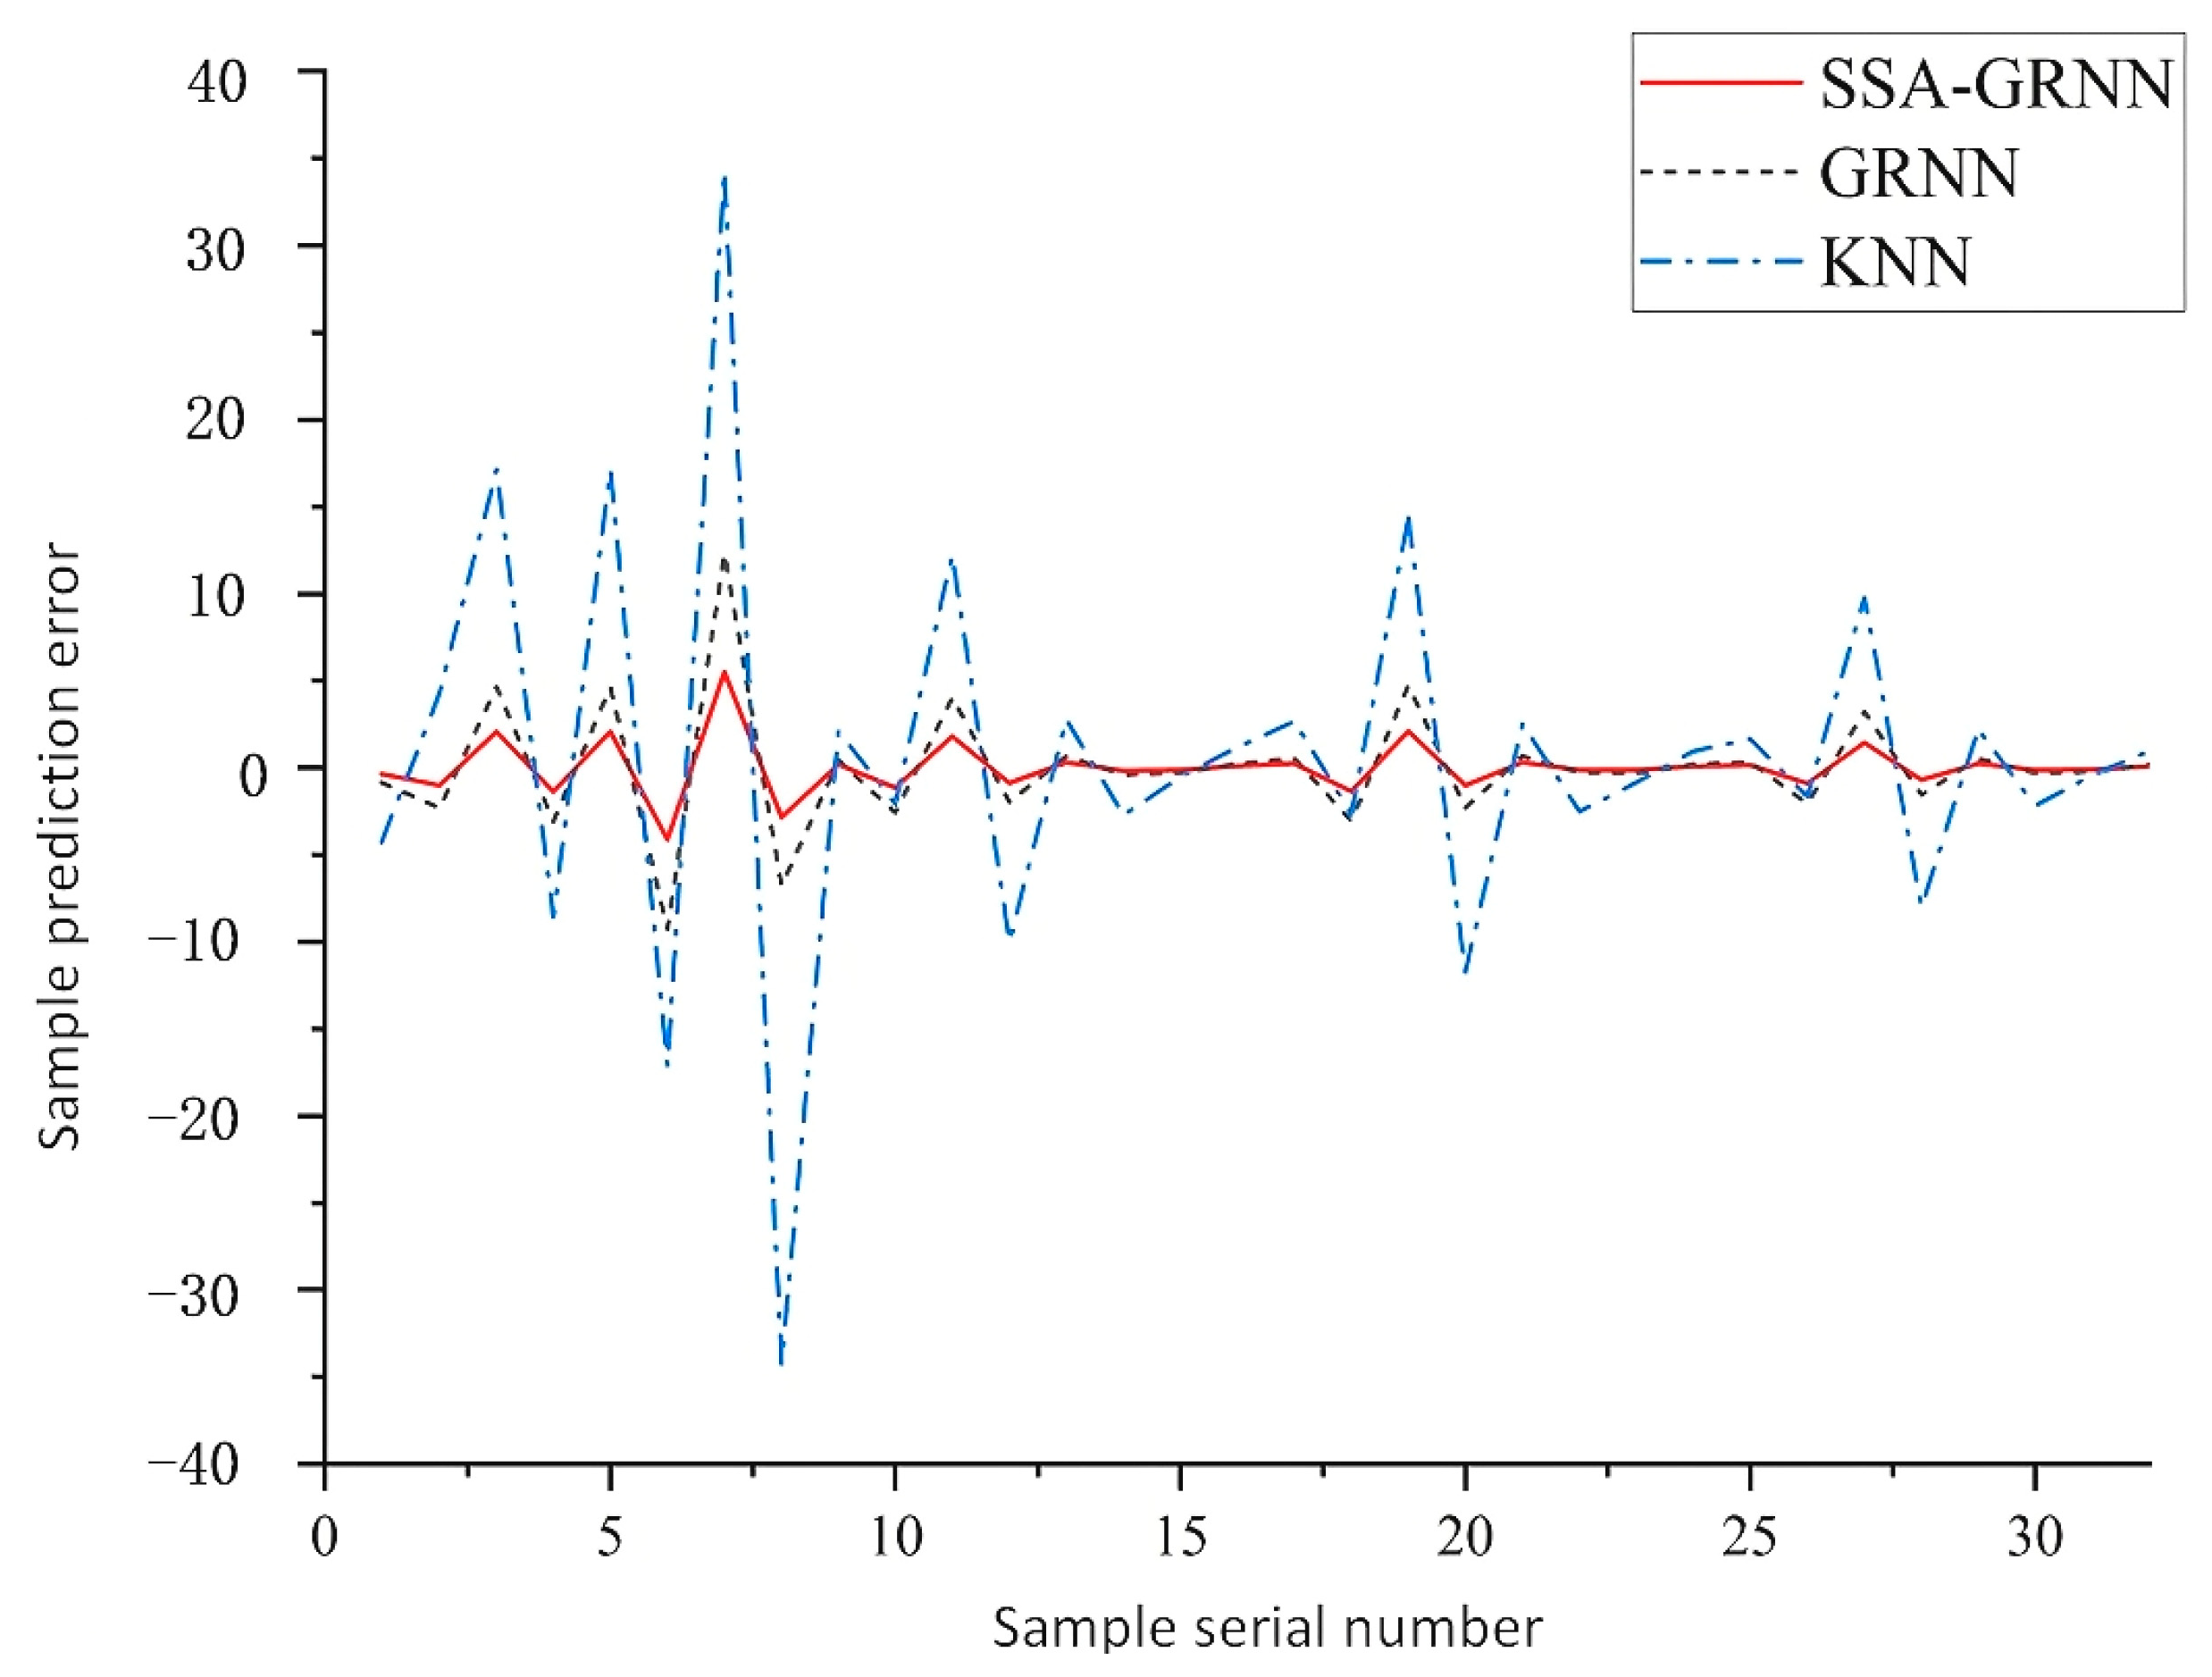
The sparrow search algorithm is used to optimize the hyperparameters of the generalized neural network, which reduces the influence of human factors in the model construction process. The model is applied to the prediction of the parking generating rate. The results show that SSA-GRNN has good prediction ability, and in terms of prediction accuracy and stability, due to the GRNN and KNN models, it is proven that SSA-GRNN has prediction feasibility under small sample conditions.
The only drawback is that, although the proposed prediction method in this paper shows high accuracy in predicting small sample sizes, further research is needed for predictions concerning large sample sizes. Additionally, this study focuses on conventional parking predictions, but large-scale events such as concerts and sports events can have a significant impact on parking demand. These factors can be given more emphasis in future research to provide a more comprehensive solution to urban parking problems.
The impact factor of the parking generating rate is not absolutely constant, so the model training data need to be updated in time to ensure the practicability of the prediction model.


