Article

Future Dietary Transformation and Its Impacts on the Environment in China

School of Economics and Management, Lanzhou University of Technology, Lanzhou 730050, China
*
Author to whom correspondence should be addressed.
Sustainability 2023, 15(17), 13021; https://doi.org/10.3390/su151713021
Submission received: 12 August 2023 / Revised: 27 August 2023 / Accepted: 28 August 2023 / Published: 29 August 2023

Abstract

:
Meeting China’s future food consumption needs without increasing the environmental burden is one of the largest sustainability challenges in the ensuing decades. China is a typical urban–rural binary society, and there is a certain gap in the diets of urban and rural residents. With the advancement of urbanization, the future trend of Chinese urban and rural residents’ diets and its impact on the environment is a topic worth exploring. This study intends to examine the future changes in dietary intake of urban and rural residents in China as well as their impact on carbon emissions, virtual water, and arable land. These results indicate that the trend of decreasing grain consumption and increasing animal food consumption in China over the next 30 years will continue. However, the gap in per capita consumption of ruminant meat, aquatic products, and eggs between urban and rural residents will not be narrowed in the future. The combination of structural demand trends and population urbanization will likely impose stress on domestic food supplies over the long term. In addition, the burden of the dietary environment in China will further increase in the future, especially in urban areas, but rural areas will significantly decrease with a decrease in population size. In theory, if three alternative dietary scenarios are adopted, the environmental impact of Chinese residents’ diets can be significantly reduced in the future. More specifically, the demand gap for carbon emissions, virtual water, and arable land for urban residents’ diets in the future will exhibit heterogeneity under three alternative dietary scenarios. To achieve the long-term goals of ensuring food safety and sustainable environmental development in China in the future, it is necessary to take multiple measures, such as consuming a reasonable and balanced diet, reducing food waste, increasing agricultural technology investment, and increasing the import of resource-intensive food.

1. Introduction

Food security is a fundamental issue related to human survival. As one of the most populous developing countries in the world, China has a crucial impact on global food security and the environment. Ensuring food security and environmental sustainability has always been an important goal of China’s economic and social development. Affected by income level, technological level, natural disasters, and policy mistakes, the public was plagued by the problem of food and clothing for a long time during China’s planned economy period. The reform and opening up of China’s economy, represented by the implementation of the rural family land contract management system, have opened the process of the transformation of China’s food system. Since then, China has taken multiple measures to build a food-security system, which has promoted a significant increase in the per capita supply of agricultural products despite a significant decrease in the arable land area and a significant increase in the population. Over the past 40 years, China has lifted two-thirds of the world’s hunger-free population, making it the first developing country to achieve the UN’s Sustainable Development Goal 2 (SDG2, Zero Hunger) [1].
Diet is commonly mentioned as a major driving force for GHG (greenhouse gas) emissions, water footprint, and arable land footprint, which is expected to continue [2]. Most previous studies mainly examined single environmental demand, such as carbon emissions, water resources, and arable land, under different dietary patterns [3,4,5,6,7,8,9]. Meanwhile, China is a typical dualistic society with large differences between urban and rural areas and certain differences in per capita income and food intake among urban and rural residents. With the advancement of urbanization, the trend of food intake of urban and rural residents and its impact on the environment is a scientific issue worth exploring. Against the backdrop of reshaping urban–rural relations in China, there are few discussions on the environmental impacts caused by the dietary needs of urban and rural residents. Combining the inevitable trends of population growth, urbanization, and per capita income, we have separately explored the environmental impact of future dietary choices for urban and rural areas. This paper fills these knowledge gaps by addressing the following: (1) identify the current differences in the environmental burden of food consumption between urban and rural areas in China; (2) estimate the trend of future changes in the environmental burden of food consumption in urban and rural areas; and (3) explore the gap in environmental burden between the current diet and alternative healthy dietary scenarios. Although this is a case study, which is based on China’s national situation to explore the direction of sustainable food system transformation and the path to achieve it, it is hoped that the results of the study will provide Chinese wisdom and Chinese solutions for global food system research and theoretical exploration and can facilitate discussion and inform policy-making in other developing countries.

2. Materials and Methods

2.1. Food Consumption and Nutrition

Considering the actual food composition of Chinese residents, the food mentioned in this study only includes cereals, beans, dairy, vegetable oils, eggs, aquatic products, beef and mutton, pork, poultry, vegetables, and fruits. The data on per capita food consumption and per capita disposable income involved in this study mainly came from the National Bureau of Statistics, but note that this food consumption did not include dining out. We have corrected the food consumption based on the proportion coefficient of external consumption [10]. Meanwhile, the grain consumption of urban residents before 2013 in the statistics refers to processed grains. In order to ensure the consistency of the analysis data, the processed grains were uniformly converted into raw grains on the basis of relevant research [11,12].
Previous studies have found that food demand depends on per capita disposable income or per capita GDP [13]. Combined with per capita food demand and per capita disposable income from 1978 to 2020, the prediction of food demand per capita for each group and per capita disposable income in the future is modeled with the Gompertz 4p curve. The Gompertz 4p is a logistic-like function that has both an upper and a lower asymptote. The Gompertz 4p equation is:
Y = a + b a exp exp r x d ] )
where a, b, r, and d represent the lower asymptote, upper asymptote, growth rate, and infection point, respectively.
Changes in annual per capita demand for each commodity group were concomitant with income increases, which are also followed by urban and rural areas in China. We assume that the future diet of urban and rural areas in China will continue to follow the previous development trajectory. Based on the data of per capita income and food consumption over the past 40 years, this paper uses recursive dynamic methods to predict the per capita food consumption demand in urban and rural areas of China in 2030 and 2050. By combining the fitted dependence of food demand on per capita disposable income with urban–rural population projections, we were able to estimate the demand for each food group between rural and urban populations in China in 2030 (2050). The urbanization rate involved in estimating the future urban and rural populations in China is based on the “World Urbanization Outlook: 2018 Revised Edition” and current data.
The per capita intake of nutrients is calculated based on the Chinese food composition table and food consumption composition. In this paper, five major macronutrients and nineteen micronutrients were selected to analyze dietary nutrition in China. The formula for calculating the daily dietary nutrition of urban and rural residents is as follows:
N u t r i e n t a r e a = n i j × f o o d i 365
where Nutrientarea is the daily dietary nutrition of urban residents (or rural residents); foodi is the annual per capita dietary intake, i.e., the annual per capita consumption of food group i; and ni, j refers to the representative value of nutrient j for food group i, which is based on the Chinese Food Composition Table. We used average EARs to assess adequate mineral and vitamin intakes at the population level. The estimated average requirement (EAR) is the nutrient intake value that is estimated to meet the requirements of 50% of individuals in a given life stage and gender group.

2.2. Environmental Impacts of Different Diets

The environmental impacts of food consumption are reflected in three parts: carbon emissions, water footprint, and arable land footprint.
For estimating GHG emissions associated with the average daily diet per capita, we linked intake amounts of 11 food items (g per capita per day) to the mean GHG emission factor values (g CO2 eq. g−1) obtained from David Tilman and Michael Clark [13]. David Tilman’s study determined the corresponding GHG emissions per 1000 calorie major food group from “cradle to farm” by comparing 555 GHG emission LCAs (life cycle assessments) for 82 different food products. For calculating the water footprint associated with each type of food, we follow the approach followed by Mekonnen et al. [14]. The per capita arable land-use footprint associated with each type of food was obtained from Cai et al. [15].

2.3. Different Alternative Diet Scenarios

Scenarios are often widely used to explore the environmental impacts of potential dietary choices [16,17,18]. In this paper, the current situation of China’s urban and rural diets in 2020 is used as the baseline scenario, and the future diet based on income simulation is used as the target scenario. This study selected three alternative healthy dietary scenarios for comparison, including the Chinese Dietary Pagoda, Mediterranean [19,20], and EAT–Lancet [21,22] dietary scenarios. It should be noted that we limit the discussion to the Chinese mainland but exclude Taiwan, Hong Kong, and Macau.

3. Results and Discussion

3.1. Evaluation of the Current Dietary Nutrition Status in China

The per capita disposable income of urban and rural residents in China has increased rapidly, increasing by 137 times and 141 times, respectively, from 1978 to 2021, but the gap between urban and rural residents’ per capita income has not narrowed (Figure 1). The growth of disposable income has promoted significant changes in the structure of residents’ dietary consumption.
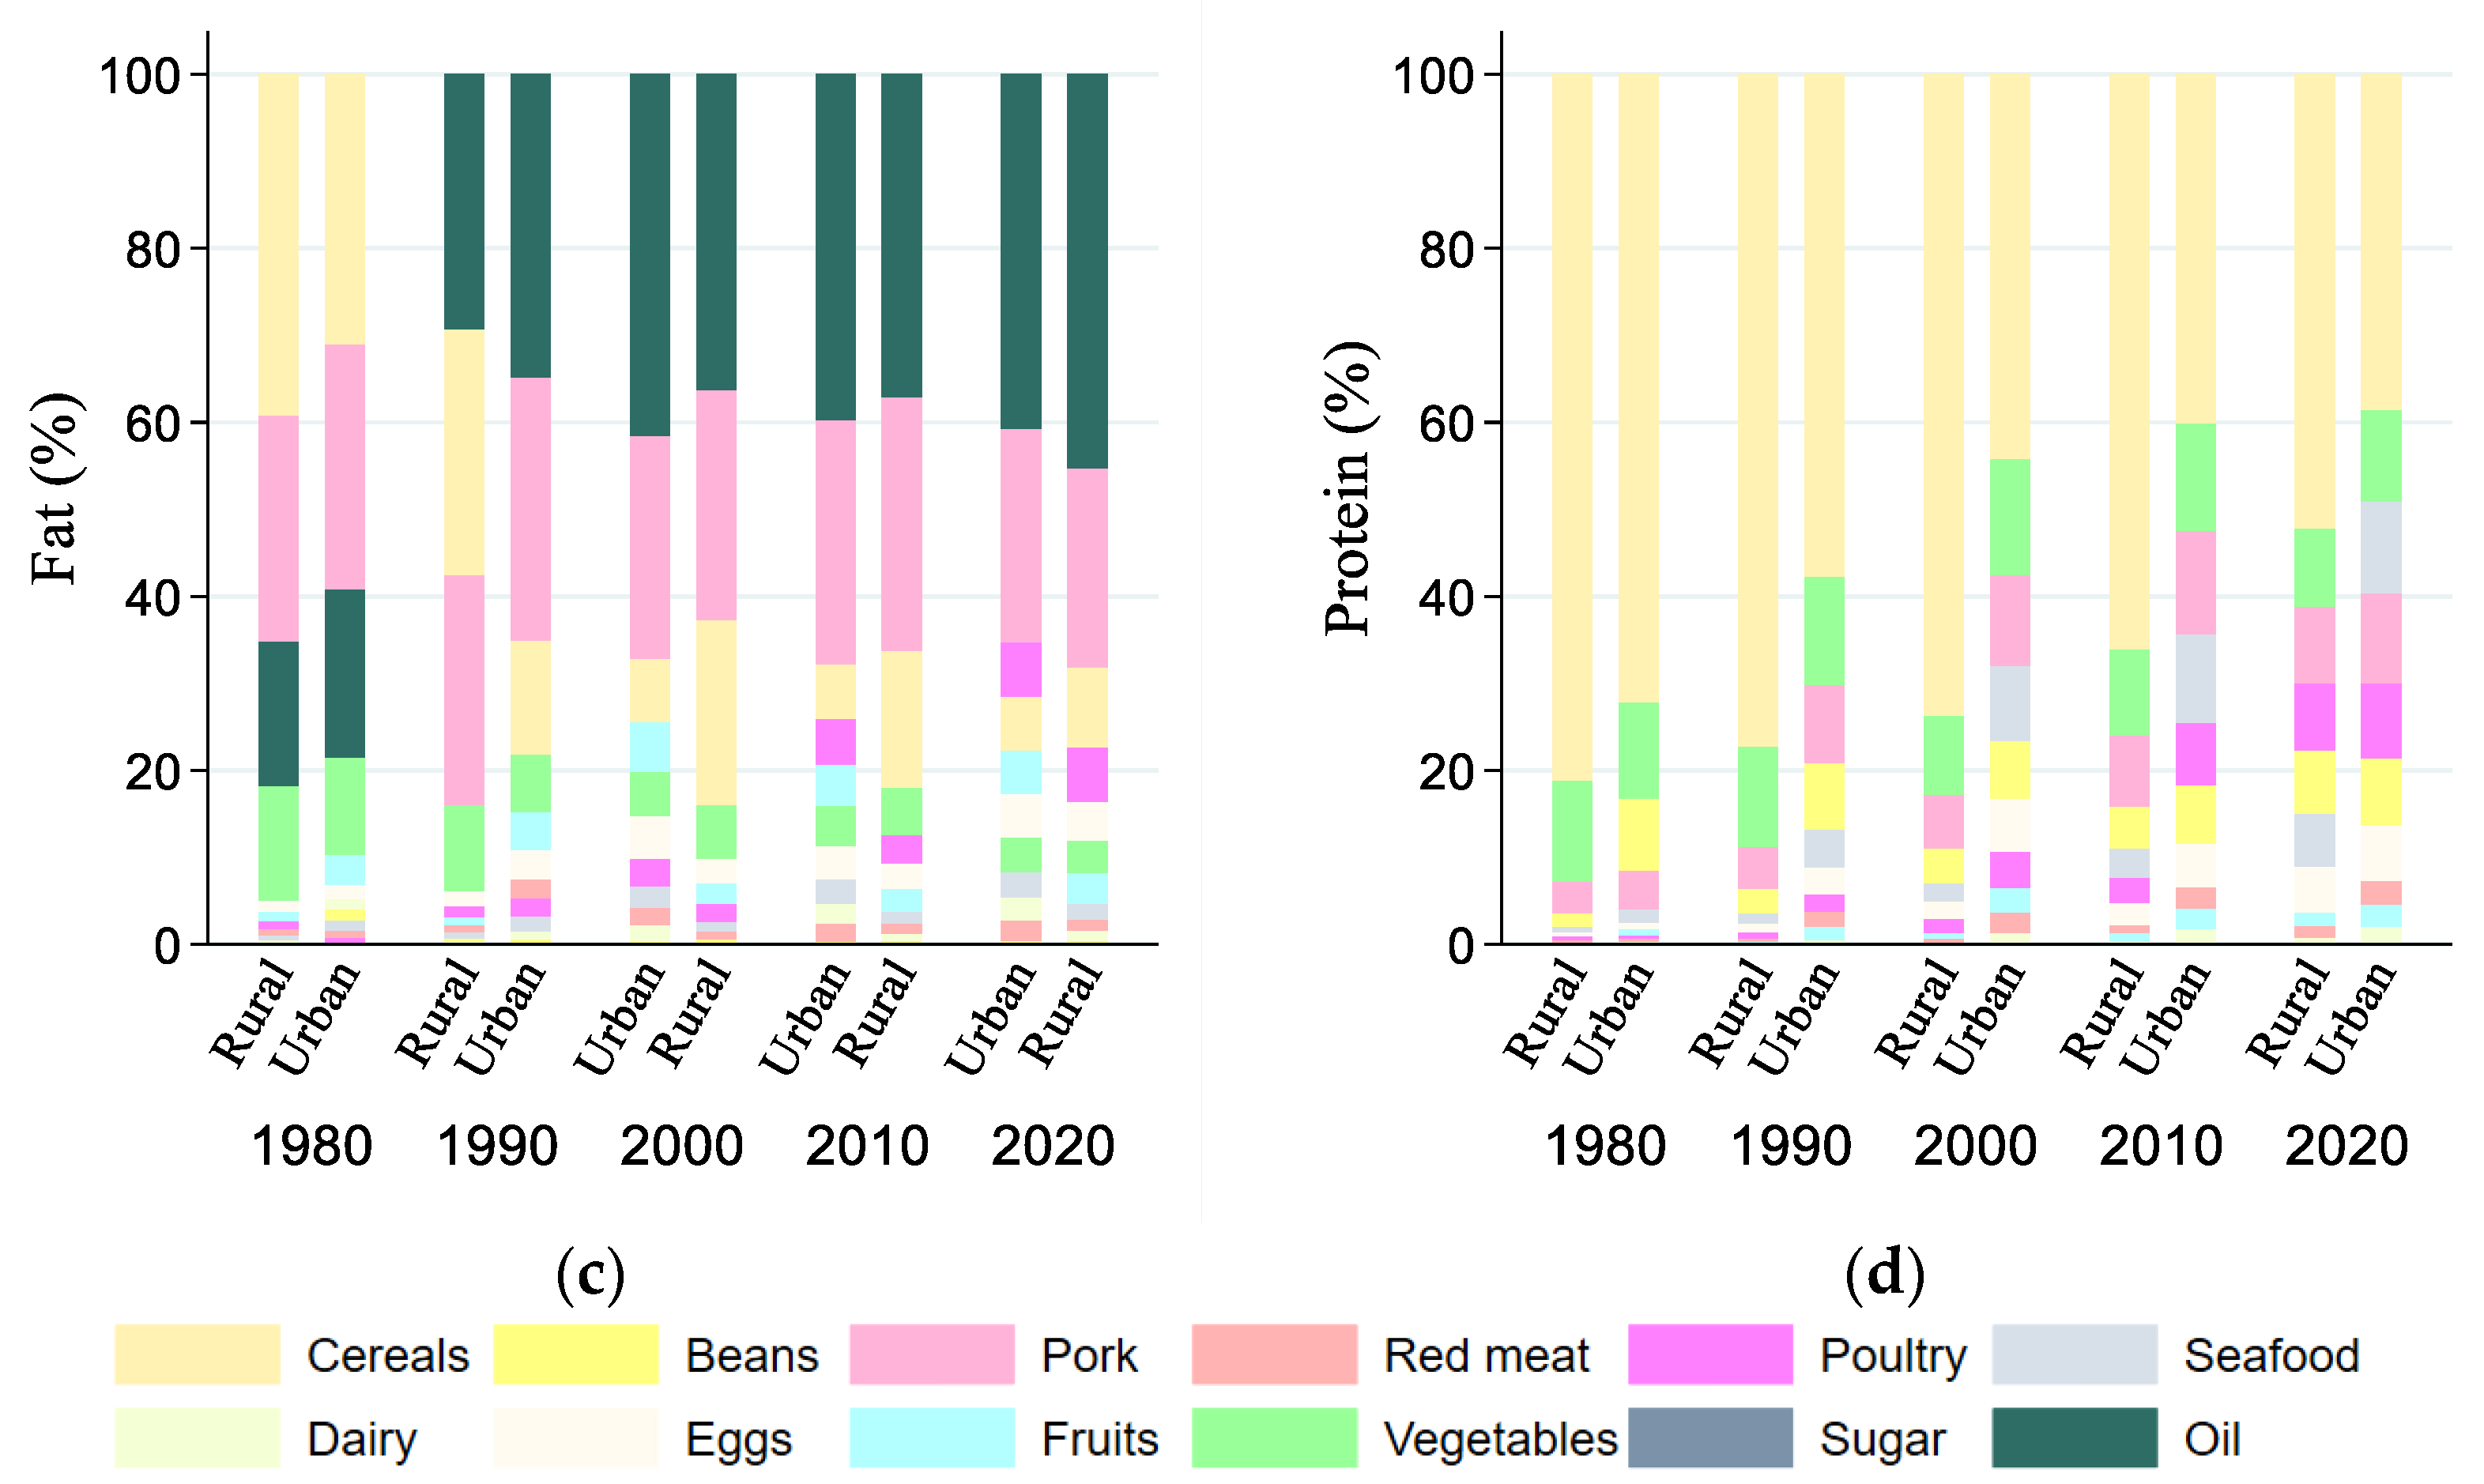
Primarily based on data from the Food and Agriculture Organization of the United Nations (FAO), the average food consumption in China increased from 2062 kcal cap−1 d−1 to 3344 kcal cap−1 d−1 during the period from 1978 to 2020, in which the per capita plant food increased by 35.51%, and the per capita animal food increased by 458%. The dietary quality of residents is generally improving, but there is still a long way to go from the standard of a reasonable and healthy diet. In terms of food composition, 95% of the per capita dietary energy generated by cereal intake comes from wheat and rice, and 93.4% of the per capita dietary energy generated by meat intake comes from pork, poultry, and ruminants. In terms of nutrients, 12% comes from protein, 34.6% comes from fat, and 53.4% comes from carbohydrates (Figure 2). Overall, the percentage of energy from fat appears relatively high, exceeding the reference intake of dietary nutrients for Chinese residents and the upper limit of 30% recommended by the World Health Organization. We further evaluated whether the average intake of 14 micronutrients (vitamins and minerals) was sufficient based on total food intake. For the nine nutrients (Vitamin A, Thiamin, Riboflavin, Vitamin B12, Vitamin C, Calcium, Potassium, Selenium, and Magnesium), the current average dietary intake of Chinese residents is less than the estimated average demand (EAR). It should be noted here that there are certain differences in dietary structure between towns and villages, which may affect the per capita micronutrient intake among them.

3.2. Future Dietary Transition and Nutritional Implications in China

With the development of the economy in China, it is the general trend that per capita income and urbanization will continue to increase in the coming decades, which will drive a shift in the food consumption patterns of Chinese residents. The total per capita food intake in urban and rural areas of China will show an upward trend in the future accompanied by a decrease in per capita grain intake and an increase in per capita animal food intake. This is in line with the historical food consumption patterns of peer countries. Cereals are at the core of the traditional Chinese diet. Compared to 2020, the per capita cereal intake in urban and rural areas in 2030 will decrease by 13% and 22%, respectively, while 2050 and 2030 are basically similar (Table 1). The per capita intake of other plant foods will increase or decrease in the future with vegetables declining and fruits rising. Fruits and vegetables are both packed with vitamins, minerals, fiber, and other nutrients, and while China’s per capita consumption of fruits is now somewhat low, vegetables are generally quite good.
Compared with the current situation, the per capita fruit intake in urban and rural areas will increase by 21% and 57% in 2030, respectively, and will continue to increase by 10% and 21% in 2050. Animal foods are an important source of human nutrition, but there is also evidence that high meat consumption may increase the risk of some chronic diseases. Currently, the per capita intake of animal products of urban residents is significantly higher than that of rural residents in China. In the coming decades, the food structure of both urban and rural residents will shift towards higher animal protein intake. We also note that there will be a large gap in the per capita consumption of different categories of animal protein between urban and rural residents in the future, suggesting that there is plenty of room for improvement in rural areas. The per capita intake of aquatic products and ruminant meat in urban areas will be close to twice that in rural areas for 2020–2050, while the intake of poultry meat will be relatively higher, and the intake of pork will be basically similar. The combination of structural demand trends and urban–rural population mobility will likely impose stress on the domestic food supplies over the long term. China is facing the need for a fundamental change in its diet, which may require changing the internal production structure of agriculture, improving output efficiency, and increasing imports to address future food-balance issues.
Nutrient intake changes synchronously with residents’ dietary structures. In terms of macronutrients, compared to 2020, the per capita intake of protein and fat will show a significant increase along with an increase in animal food intake among urban and rural residents in the long term. However, carbohydrates and dietary fiber will show a downward trend due to a decrease in per capita intake of cereal foods. According to our estimation, the per capita intake of micronutrients in the urban and rural areas of China will be improved due to dietary transformation. However, there will still be three nutrients (Vitamin A, Vitamin C, and Calcium) below the estimated average demand (EAR).

3.3. GHG Emissions Impacts of Meeting Future Dietary Transition in China

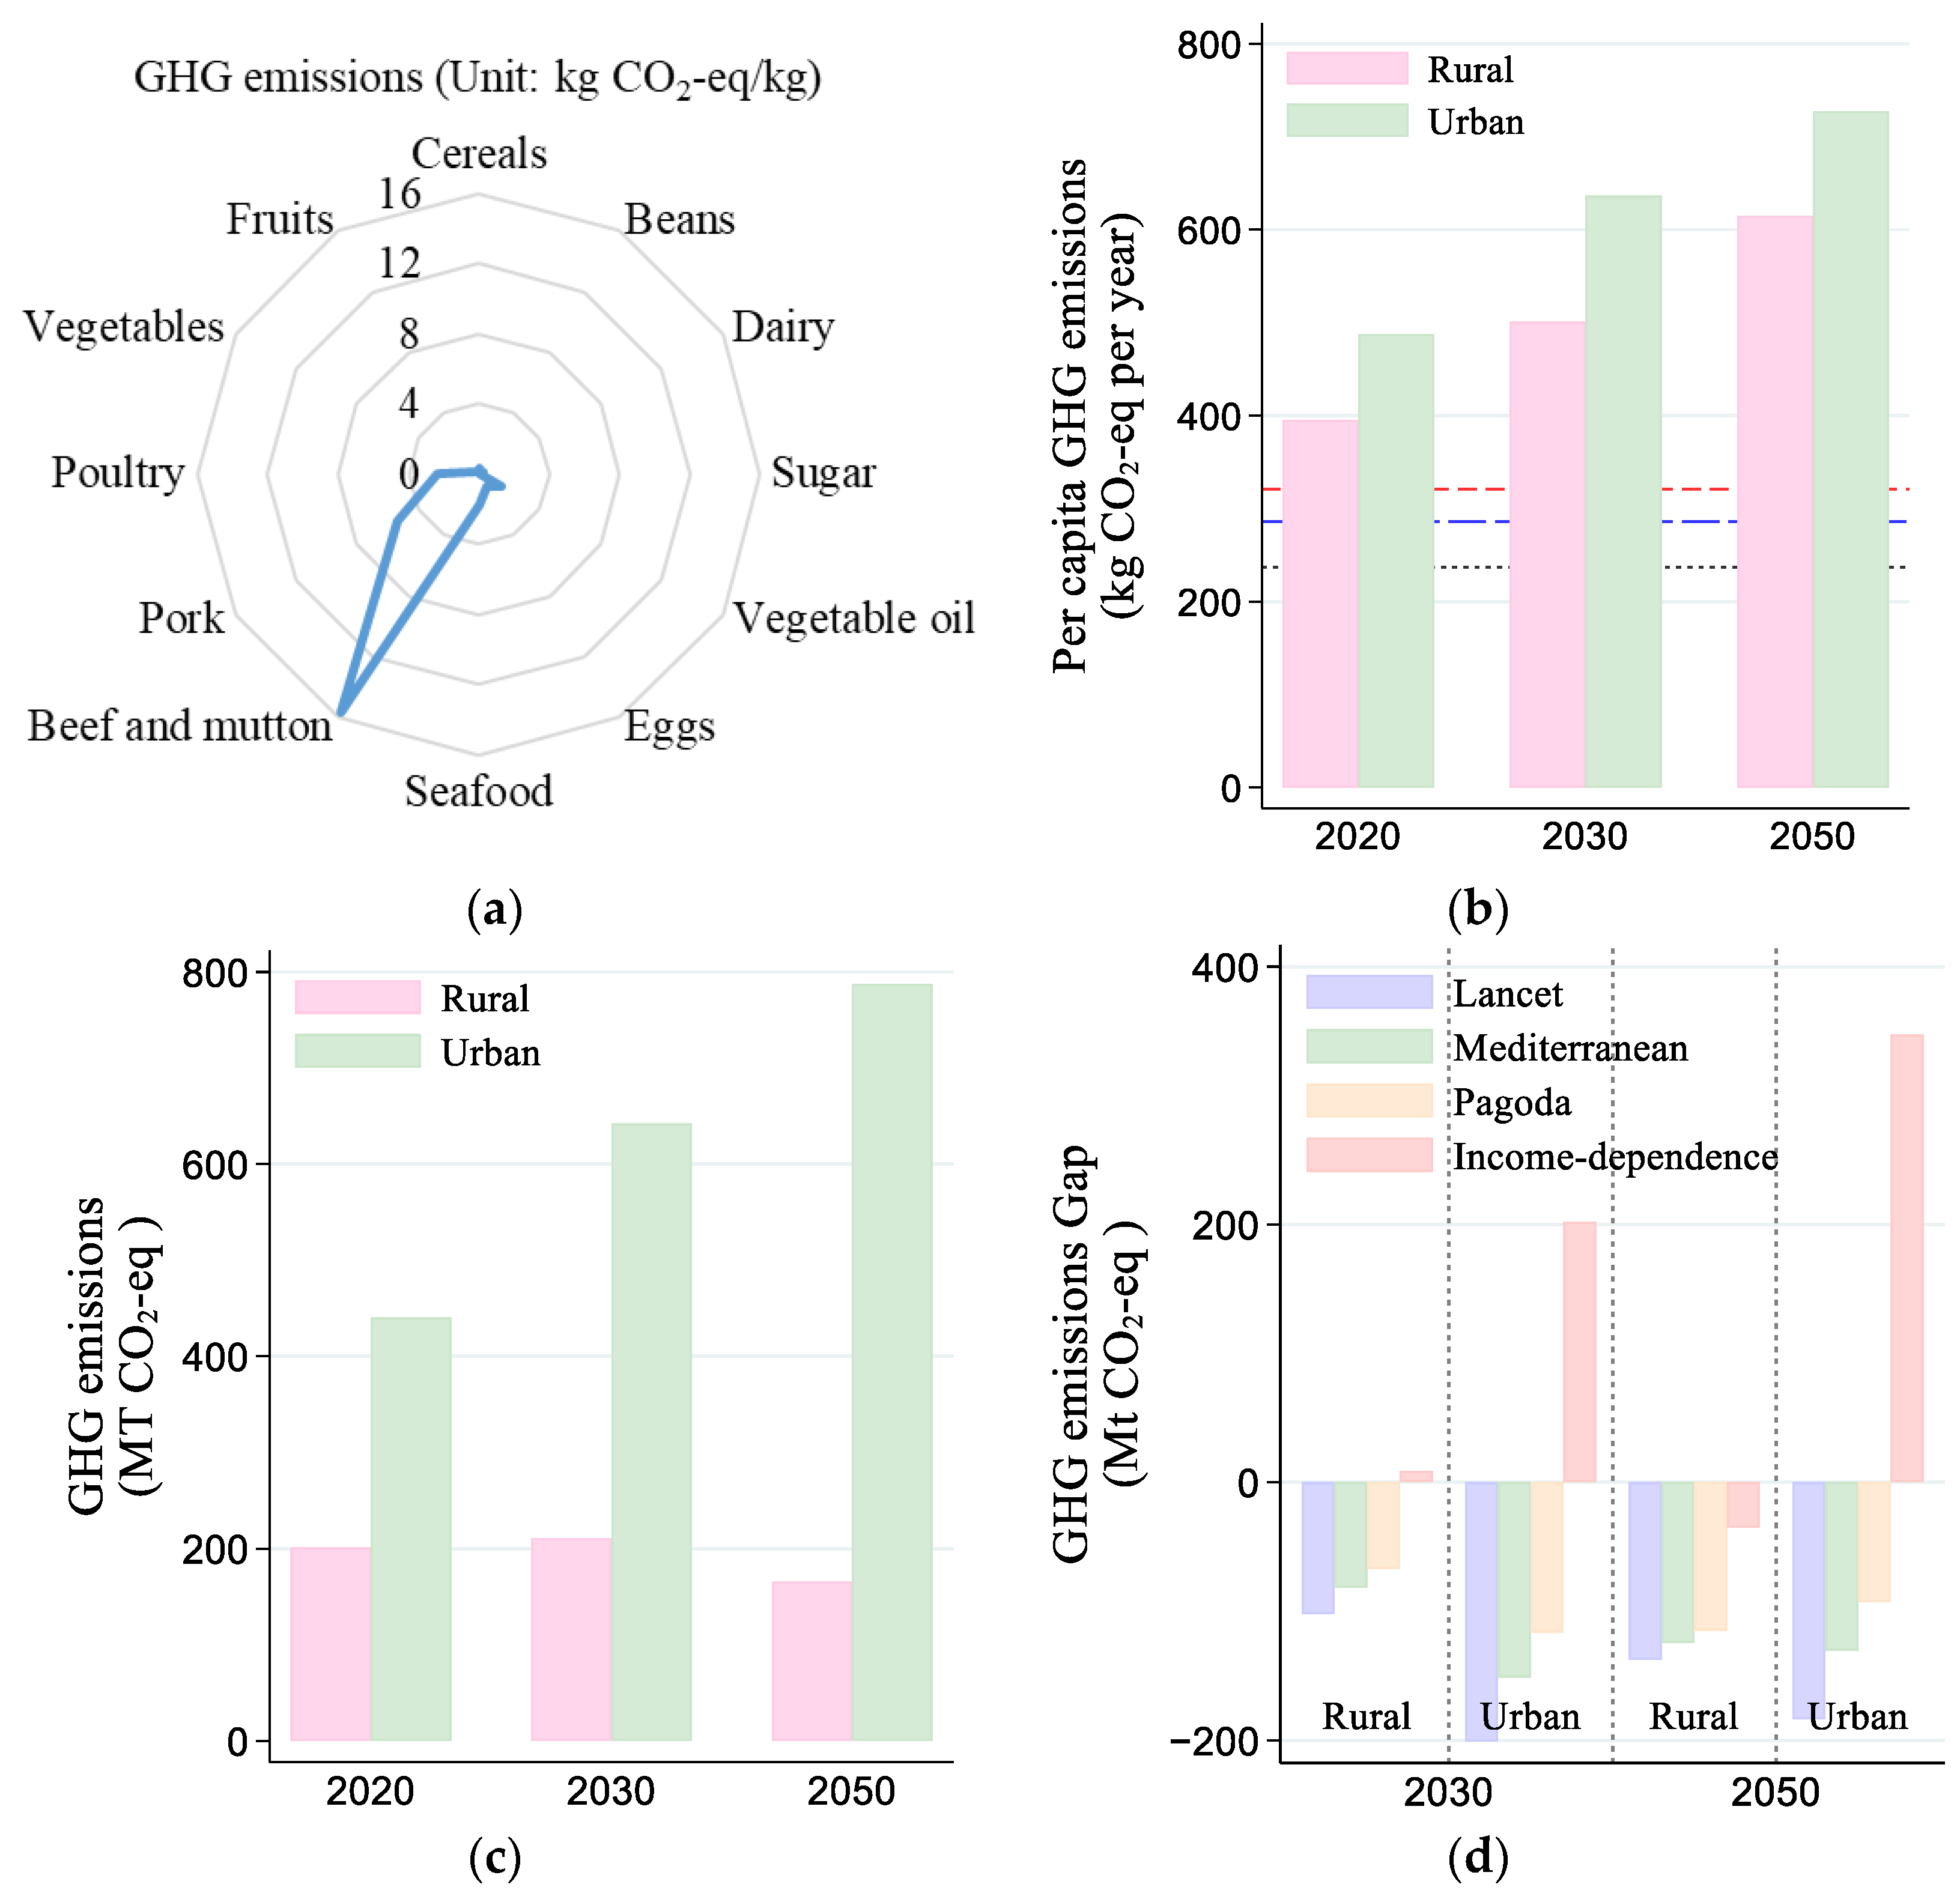
One-third of global anthropogenic GHG (greenhouse gas) emissions come from the food system [23]. GHG emissions vary widely among per unit mass of foods [13]. Our data show that the GHG emissions from per unit mass of ruminant meat are approximately three (seven) times the mean footprint of pork (poultry) and more than 45 times the average footprint of plant foods (Figure 3a). The average per capita carbon emissions from the food system is 454 kg CO2e person−1 y−1 in 2020, which is still much less than that in developed countries [17], and the per capita GHG emissions from food in urban areas are 23.42% higher than those in rural areas in China. Considering the population size, China’s GHG emissions from food consumption have reached 642 Mt CO2e (1 Mt = 106 metric tons) in 2020 with 68.59% (440 Mt CO2e yr−1) emitted by urban areas and the remaining 31.42% (202 Mt CO2e yr−1) emitted by rural areas. The GHG emissions from animal-based food contribute 76% of the current difference between urban and rural areas.
Figure 3b,c show the GHG emissions from income-dependent dietary variations between urban and rural inhabitants in China for the years 2030 and 2050 after modeling the trajectory of food from cradle to farm gate while taking demographic change and urbanization into account. From 2020 to 2030 (2050), the per capita dietary GHG emissions in urban and rural areas will increase by 26.71% (55.62%) and 30.47% (49.12%) if diets change in income-dependent ways, and the rural per capita emission from income-dependent diets in 2050 will be roughly equivalent to that of urban areas in 2030. From 2020 to 2030 (2050), the Chinese population is projected to increase by 1.17% (−4.23%), the urban population is expected to increase by 11.83% (19.96%), and the rural population is expected to decrease by 17.71% (47.03%). According to Figure 3c and Table 2, in 2030 (2050), the total dietary GHG emissions from rural residents will be 33% (21%) of those from urban residents, down from 46% in 2020. The net effect is likely to result in an increase of 32.71% (48.60%) in GHG emissions from the food system (from 642 to 852 (954) Mt yr−1 of CO2e) between the years 2020 and 2030 (2050) when combined with changes in per capita emissions from income-dependent dietary and population patterns. This increase of 210 (312) Mt yr−1 CO2e is approximately close to the average annual carbon sequestration level of terrestrial ecosystems in China [24].
Comparing potential GHG emission reductions from alternative diet scenarios is also instructive, assuming that the quantities of pre- and post-purchase waste remain constant. Figure 3d compares the average GHG savings from the three alternative diets (EAT–Lancet, Mediterranean, and Pagoda) in China in 2030 (2050) to the country’s present dietary level. Alternative diets could lower the emissions from food production. It is clearly observed that the average GHG savings will be 183–303 (207–320) Mt CO2e, respectively, in 2030 (2050). Note that our analysis is neither intended to compare the impact of alternative-healthy diets on emissions nor intended to imply that other diets may not offer superior emission reduction benefits than these diets.

3.4. Water Footprint Impacts of Meeting Future Dietary Transition in China

Water is crucial for sustainable food production and consumption. Knowing food’s water footprint (WF) in addition to its carbon emissions is crucial for understanding its environmental effects. Blue, green, and gray water footprints are the three primary parts of the water footprint. Green water accounts for an absolute proportion of the virtual water composition of different types of food per unit mass. Additionally, a comparison of the water footprint for each serving of food showed that ruminant meat contributed the most to the green WF, seafood contributed the most to the blue WF, and poultry and legumes contributed the most to the gray WF (Figure 4).
Figure 5 displays the findings of calculations of the water footprint (WF) (green, blue, and gray water) resulting from food consumption by urban and rural populations in China in 2020 (2030, 2050). There are significant differences within each WF intensity of the present diet, as predicted. While the blue and gray WFs caused by per capita food consumption are essentially equal between urban and rural areas in 2020, the green WF caused by per capita food consumption of urban residents is slightly higher than that of rural residents. From the perspective of the WF of consumption food categories, the WF of per capita consumption of plant food is significantly higher than that of animal food (except for green WF in urban areas). This is determined by the percentage of plant-based foods in the current diet.
Assuming that the future dietary development trend does not change, the dietary changes would have significantly driven the cumulative growth of the green WF. Compared to 2020, the food virtual water needs of Chinese residents will increase by 222.65 (344.06) billion m3 in 2030 (2050) (Figure 5b). The expansion of the total water footprint is mainly caused by the shift in food consumption structure towards meat, poultry, and eggs with high virtual water content per unit weight. In 2030 (2050), the virtual water for urban food will be 1.32 (1.59) times that of 2020, while it will be only 93% (72%) that of 2020 in rural regions. Population urbanization is primarily responsible for the difference in virtual water changes produced by food consumption between urban and rural locations.
Note that the red dashed line indicates the per capita water footprint of food consumption in the Chinese Pagoda scenario, the blue long-dashed line indicates the per capita water footprint of food consumption in the EAT–Lancet scenario, and the grey short-dashed line indicates the per capita water footprint of food consumption in the Mediterranean scenario.
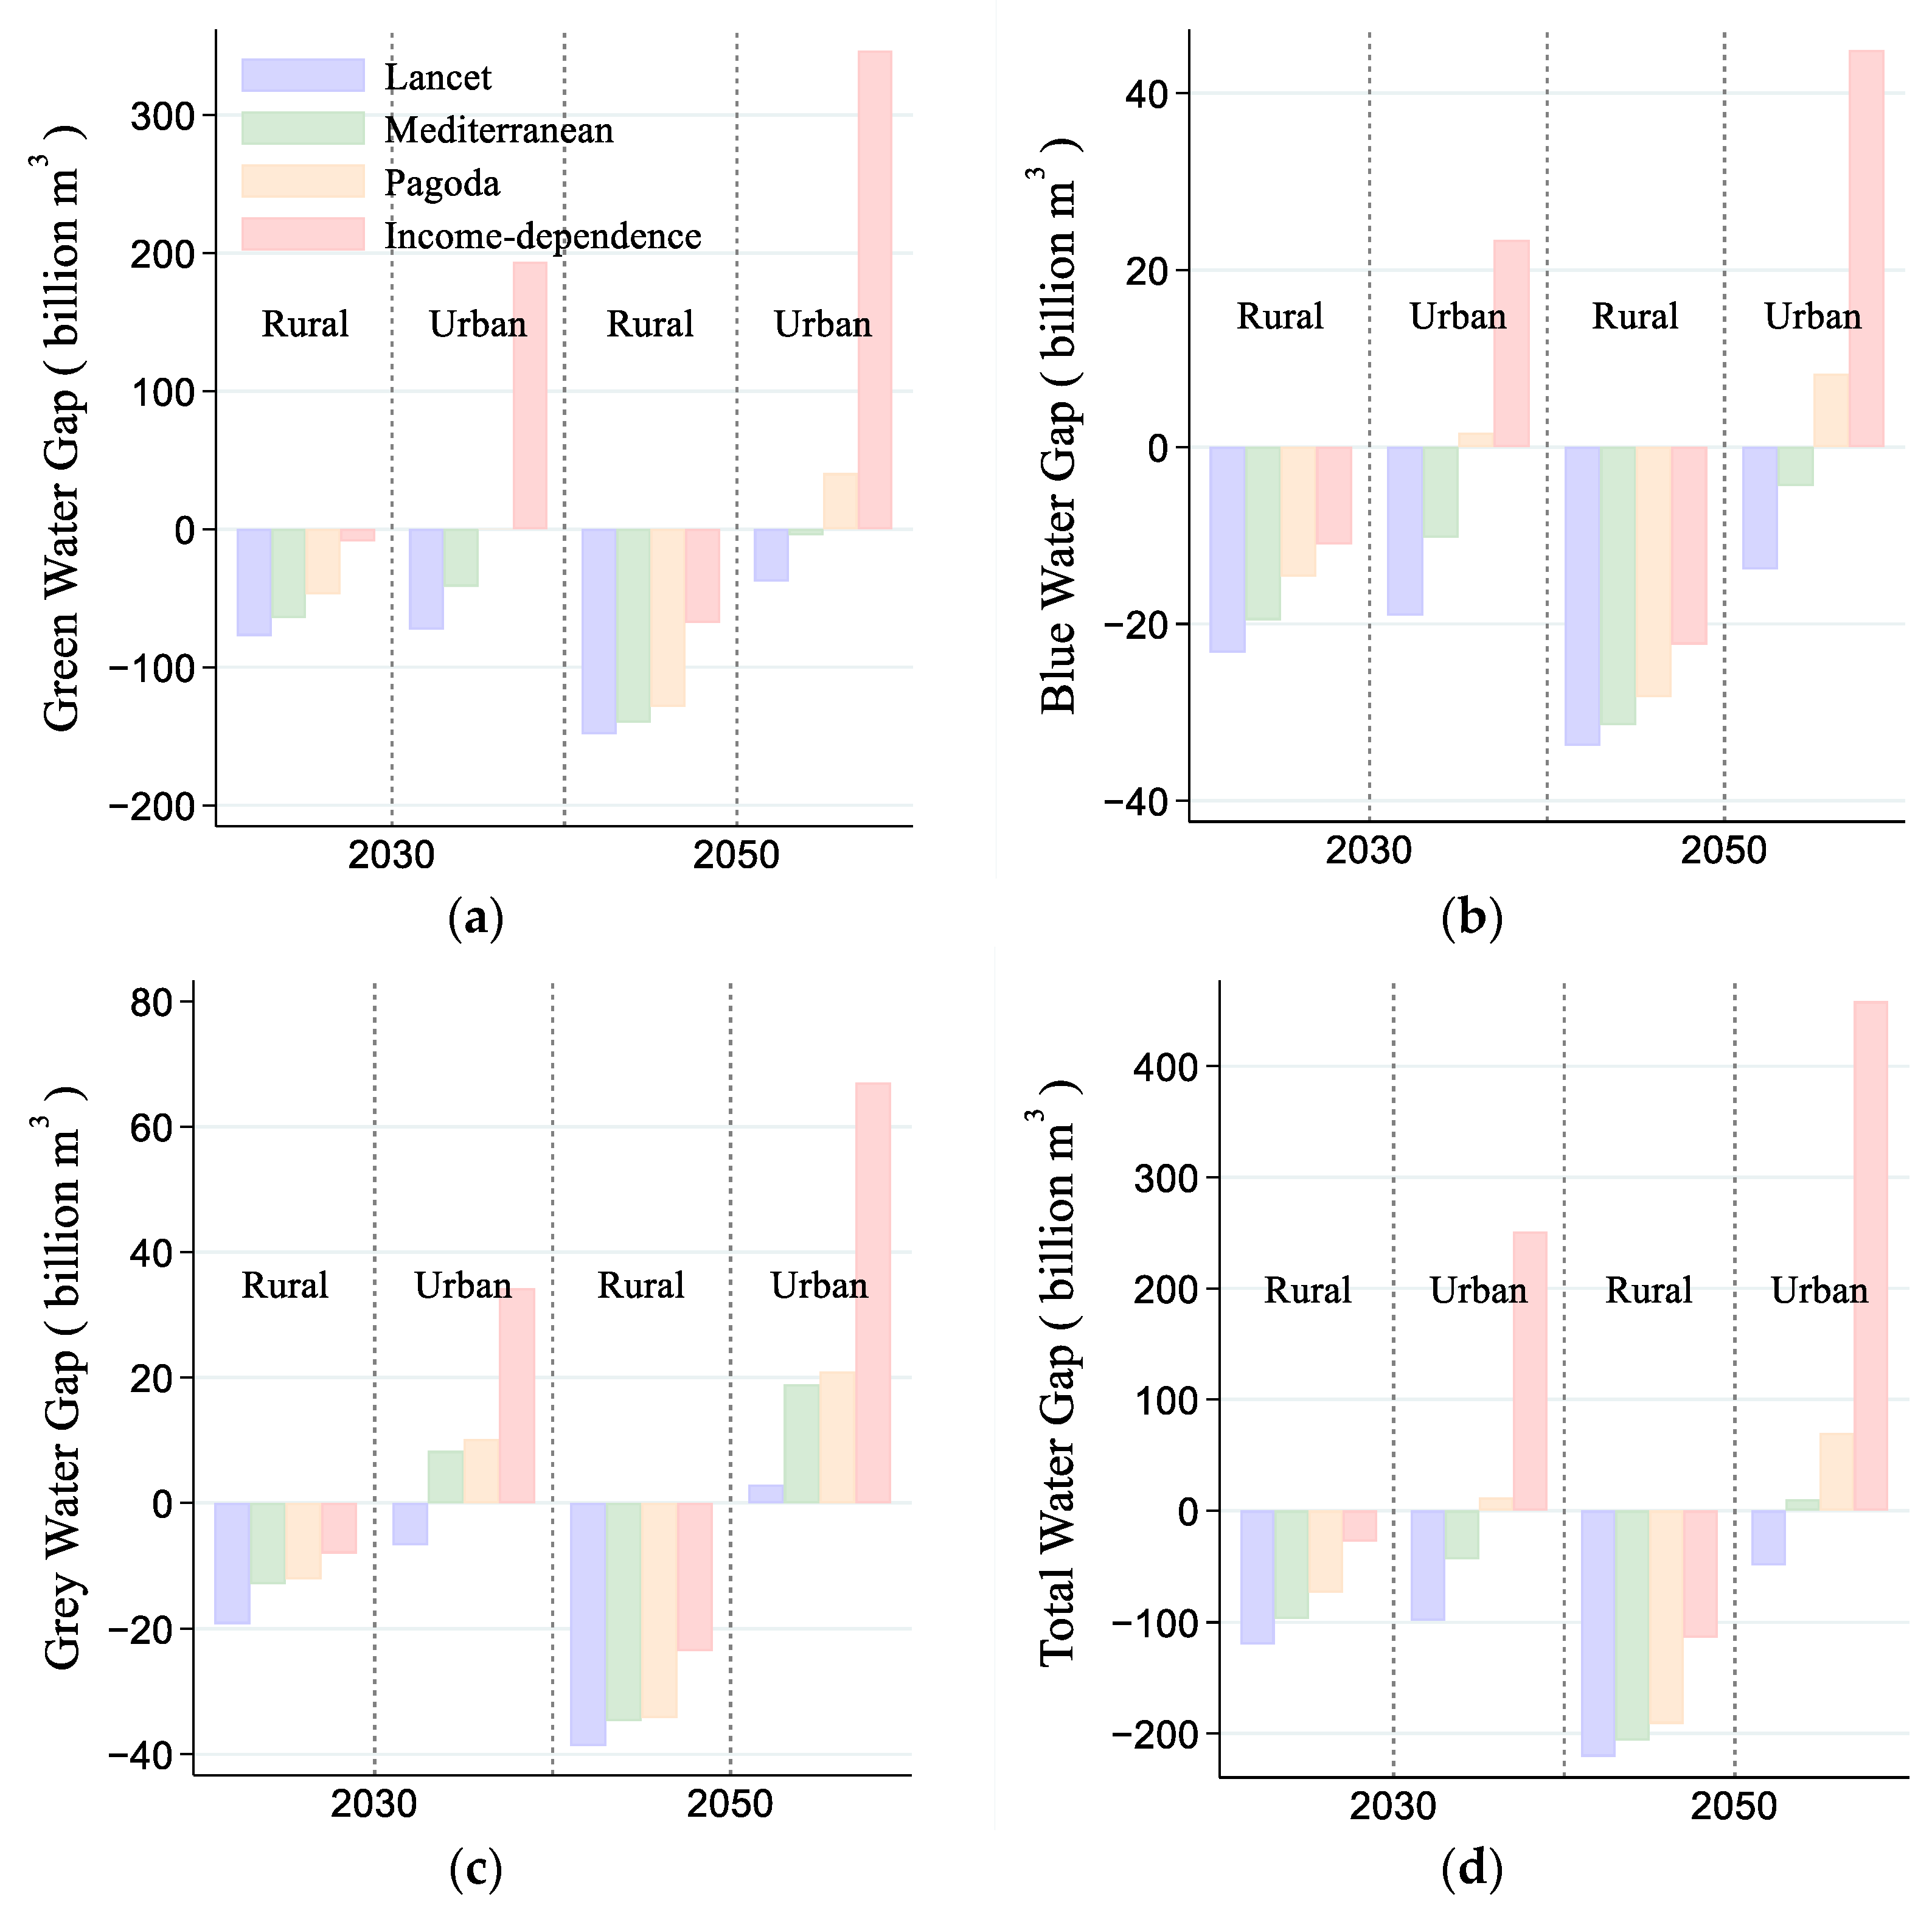
Taking the water footprint of food consumption in 2020 as a baseline, the variations in the water footprint in 2030 (2050) for different alternative dietary scenarios demonstrate some characteristics (Figure 6). The WF (water footprint) caused by per capita food in alternative dietary scenarios (excluding income-dependence) is lower than the relevant value of China in 2020. According to the alternative dietary scenarios, the total WF (water footprint) meeting rural food in 2030 (2050) will be drastically reduced when compared to 2020 as China’s rural population steadily migrates to urban areas. Under the two alternative dietary scenarios (Income-dependency, Pagoda), the total WF meeting urban food in 2030 (2050) will be an absolute rise compared to 2020, whereas the LANCET scenario would show a trend in the other direction.

3.5. Arable Land Requirement of Future Food Consumption in China

The production of plant-based foods and the supply of feed for cattle, poultry, and aquaculture are both intimately correlated with arable land, which is the lifeblood of the food industry. The demand for arable land varies among different types of food (Figure 7a). From the perspective of arable land demand per unit mass of food production, animal foods (excluding eggs) require more arable land than plant foods (excluding vegetable oil). The amount of arable land needed for each kilogram of beef was 12.6 and 20 times greater than that needed for vegetables and cereals, respectively. The amount of arable land needed for each kilogram of eggs is comparable to that needed for cereals. Vegetable oil requires more arable land than the other plant foods, and it requires 2.5 times more arable land per kg than vegetables and 4.4 times more than grains, respectively.
In China, the demand for cereals, vegetables, and beef and mutton is relatively high from the standpoint of arable land meeting per capita food consumption, accounting for roughly 54–59% of the total arable land meeting food consumption in 2020 (Table 3). According to our estimation, the current amount of arable land meeting per capita food demand in urban regions is 15% higher than that in rural areas. The current arable land meeting per capita consumption of dairy, beef and mutton, aquatic products, and fruits in urban areas is 104%, 78%, 61%, and 60% higher than in rural areas, respectively. In contrast to rural areas, urban areas have 22% less arable land that is used to meet per capita cereal consumption. Long-term trends show that the amount of arable land needed to produce the per capita food consumption in urban and rural areas is on the rise from 1093 and 947 m2 year−1 in 2020 to 1277 (1420) and 1049 (1235) m2 year−1 in 2030 (2050), respectively, which is basically consistent with the conclusions of Daohao Yan et al. [25].
Assuming that the overall trend of the Chinese diet continues as in the past, compared to 2020, the arable land meeting the food consumption of Chinese residents will increase by 17.68% (25.97 million ha) in 2030 and 27.31% (40.12 million ha) in 2050 (Table 4). Specifically, the total dietary arable land footprint of urban residents will increase from 98.64 million hectares in 2020 to 128.84 (153.68) million hectares in 2030 (2050), while the total dietary arable land footprint of rural residents will decrease from 48.27 million hectares in 2020 to 44.04 (33.35) million hectares in 2030 (2050). In 2030 and beyond, the proportion of land demand for animal products in China will exceed that for plant products. This means that the structure of agricultural land needs to be systematically adjusted to meet the needs of future food transformation in China.
Based on the current dietary land demand of urban and rural inhabitants in China, there are notable disparities in the future land demand gaps among the alternative dietary options (Figure 7d). Under the three alternative dietary scenarios (except income-dependency), the future dietary land demand for rural residents is much lower than the benchmark value, which is caused by the decline in the rural population. Future land demand for urban inhabitants’ diets in the Lancet scenario is lower than the benchmark value, while from 2030 to 2050, the land demand for Mediterranean and Chinese dietary pagodas is 7–14% higher than the benchmark value.

4. Limitations Analysis

This study selected representative foods from different categories as equivalent foods, which may have some uncertainty. I believe that these uncertainties will be reduced as the coverage and accuracy of survey statistical data continue to improve. Our study assumes that residents’ food consumption continues to follow the past trajectory, which is a highly probable event that is consistent with previous relevant studies. However, it cannot rule out the possibility of future residents’ food consumption deviating from the past trajectory trend. Due to the limited availability of data, we were unable to take into consideration the subnational heterogeneity in the impact of future food consumption on the environment. In fact, if we combine populations of different ages, genders, and income levels for subnational-scale research, the research results may be more rich and accurate. Future population aging in China is anticipated, and this study does not address the substantial environmental effects that this fast population aging and changing eating habits are likely to have. The impacts of technological progress, international food trade, agricultural land conversion, and changes in food waste were not considered here. Future studies should address these problems. Our evaluations of the environmental benefits of alternative pathways of Chinese dietary choice are not meant to imply that they might be similarly attainable or feasible in the future.

5. Conclusions and Policy Implications

Numerous significant insights can be drawn from our analysis, which can be summed up as follows:
(1)
Overall, the combination of food consumption trends and urban–rural population mobility may bring pressure to the future domestic food supply. China’s agricultural supply should pay more attention to the production of livestock products and the guarantee and adequacy of feed supply as well as the issue of meat product import trade.
(2)
This research indicated that the burden of the dietary environment in China will further increase in the future, especially in urban areas, but rural areas will significantly decrease with a decrease in population size, based on the premise of maintaining the current dietary development trend. Fortunately, the negative population growth in China in the medium to long term will have a restraining effect on it.
(3)
Based on the current impact of the dietary environment in China, the three alternative dietary scenarios will significantly reduce the overall burden of the dietary environment in the future. The Chinese Dietary Pagoda is an optional dietary scenario that reflects the dietary preferences of Chinese residents. According to the Chinese Dietary Pagoda scenario, urban inhabitants’ overall dietary carbon emissions will be lower than the benchmark level in the future, while their demand for arable land and water will be higher than the benchmark level.
(4)
In addition to accelerating the progress of agricultural technology, improving agricultural productivity, continuing to build high-standard farmland, expanding the development of grassland agriculture and marine agriculture, and actively utilizing the international market to moderately import feed grains can help alleviate the environmental pressure of future food demand. At the same time, guiding the public to reduce food loss and waste is also beneficial for reducing environmental impacts.

Author Contributions

H.S.: Conceptualization, Methodology, Writing—Original draft preparation. B.Z.: Data curation, Visualization, Writing—Reviewing and Editing. Q.C.: Writing, Reviewing, and Editing. All authors have read and agreed to the published version of the manuscript.

Funding

This research was funded by the National Natural Science Foundation of China [grant numbers 71861026], the Science and Technology Plan Project of Gansu Province [grant numbers 23JRZA443].

Institutional Review Board Statement

Not applicable.

Informed Consent Statement

Not applicable.

Data Availability Statement

All data in the paper come from the National Bureau of Statistics of China, FAOSTAT (https://www.fao.org/faostat/en), and “World Urbanization Outlook: 2018 Revised Edition”. Please refer to the second paragraph in Section 2 for details. In addition, if needed, interested readers can obtain all the data from the corresponding author.

Conflicts of Interest

The authors declare no conflict of interest.

References

  1. Shenggen, F.; Wenjin, L.; Xiaolong, F.; Wei, S.; Yu, S. The UN Food Systems Summit and Chinese Strategy. Issues Agric. Econ. 2022, 3, 4–16. [Google Scholar]
  2. Marlow, H.J.; Hayes, W.K.; Soret, S.; Carter, R.L.; Schwab, E.R.; Sabate, J. Diet and the environment: Does what you eat matter? Am. J. Clin. Nutr. 2009, 89, 1699S–1703S. [Google Scholar] [CrossRef] [PubMed]
  3. Jiang, L.; Seto, K.C.; Bai, J. Urban economic development, changes in food consumption patterns and land requirements for food production in China. China Agric. Econ. Rev. 2015, 7, 240–261. [Google Scholar] [CrossRef]
  4. Hawkins, J.; Ma, C.; Schilizzi, S.; Zhang, F. China’s changing diet and its impacts on greenhouse gas emissions: An index decomposition analysis. Aust. J. Agric. Resour. Econ. 2017, 62, 45–64. [Google Scholar] [CrossRef]
  5. Zhen, L.; Du, B. Ecological Footprint Analysis Based on Changing Food Consumption in a Poorly Developed Area of China. Sustainability 2017, 9, 1323. [Google Scholar] [CrossRef]
  6. Zhang, Y.; Tian, Q.; Hu, H.; Yu, M. Water Footprint of Food Consumption by Chinese Residents. Int. J. Environ. Res. Public Health 2019, 16, 3979. [Google Scholar] [CrossRef]
  7. He, G.; Geng, C.; Zhai, J.; Zhao, Y.; Wang, Q.; Jiang, S.; Zhu, Y.; Wang, L. Impact of food consumption patterns change on agricultural water requirements: An urban-rural comparison in China. Agric. Water Manag. 2021, 243, 106504. [Google Scholar] [CrossRef]
  8. Su, B.; Zhang, C.; Martens, P.; Cao, X. A comparative study on the dietary ecological footprint in contemporary China. Sci. Total Environ. 2022, 851, 158289. [Google Scholar] [CrossRef]
  9. Zhang, H.; Xu, Y.; Lahr, M. The greenhouse gas footprints of China’s food production and consumption (1987–2017). J. Environ. Manag. 2022, 301, 113934. [Google Scholar] [CrossRef]
  10. China Agricultural University (AGFEP) Academy of Global Food Economics and Policy; Zhejiang University (CARD) China Academy for Rural Development; Nanjing Agricultural University (CIFAE) Centre for International Food and Agricultural Economics; Chinese Academy of Agricultural Sciences (IAED) Institute of Agricultural Economics and Development; International Food Policy Research Institute (IFPRI). 2021 China and Global Food Policy Report: Rethinking AGRIFOOD systems for the Post-COVID World; China Agricultural University (AGFEP): Beijing, China, 2021. [Google Scholar]
  11. Liangjie, X.I.N.; Biesbroek, S.; Jiayue, W.; Lixin, W. Prospect of per capita grain demand driven by dietary structure change in China. Resour. Sci. 2015, 37, 1347–1356. [Google Scholar]
  12. Hua-jun, T.; Zhe-min, L.I. Study on Per Capita Grain Demand Based on Chinese Reasonable Dietary Pattern. Sci. Agric. Sin. 2012, 45, 2315–2327. [Google Scholar]
  13. Tilman, D.; Clark, M. Global diets link environmental sustainability and human health. Nature 2014, 515, 518–522. [Google Scholar] [CrossRef]
  14. Mekonnen, M.; Hoekstra, A.Y. National Water Footprint Accounts: The Green, Blue and Grey Water Footprint of Production and Consumption; Unesco-IHE Institute for Water Education: Delft, The Netherlands, 2011. [Google Scholar]
  15. Cai, H.; Biesbroek, S.; Wen, X.; Fan, S.; van ’t Veer, P.; Talsma, E.F. Environmental footprints of Chinese foods and beverages: Literature-based construction of a LCA database. Data Brief 2022, 42, 108244. [Google Scholar] [CrossRef]
  16. Chaudhary, A.; Gustafson, D.; Mathys, A. Multi-indicator sustainability assessment of global food systems. Nat. Commun. 2018, 9, 848. [Google Scholar] [CrossRef]
  17. Berners-Lee, M.; Hoolohan, C.; Cammack, H.; Hewitt, C.N. The relative greenhouse gas impacts of realistic dietary choices. Energy Policy 2012, 43, 184–190. [Google Scholar] [CrossRef]
  18. Davis, K.F.; Gephart, J.A.; Emery, K.A.; Leach, A.M.; Galloway, J.N.; D’Odorico, P. Meeting future food demand with current agricultural resources. Glob. Environ. Chang. 2016, 39, 125–132. [Google Scholar] [CrossRef]
  19. Martinez-Gonzalez, M.A.; Hershey, M.S.; Zazpe, I.; Trichopoulou, A. Transferability of the Mediterranean Diet to Non-Mediterranean Countries. What Is and What Is Not the Mediterranean Diet. Nutrients 2017, 9, 1226. [Google Scholar] [CrossRef]
  20. Trichopoulou, A.; Martinez-Gonzalez, M.A.; Tong, T.Y.N.; Forouhi, N.G.; Khandelwal, S.; Prabhakaran, D.; Mozaffarian, D.; de Lorgeril, M. Definitions and potential health benefits of the Mediterranean diet: Views from experts around the world. BMC Med. 2014, 12, 112. [Google Scholar] [CrossRef]
  21. Willett, W.; Rockström, J.; Loken, B.; Springmann, M.; Lang, T.; Vermeulen, S.; Garnett, T.; Tilman, D.; DeClerck, F.; Wood, A.; et al. Food in the Anthropocene: The EAT–Lancet Commission on healthy diets from sustainable food systems. Lancet 2019, 393, 447–492. [Google Scholar] [CrossRef]
  22. Hirvonen, K.; Bai, Y.; Headey, D.; Masters, W.A. Affordability of the EAT-Lancet reference diet: A global analysis. Lancet Glob. Health 2020, 8, e59–e66. [Google Scholar] [CrossRef]
  23. Crippa, M.; Solazzo, E.; Guizzardi, D.; Monforti-Ferrario, F.; Tubiello, F.N.; Leip, A. Food systems are responsible for a third of global anthropogenic GHG emissions. Nat. Food 2021, 2, 198–209. [Google Scholar] [CrossRef]
  24. Wang, J.; Feng, L.; Palmer, P.I.; Liu, Y.; Fang, S.; Bösch, H.; O’Dell, C.W.; Tang, X.; Yang, D.; Liu, L.; et al. Large Chinese land carbon sink estimated from atmospheric carbon dioxide data. Nature 2020, 586, 720–723. [Google Scholar] [CrossRef]
  25. Yan, D.; Wu, S.; Tang, Y.; Zhu, J.; Zhou, S.; Xu, Z. Arable land and water footprints for food consumption in China: From the perspective of urban and rural dietary change. Sci. Total Environ. 2022, 838, 155749. [Google Scholar] [CrossRef]
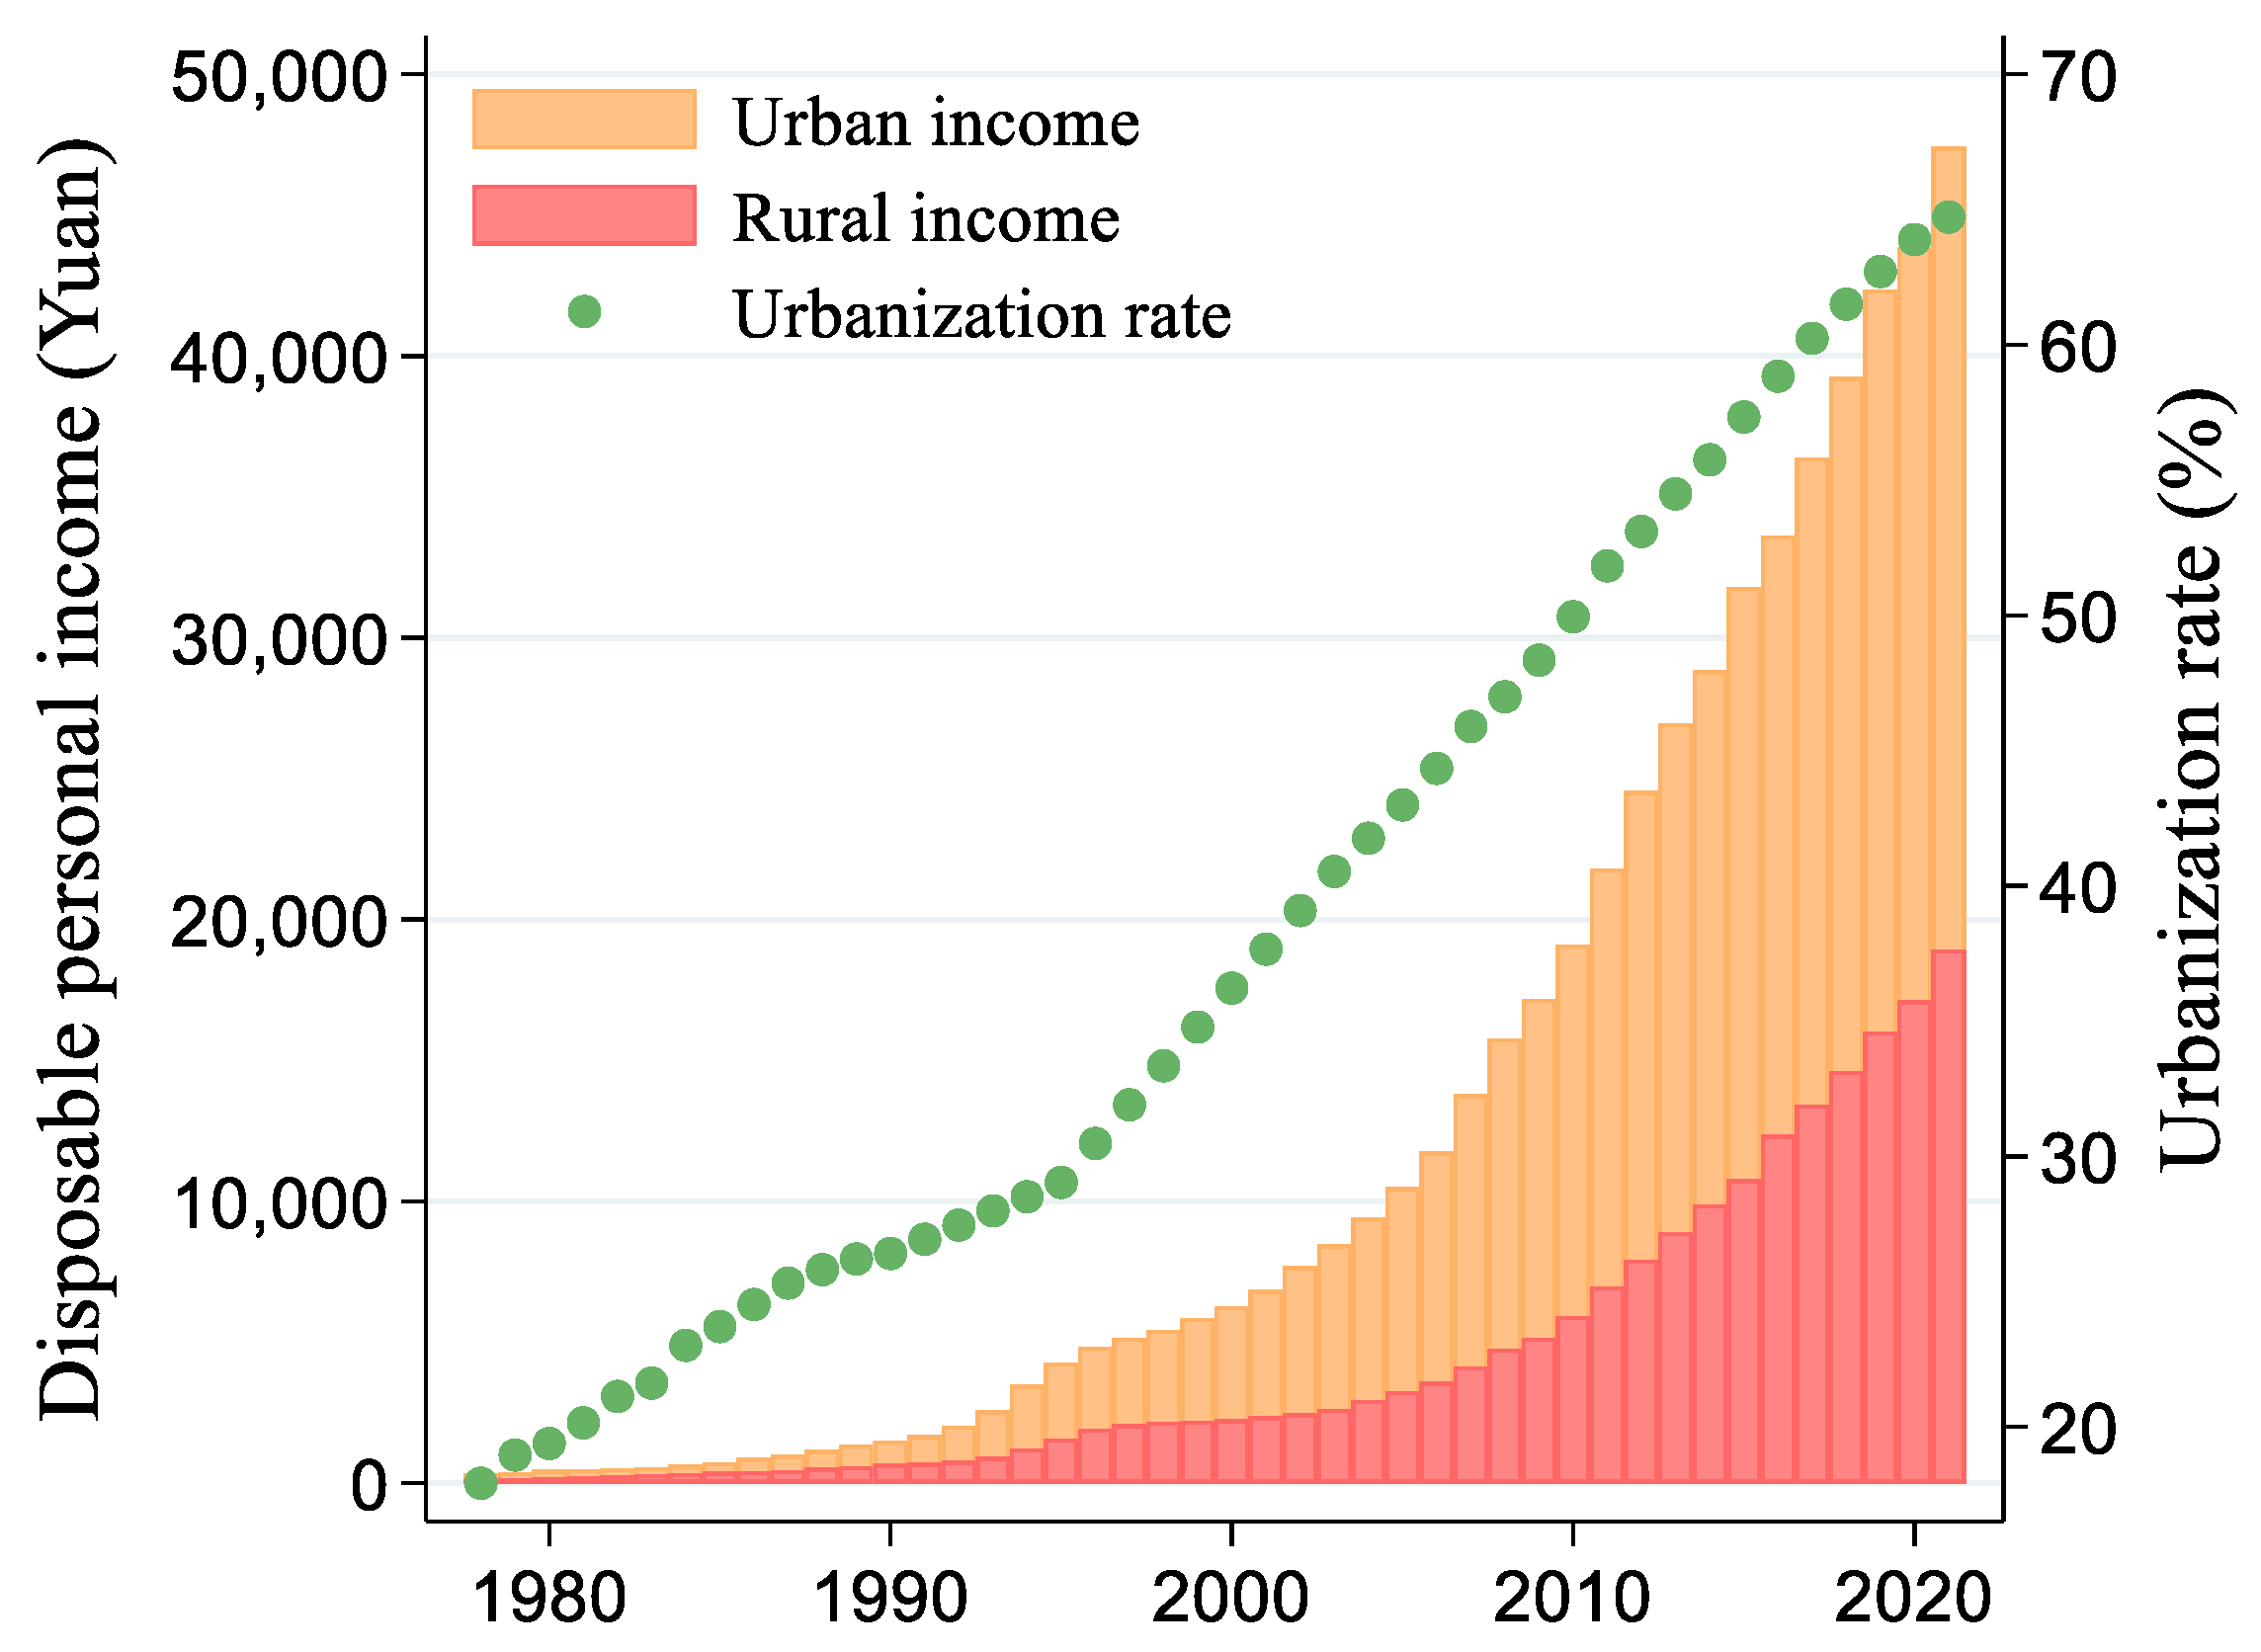
Figure 1. China’s urbanization rate and disposable income from 1978 to 2020.
Sustainability 15 13021 g001
Figure 2. Composition of per capita food consumption and its contribution to macronutrients in China from 1980 to 2020. (ad) represent food composition, energy (%), fat (%), and protein (%), respectively.
Sustainability 15 13021 g002aSustainability 15 13021 g002b
Figure 3. GHG emissions from China’s food consumption. (a) Carbon emissions per unit of food, (b) Carbon emissions from per capita food consumption, (c) Total carbon emissions from annual food consumption, (d) the total GHG gap of food consumption in different scenarios based on the current situation. Note that the red dashed line, the blue long-dashed line, the grey short-dashed line in the subfigure (b) represent the per capita GHG of food consumption in the China Pagoda scenario, EAT Lancet scenario, and Mediterranean scenario, respectively. The black short-dashed line in the subfigure (d) represents the urban-rural separation.
Sustainability 15 13021 g003
Figure 4. Water footprint of different types of food (Unit: m3/kg). (a) Green water footprint per unit of food, (b) Blue water footprint per unit of food, (c) Grey water footprint per unit of food, (d) Total water footprint per unit of food.
Sustainability 15 13021 g004
Figure 5. Water footprint from food consumption in China. (a) Water footprint of per capita food consumption, (b) Total water footprint of annual food consumption.
Sustainability 15 13021 g005
Figure 6. Water footprint gap from China’s food consumption in 2030 (2050). (a) Green water footprint gap, (b) Blue water footprint gap, (c) Grey water footprint gap, (d) Total water footprint gap. Note that the black short-dashed line in the subfigure (ad) represents the urban-rural separation.
Sustainability 15 13021 g006
Figure 7. Arable land requirement of food consumption in China. (a) Arable land requirement per unit of food, (b) Arable land requirement per capita, (c) Total arable land requirement, (d) Arable land gap. Note that the red dashed line, the blue long-dashed line, the grey short-dashed line in the subfigure (b) represent the arable land requirement per capita in the China Pagoda scenario, EAT Lancet scenario, and Mediterranean scenario, respectively. The black short-dashed line in the subfigure (d) represents the urban-rural separation.
Sustainability 15 13021 g007
Table 1. Prediction of per capita food intake for Chinese residents in the future.
DietCurrentIncome-Dependence 2030Income-Dependence 2050
(kg cap−1 yr−1)UrbanRuralUrbanRuralUrbanRural
Cereals146.8188.7127.6 146.7 126.5145.5
Beans15.614.112.6 14.7 12.617.1
Dairy21.610.627.3 16.5 28.918.5
Vegetable Oil11.911.912.5 15.5 12.619.6
Eggs16.913.920.8 18.6 24.225.8
Seafood23.714.737.0 18.8 45.625
Beef 7.54.210.4 5.3 12.26.5
Pork27.123.138.2 35.8 41.943.1
Poultry18.617.732.2 24.7 43.938.3
Vegetables131.7111.498.8 104.6 89.2104.6
Fruits70.744.385.6 69.5 94.384.1
Total492.2454.6503.1 470.9 531.9528.2
Table 2. GHG emissions of per food category in China (Unit: Mt CO2 eq.).
Food Item202020302050
UrbanRuralUrbanRuralUrbanRural
Cereals45.1023 32.7672 43.8253 20.9663 46.6242 13.3833
Beans0.9514 0.4860 0.8596 0.4166 0.9219 0.3122
Dairy6.5868 1.8269 9.3144 2.3437 10.5722 1.6890
Vegetable Oil15.4456 8.7297 18.1725 9.3826 19.6189 7.6162
Eggs12.5043 5.8127 17.2522 6.3978 21.4800 5.7150
Seafood37.2906 13.0726 65.0316 13.7912 86.0724 11.7766
Beef and Mutton106.0991 33.5811 164.3046 34.8729 207.0421 27.5291
Pork129.4857 62.3820 204.2485 79.6428 240.1678 61.6535
Poultry39.6493 21.3251 76.7939 24.5163 112.2626 24.4427
Vegetables40.9375 19.5711 34.3618 15.1244 33.2620 9.7341
Fruits5.8596 2.0752 7.9386 2.6786 9.3759 2.0868
Table 3. Arable land meeting per capita food consumption in China (Unit: m2).
Food ItemCurrent ValueIncome-DependenceThree Alternative Diets
202020302050MediterraneanEAT–LancetPagoda
UrbanRuralUrbanRuralUrbanRural
Cereals257 330 223 257 221 255 166180208
Beans15 13 12 14 12 16 172610
Dairy46 23 58 35 62 40 195195235
Vegetable Oil73 73 77 95 77 120 10410461
Eggs28 23 34 31 40 43 17826
Seafood120 75 188 96 232 127 13251107
Beef and Mutton179 100 247 126 290 155 487171
Pork99 85 140 132 154 158 71144
Poultry60 57 103 79 140 123 193522
Vegetables149 126 112 118 101 118 247124165
Fruits68 43 82 67 91 81 887096
Total1093 947 1277 1049 1420 1235 10418761047
Table 4. Arable land meeting per category food consumption in China (Unit: 106 ha).
Food ItemCurrent ValueIncome-Dependence
202020302050
UrbanRuralUrbanRuralUrbanRural
Cereals23.1776 16.8387 22.521410.7743 23.9597 6.8775
Beans1.3371 0.6830 1.20800.5855 1.2955 0.4388
Dairy4.1703 1.1567 5.89731.4839 6.6937 1.0693
Vegetable Oil6.5813 3.7197 7.74333.9979 8.3596 3.2453
Eggs2.5158 1.1695 3.47111.2872 4.3217 1.1498
Seafood10.8622 3.8079 18.94274.0172 25.0716 3.4303
Beef and Mutton16.1043 5.0971 24.93915.2932 31.4260 4.1785
Pork8.9730 4.3229 14.15395.5191 16.6430 4.2724
Poultry5.3699 2.8882 10.40063.3204 15.2043 3.3104
Vegetables13.4267 6.4189 11.27004.9605 10.9093 3.1926
Fruits6.1234 2.1686 8.29602.7992 9.7980 2.1807
Total98.6417 48.2712 128.843344.0383 153.6823 33.3458
Disclaimer/Publisher’s Note: The statements, opinions and data contained in all publications are solely those of the individual author(s) and contributor(s) and not of MDPI and/or the editor(s). MDPI and/or the editor(s) disclaim responsibility for any injury to people or property resulting from any ideas, methods, instructions or products referred to in the content.