Abstract
Buton rock asphalt (BRA) has been used in asphalt pavement for its contribution to high-temperature stability. However, how BRA affects the durability of a corresponding asphalt mixture requires systemic discussion. This study investigated how BRA affected durability in terms of the fatigue resistance, thermo-oxidative aging resistance, and long-term moisture stability of asphalt mixture. Furthermore, improvement of the long-term moisture stability of asphalt mixture containing BRA modified asphalt (BRAM) was also included. An AC-20C asphalt mixture based on BRA asphalt, neat asphalt, and SBS-modified asphalt were prepared and their high-temperature, low-temperature, and moisture performance were examined. A semi-circular bending cyclic loading test was used to characterize fatigue performance. Thermo-oxidative aging tests in both the short-term and long-term were used to indicate the aging performance. Freeze–thaw cyclic splitting tests were carried out to investigate BRAM’s long-term moisture stability. Finally, the optimization and enhancement of BRAM’s long-term moisture stability was discussed in terms of ceramic, basalt, and polyester fiber, as well as hydrated lime. Results showed that BRA can enhance the high-temperature, low-temperature, and moisture performance of BRAM. The cracking fatigue resistance and thermo-oxidative aging resistance of BRAM were also improved by BRA. The long-term moisture stability of BRAM was lower than that of the asphalt mixture based on SBS and neat asphalt. It was found that the long-term moisture durability of BRAM can be optimally enhanced by replacing mineral filler with 50% hydrated lime by equal volume and using 0.2wt% ceramic fiber as an additive in BRAM.
1. Introduction
Buton rock asphalt (BRA), whose composition and properties are relatively stable, was produced from Buton Island, Indonesia. Its general asphalt content is between 20 and 30% [1]. Bulgis et al. [2] found that the compressive strength of a BRA-infused asphalt mixture was higher than that of an asphalt mixture without modifiers. BRA has been regarded as a potential modifier for asphalt owing to its enhancement of asphalt and its low cost, considering the huge demand for modified asphalt in pavement construction [3].
Previous studies showed that BRA-modified asphalt mixture (BRAM) exhibited a superior pavement performance to that of an unmodified asphalt mixture. Lv et al. [4] reported that asphalt in BRA was able to considerably improve the high-temperature performance of asphalt mixture, but its low-temperature performance was slightly reduced. Zou and Wu [5] concluded that BRA-modified asphalt mixture has a better rutting performance. Suaryana [6] investigated the performance of stone matrix asphalt (SMA) using BRA as a stabilizer. BRA could behave as a stabilizer because the penetration grade of BRA asphalt is relatively lower, resulting in an increased viscosity of the binder. The addition of BRA also improves the performance of the SMA mixture, as shown with increasing in the value of dynamic stability. Li et al. [7] concluded that BRAM using modified asphalt with 30% BRA achieved the optimal performance. Li et al. [3] confirmed that rock asphalt can reduce the thermo-oxidative aging rate of asphalt mixture based on long-term thermo-oxidative aging.
However, there is a lack of detailed reports on the change rule in the pavement performance of BRAM in long-term service, although existing studies point out that BRA has certain advantages in strengthening asphalt mixtures. Fatigue of asphalt mixtures, thermo-oxidative aging, and the long-term moisture stability of BRAM were less involved. Chuang and Huang [8,9] evaluated the durability performance of modified asphalt through thermo-oxidative aging. Bai et al. [10] used the R-SCB test to evaluate the fatigue cracking performance of asphalt mixtures. Durability against fatigue cracking has been one of the major concerns in pavement design, construction, and performance [11]. Xiao et al. [12] concluded that the asphalt mixtures after short-term aging exhibited better moisture resistance; the asphalt became deteriorated but the long-term aging of asphalt can exacerbate moisture damage. Zou and Wu [5] evaluated the moisture stability performance of BRAM, and results showed that BRAM has a similar moisture stability to that of SBSM, but little research has been conducted on the long-term moisture stability of BRAM. As a consequence, a systemic study on how BRA affects an asphalt mixture’s durability has not been conducted, which hinders the application of BRA in asphalt pavement. This study focused on the evaluation of BRAM’s durability regarding fatigue resistance, thermo-oxidative aging resistance, and long-term moisture stability. It was supposed to provide technical support for the long-term service performance of BRAM.
On the other hand, BRAM was found to show an inadequate low-temperature performance and inadequate thermal cracking resistance, which may lower its long-term pavement performance. Thereby, the development of BRAM’s long-term moisture durability was also included in this study, which will help to enhance its long-term pavement performance and, consequentl, y extend its service life. Yang et al. [13] found that using lignin fibers and glass fibers as additives can enhance the low-temperature performance and high-temperature performance of asphalt mixtures. Tanzadeh and Shahrezagamasaei [14] pointed out that the best rutting performance of porous asphalt mixtures was enhanced by blending 0.2 wt% glass fiber with 0.3 wt% polypropylene. Wan et al. [15] used CF as an additive in the preparation of asphalt mastic and characterized various aspects of its performance. The results proved that incorporation of CF effectively increased the composite modulus of asphalt and helped to improve the strength of asphalt mixtures.
Hydrated lime (HL) is known as a filler and an additive for asphalt mixtures [16]. Rasouli et al. [17] investigated the effect of lime amount on the fatigue properties of asphalt mixtures with long-term thermo-oxidative aging. Results showed that the fatigue life of asphalt mixture was sensitive to its HL content, and specimens containing 1.5% HL showed the most fatigue life improvement. Gundla et al. [18] found a higher fatigue resistance in aged mixtures when lime was used. Little and Epps [19] reported that applications of HL improved the stiffness of an asphalt binder and mixture, as well as the resistance to fracture at low temperatures. HL is also used as an antistripping additive, which is expected to improve the bond between asphalt binder and aggregates [20,21] and further promotes the asphalt mixture’s moisture stability. To conclude, using fibers and HL can be an effective approach to enhancing BRAM’s long-term moisture stability.
In summary, this study firstly characterized the mechanical performance of BRAM. Afterwards, a systematic investigation of the durability—namely the fatigue resistance, thermo-oxidative aging resistance, and long-term moisture stability—of BRAM was conducted. Asphalt mixtures based on neat asphalt and SBS-modified asphalt were used as a control group to indicate how BRA determines an asphalt mixture’s durability. Finally, additives such as fibers and HL were used to further improve BRAM’s durability in this study, in the case of BRAM’s possible deficiencies for long-term service.
2. Raw Materials and Experimental Method
2.1. Raw Material
2.1.1. Asphalt
Buton Rock Asphalt (BRA)
Figure 1 shows BRA in its natural state and in its powder form with a particle size smaller than 0.075 mm, in parts a and b, respectively. BRA composition was tested and is shown in Table 1. The optimal weight ratio of BRA powder to original neat asphalt in BRA-modified asphalt was 100%:30% after trial and error. The properties of BRA-based modified asphalt (BRA-A) are shown in Table 2.
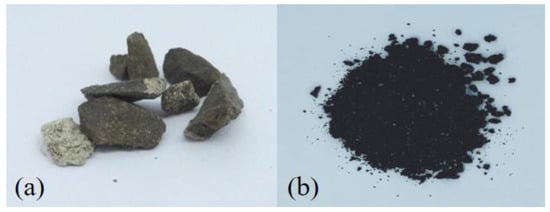
Figure 1.
BRA appearance: (a) Natural state of BRA; (b) BRA powder with a particle size smaller than 0.075 mm.

Table 1.
BRA composition.

Table 2.
Properties of BRA-based modified asphalt.
Neat and SBS-Modified Asphalt
Neat asphalt with a penetration of 60–80 and SBS-modified asphalt were used in this study. These asphalts were used to prepare corresponding asphalt mixtures which were used as a control group to investigate how BRA-A affects the durability of asphalt mixture. Their properties are shown in Table 3 and Table 4.

Table 3.
Properties of neat asphalt.

Table 4.
Properties of SBS-modified asphalt.
2.1.2. Aggregate
The aggregate used in this study was limestone, and its properties are listed in Table 5. The filler used in the asphalt mixture was lime powder, the properties of which are shown in Table 6. Aggregate and filler were collected from Hubei province.

Table 5.
Properties of limestone coarse.

Table 6.
Properties of filler.
2.1.3. Additive
Ceramic Fiber (CF)
CF is a chemically stable fiber with several advantages, including being lightweight, high-temperature resistant, and low cost. It is used to enhance asphalt mixtures by developing stiffness and strength, which may lead to higher durability and the moisture and permanent deformation resistance of asphalt pavement. To enhance the moisture stability and durability of asphalt mixture, CF was added based on the mass percentage of the mixture. The properties of CF are summarized in Table 7.

Table 7.
Properties of CF.
The microstructure of CF was observed using scanning electron microscopy. As depicted in Figure 2, CF exhibited a thin diameter and a substantial contact surface area with the asphalt, which facilitated a desirable bonding state between the fiber and the asphalt.
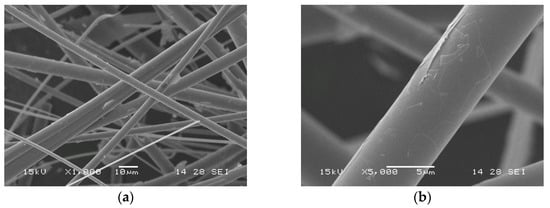
Figure 2.
(a) SEM image of CF (1000×); (b) SEM image of CF (5000×).
Basalt Fiber (BF)
This study introduced fibers as additives in the asphalt mixture mixing process. One third of the fibers were added and mixed with hot aggregate. Another 1/3 of the fibers were added and mixed when mixing with the asphalt binder, while the last 1/3 were added when mixing with fillers. Basalt fiber is an environmentally-friendly fiber material that has chemical stability, high strength, and good dispersion. Its addition to asphalt mixture can improve the corresponding performance of asphalt pavement, including its high-temperature, cracking, and fatigue resistance. The properties of BF are summarized in Table 8.

Table 8.
Properties of BF.
Polyester Fiber (PF)
PF is a synthetic fiber obtained by spinning polyester, which is condensed from organic dicarboxylic acids and diols. It offers advantages such as high strength and resilience, which can enhance a mixture’s resistance to high-temperature deformation and delay the development of reflection cracks. The properties of PF are summarized in Table 9. The microstructure of polyester fibers was observed using scanning electron microscopy, as shown in Figure 3; this illustrates that the micro-appearance of PF was smoother than that of CF.

Table 9.
Properties of PF.
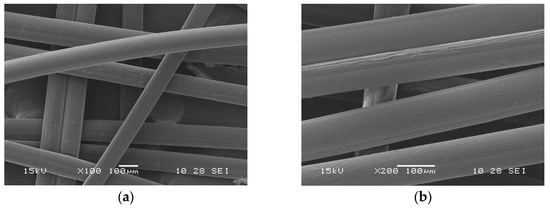
Figure 3.
(a) SEM image of PF (100×); (b) SEM image of PF (200×).
Hydrated Lime (HL)
HL can improve adhesion between asphalt aggregates due to its alkalinity, so the fatigue, moisture, and low-temperature cracking resistance of asphalt mixtures was also presumed to be increased. This study used it as filler, instead of mineral powder, for enhancing the asphalt mixture’s long-term moisture stability. The properties of HL are shown in Table 10.

Table 10.
Properties of HL.
2.2. Research Program
An outline of this study is illustrated in Figure 4. This study can be divided into three aspects: the preparation and performance of BRAM, durability evaluation, and long-term moisture stability improvement. Firstly, raw materials were characterized. ACM, BRAM, and SBSM were, respectively, designed and prepared. Their pavement performance, including moisture, low-temperature cracking, and high-temperature performance were tested. Afterwards, durability performance in terms of the fatigue, thermo-oxidative aging, and long-term moisture stability of the asphalt mixtures were investigated and analyzed. The third part of this study tried to address the problem of BRAM’s poor long-term moisture stability, which was found during the durability analysis. A composite modification method that substituted mineral powder with HL and used fiber materials as an additive in BRAM was introduced and discussed. The optimal ratio of composite material composition was quantitatively studied by using freeze–thaw splitting tests. Finally, the pavement performance of the enhanced BRAM was verified to secure the rationality of the corresponding composite modification method.
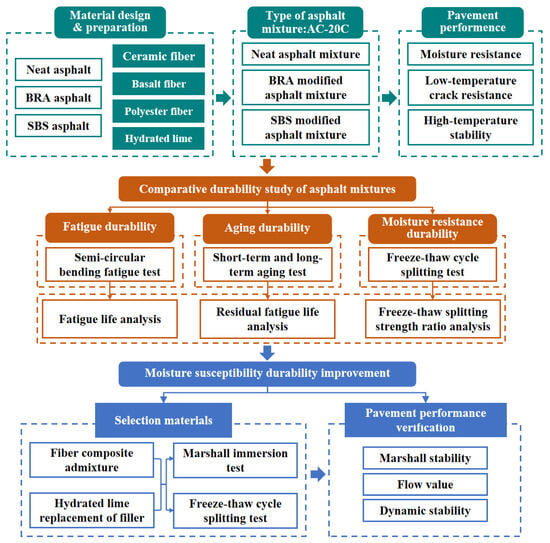
Figure 4.
Outline of this study.
2.3. Gradation Design
An AC-20C mixture was designed and prepared in this study. Figure 5 presents the gradation of the AC-20C asphalt mixture for all kinds of asphalt mixtures. Their mass ratio of asphalt and aggregate was 4.4% regardless of asphalt type.
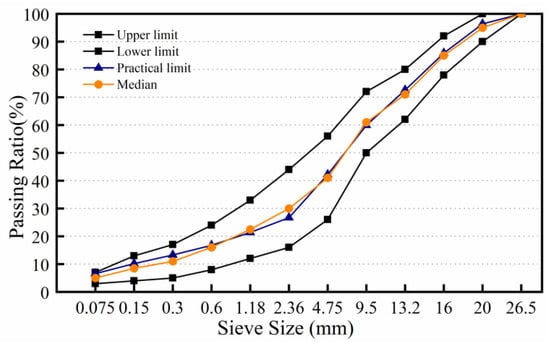
Figure 5.
Gradation curve of AC-20C mixture.
2.4. Experimental Method
2.4.1. High-Temperature Stability
Rutting tests were used to imply the high-temperature stability performance of BRAM. High-temperature performance was evaluated by dynamic stability (DS). DS refers to the number of times a test wheel travels for each 1mm of rutting produced after rutting plate specimen deformation enters a stabilization period at 60 °C. The high-temperature performance of the asphalt mixture was tested according to JTG E20-2011 [23]. DS was calculated by Equation (1):
where:
DS: dynamic stability of asphalt mixture, cycles/mm;
, : test time, normally 45 and 60 min;
, : deformation of specimen surface corresponding to specimens t1 and t2, mm;
, : correction coefficient of test machine or specimen, dimensionless;
N: rolling speed of test wheel round-trip, 42 cycles/min.
2.4.2. Low-Temperature Crack Resistance
The fracture strength of BRA was evaluated using the fracture strength of the semicircular bending test (SCB). The SCB specimen was approximately 30 mm in height and 150 mm in diameter, with a notch depth of 3 mm in middle of its bottom, and was cut from an SGC specimen. A universal testing machine (UTM-100) was used to conduct the SCB test. SCB specimens were first placed in a thermostat at −10 °C for 3 ± 0.5 h to ensure the temperature uniformity of specimens from external to internal. The loading rate of the principal axis was 0.05 mm/min, and it would stop when the SCB specimen fractured. Equations (2) and (3) explain the calculation of the fracture toughness of SCB specimens:
where:
KIC: fracture strength (MPa × m0.5);
YI: experimental constant;
PC: maximum load (N);
r: radius of the semicircular specimen (m);
t: the thickness of the specimen (m);
a: length of the open seam (m).
2.4.3. Moisture Stability
The moisture stability of the BRA-modified asphalt mixture was studied by using the Marshall immersion test and the freeze–thaw splitting test. The residual Marshall stability (MSR0) of the Marshall immersion test refers to the residual stability performance after immersion in water at 60 °C for 48 h. Freezing-thawing split-strength (TSR) reflects the asphalt mixture’s residual strength after freeze–thaw. MSR0 and TSR of asphalt mixtures were characterized according to JTG E20-2011. MSR0 and TSR were calculated by Equations (4) and (5):
where:
MSR0: the average residual stability of specimen in moisture, %;
MSR1: the average stability of specimen in immersion at 60 °C for 48 h, kN;
MSR: the average stability of specimen in moisture at 60 °C for 30 min, kN.
where:
TSR: freeze–thaw splitting test strength ratio, %;
RT2: splitting tensile strength of specimens after freeze–thaw, MPa;
RT1: splitting tensile strength of specimens without freeze–thaw, MPa.
2.4.4. Fatigue Durability
Repeated loading semi-circular bending (R-SCB) tests were employed based on SGC specimens. UTM-100 was also used and its semi-sinusoidal loading mode was applied at a frequency of 2 Hz. It was found that the difference in the fatigue life of samples under different factors showed more statistical significance when the frequency was 2 Hz after trial and error. Specimens were kept in a temperature control box for 5 h to ensure the temperature uniformity of specimens, and the temperature of the box was set as 25 °C before the test. The cycle number of repeated loading when the specimen failed was recorded as the corresponding fatigue life, which was used to evaluate the fatigue resistance of the asphalt mixtures. For the R-SCB test, the loading peaks were set at 40%, 50%, 60%, 70%, and 80% of the semi-circular fracture toughness (KIC) at 25 °C. Figure 6 shows the state of the R-SCB specimen before and after failure.
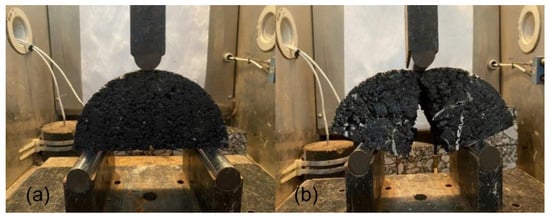
Figure 6.
(a) R-SCB specimen before failure during fatigue process. (b) R-SCB specimen after failure during fatigue process.
2.4.5. Thermo-Oxidative Aging Resistance
Continuous exposure to environmental effects such as heat, light, and oxygen during long-term service lead to aging of the asphalt mixture due to thermal and oxidative factors. Therefore, the thermo-oxidative aging resistance of asphalt pavement was also included in this study as a part of the durability investigation. This study used the aging time of mixed materials under conditions of thermal oxidation as a variable. The residual fatigue life of BRAM of various aging degrees, based on the R-SCB test, was used to assess the thermo-oxidative resistance of the corresponding asphalt mixture by aging time dependency according to JTG E20-2011.
Figure 7 shows the procedure for aging the asphalt mixture in this study. The unaged asphalt mixture was firstly compacted while the asphalt mixture was mixed and prepared. Aging owing to heat and oxygen mostly happens in an asphalt binder, which can be divided into short-term and long-term aging. Short-term aging refers to the aging that happens during heating, mixing, transporting, and paving. The short-term aging test procedure is as follows: prepare uncompacted asphalt mixtures based on different types of asphalt. Mix the uncompacted asphalt mixtures uniformly at 160 °C then place them in a ventilation oven at 135 ± 3 °C for 4 h; short-term aging is thus completed. It is emphasized that short-term aging was unchanging for all aging specimens.

Figure 7.
Process of aging the asphalt mixture.
Afterwards, specimens formed after the short-term aging were placed in a forced ventilation oven and were subjected to continuous heating for 120 ± 0.5 h at a temperature of 85 ± 3 °C. The specimens should not be touched or moved during the constant temperature heating process. Once the designated heating time is reached, the test samples are to be taken out and allowed to cool naturally for at least 16 h, until they reach room temperature. This cooling process is regarded as the long-term thermo-oxidative aging test.
After short-term thermo-oxidative aging, samples were designed and prepared in this study with long-term aging times of 72, 120, and 168 h. Asphalt mixtures with different aging times were investigated using semi-circular bending fatigue tests. The test results were fitted with a power function to obtain a fatigue curve of the residual fatigue life versus the stress intensity factor, and the residual fatigue life was used as an indicator to evaluate the degree of aging.
2.4.6. Long-Term Moisture Stability Durability
The specimens were divided into two groups: one group was placed at room temperature after molding, and the other group was soaked in water for 20 min at room temperature, then vacuumed under 98.3~98.7 kPa for 15 min to maintain moisture, followed by restoring atmospheric pressure and allowing to stand for 0.5 h. Then, the specimens were placed in a plastic bag with 10mL of water, insulated in a constant temperature freezer at −18 ℃ for 16 h, and taken out to stand at 60 °C in a constant temperature water bath for 24h after removing the plastic bag. Finally, the specimens for the current freeze–thaw cycle were taken out, all specimens were immersed in a circulating water tank at 25 °C for 2 h and were then subjected to a splitting test at a loading rate of 50 mm/min. For the study of water stability and durability, this paper designed a freeze–thaw cycle of 1, 3, 5, and 7 times. The splitting test was conducted on the specimens with different freeze–thaw cycles, and the TSR in equation 5 was used as an index to evaluate the long-term water damage degree of the material. By observing the change of TSR of different asphalt mixtures under different freeze–thaw cycles, the long-term moisture stability durability of the material could be summarized.
3. Results and Discussion
3.1. Pavement Performance
3.1.1. Low-Temperature Cracking Resistance
Figure 8 shows the fracture toughness results of SCB at −10 °C. SBSM presented the highest fracture toughness, followed by BRAM and ACM successively. They also showed the same rule in terms of fracture energy as shown in Figure 9 and illustrate that BRA enhanced the cracking resistance of asphalt mixture at a low temperature, although SBS showed higher enhancement as an asphalt modifier. It was analyzed that BRA could develop the hardness of the asphalt, which developed the rigidity of the asphalt binder at low temperatures, considering the lower penetration of BRA-based modified asphalt. Therefore, using BRA as a modifier of asphalt was supposed to be an adequate approach to increasing the asphalt mixture’s low-temperature cracking resistance.
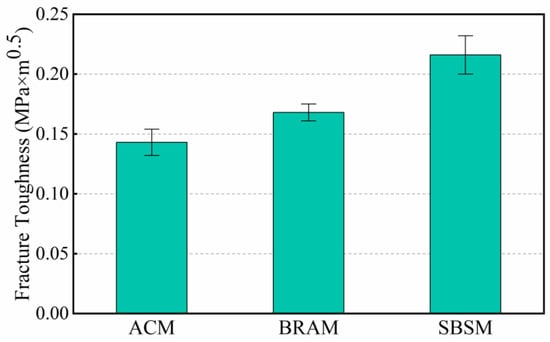
Figure 8.
SCB fracture toughness at −10 °C of ACM, BRAM, and SBSM.
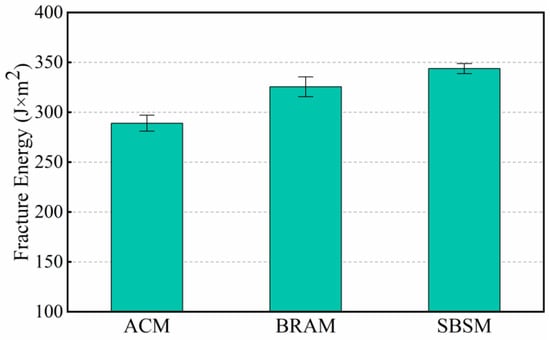
Figure 9.
SCB fracture energy at −10 °C of ACM, BRAM, and SBSM.
3.1.2. Moisture Stability
MSR0 and TSR were used as indicators for evaluating the asphalt mixtures’ moisture stability. Figure 10 and Figure 11 show the results of MSR0 and TSR, respectively. The asphalt mixtures all meet the requirements of the specification (JTG F40-2004 [28]), Technical Specification for Construction of Highway Asphalt Pavements). Both the MSR0 and TSR of BRAM were superior to those of ACM, while SBSM showed the highest MSR0 and TSR values. This revealed that BRA can improve the moisture stability of the corresponding asphalt mixture. Additionally, the tensile strength of BRAM was the highest regardless of the freeze–thaw process, proving that BRA can significantly develop an asphalt mixture’s tensile resistance, which was presumably a result of BRA’s rigidity.
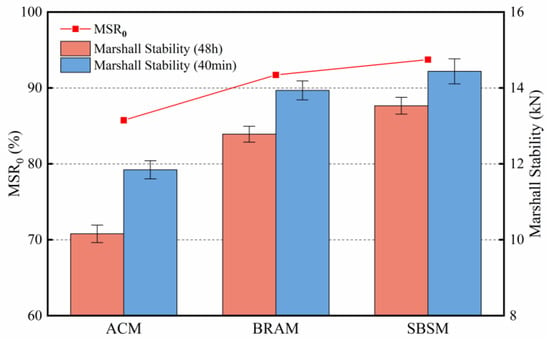
Figure 10.
MSR0 of ACM, BRAM, and SBSM.
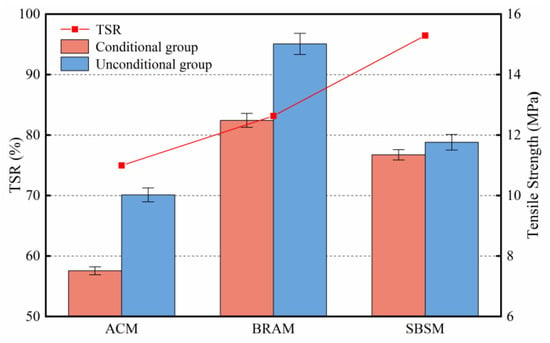
Figure 11.
TSR of ACM, BRAM, and SBSM.
3.1.3. High-Temperature Stability
Figure 12 illustrates the DS results of three asphalt mixtures, which all meet the requirements of the JTG F40-2004 specification. BRAM’s DS increased by 139% compared to the ACM, reaching 3079 cycle/mm, which met the requirements for modified asphalt mixtures. Furthermore, SBSM’s DS was over 4000 cycle/mm, suggesting the highest permanent deformation resistance at high temperatures. Considering the BRA’s improvement on the softening point and Marshall stability of BRAM, it was supposed that the stiffness of the asphalt binder in BRAM was developed due to the high strength of the asphaltene released by BRA.
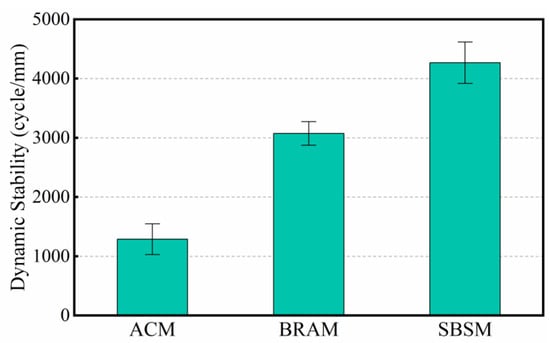
Figure 12.
DS of ACM, BRAM, and SBSM.
3.2. Durability Performance
3.2.1. Fatigue Performance
It was explained previously that the durability indicators included in this study were fatigue resistance, thermo-oxidative aging resistance, and long-term moisture stability. Above all, the test results of R-SCB were analyzed to evaluate the fatigue performance of the asphalt mixture. Fatigue Equation (6), based on repeated loading, can be described as below:
where
Nf = fatigue life (Cycle number, dimensionless);
kI = the stress intensity factor (MPa × m0.5);
K, n = the fitting constant (Dimensionless).
K is the fatigue resistance indicator. Higher K values result in higher fatigue resistance. n refers to the sensitivity of the fatigue life based on the change of loading, which is positively correlated with the mixture’s fatigue life’s sensitivity to loading change. Fatigue curves fitting the changing trend of the cycle number at various loading intensities, which were used to calculate the fatigue fitting equation, were introduced. A determination coefficient (R2) was also used to demonstrate the reliability of fitting. The value of R2 should not be less than 0.8, which determined the fitting reliability. The fitting curves of fatigue lives are shown in Figure 13, and the corresponding fitting equation is shown in Table 11.
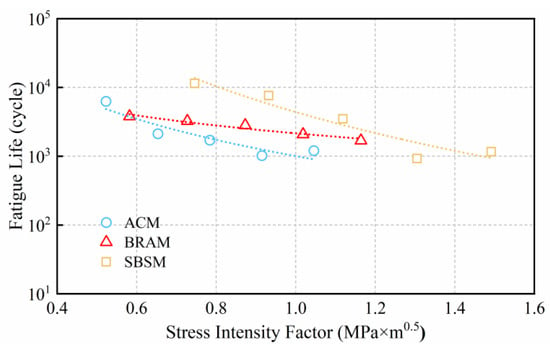
Figure 13.
Fitting curve of fatigue equation of ACM, BRAM, and SBSM.

Table 11.
Fatigue fitting equation and R2 of SBSM, BRAM, and ACM.
The R2 values in Table 12 were above 0.91, indicating that the fatigue equations were well fitted. Figure 13 shows that the fatigue life of BRAM was higher than that of ACM when the stress intensity factor was over 0.6 MPa×m0.5. Additionally, the K value of BRAM was also superior to that of ACM. This suggested that the fatigue performance of BRAM was better than that of ACM. SBSM showed the highest K value, which was supposed to have the best fatigue performance.

Table 12.
Fatigue equations and determination coefficients for asphalt mixtures with different degrees of thermo-oxidative aging time.
However, it was found that the slope of BRAM’s fitting curve was significantly lower than that of ACM and SBSM. It revealed that decreasing rate of BRAM’s fatigue life along with the increment of the stress intensity factor being lower than that of others. In addition, the n values demonstrated in the fatigue fitting equations also support that BRAM showed the lowest sensitivity to loading change compared with that of ACM and SBSM. It was analyzed that it was the component of BRA that reduced the loading change sensitivity of BRAM in fatigue [29].
Therefore, BRAM’s fatigue life was higher than that of ACM due to BRA’s enhancement, while SBSM still showed the highest fatigue life. In addition, BRAM’s lowest sensitivity to loading change was advantageous for fatigue resistance, especially under various loading intensities, compared with ACM and SBSM. To summarize, BRA’s benefit in terms of higher fatigue life and lower loading change sensitivity can effectively enhance the asphalt mixture’s fatigue performance.
3.2.2. Thermo-Oxidative Aging Durability Performance
Figure 14, Figure 15 and Figure 16 show the residual fatigue life under various thermo-oxidative aging times. Thermo-oxidative aging showed a significant reduction in specimens’ residual fatigue life. Aging time, positively corelated with aging degree, showed a negative relationship with residual fatigue life. This result also suggested that using residual fatigue life based on the R-SCB test to evaluate the asphalt mixture’s thermo-oxidative aging resistance is discriminative. It should be noted that the slopes of the fitting curves were independent of aging degree. Therefore, it was supposed that thermo-oxidative aging did not significantly change the asphalt mixtures’ sensitivity to loading change, which is presented in Table 11.
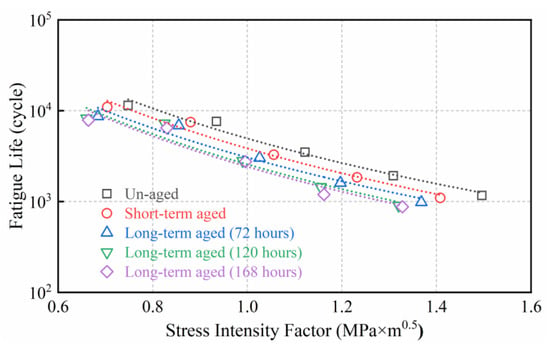
Figure 14.
Fatigue performance of SBSM.
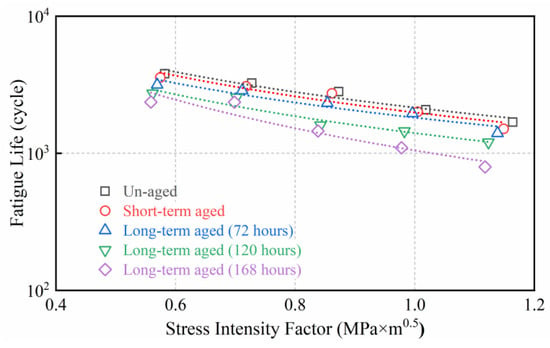
Figure 15.
Fatigue performance of BRAM.
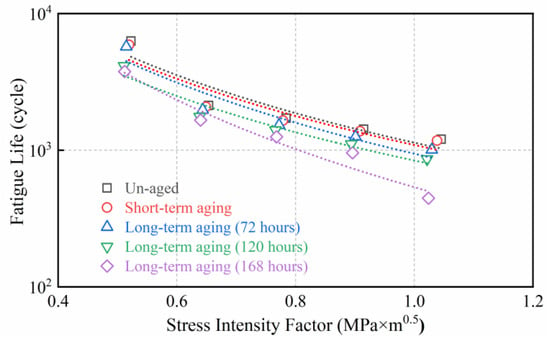
Figure 16.
Fatigue performance of ACM.
Fitting fatigue equations are shown in Table 12. The determination coefficients were above 0.82, which suggested that the fitting was adequate. The K values of asphalt mixtures showed a decreasing tendency as aging time increased, signifying a gradual loss in residual fatigue life along with deepening of the aging degree. Additionally, the K values of BRAM were also superior to those of ACM, while SBSM showed the highest K value. It also indicated that the n value of BRAM was smaller than that of the other asphalt mixtures regardless of aging time. Additionally, most n values of the asphalt mixture showed no statistical change by aging time dependency. This proved that BRAM showed the best resistance to loading change, and a longer residual fatigue life than that of ACM throughout both short-term and long-term aging.
3.2.3. Long-Term Moisture Stability Performance
TSR of the asphalt mixtures showed a decreasing trend with an increase in the number of freeze–thaw cycles as Figure 17 illustrates. SBSM showed the highest TSR regardless of freeze–thaw cycle number. BRAM showed a higher TSR than that of AC-M after the first freeze–thaw process. However, BRAM’s decreasing TSR rate along with freeze–thaw cycles was much higher than those of the other asphalt mixtures, so its TSR was lower than that of ACM when the cycle number was over 5. This revealed that BRAM showed the worst long-term moisture resistance. It was analyzed that the enhancement of BRA in terms of rigidity reduced the asphalt mixtures’ flexibility, which lowered the asphalt mixtures’ long-term resistance to frost heaving in turn. In summary, the moisture damage risk of BRAM in long-term service was higher than that of other asphalt mixtures, which certainly led to its low durability. Therefore, developing the long-term moisture resistance of BRAM was included in this study, through which the durability of BRAM can be enhanced.
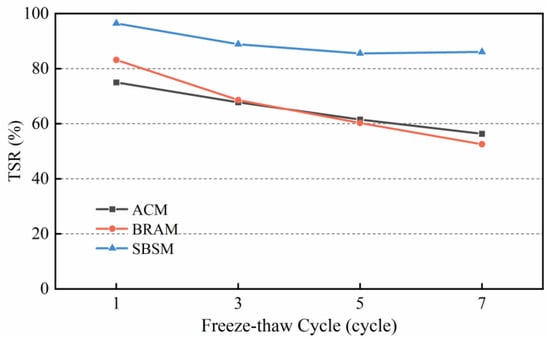
Figure 17.
TSR of freeze–thaw cycle test of three types of asphalt mixtures.
3.3. Long-Term Moisture Stability Performance Improvement
3.3.1. Effect of Fiber Type on Long-Term Moisture Stability
This study introduced fibers and hydrated lime (HL) as composite additives to achieve higher long-term moisture durability. Fibers constrain the internal structural changes of asphalt mixtures during moisture damage through reinforcement. HL was supposed to develop the adhesion between the asphalt binder and aggregate. Moisture resistance was consequently improved. Ceramic fiber (CF), basalt fiber (BF), and polymer compound polyester fiber (PF) were first characterized. These fibers were used as additives in BRAM, and their contents were set as 0.1%, 0.2%, 0.3%, and 0.4% by the asphalt mixture’s weight. MSR0 values of BRAM with fibers are presented in Table 13. MSR0 values showed no statistical correlation with fiber type or fiber content. The fibers’ contribution to BRAM’s moisture resistance was not significant, since the MSR0 value of BRAM without fiber was also over 90%. Thus, the cyclic TSR of BRAM was also applied to determine the optimal fiber.

Table 13.
MSR0 of BRAM with CF, BF, and PF.
Figure 18 illustrates the results of cyclic TSR by fiber type and content dependency. It can be seen from the results that specimens with 0.3% and 0.4% CF showed the highest TSR value after three freeze–thaw cycles, which were generally followed by specimens with PF and BF sequentially. Therefore, CF was used as an additive to enhance the long-term moisture stability of BRAM.
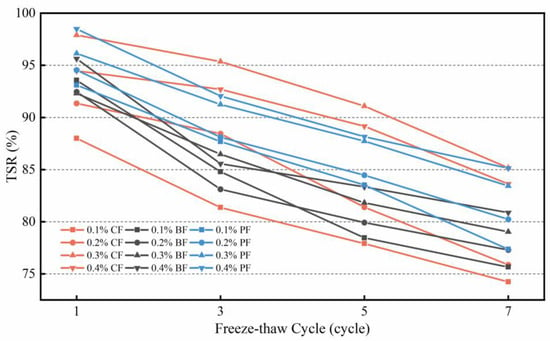
Figure 18.
TSR of BRAM with CF, BF, and PF.
3.3.2. Determination of the Optimum Composite Modification
Hydrated lime (HL) was used as a replacement for lime filler in BRAM in this study. HL’s replacement ratio for lime filler was set as 50% and 100%, and the effect of the replacement ratio on moisture resistance was individually characterized. On the other hand, the enumeration method, which combined HL replacement ratios (50% and 100%) and CF contents (0.1%, 0.2%, 0.3% and 0.4%) together, was used to figure out the optimum composite addition of HL and CF.
Table 14 illustrates the MSR0 values at different compositions. The MSR0 values of BRAM containing HL were generally higher than those of specimens with only fibers, as shown in Table 14. This preliminarily proved that using composite additives to modify the BRAM’s long-term moisture resistance was feasible. Results showed that the MSR0 of the composite modified BRAM was enhanced significantly by composite modification based on CF and HL, which was generally higher than that of SBSM.

Table 14.
MSR0 of BRAM with HL and CF.
Figure 19 shows that the TSR of the composite-modified BRAM with 100% HL was better than that of the composite-modified BRAM with 50% HL at the first freeze–thaw cycle, but showed a significant decrease with the increase in the number of freeze–thaw cycles. The TSR value of specimens with 50% HL was superior to that of specimens with 100% HL as the freeze–thaw cycle number was over three, indicating that an excessive HL replacement ratio was not positive for long-term moisture stability. Results also suggested that the TSR of composite-modified BRAM with 50% HL and 0.2% CF was the highest. On the other hand, BRAM with 50% HL and 0.2% used as few additives as possible, and was superior to other group in terms of economy. In addition, the TSR of composite-modified BRAM was better than that of SBSM after compound modification.
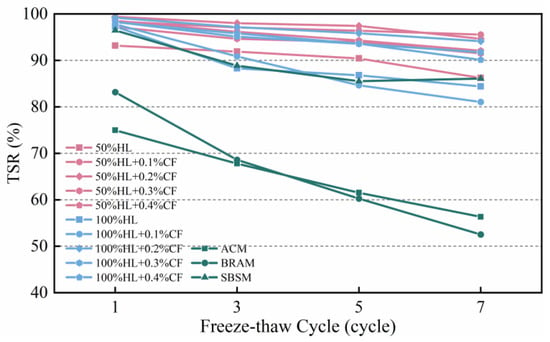
Figure 19.
TSR of BRAM with HL and CF after multiple freeze–thaw cycles.
In conclusion, the composite modification based on CF and HL could effectively improve the long-term moisture stability of BRAM. Comparing the freeze–thaw cycling tests of 10 different dosing methods of composite-modified BRAM, this study determined that the best long-term moisture stability of composite-modified BRAM was achieved when the composite modification ratio was 50% HL and 0.2% CF.
3.3.3. Pavement Performance of Composite Modified Asphalt Mixture
The pavement performance of BRAM with 50% HL and 0.2% CF was tested, and was used to verify the feasibility of optimum composite modification, considering that the effect of composite modification on pavement performance was still unclear. This study characterized the Marshall stability, flow value, and DS of composite-modified BRAM with 50% HL and 0.2% CF. As shown in Figure 20 and Figure 21, test results proved that the Marshall stability of the material was 14.56 kN, the flow value was 3.59 mm, and the DS was 3897 cycle/mm. This proved that the pavement performance of optimally modified BRAM based on 50% HL and 0.2% CF could meet the requirements. It indicated that the long-term moisture stability composite modification method adopted in this study not only enhances the long-term moisture stability of BRAM but also ensures its excellent pavement performance.
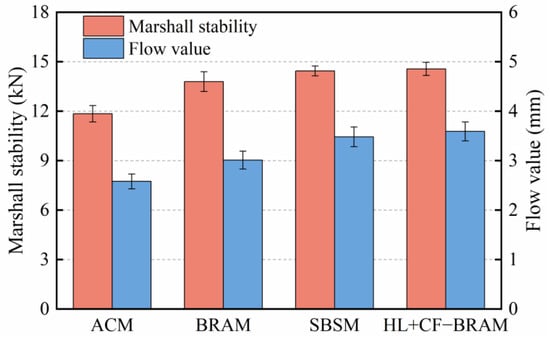
Figure 20.
Marshall stability and flow value of BRAM (50% HL and 0.2% CF), ACM, BRAM, and SBSM.
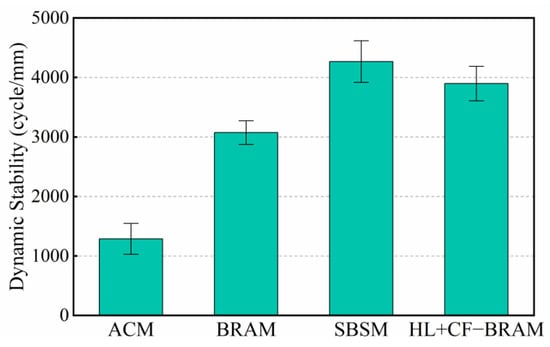
Figure 21.
DS of BRAM (50% HL and 0.2% CF), ACM, BRAM, and SBSM.
4. Conclusions
Based on the purpose of investigating the durability of Buton rock asphalt mixture (BRAM), a neat asphalt mixture (ACM) and an SBS-modified asphalt mixture (SBSM) were designed and prepared. Their cracking resistance, high-temperature stability, and moisture stability were first characterized. Then, this study focused on the durability performance of BRAM in three respects: fatigue resistance, thermo-oxidative aging resistance, and moisture stability. Finally, to address the problem of the insufficient long-term moisture stability of BRAM, an innovative composite modification of BRAM, involving the replacement of mineral powder with hydrated lime (HL) and the external addition of ceramic fiber (CF), was proposed.
- (1)
- BRAM showed a higher Marshall stability, low-temperature fracture strength, moisture stability, and dynamic stability than those of ACM. The fatigue resistance of BRAM was higher than that of ACM. The fatigue life of BRAM was significantly less sensitive to changes in stress ratio compared to both ACM and SBSM.
- (2)
- The residual fatigue life of BRAM also decayed with the gradual increase of aging time. BRAM’s sensitivity to changes in stress was lower than that of the other asphalt mixtures, and was positively correlated with aging time. As the number of freeze–thaw cycles was over five, the freeze–thaw splitting test strength ratio of BRAM was significantly lower than that of ACM.
- (3)
- BRAM with 50% HL as an equal volume replacement of mineral powder and 0.2% CF was the best in terms of long-term moisture stability. The subsequent validation tests proved that this modification of BRAM based on HL and CF not only improved the long-term moisture stability of the BRAM, but also met the requirements of pavement performance.
Author Contributions
Conceptualization, J.W. and Y.Z. (Yinglong Zhang); methodology, J.W.; software, Y.Z. (Yutong Zhou); validation, Y.Z. (Yinglong Zhang), X.H. and W.G.; formal analysis, Y.Z. (Yinglong Zhang); investigation, Y.Z. (Yutong Zhou), Y.J. and J.L.; resources, J.W.; data curation, Y.Z. (Yutong Zhou); writing—review and editing, J.W.; visualization, Y.Z. (Yinglong Zhang); supervision, X.H. and W.G.; project administration, J.W.; funding acquisition, J.W. and Z.C. All authors have read and agreed to the published version of the manuscript.
Funding
This research was funded by the National Natural Science Foundation of China (No.52108414), the Scientific Research Starting Foundation of the Wuhan Institute of Technology (No. K202021) and the Scientific Research Program of the Hubei Provincial Department of Education (B2021003).
Institutional Review Board Statement
Not applicable.
Informed Consent Statement
Not applicable.
Data Availability Statement
Not applicable.
Conflicts of Interest
The authors declare no conflict of interest.
References
- Shi, J.J.; Wu, Y.B.; Liu, J.Y.; Wen, Z. A Modification Mechanism Study of Buton Natural Rock Asphalt in a Matrix Asphalt and Asphalt Mixture; American Society of Civil Engineers: Reston, VI, USA, 2016; pp. 155–162. [Google Scholar]
- Bulgis; Tjaronge, M.W.; Adisasmita, S.A.; Hustim, M. Effect of Buton Granular Asphalt (BGA) on Compressive Stress-Strain Behavior of Asphalt Emulsion Mixture; IOP Publishing Ltd.: Bristol, UK, 2017. [Google Scholar]
- Li, R.X.; Karki, P.; Hao, P.W.; Bhasin, A. Rheological and low temperature properties of asphalt composites containing rock asphalts. Constr. Build. Mater. 2015, 96, 47–54. [Google Scholar] [CrossRef]
- Lv, S.T.; Fan, X.Y.; Yao, H.; You, L.Y.; You, Z.P.; Fan, G.P. Analysis of performance and mechanism of Buton rock asphalt modified asphalt. J. Appl. Polym. Sci. 2019, 136, 8. [Google Scholar] [CrossRef]
- Zou, G.L.; Wu, C. Evaluation of Rheological Properties and Field Applications of Buton Rock Asphalt. J. Test. Eval. 2015, 43, 11. [Google Scholar] [CrossRef]
- Suaryana, N. Performance evaluation of stone matrix asphalt using indonesian natural rock asphalt as stabilizer. Int. J. Pavement Res. Technol. 2016, 9, 387–392. [Google Scholar] [CrossRef]
- Li, Y.F.; Chen, J.; Yan, J.; Guo, M. Influence of Buton Rock Asphalt on the Physical and Mechanical Properties of Asphalt Binder and Asphalt Mixture. Adv. Mater. Sci. Eng. 2018, 7, 2107512. [Google Scholar] [CrossRef]
- Shih, C.T. Evaluating of Asphalt Additives for Improved Cracking and Rutting Resistance of Asphalt Paving Mixtures; University of Florida: Gainesville, FL, USA, 1996. [Google Scholar]
- Huang, S.C. Development of Criteria for Durability of Modified Asphalts; University of Florida: Gainesville, FL, USA, 1994. [Google Scholar]
- Bai, T.; Wu, F.; Zhang, Y.F.; Mao, C.G.; Wang, G.; Wu, Y.G.; Bai, H.; Li, Y.Y. Sulfur modification with dipentene and ethylhexyl acrylate to enhance asphalt mixture performance. Constr. Build. Mater. 2022, 343, 14. [Google Scholar] [CrossRef]
- Cao, W.; Mohammad, L.; Barghabany, P. Effect of Recycled Materials on Intermediate Temperature Cracking Performance of Asphalt Mixtures; Springer International Publishing: Cham, Switzerland, 2018; pp. 229–235. [Google Scholar]
- Xiao, R.; Huang, B.S. Moisture Damage Mechanism and Thermodynamic Properties of Hot-Mix Asphalt under Aging Conditions. ACS Sustain. Chem. Eng. 2022, 10, 14865–14887. [Google Scholar] [CrossRef]
- Yang, Q.L.; Hong, B.; Lin, J.; Wang, D.W.; Zhong, J.; Oeser, M. Study on the reinforcement effect and the underlying mechanisms of a bitumen reinforced with recycled glass fiber chips. J. Clean. Prod. 2020, 251, 12. [Google Scholar] [CrossRef]
- Tanzadeh, J.; Shahrezagamasaei, R. Laboratory Assessment of Hybrid Fiber and Nano-silica on Reinforced Porous Asphalt Mixtures. Constr. Build. Mater. 2017, 144, 260–270. [Google Scholar] [CrossRef]
- Wan, J.M.; Wu, S.P.; Xiao, Y.; Liu, Q.T.; Schlangen, E. Characteristics of Ceramic Fiber Modified Asphalt Mortar. Materials 2016, 9, 12. [Google Scholar] [CrossRef] [PubMed]
- Lesueur, D.; Petit, J.; Ritter, H.J. The mechanisms of hydrated lime modification of asphalt mixtures: A state-of-the-art review. Road Mater. Pavement Des. 2013, 14, 1–16. [Google Scholar] [CrossRef]
- Rasouli, A.; Kavussi, A.; Qazizadeh, M.J.; Taghikhani, A.H. Evaluating the effect of laboratory aging on fatigue behavior of asphalt mixtures containing hydrated lime. Constr. Build. Mater. 2018, 164, 655–662. [Google Scholar] [CrossRef]
- Gundla, A.; Medina, J.; Gudipudi, P.; Stevens, R.; Salim, R.; Zeiada, W.; Underwood, B.S. Investigation of Aging in Hydrated Lime and Portland Cement Modified Asphalt Concrete at Multiple Length Scales. J. Mater. Civ. Eng. 2016, 28, 9. [Google Scholar] [CrossRef]
- Little, D.N.; Epps, J.A. The Benefits of Hydrated Lime in Hot Mix Asphalt; National Lime Association: Arlington, VI, USA, 2001; Volume 48. [Google Scholar]
- Vishal, U.; Padmarekha, A.; Chowdary, V.; Krishnan, J.M. The viscoelastic and damage dissipation of hot mix and warm mix bituminous mixture under dry and saturated conditions. Mater. Struct. 2022, 55, 14. [Google Scholar] [CrossRef]
- Das, P.K.; Baaj, H.; Kringos, N.; Tighe, S. Coupling of oxidative ageing and moisture damage in asphalt mixtures. Road Mater. Pavement Des. 2015, 16, 265–279. [Google Scholar] [CrossRef]
- JT/T 860.5-2014; Modeifier for Asphalt Mixture-Part 5: Natural Asphalt. Ministry of Transport of the People’s Republic of China: Beijing, China, 2014.
- JTG E20-2011; Standard Test Methods of Bitumen and Bituminous Mixtures for Highway Engineering. Ministry of Transport of the People’s Republic of China: Beijing, China, 2011.
- JTG E42-2005; Test Methods of Aggregate for Highway Engineering. Ministry of Transport of the People’s Republic of China: Beijing, China, 2005.
- ASTM C131; Standard Test Method for Resistance to Degradation of Small-Size Coarse Aggregate by Abrasion and Impact in the Los Angeles Machine. American Society for Testing and Materials (ASTM): West Conshohocken, PA, USA, 2014.
- AASHTO T84; Standard Test Method for Relative Specific Gravity and Absorption of Fine Aggregate. American Association of State Highway and Transportation Officials: Washington, DC, USA, 2008.
- ASTM C117; Standard Test Method for Materials Finer than 75-μm (No. 200) Sieve in Mineral Aggregates by Washing. American Society for Testing and Materials (ASTM): West Conshohocken, PA, USA, 2003.
- JTG F40-2004; Technical Specificationfor Construction of Highway Asphalt Pavements. Ministry of Transport of the People’s Republic of China: Beijing, China, 2004.
- Lv, S.T.; Peng, X.H.; Liu, C.C.; Qu, F.T.; Zhu, X.; Tian, W.W.; Zheng, J.L. Aging resistance evaluation of asphalt modified by Buton-rock asphalt and bio-oil based on the rheological and microscopic characteristics. J. Clean. Prod. 2020, 257, 12. [Google Scholar] [CrossRef]
Disclaimer/Publisher’s Note: The statements, opinions and data contained in all publications are solely those of the individual author(s) and contributor(s) and not of MDPI and/or the editor(s). MDPI and/or the editor(s) disclaim responsibility for any injury to people or property resulting from any ideas, methods, instructions or products referred to in the content. |
© 2023 by the authors. Licensee MDPI, Basel, Switzerland. This article is an open access article distributed under the terms and conditions of the Creative Commons Attribution (CC BY) license (https://creativecommons.org/licenses/by/4.0/).