1. Introduction
An important manifestation of a country’s sustainable strategy is the establishment of the ‘national water network (NWN)’. Accelerating the construction and improvement of the NWN is conducive to enhancing water security guarantee capabilities and promoting regional coordinated development. Long-distance water diversion tunnels are key channels in the NWN and have become lifelines for many cities and regions.
Moreover, underground engineering also involves energy industries, such as mining tunnels and hydroelectric power tunnels, which are crucial for the sustainable development of countries [
1,
2,
3]. Surrounding rock stability is the critical technical target of underground engineering design and construction [
4,
5]. Surrounding rock monitoring in the construction site of underground engineering is an essential technical tool. It aims to collect dynamic information on the surrounding rock after tunnel excavation to evaluate the stability of the surrounding rock and the rationality of current supporting structure parameters [
6,
7].
First, deformation is the most prominent and external manifestation of the surrounding rock mechanics. The deformation of surrounding rock can be divided into four stages, starting from the front of the palm surface, which are the “I slow deformation stage”, “II fast deformation stage”, “III deformation mitigation stage”, and “IV basic stability stage” [
8]. The signs of stability in the surrounding rock can be considered as the rate of deformation reduction gradually approaches zero, the cumulative displacement does not exceed the limit value, and there is no obvious fracture on the surface of the initial support structure. The specific discrimination indices generally include displacement, the deformation rate, the deformation acceleration, and stability time. In China’s national norms and industry standards, such as the ‘Code for Design of Hydraulic Tunnels’ [
9], the criterion for the primary stability of surrounding rock deformation is that the surrounding rock deformation is less than 0.2 mm/d. In the case of long-term observation results, it is considered stable when the monthly average of the surrounding rock deformation is less than 0.1 mm/d during the later observation period. China’s ‘Technical Code for Highway Tunnel Construction’ stipulates that the convergence rate is 0.1–0.2 mm/d and the vault settlement rate is 0.07–0.15 mm/d, as the surrounding rock’s stability criterion [
10].
Second, the axial force of the supporting bolt can accurately represent the stress characteristics of the surrounding rock and the support capacity of the bolt. Engineering practice shows that the axial force of the supporting bolt is closely related to the stress change and the convergence deformation of the surrounding rock. In excavation and surrounding rock support, the axial force of the bolt is measured, which can not only assess the shear stress between the rod body and the contact medium, but also further analyze the current deformation state of the surrounding rock [
11,
12]. Based on the feedback from monitoring data, the design parameters of the support are corrected in real-time, which significantly impacts the optimization of the support system and improves the stability of the surrounding rock.
Third, acoustic information can also represent the state of the surrounding rock. Acoustic emission (AE) monitoring provides active information on rock mass damage [
13,
14]. Under the disturbance of external stress, local elastic–plastic energy concentration will occur within the rock mass. When the energy accumulates to a specific critical value, it will cause the generation and expansion of micro-cracks in the rock mass. It is accompanied by releasing elastic or stress waves and propagates rapidly in the surrounding rock. This elastic wave is geologically known as AE. Acoustic emission technology can monitor the generation and propagation of micro-cracks in surrounding rock continuously and in real-time to reveal the deformation and damage in the rock mass. The other is acoustic wave detection, providing passive information on rock mass damage [
15,
16]. Rock acoustic wave detection technology is an artificial method to emit acoustic waves into rocks. Due to the heterogeneity of geological conditions, the change in the surrounding rock state caused by excavation, and the heterogeneity of secondary stress distribution, different wave velocities can be obtained by acoustic wave detection.
For the above monitoring information on the different types, measuring points, and sections, identifying which information is more effective is one of the crucial tasks in underground engineering construction [
17]. The monitoring information obtained can directly represent the mechanical behavior of the surrounding rock. The obtained monitoring data must be processed and analyzed, generally including two aspects. One is reliability analysis of the monitoring data [
18,
19,
20]. Generally, the reliability of the measured values can be determined by the statistical analysis method. The average value
of a finite number of measurements is the actual value, and the mean square deviation
can also be calculated. If the difference between the current monitoring data and the contiguous measured values is greater than 3
, the current data can be considered invalid and must be eliminated. The second is regression analysis of the monitoring data [
21,
22,
23]. Curve fitting of the monitoring data is determined to obtain the time and spatial effect of the data samples and to express the state change in the surrounding rock more intuitively.
However, the general method for monitoring data processing is more limited to the preliminary analysis of the same type of monitoring data. In underground engineering design and construction, the effectiveness of various types and positions for measuring data must be understood. Determining which type of monitoring data can best represent the rock mass damage is essential for guiding the measuring points layout for safety monitoring, data analysis, and decision-making for safety management. Underground engineering develops toward deep-buried rock mass, and there are often phenomena of super-empirical situations in engineering practice [
24]. Underground rock engineering is full of complexity. It is necessary to determine which surrounding rock monitoring index more accurately reflects the surrounding rock damage state to obtain more pre-evaluation and on-site comprehensive evaluation information and improve the safety management ability of engineering construction.
Currently, there are no advanced and convenient effectiveness evaluation schemes for surrounding rock monitoring information. Machine learning (ML) is a big data analysis technology belonging to artificial intelligence (AI), which can identify the correlation between data features from multi-dimensional massive data [
7,
25,
26,
27]. This study utilizes the ML algorithm to evaluate the effectiveness of the surrounding rock monitoring information to provide a data analysis and evaluation scheme for surrounding rock monitoring, and to investigate the relationship between different monitoring information and surrounding rock damage.
The following section briefly introduces the calculation method of the volume expansion rate (VER) index for the surrounding rock. The test model based on the discrete element method (DEM) and the particular test condition design is also introduced. Then, the surrounding rock damage determination test based on a machine learning algorithm is designed and implemented.
Section 3 presents the results from the surrounding rock monitoring test. The monitoring data is reasonably preprocessed and stored as a data sample for subsequent ML-based experiments to determine surrounding rock damage. Then, a suitable classification algorithm is selected, and the effectiveness of various monitoring information is evaluated. All of the experiment results are presented in detail.
2. Materials and Methods
2.1. Calculation of VER Index
The failure of surrounding rock is regional damage, and the multi-point displacement index can better describe the regional damage characteristics than the single-point displacement index [
28,
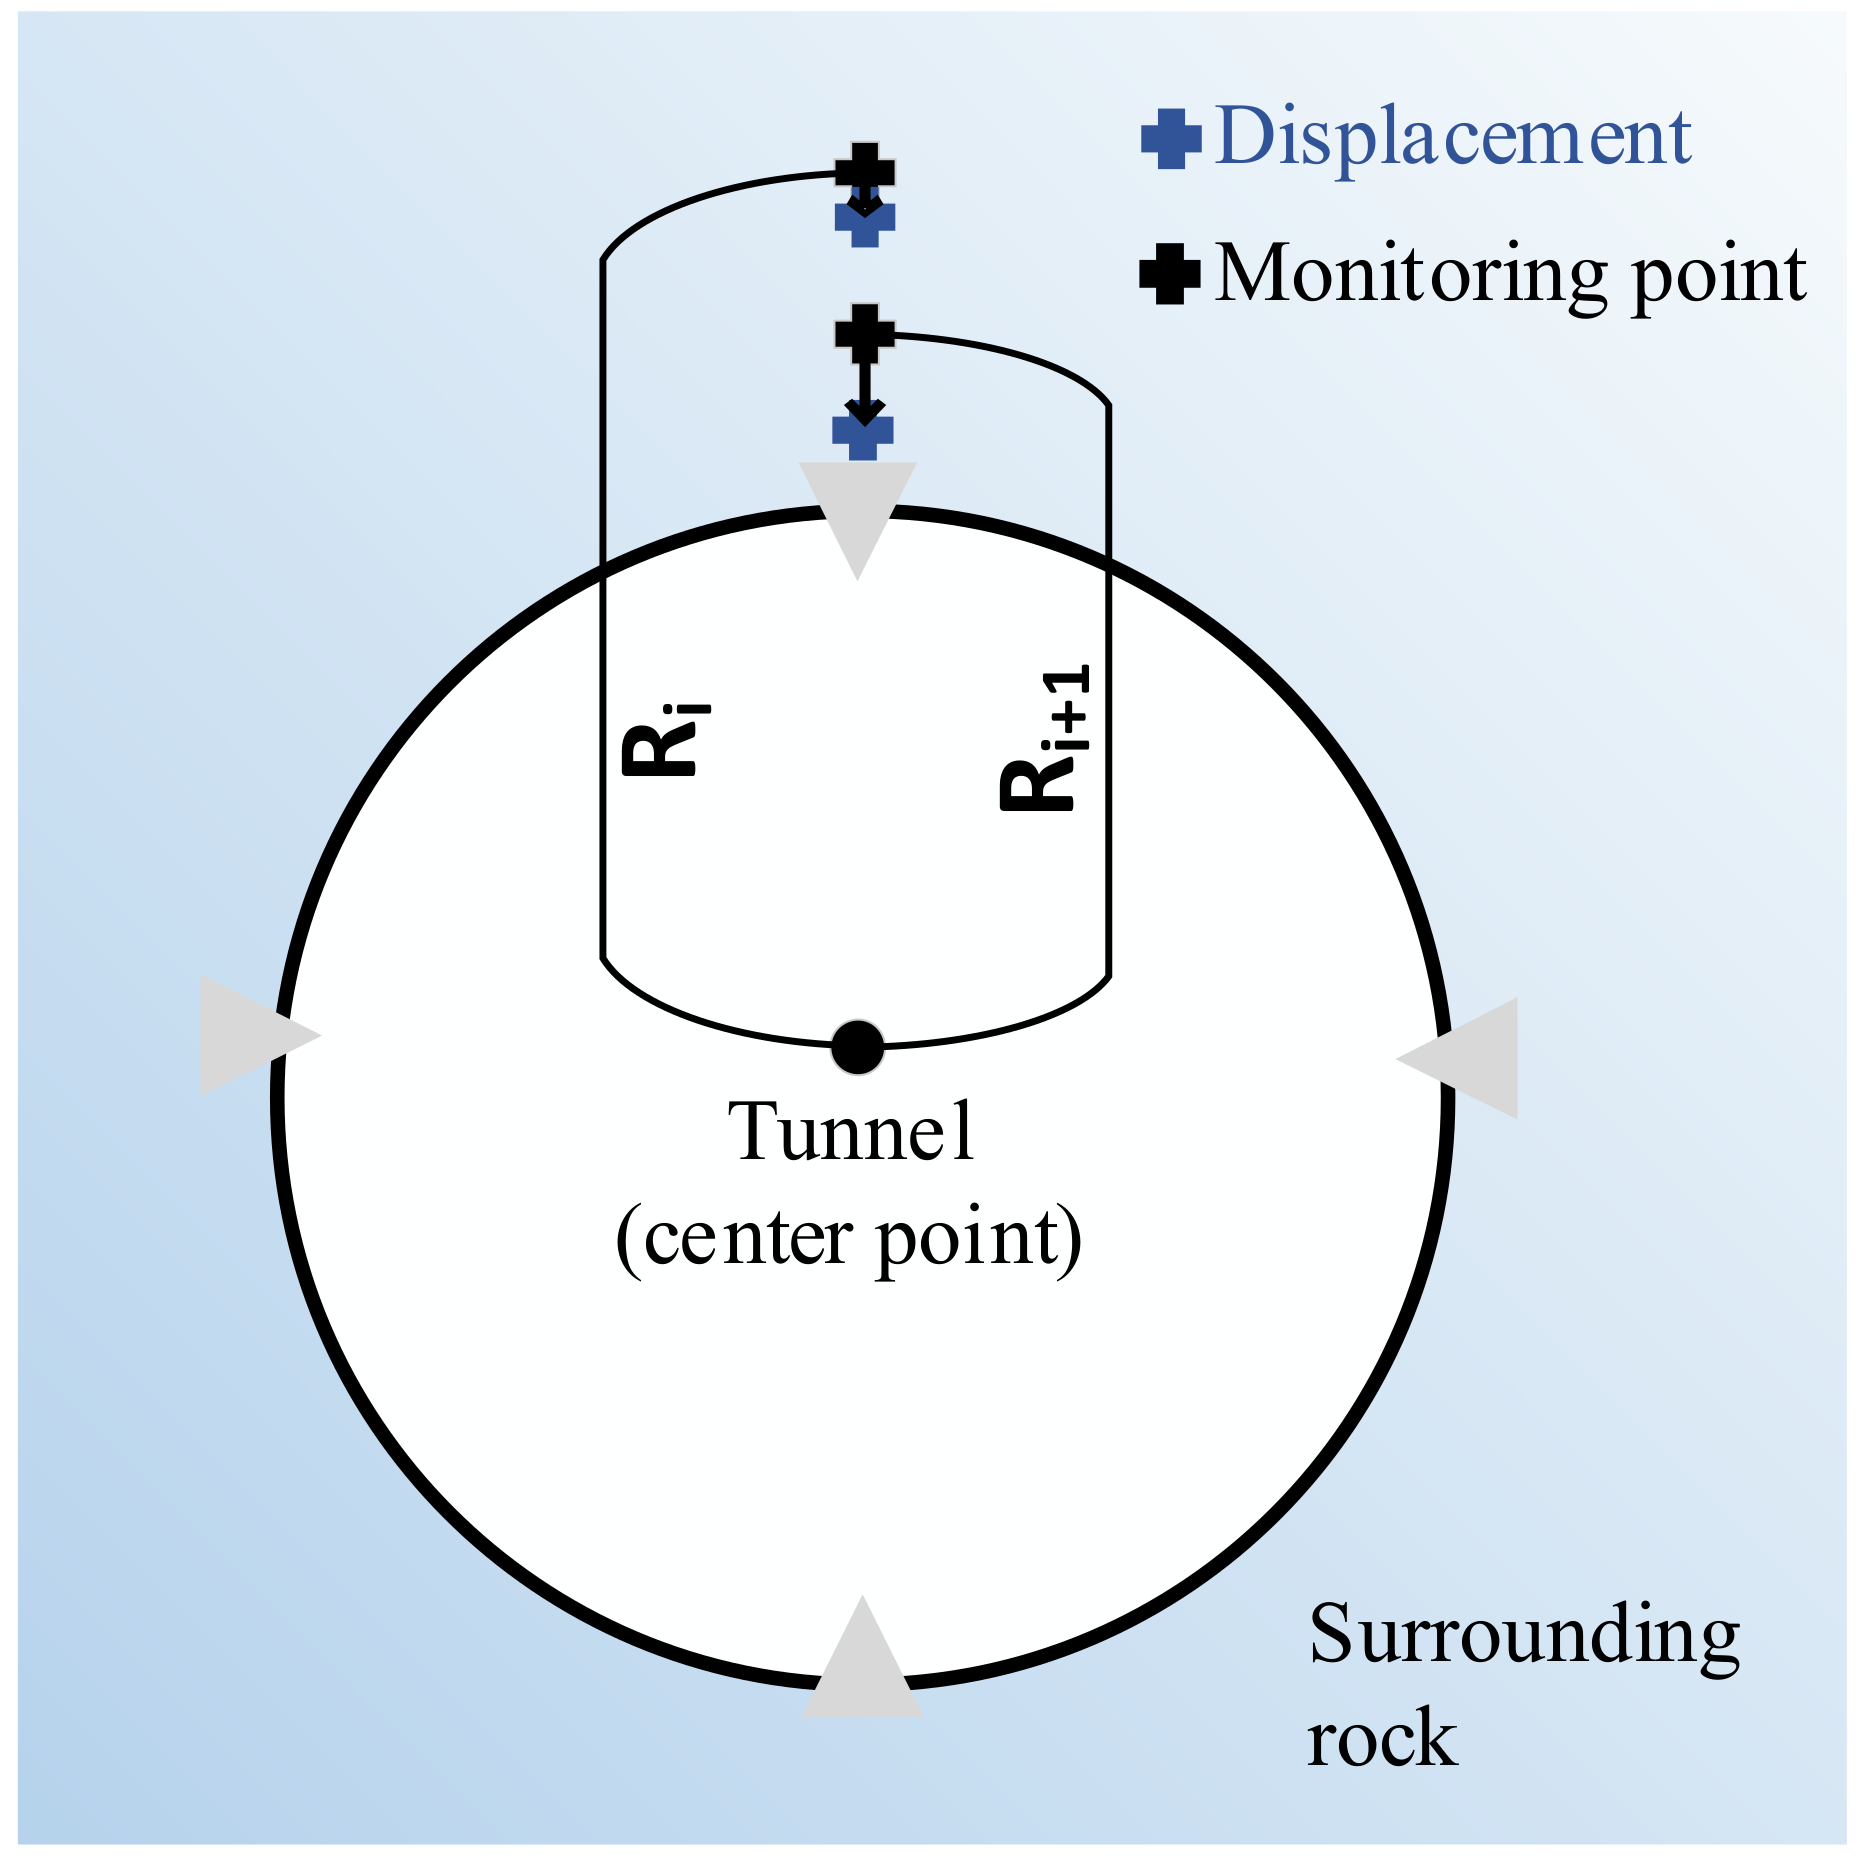
29]. Now, set the f(x, y) to represent the deformation degree between the rock units of x. and y. When f(x, y) is controlled within a specific range, the rock mass of x. − y. can maintain its bearing capacity. When f(x, y) reaches a certain threshold, the bearing capacity of the rock mass of x. − y. will reduce significantly. When f(x,y) continues to increase, the rock mass of x. − y. will be unstable as a whole. Based on the multi-point displacement monitoring equipment, the VER of the surrounding rock is introduced. The VER index is defined as the ratio of the volume expansion in the surrounding rock unit after excavation to the volume of the surrounding rock unit before excavation. It can represent a process of development and change in the surrounding rock deformation in time and space, which can be calculated by the internal displacement monitoring data for the surrounding rock using a multi-point displacement meter.
Figure 1 depicts the schematic diagram of the VER. Assuming that the excavated tunnel is a circular cavern, the calculation formula is:
where
is the distance between the measuring point and the center point of the tunnel, and
is the measured displacement of the measuring point. The formula can calculate the VER between the two measuring points
.
2.2. Test Method and Design
The particle discrete element method (PDEM) is widely used in geotechnical engineering [
30,
31,
32]. It has great superiority in building geotechnical material and structure models, establishing test conditions, and monitoring the damage and fracture of rock materials. In contrast to the continuous medium mechanics calculation method, the PDEM discretizes a material into many particles with varying diameters, a high stiffness, and mutual contact, and it simulates the interaction between the particle medium and its motion law. The PDEM can be convenient for dealing with discontinuous medium mechanical problems, as it describes the various physical relationships of a multi-phase medium. It can effectively simulate a medium’s cracking, separation, and other discontinuous phenomena, thus reflecting the mechanism, process, and results of mechanical phenomena. The traditional FEM cannot represent the complex interaction between particles and their highly nonlinear behavior, nor can it depict the flow deformation characteristics of bulk materials. The fast Lagrangian method (FLM) is also prevalent in geotechnical engineering, and it is insufficient for evaluating overall stability due to its reliance on yield criterion, which can only determine the yield damage of local units [
33].
PFC is a reliable technical tool widely used in geotechnical studies [
34,
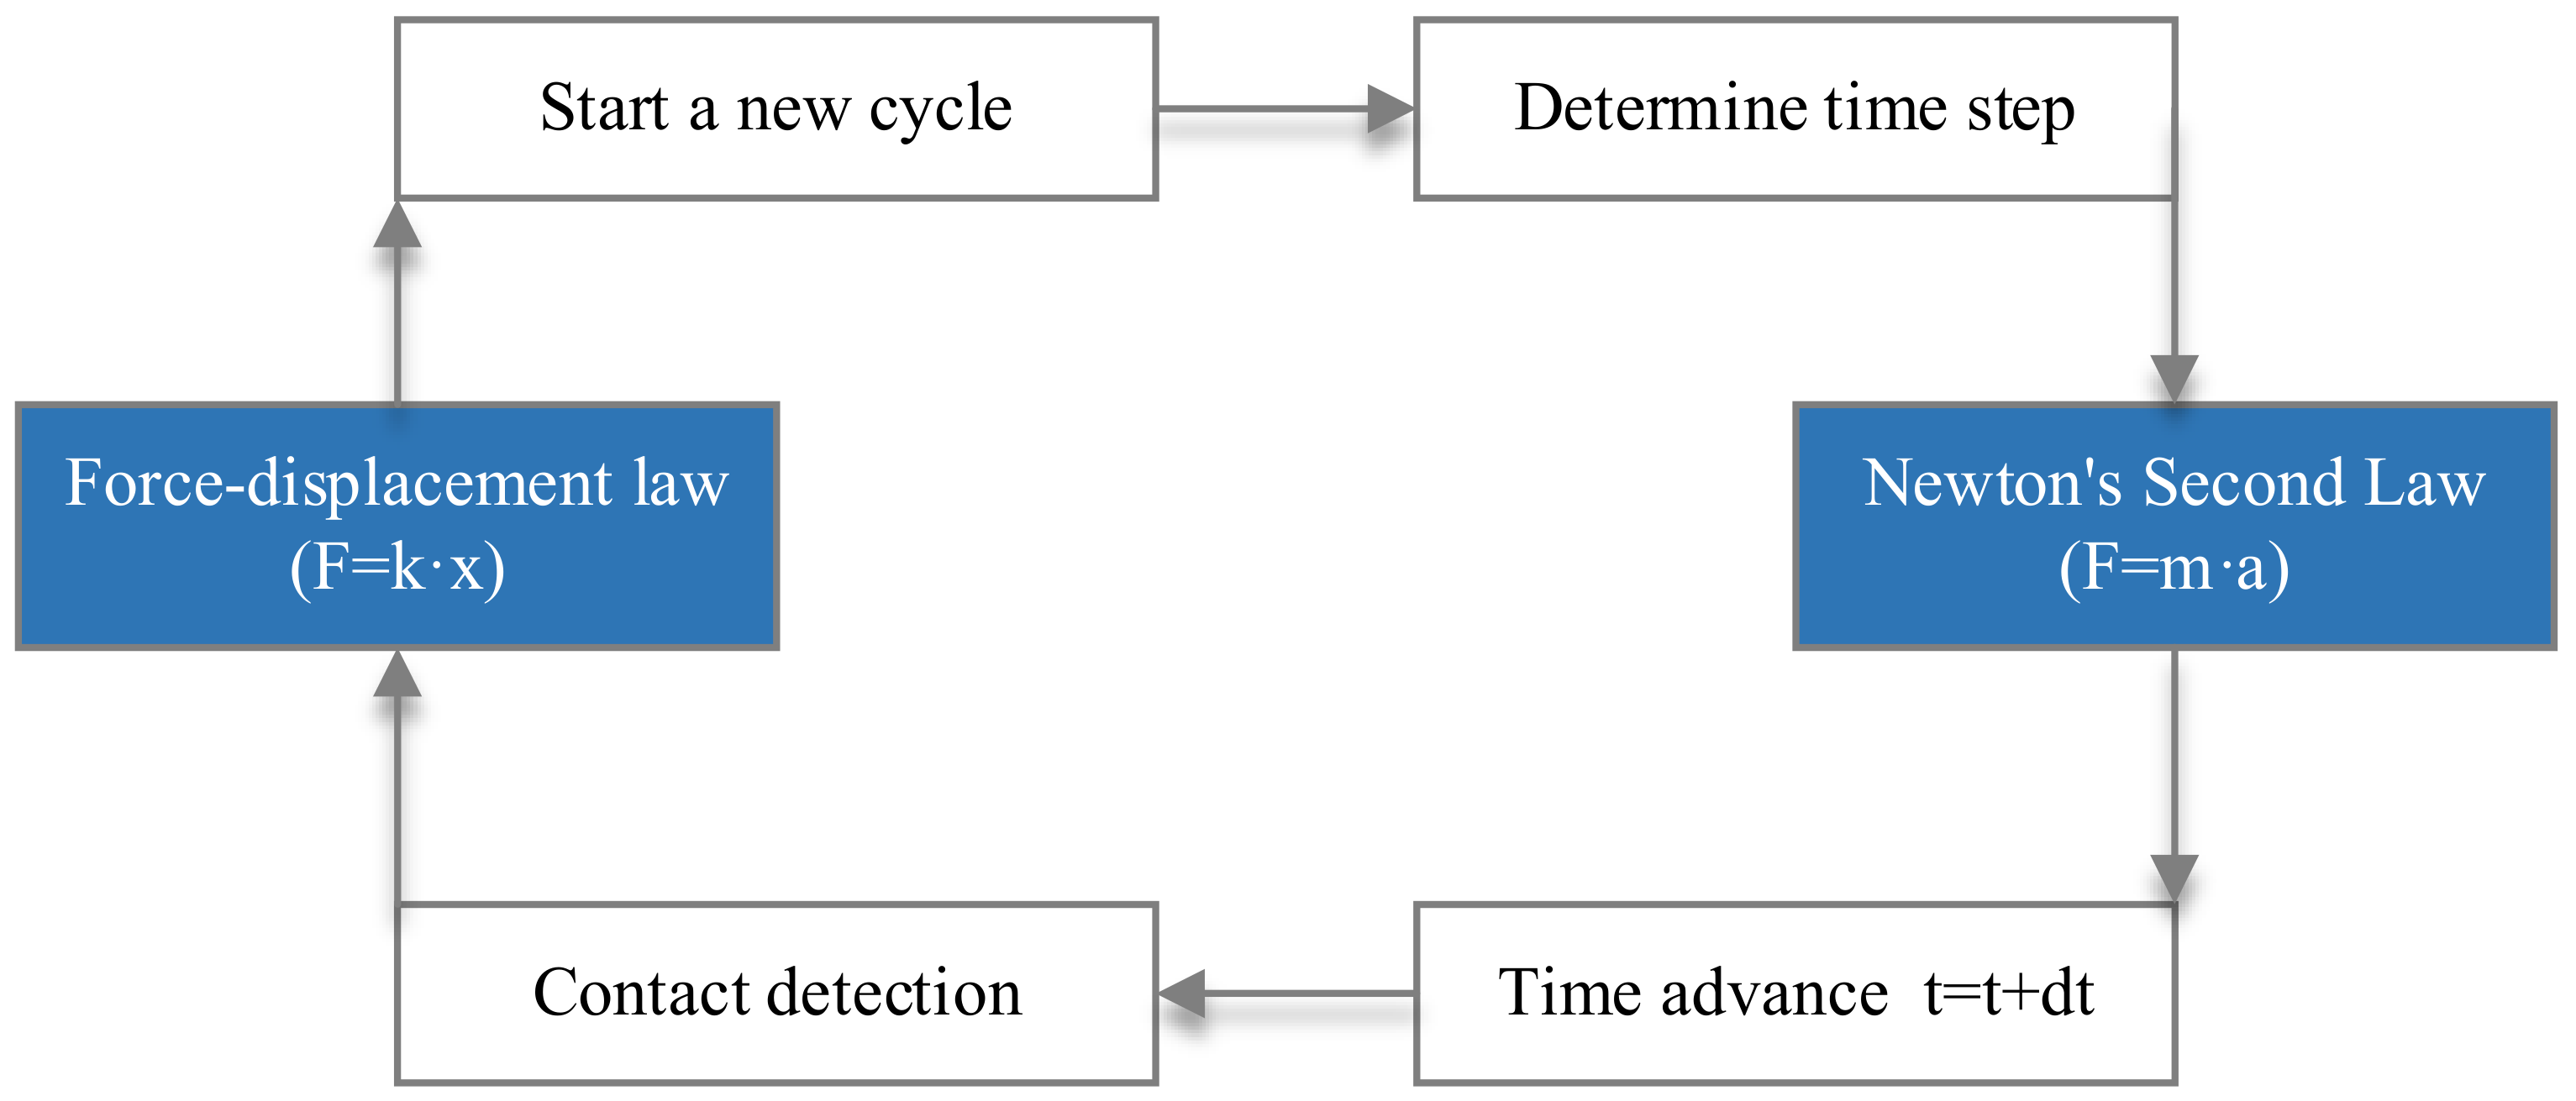
35]. The fundamental computational principle of PFC is based on the ‘force–displacement law’ and Newton’s second law, which is mainly solved in an iterative method using an explicit finite difference technique [
36], as shown in
Figure 2. The two laws are applied to particles and contacts between the particles, respectively. Newton’s second law is utilized to determine the state of motion for each particle due to the contact and physical forces acting on the particles, while the ‘force–displacement law’ is employed to update the contact forces induced by the relative motion at each contact. The overall physical performance of a particle assemblage highly depends on the contact properties, and the parallel-bonded contact model (PBCM) can more accurately simulate a rock’s mechanical properties [
37,
38].
The mechanical analysis of surrounding rock in tunnel engineering is a typical plane strain problem. Therefore, a two-dimensional plane model is adopted as the rock mass model for the test. The basic parameters of the model refer to a soft rock circular mineral roadway [
39], with a buried depth of 980 m and an average overburden weight of 24.5 kN/m
3. The stratum in which the roadway is located is comprised of mudstone. The compressive and tensile strengths of mudstone are 21.5 and 1.28 MPa, respectively. The elastic modulus and Poisson’s ratio are 2.68 GPa and 0.23, respectively. The cohesion and internal friction angles are 2.5 MPa and 40°, respectively.
The PFC model’s parameters are inconsistent with those of actual rock materials. It is proposed that the response calculated by the PFC model should be consistent with the results of the standard uniaxial compression laboratory test on rock samples by continuously modifying the model parameters. Parameter calibration rules can be used effectively for PFC model parameter calibration. Cui et al. [
40] developed empirical expressions between a single model parameter and an actual parameter through fitting analysis and clarified the effect of different model parameters on rock mechanical performance response. They indicated that the ‘effective modulus’ mainly affects the elastic modulus of rock; the ‘stiffness ratio’ significantly influences the compressive strength, elastic modulus, and Poisson’s ratio of rock; and ‘the tensile strength of the cohesion and the friction angle of PBCM’ primarily affect the compressive strength of rock. Wen et al. [
41] summarized the law of parameter calibration and verified its accuracy in a new study.
Table 1 lists the specific parameter calibration laws.
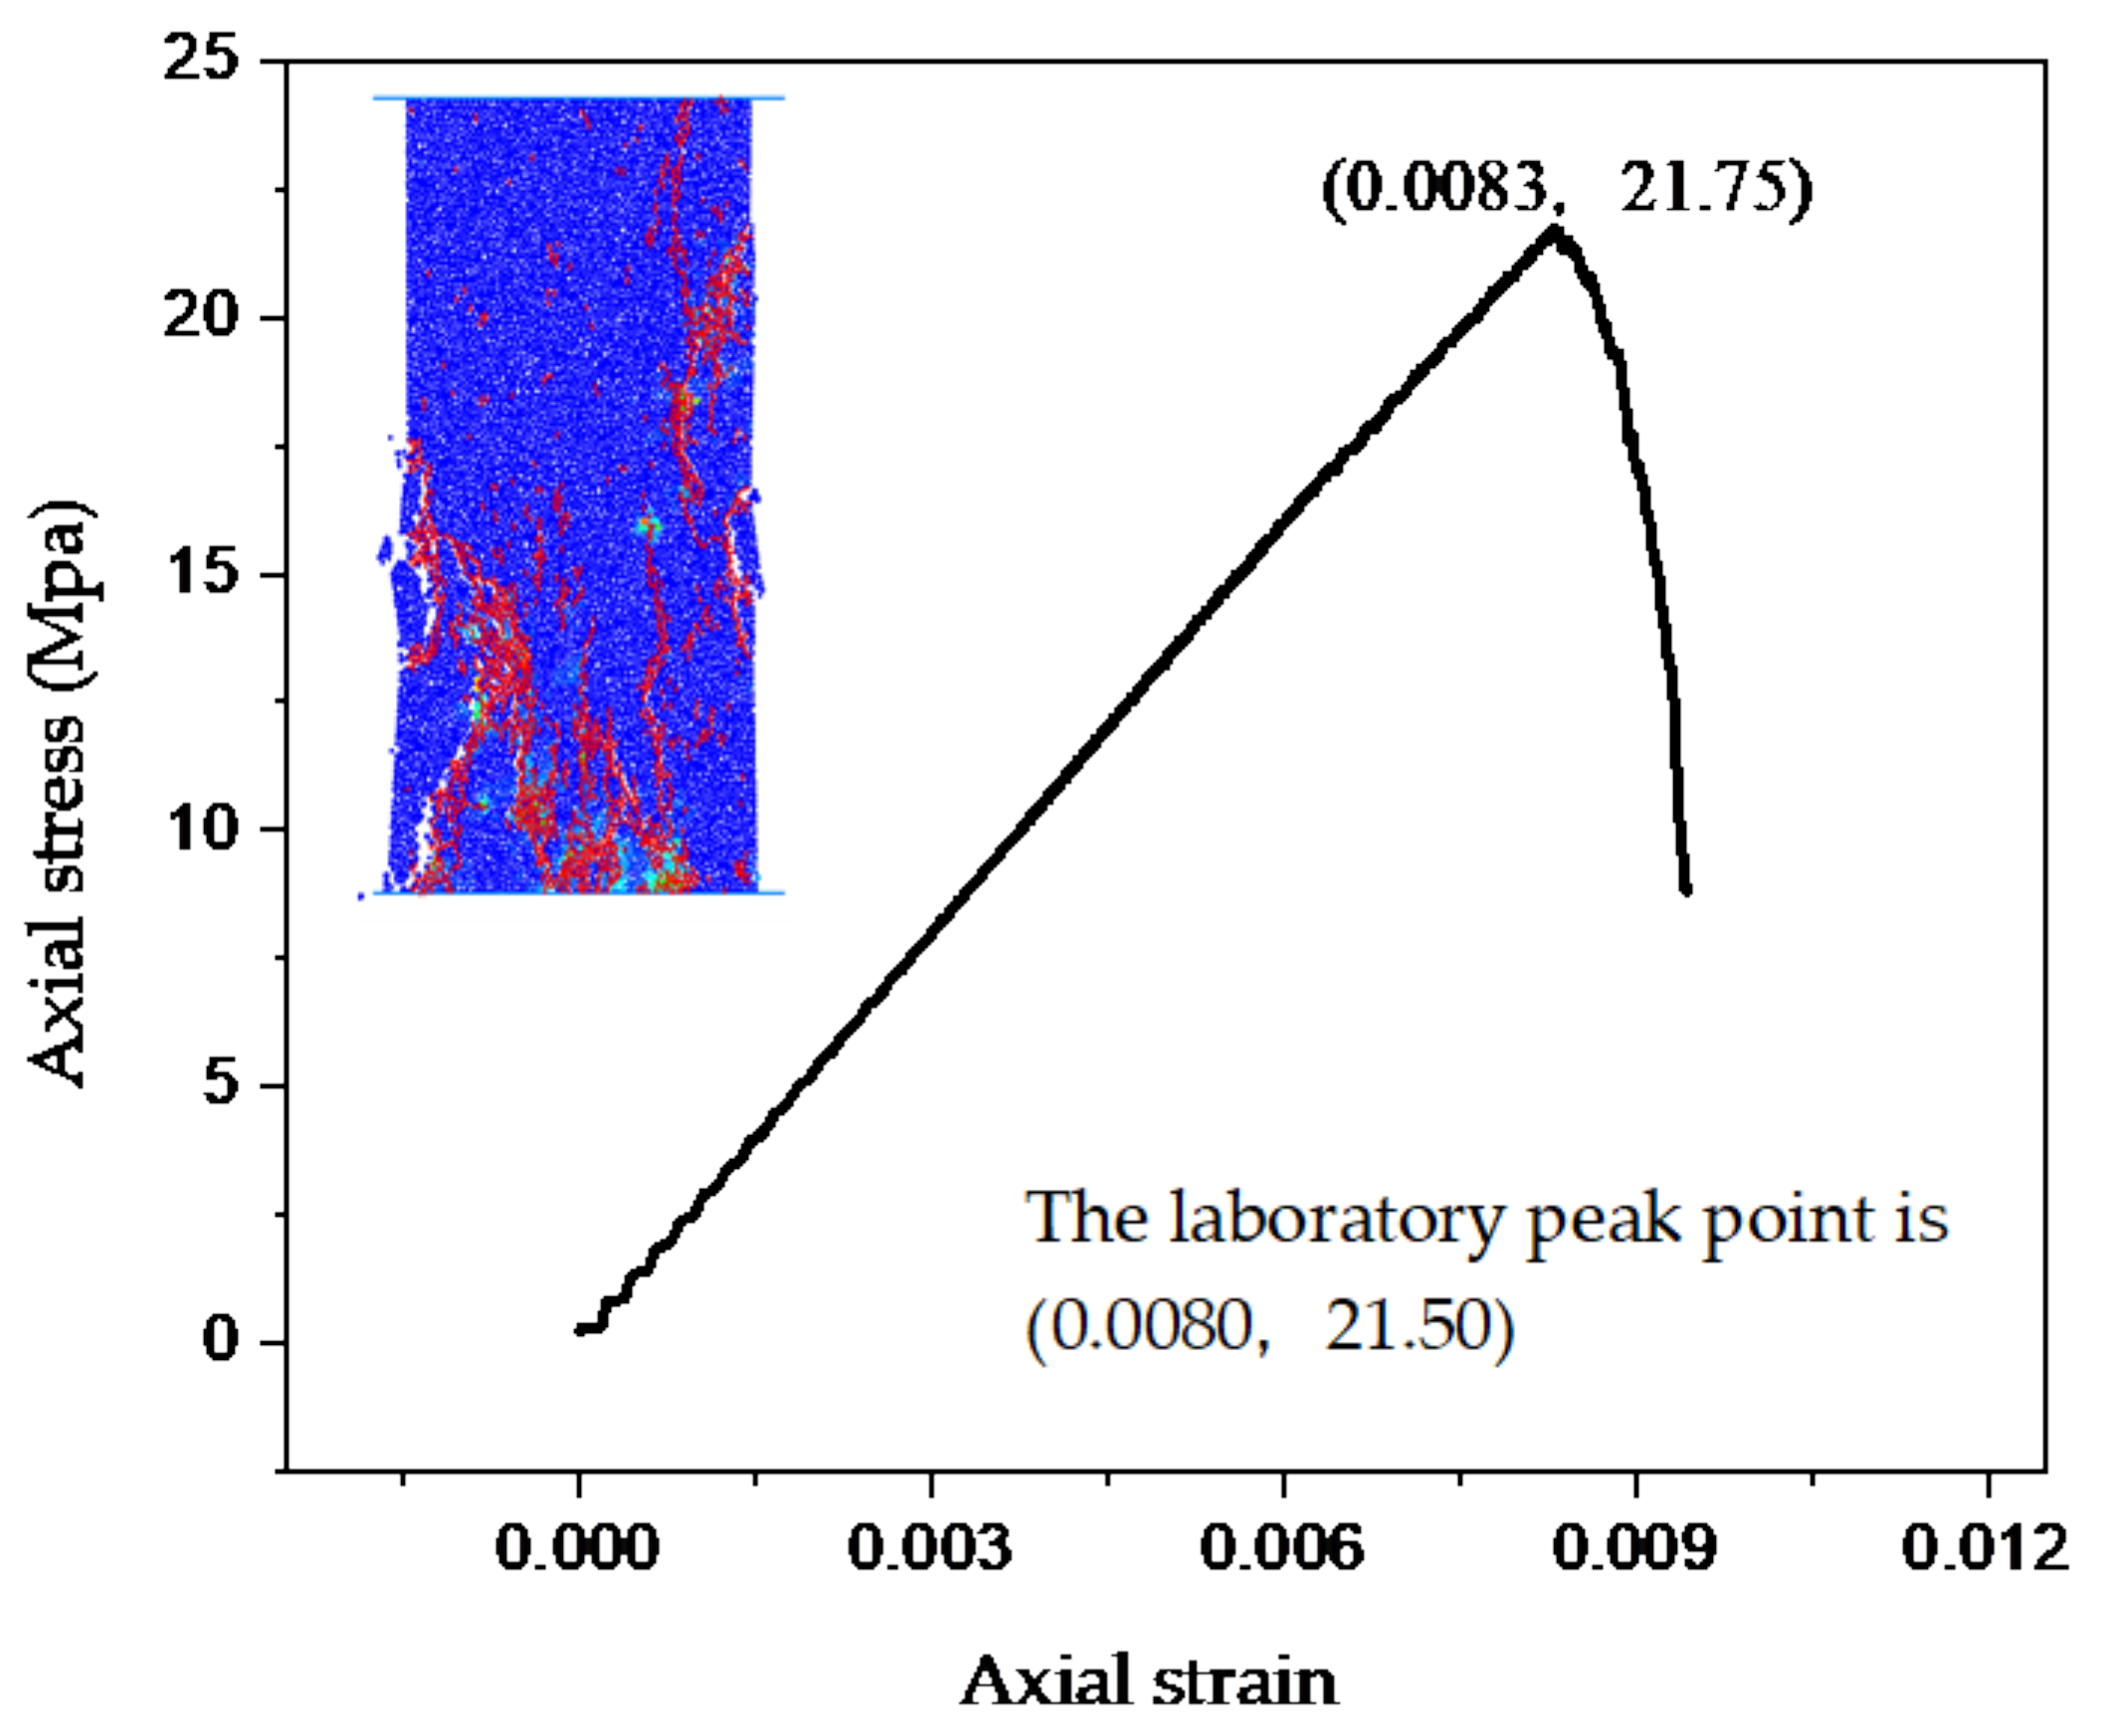
A 50 × 100 mm rock model was established for the uniaxial compression (UC) test in PFC. The microscopic parameters of the sample material were applied and adjusted to ensure that the UC test results were consistent with the macroscopic mechanical characteristic parameters of the actual rock in the laboratory, and the UC results are shown in
Figure 3. The peak point in the stress–strain curve for the rock model was (0.0083, 21.75), which was identical to the laboratory result (0.0080, 21.50). The fundamental microscopic parameters of the rock model were determined, as illustrated in
Table 2.
A two-dimensional rock mass and tunnel excavation model is further established based on the calibrated parameters.
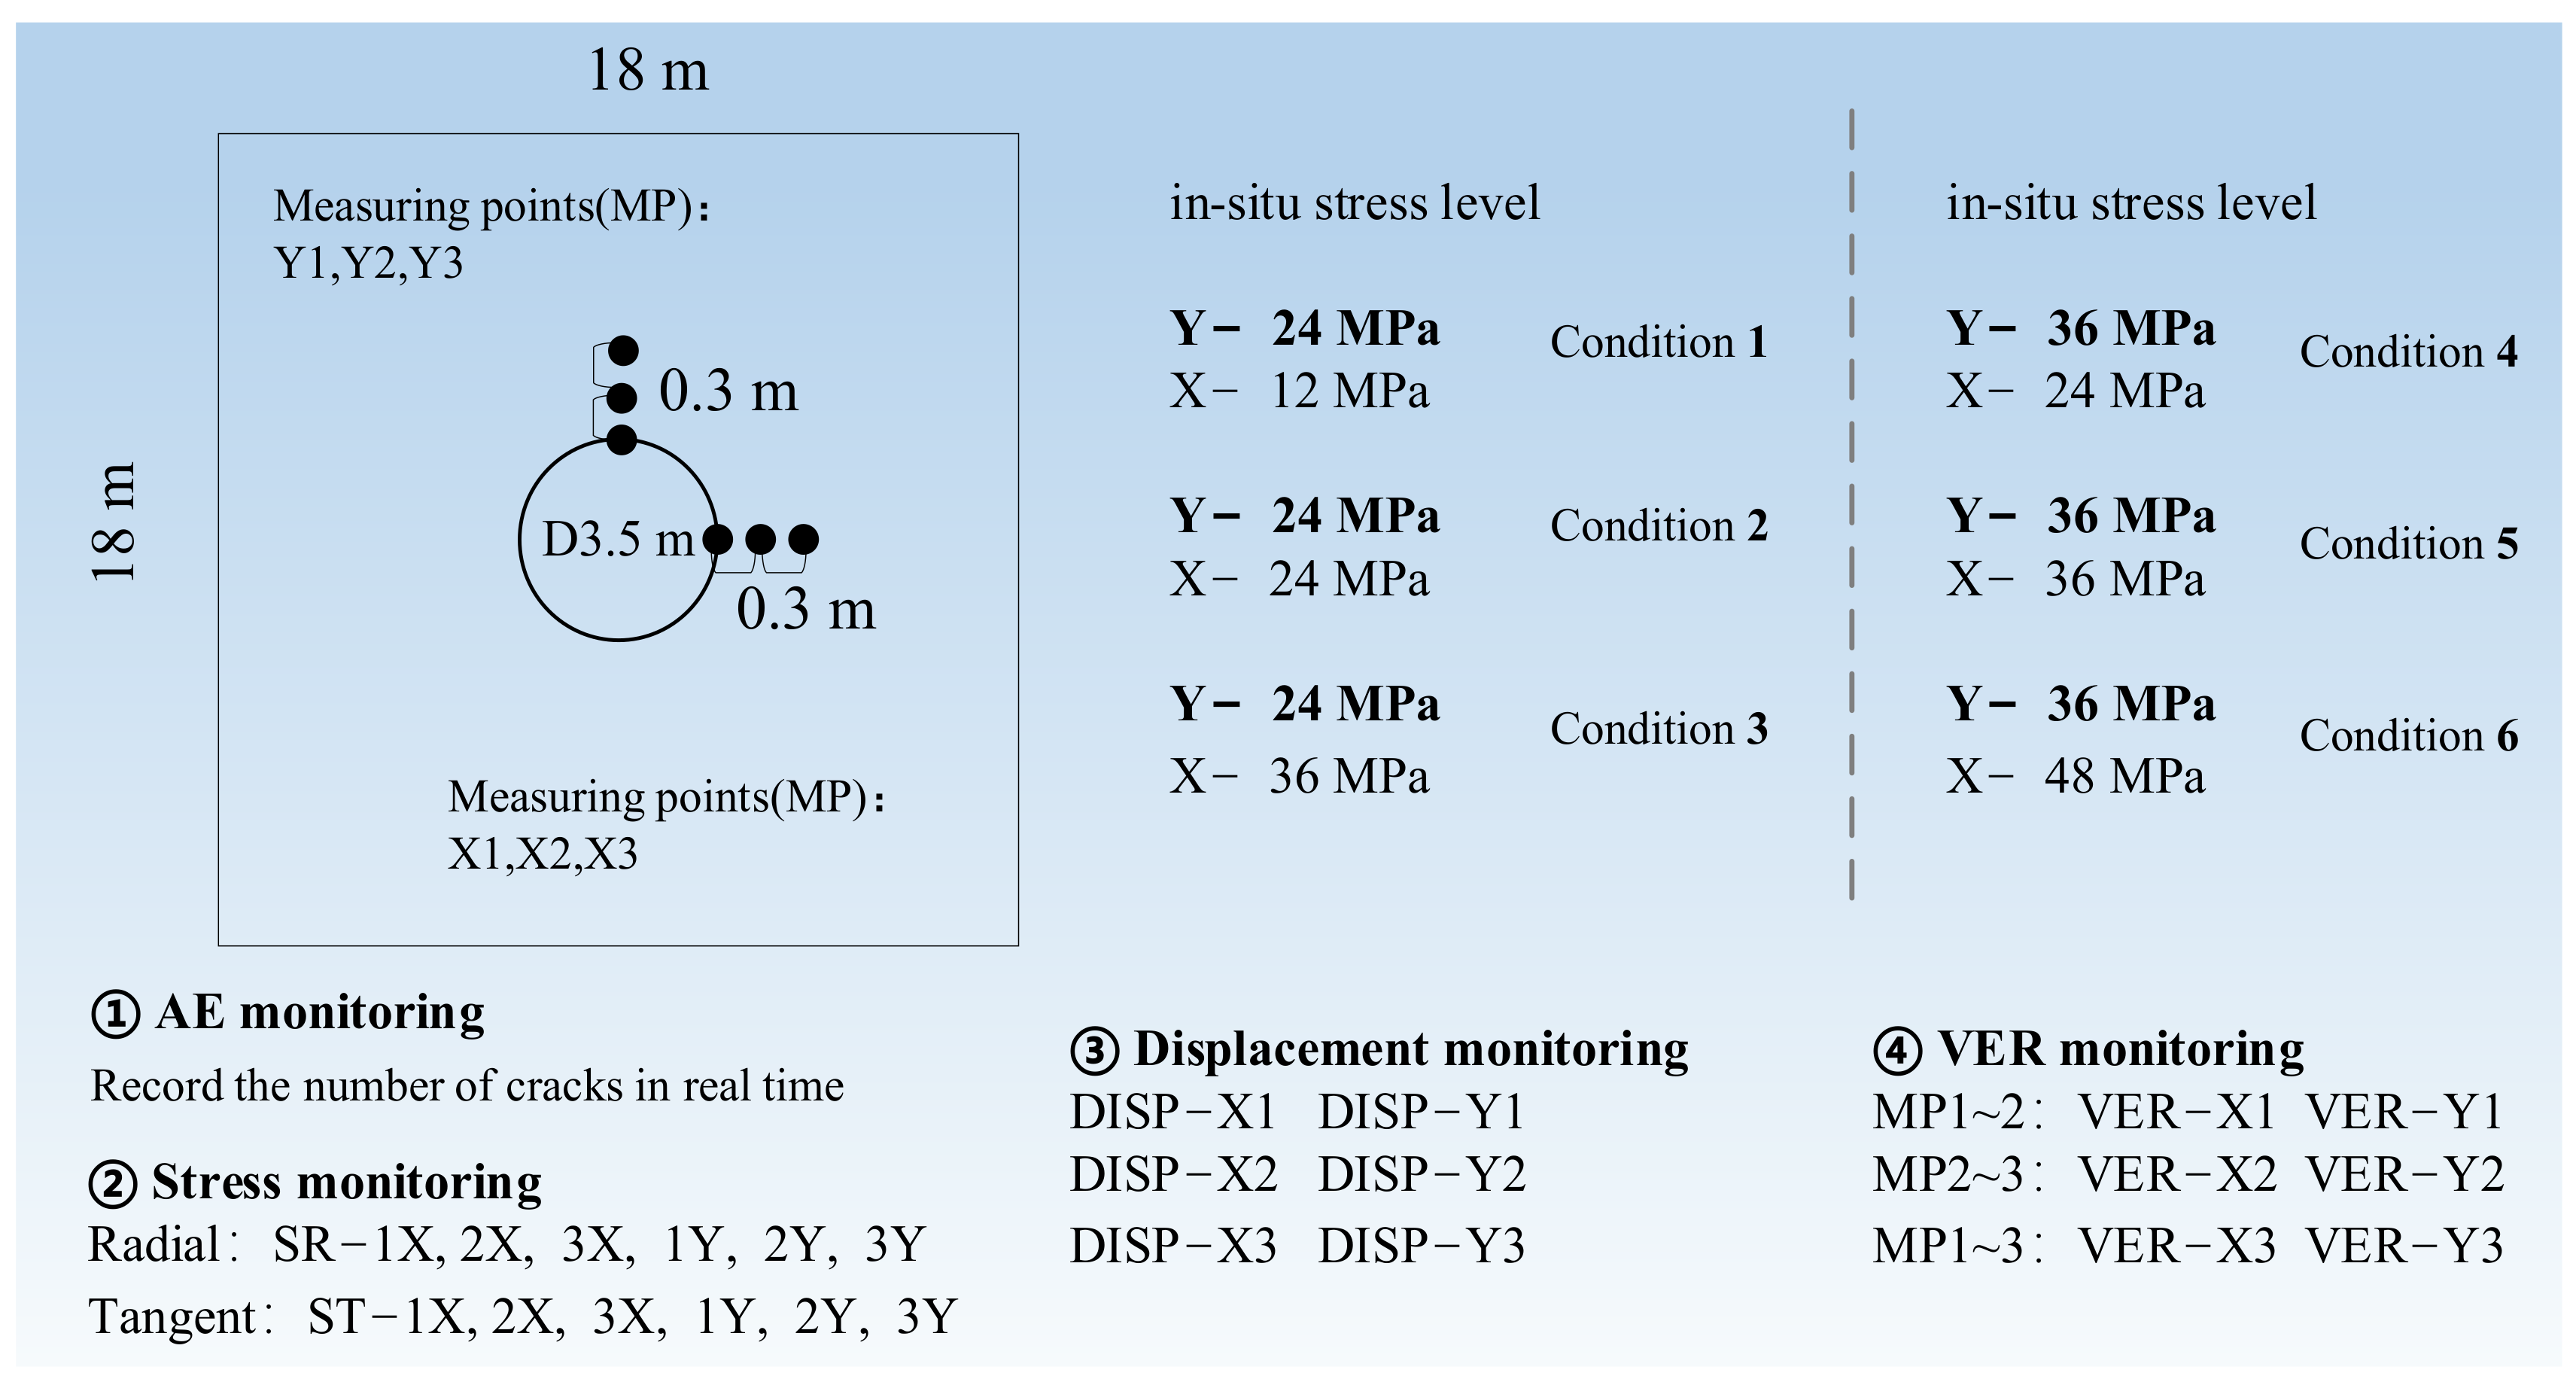
Figure 4 reveals that the size of the rock mass model is 18 × 18 m and the circular tunnel’s diameter is 3.5 m [
42]. There is no relationship between the horizontal and vertical in situ stress for deep-buried tunnels. Vertical stress is caused by overburdened weight, while horizontal stress is simultaneously affected by tectonic action. Due to the indeterminate strength of geological tectonic action, the horizontal stress can be large or small, positive or negative. In this study, the vertical in situ stress is set at 24 MPa based on the actual project, and the corresponding horizontal in situ stress is set at 12, 24, and 36 MPa, respectively, under three conditions. Then, the vertical in situ stress is set to 36 MPa, and the corresponding horizontal in situ stresses are 24, 36, and 48 MPa, respectively. As shown in
Figure 4, six engineering conditions are designed. Two groups of measuring points (MPs) are placed around the tunnel, one group containing three points located at distances of 0.3, 1.3, and 2.3 m from the tunnel’s inner surface. They are defined as sidewall MPs of X1, X2, and X3 and tunnel top MPs of Y1, Y2, and Y3. Four types of data are monitored, as shown in
Figure 4:
- (1)
AE monitoring, real-time recording of the number of AE events (microcracks) in the surrounding rock after tunnel excavation;
- (2)
Stress monitoring, including radial stress, denoted as SR-MPs, and tangential stress, denoted as ST-MPs;
- (3)
Displacement monitoring denoted as DISP-MPs;
- (4)
VER monitoring, the volume expansion rate of the surrounding rock between measuring points 1–2, 2–3, and 1–3, denoted as VER-MPs, respectively.
Figure 4.
Design of the surrounding rock monitoring test.
Figure 4.
Design of the surrounding rock monitoring test.
2.3. Machine Learning and Algorithm Design
Machine learning is a core technology of AI, encompassing numerous algorithms, such as deep learning, supervised learning, classification prediction, and others. These algorithms are widely employed within the civil engineering industry. For instance, Xu et al. [
43] proposed a real-time earthquake damage rapid reporting method, integrating ML techniques with multivariate ground motion intensity indicators to reveal a mapping relationship between strength indicators and destructive forces. Xu [
44] suggested a structural type prediction method founded on ML, indicating that the multi-class decision forest algorithm optimally impacts the multi-classification of structural types and requires only minimal sampling surveys to obtain the structural type of an entire city. In addition, there are also many beneficial applications in parameter prediction in the field of Earth science study [
45,
46,
47].
This study’s purpose in employing ML is to leverage various monitoring indices to determine the damage state of the surrounding rock, followed by evaluating the effectiveness of these indices. Structural damage identification aligns with the classification problem of ML, with common classification prediction algorithms, such as artificial neural networks, decision forests, support vector machines, and logistic regression algorithms, playing a role.
Numerous ML platforms are available to researchers [
48,
49,
50,
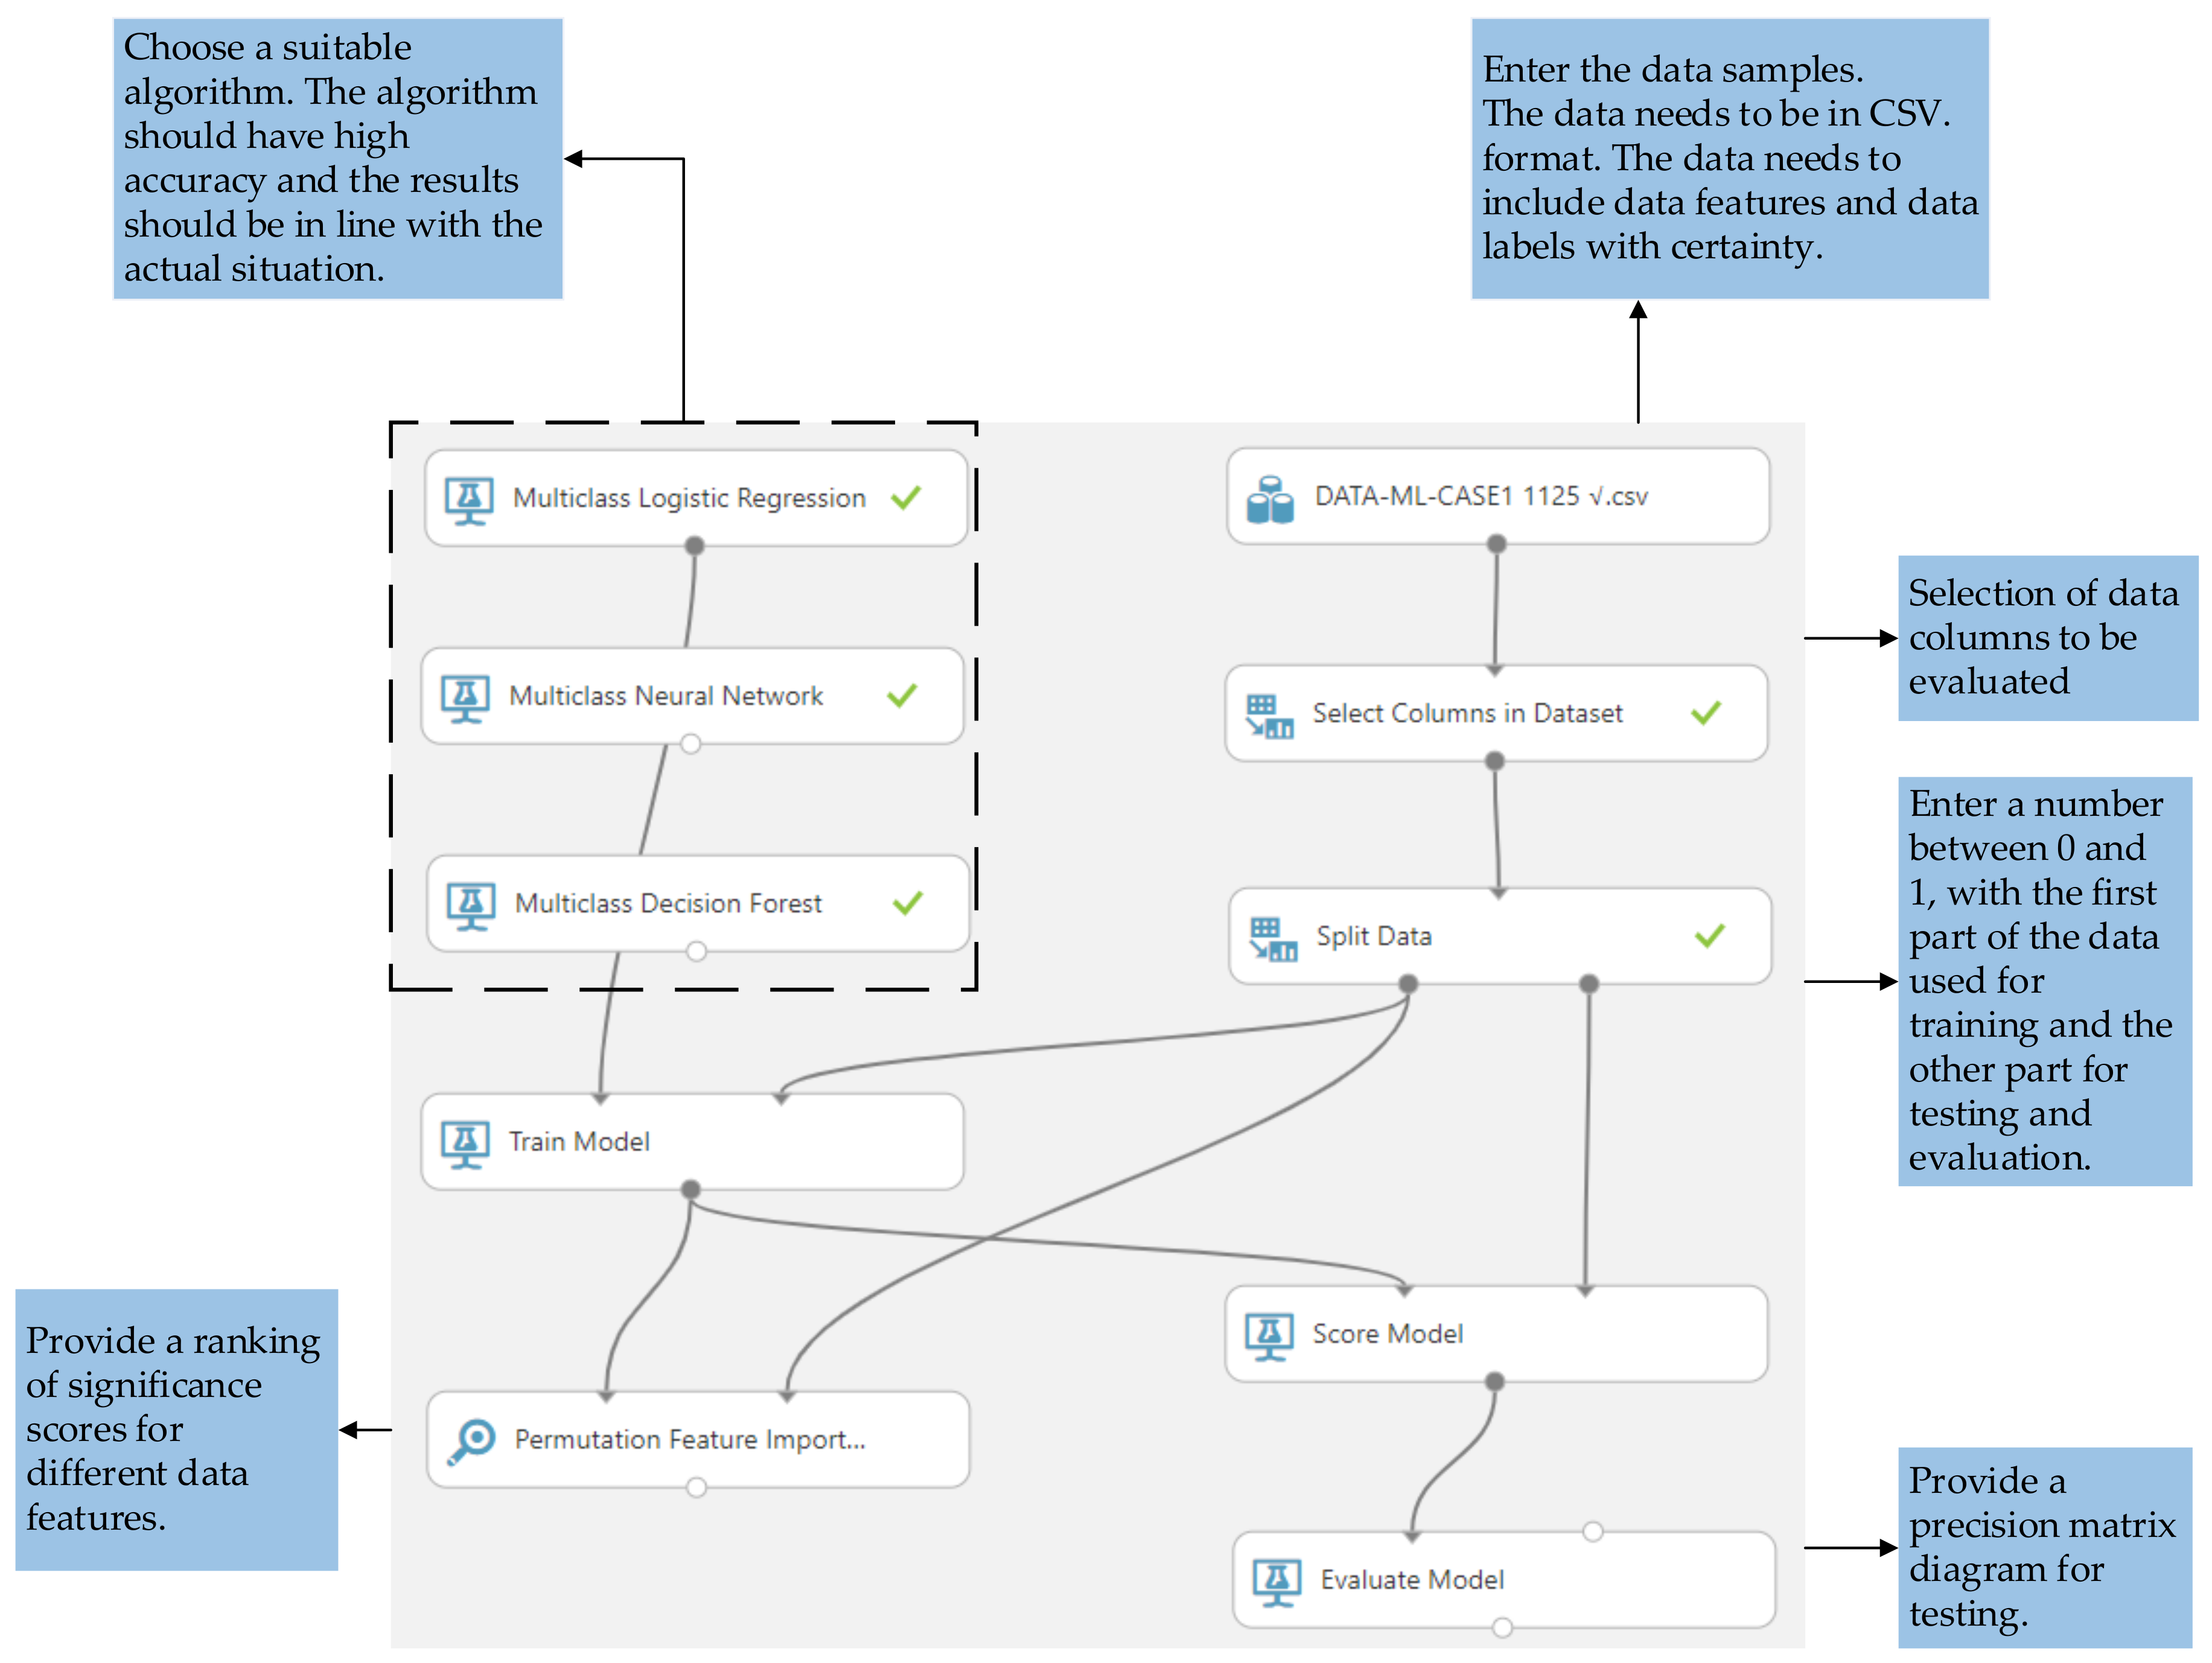
51]. This study conducts its ML experiments via Azure ML Studio, which integrates multiple ML models and offers a user-friendly operation interface for visual analysis. The process of ML classification prediction and data evaluation can be divided into data processing modules, algorithm and training modules, and post-processing evaluation modules. The requisite modules must be arranged and linked with the correct logic, then the parameters set to complete the corresponding calculation tasks. Once the calculation is finalized, the results can be reviewed from the post-processing module. This procedure can be broken down into five detailed steps:
Step 1: Data pretreatment and storage.
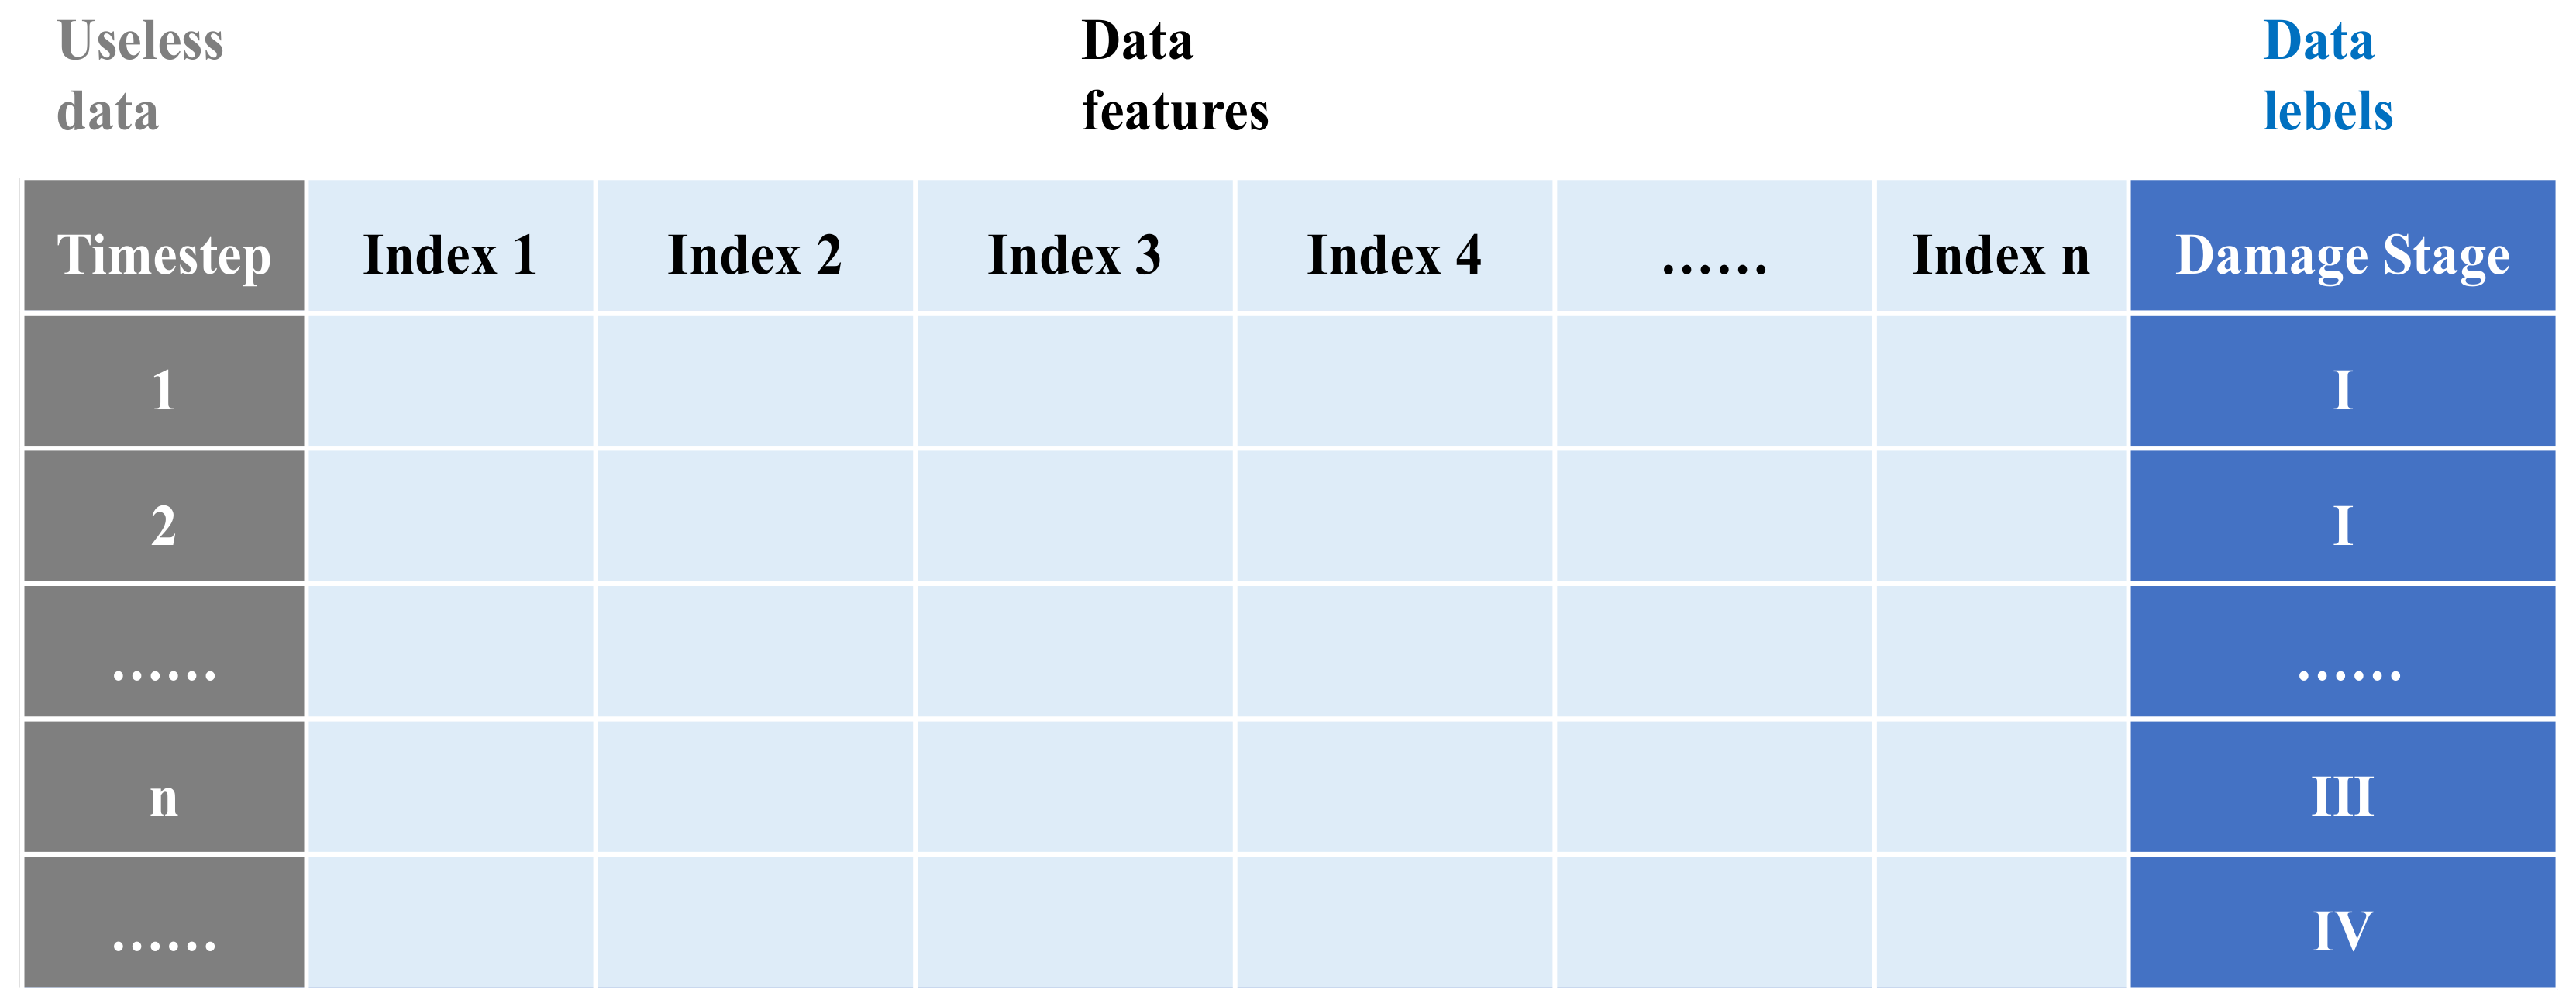
Initially, the monitoring data must be appropriately collated and stored. The data corresponding to each test condition are organized into individual files, with columns being the basic units of data. The format of the data storage is illustrated in
Figure 5. The data can be categorized into three divisions: useless data, data features, and data labels. Useless data represent the timesteps for recording and annotation. Data features encompass various monitoring indicators, while data labels correspond to different damage stages. Each data file is mandated to be stored in CSV format and subsequently imported into Azure Studio. Following this, a new experiment can be initiated to commence the procedure.
Step 2: Data selection and segmentation.
With the data selection module, the columns to be included or excluded from the subsequent calculations can be selected or removed as required. Researchers can execute multiple calculations to evaluate the data feature columns in different combinations for the imported data sample from the same test condition. The data segmentation module necessitates inputting a number between 0 and 1 to partition the data set into two sets. This study assigns 70% of the data lines for model training, with the remaining 30% for accuracy testing. The segmented data is then submitted into the training model and scoring module.
Step 3: Selection of the optimal algorithm.
There are many classification algorithms from which to choose, necessitating the selection of the most fitting algorithm for specific application scenarios. For this study, the principle of algorithm selection is twofold: (1) it must provide high classification prediction accuracy, and (2) the ranking of the significance scores in the indices must align with the conventional understanding of the monitoring data on the surrounding rock in underground engineering. If these criteria are not met, the algorithm should be discarded. The chosen algorithm will be directly submitted into the training model.
Step 4: Make the strategy for the experiment.
For a single condition data set, five calculations are performed. These include the whole displacement indices, the complete VER indices, the entire radial, and the total tangential stress index for each condition. Subsequently, the optimal results from these four indices are selected and combined into comprehensive indices for the joint calculation of different indices. The outcomes from the training model are then submitted into the post-processing module.
Step 5: Results visualization and analysis.
The post-processing module enables the visual analysis of the calculation results. The feature significance module can compute the significance scores for the feature variables. The higher the significance score of an index, the more influential the corresponding monitoring index is for damage determination. The evaluation module employs a regression model to establish the accuracy of the test. The value in the prediction accuracy matrix represents the likelihood that a data line in an actual class is categorized as a predicted class. The closer the diagonal value is to 100%, the higher the discrimination accuracy.
Figure 6 shows the implementation process of the ML classification prediction and indices evaluation.
3. Results
3.1. Monitoring Data Analysis
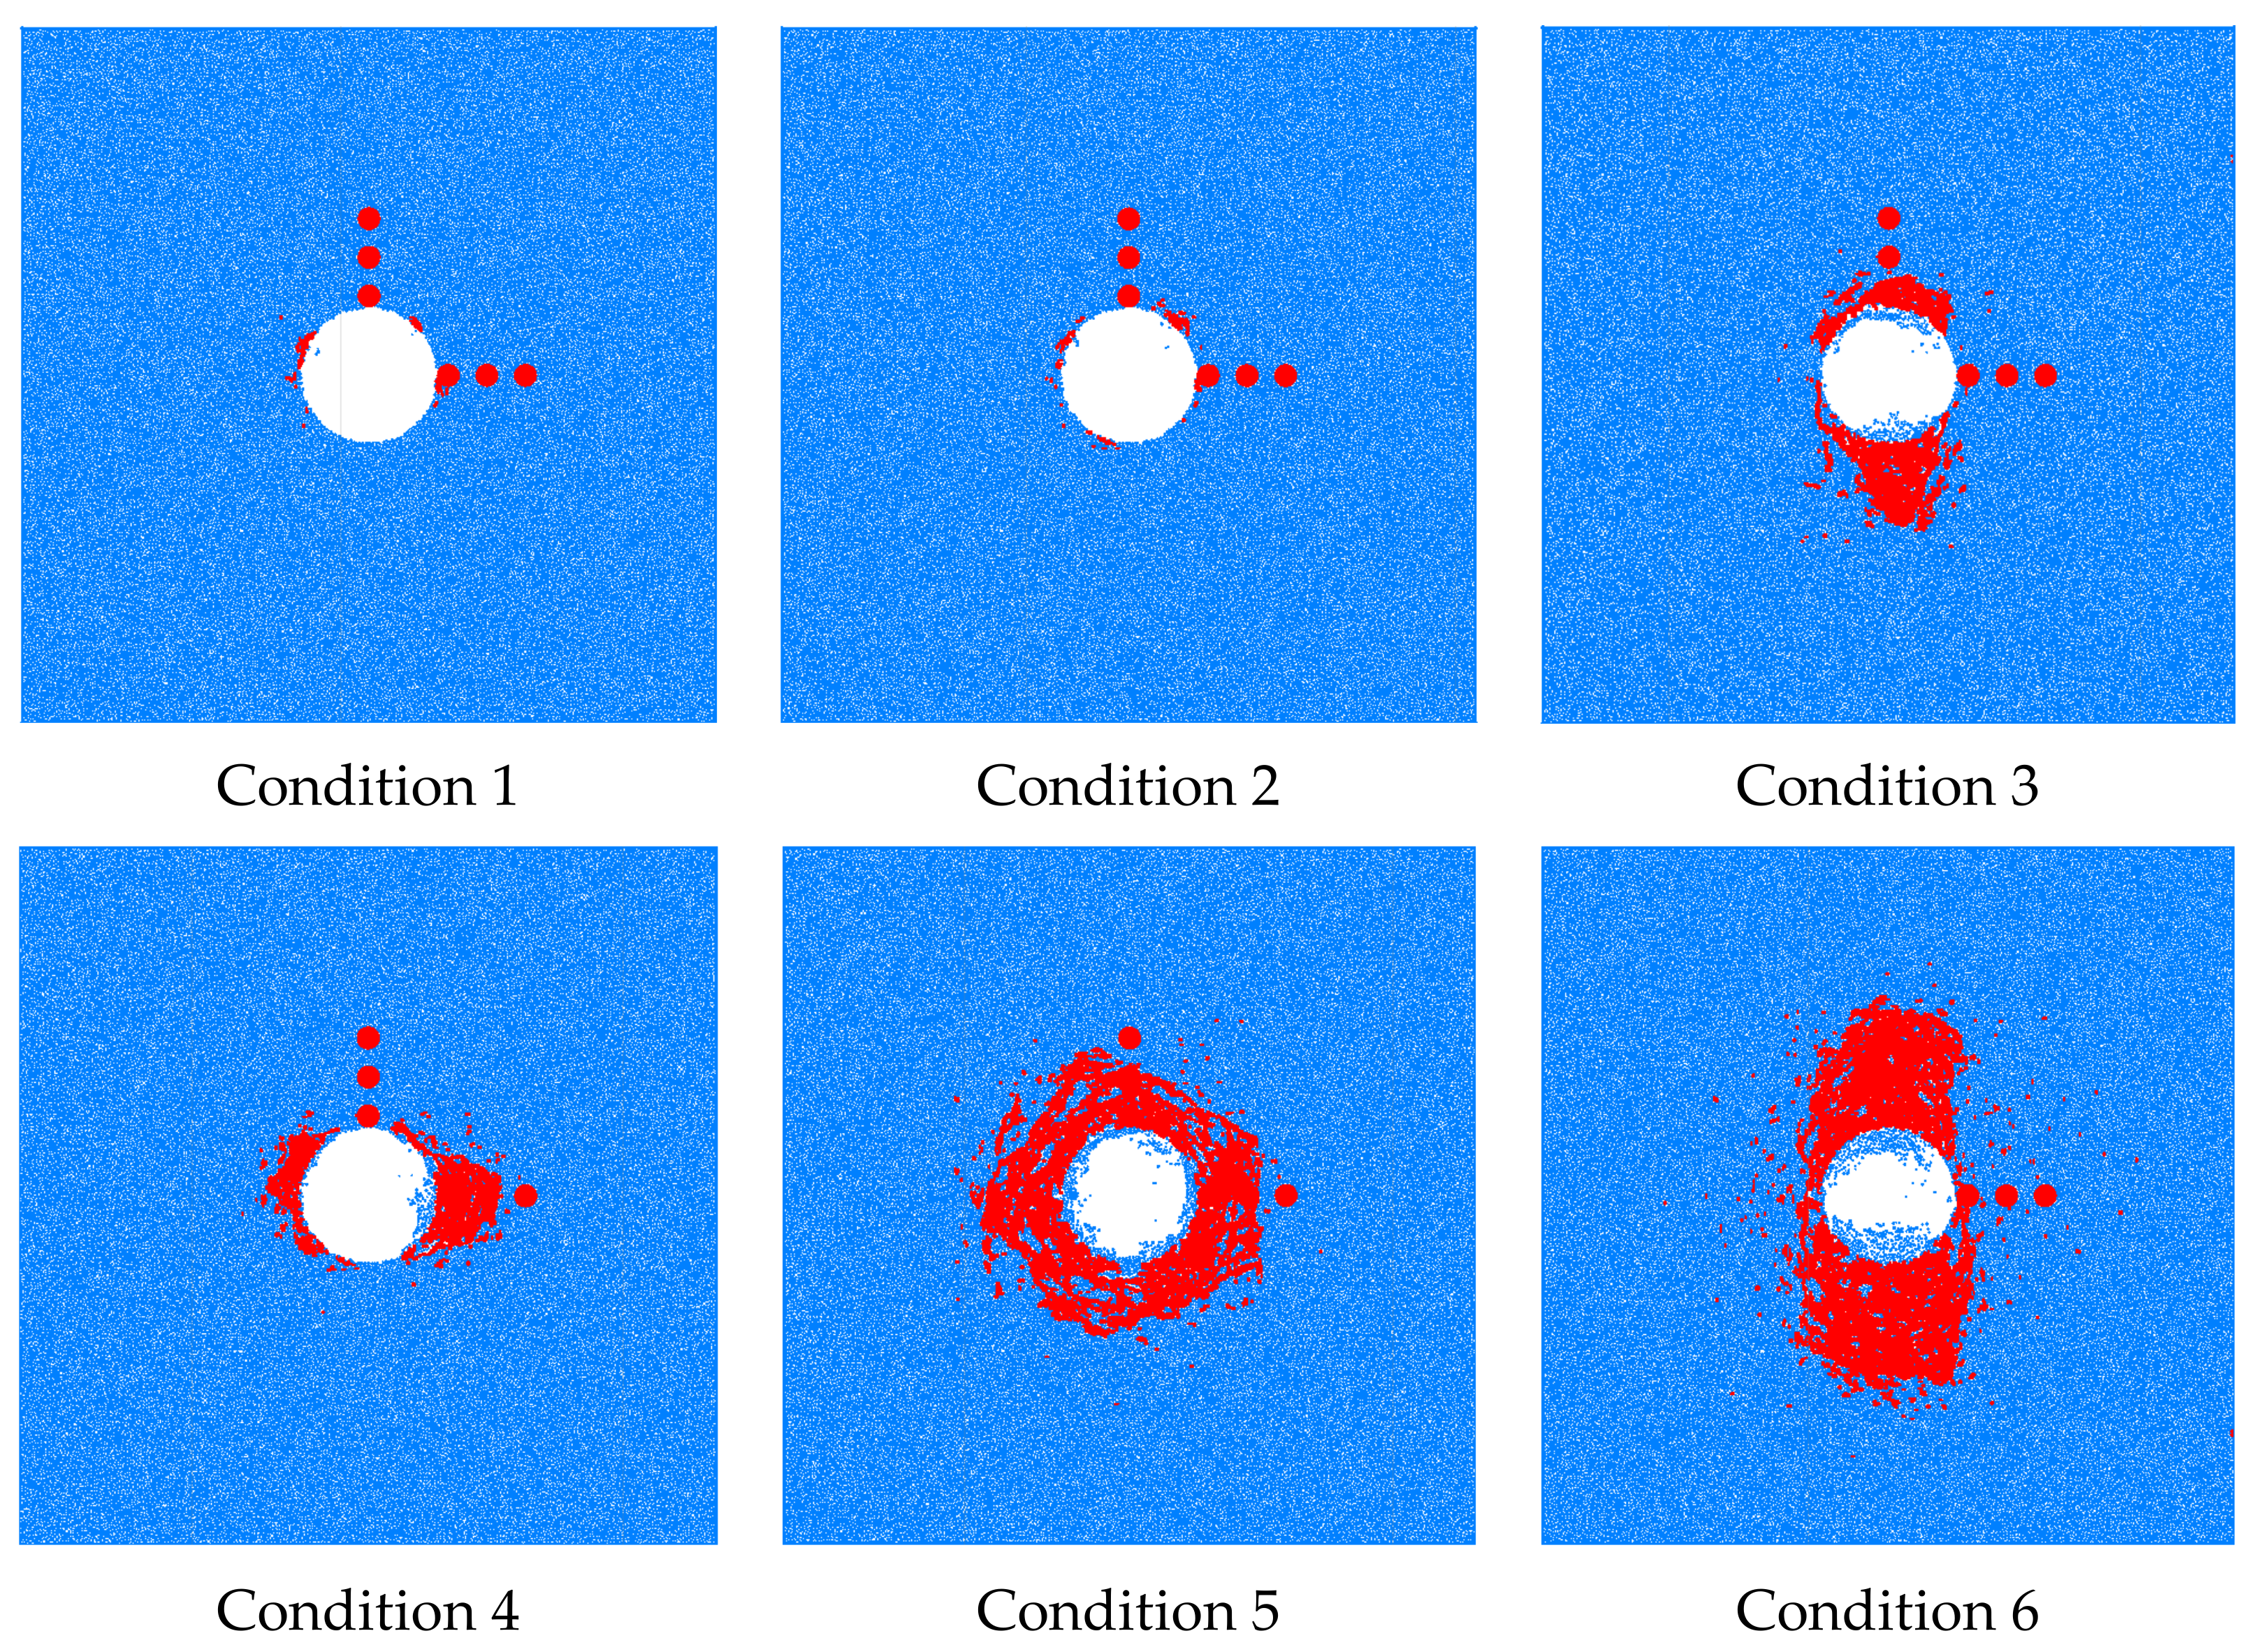
Figure 7 displays the AE monitoring images of the surrounding rock after 8000 timestep operations were conducted under different conditions. In the
Figure 7, the blue part represents the rock mass, the red circle array represents the monitoring points, and the irregular red area around the tunnel represents the damage situation. A timestep represents an iteration of the calculation in this article. Under the conditions 1–2, the surrounding rock’s damage range is small, and the surrounding rock mass can maintain self-stability. Under the conditions 3–6, the surrounding rock has a considerable collapse risk, as its self-bearing capacity is insufficient to maintain stability, and its damage range is about 0.6–3.2 m. For conditions 3–6, the surrounding rock’s damage morphology is directly related to the in situ stress level. When the horizontal in situ stress is less than the vertical, the damage in the surrounding rock is concentrated on the tunnel’s sidewall. Otherwise, the surrounding rock damage is concentrated on the tunnel’s top and bottom. When the in situ stresses in the directions of 2 and 5 are equal, the surrounding rock damage is evenly distributed around the tunnel. By designing various in situ stress conditions reasonably, the surrounding rock damage includes results covering different measurement points, providing a good data sample for subsequent experiments determining surrounding rock damage.
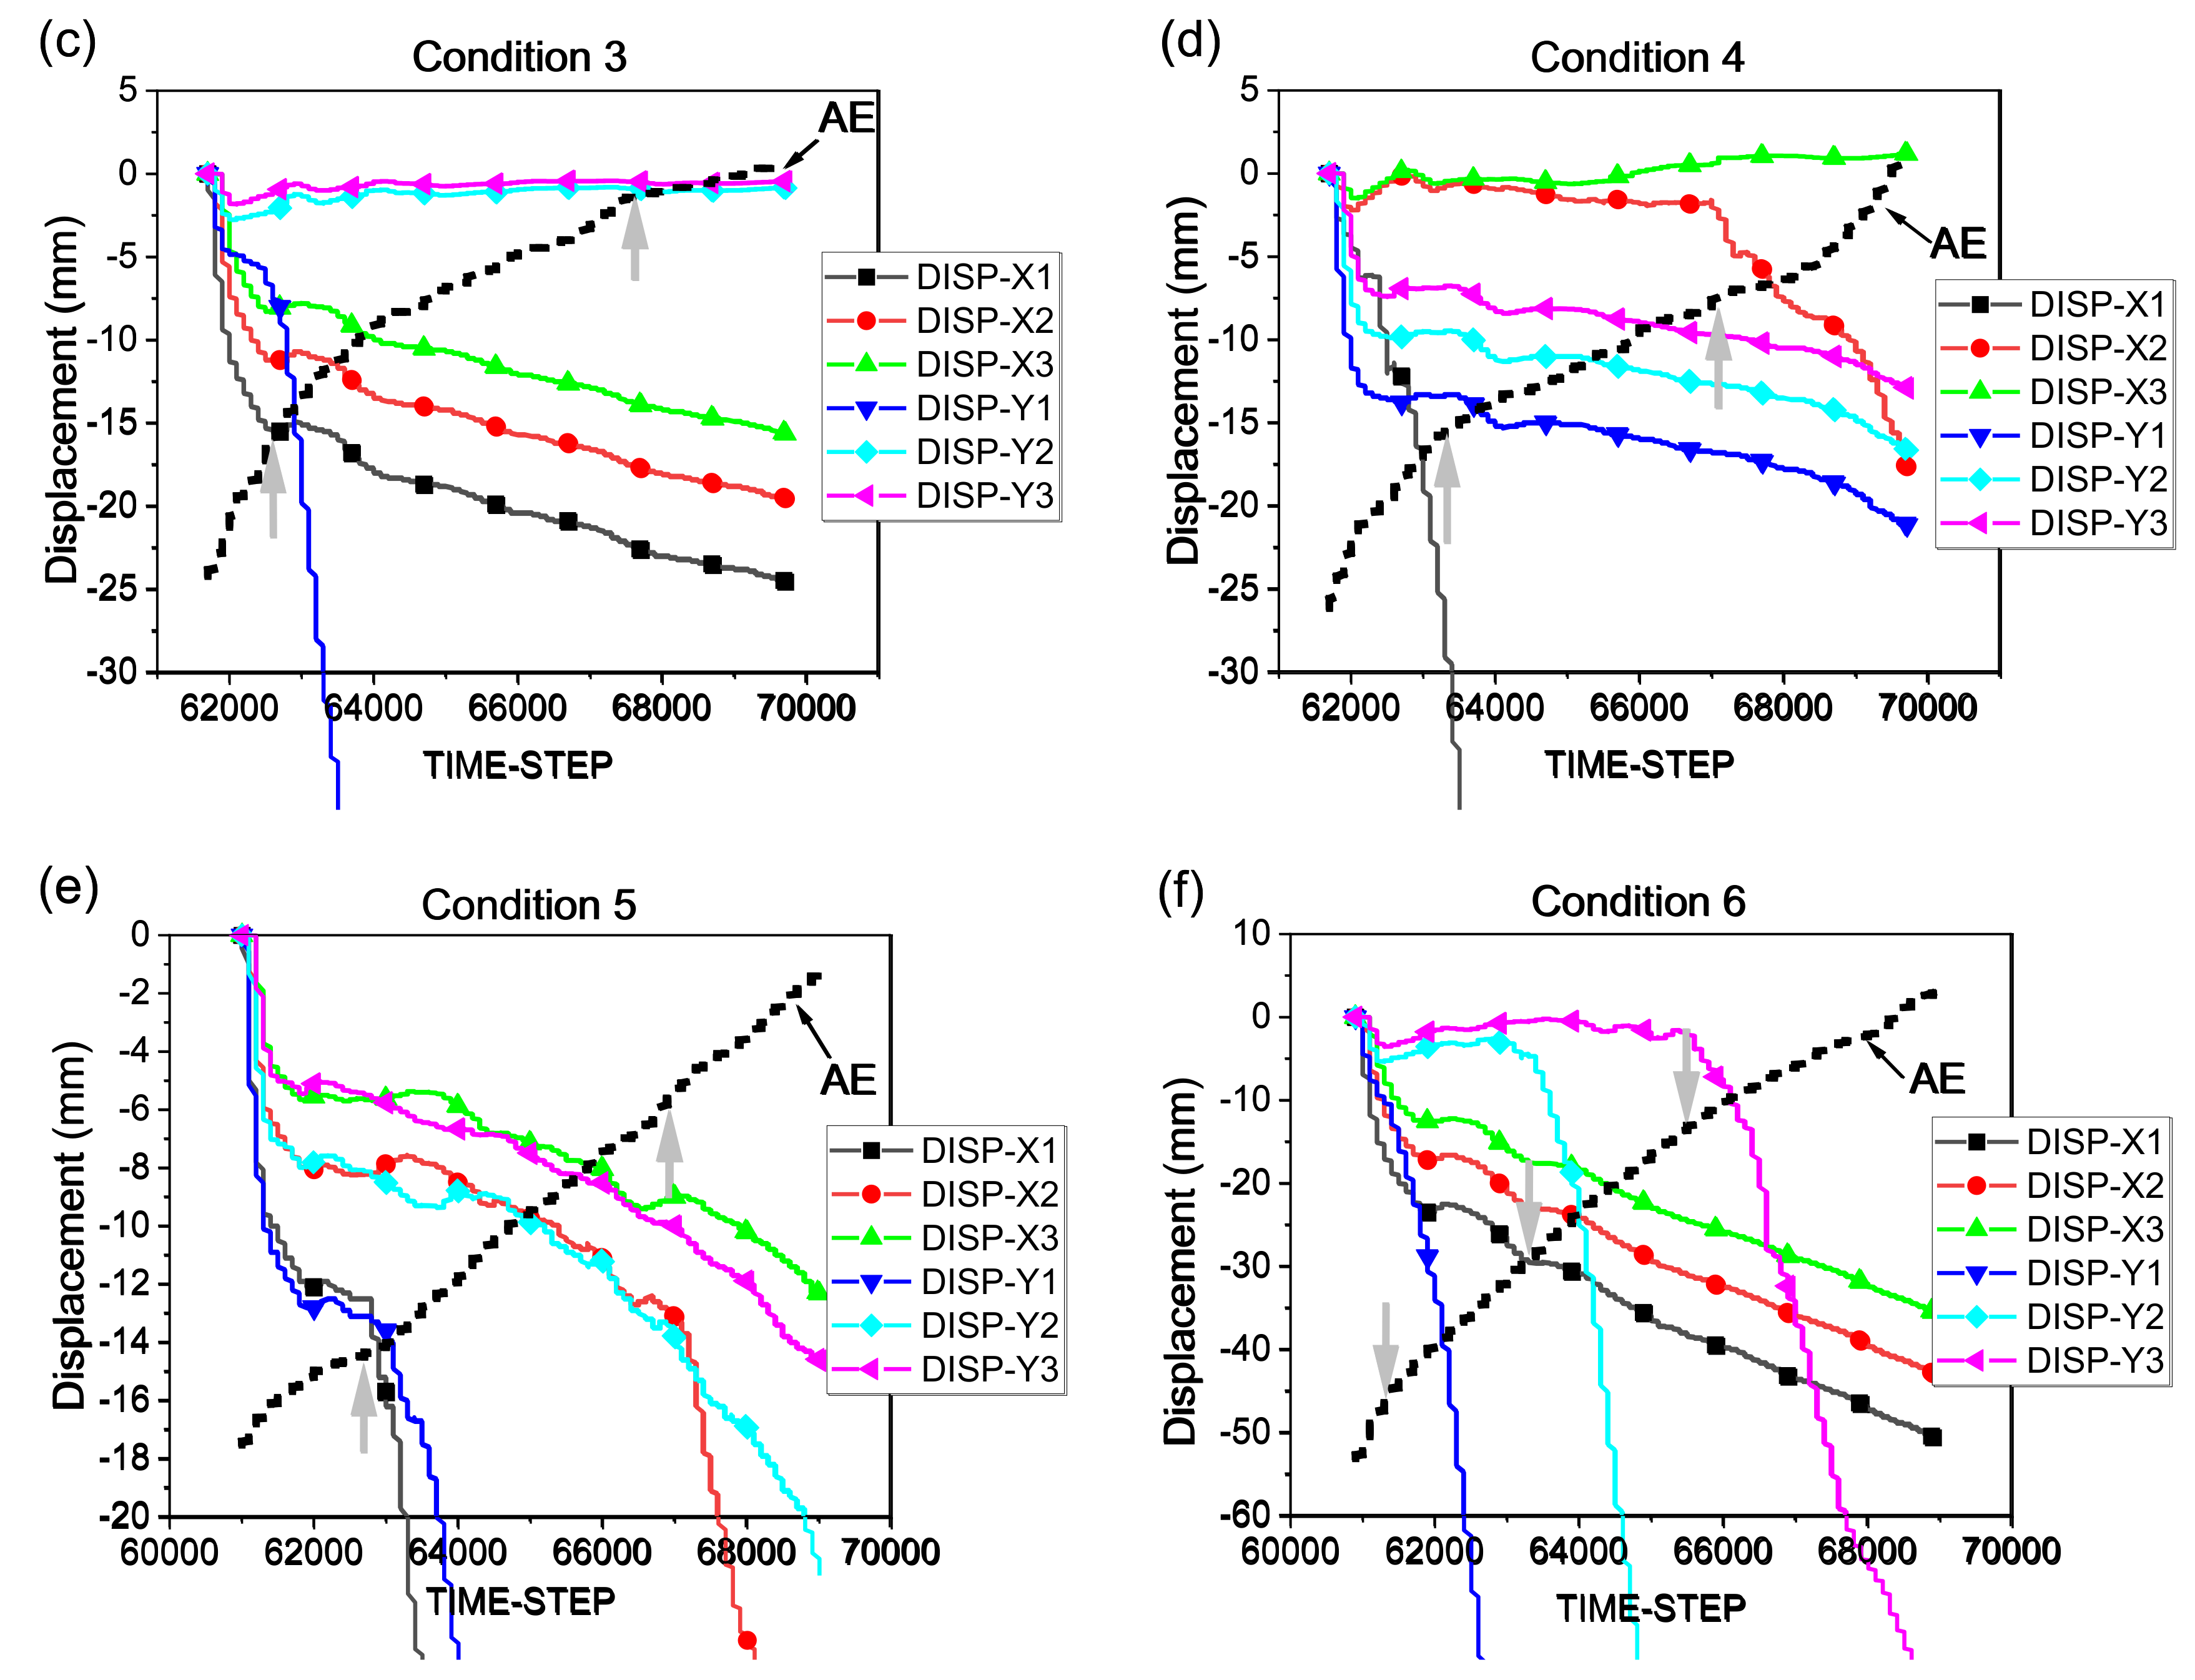
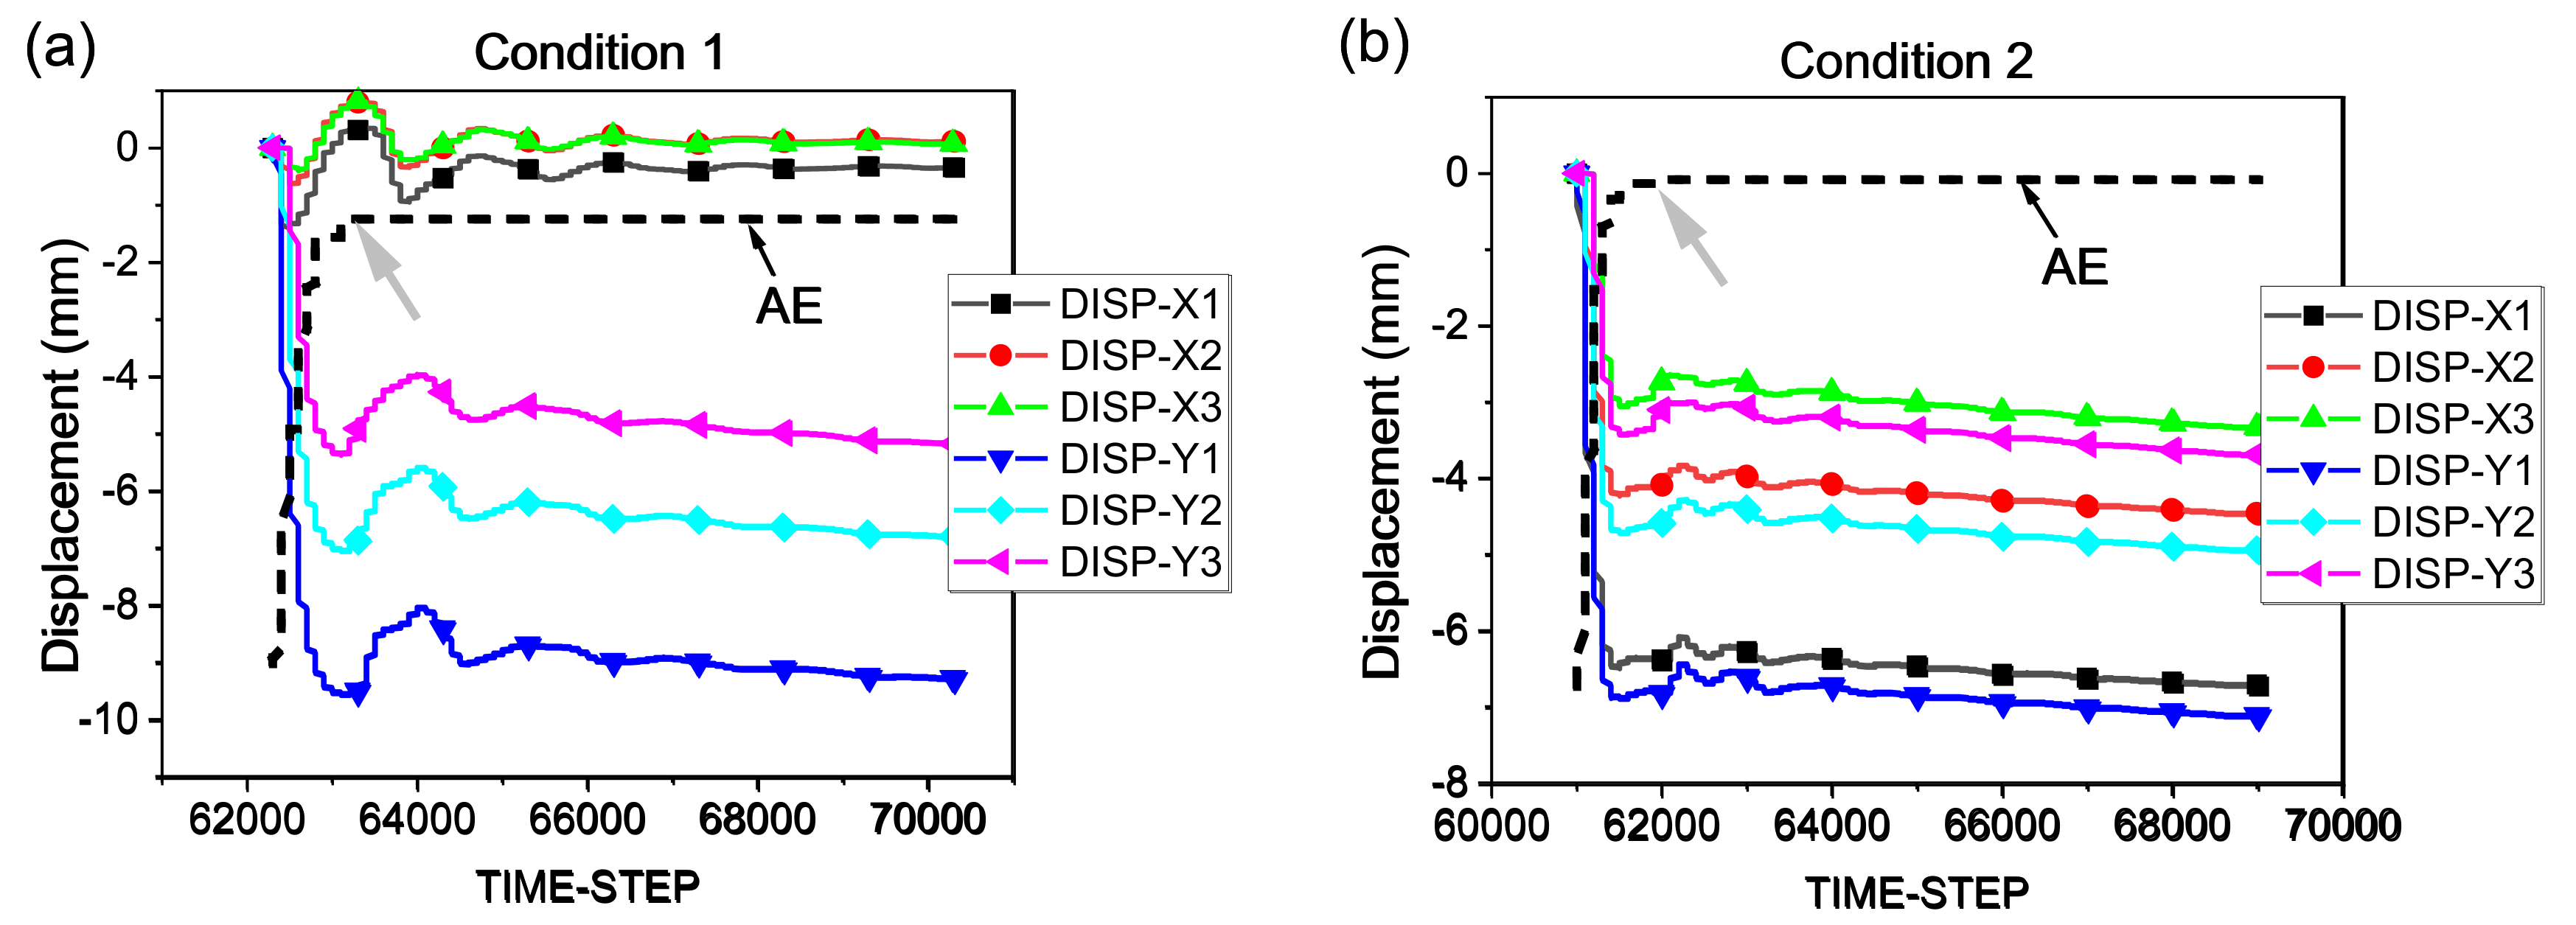
Figure 8 indicates the displacement monitoring data and AE curves for each condition. The AE curves represent the cumulative number of microcracks detected by acoustic emission monitoring. Please refer to the illustration in
Figure 4 for the legend.
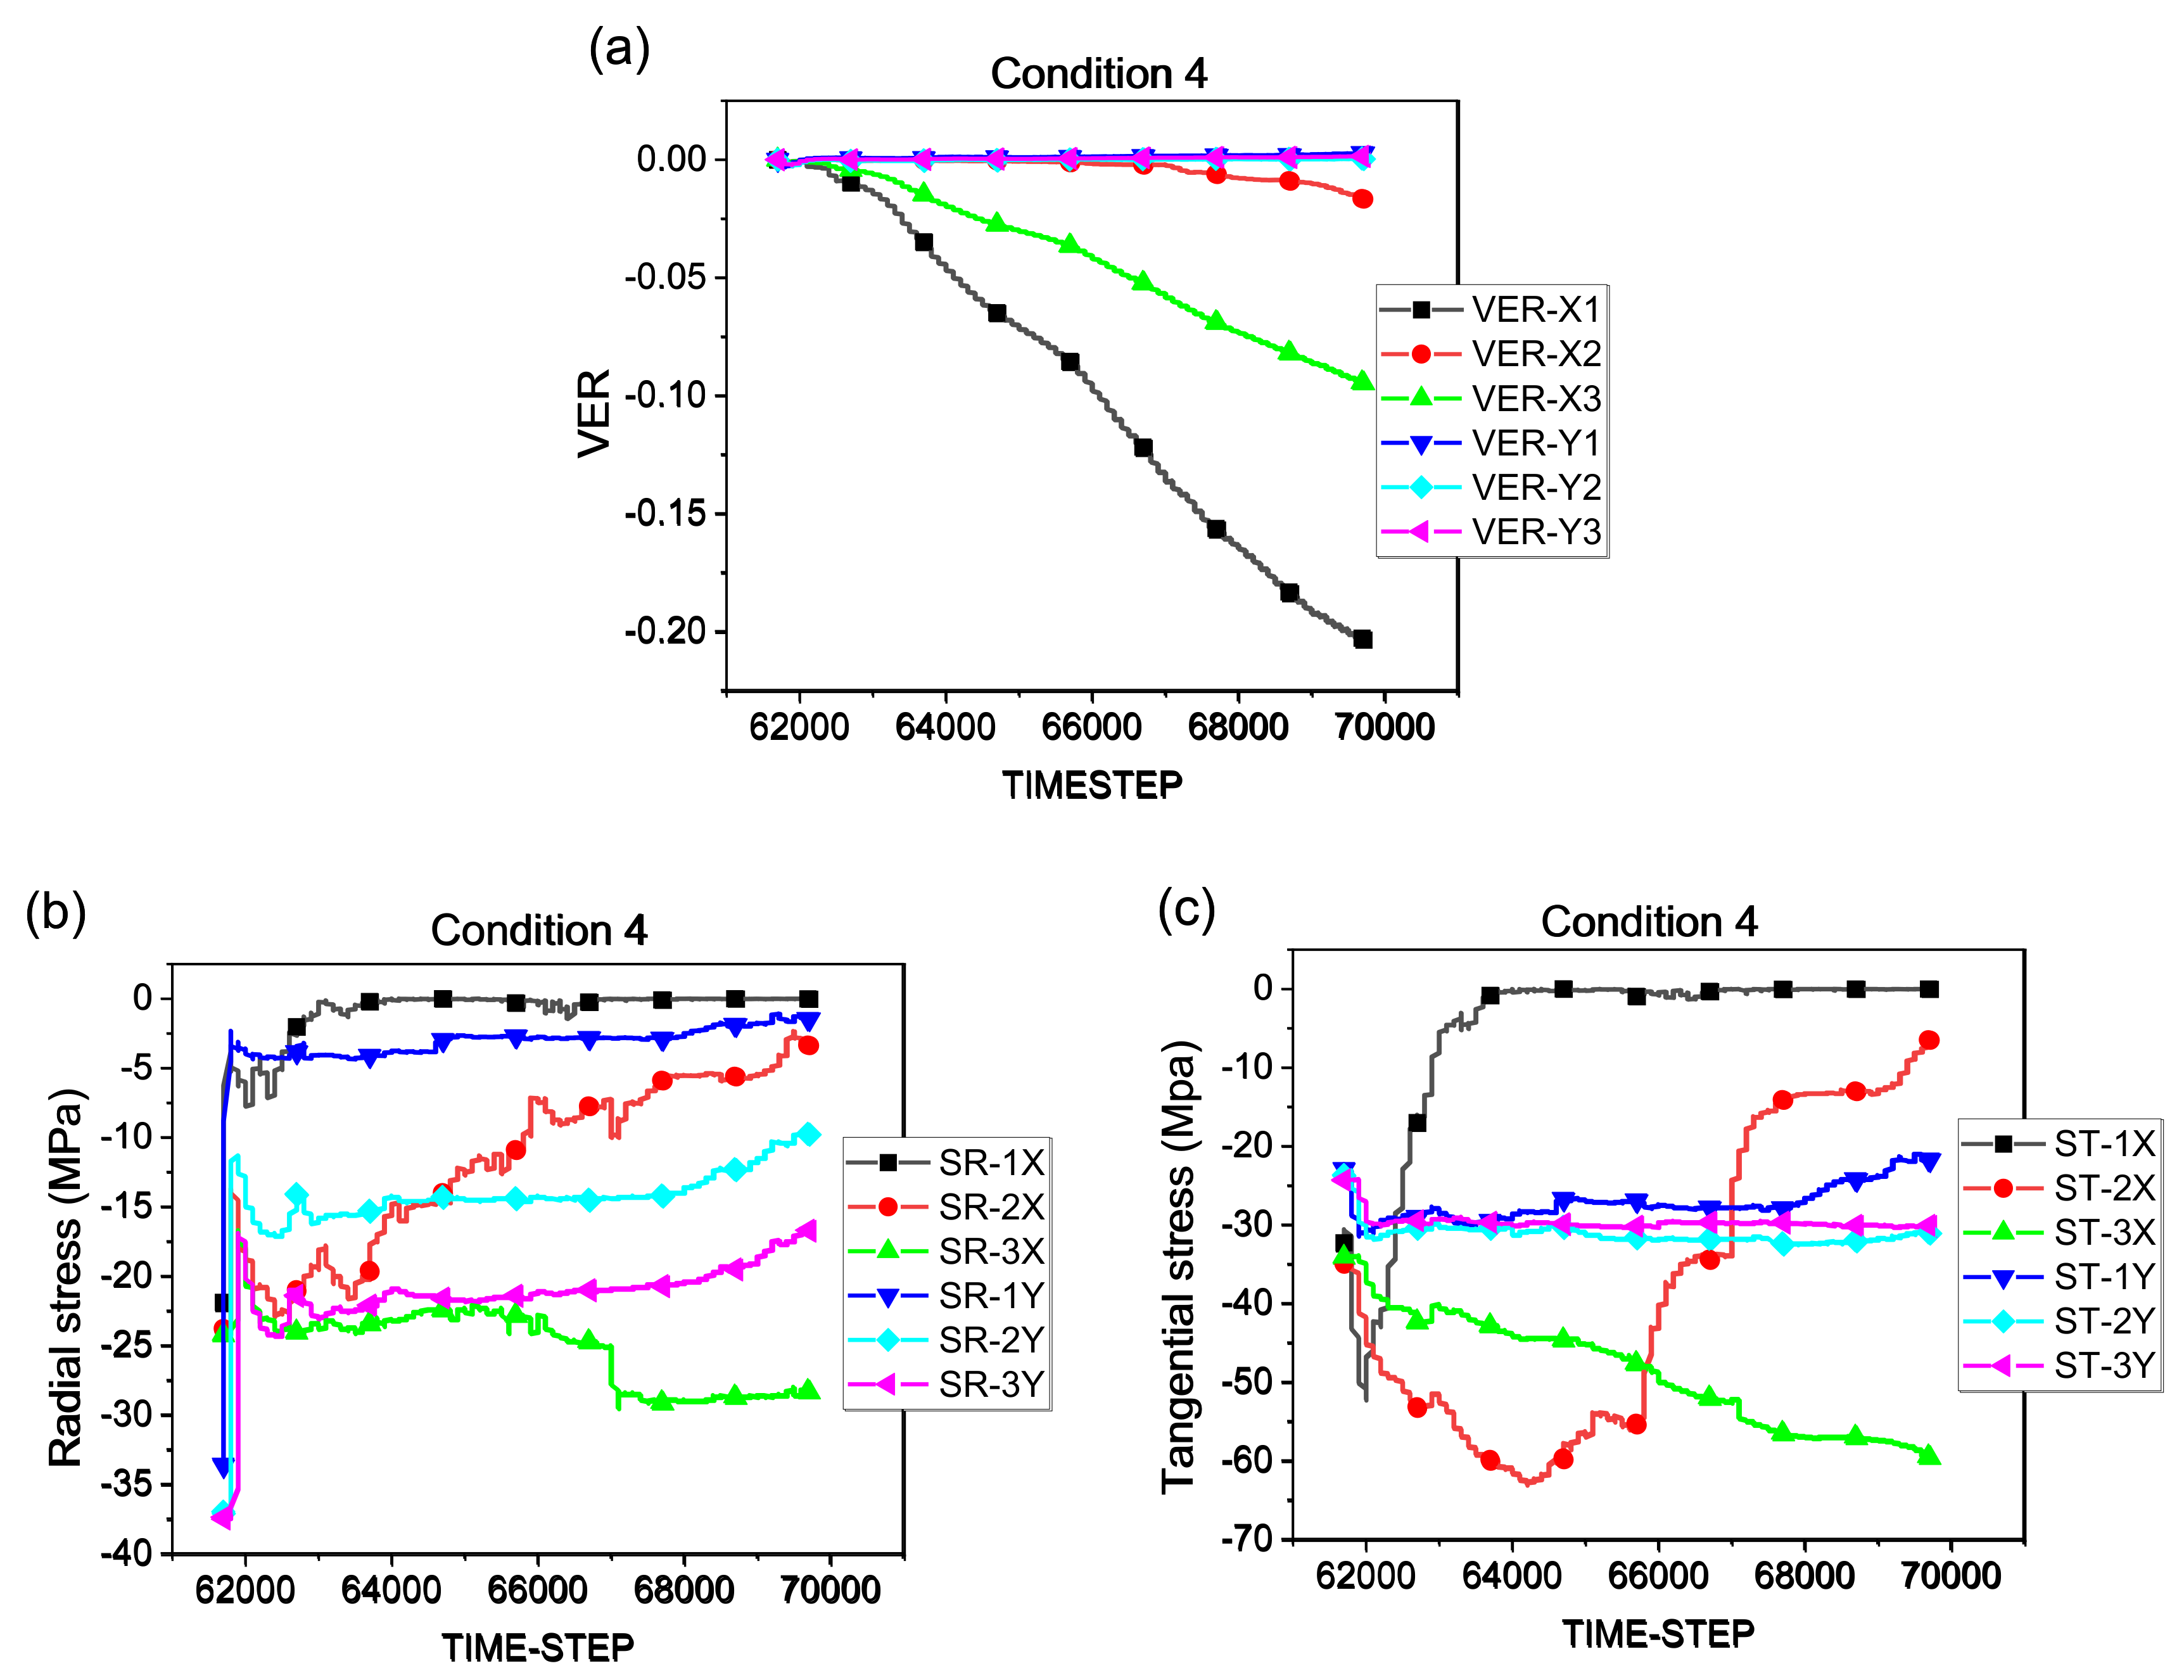
Figure 9 only illustrates the results for condition 4, with VER curves, radial stress, and tangential stress curves. The analysis of the test results for four aspects is as follows:
- (1)
Rationality analysis of the monitoring data.
On the one hand, the variation trend of the displacement and stress monitoring data obtained from the simulated tests aligns with the actual engineering monitoring data. The displacement near the tunnel’s free face is larger than that of the transverse deep rock mass. The surrounding rock in condition 1 can achieve self-stabilization, corresponding to practical engineering. On the other hand, the order of magnitude of the monitoring data is reasonable. Under conditions 1 and 2, the surrounding rock attains stability through its self-bearing capacity, with the maximum displacement not exceeding 10 mm when achieving stability. In other conditions, the surrounding rock gradually loses stability at some timesteps, and the corresponding displacement of the measuring points exhibits a sudden change. Under conditions 3 to 5, the maximum displacement of the measuring points at the non-instability part is within 25 mm, and 50 mm under condition 6.
- (2)
Analysis of the displacement and VER index.
Under conditions 1 and 2, the displacement increases rapidly after tunnel excavation, reaching a peak point. After this peak, the displacement decreases slightly, indicating that this part’s deformation is elastic. Following a period of fluctuation, the displacement curve stabilizes. The displacement of the tunnel top under condition 1 is significantly larger than that of the sidewall, and the displacement of the tunnel’s top under condition 2 is equivalent to that of the sidewall. Damage under conditions 3 and 6 occurs at the tunnel’s top and bottom, but the displacement of the sidewall is much larger than that of the tunnel’s top. The displacement of measuring points Y1, Y2, and Y3 under condition 6 changes abruptly, indicating that the surrounding rock at the corresponding timestep is unstable and damaged. The displacement of shallow measuring points X1 and X2 in the sidewall under condition 4 mutates in turn, and the VER curve shows that the expansion rate of condition 4 on the tunnel top is about zero. The expansion degree between X1–X2 > X1–X3 > X2–X3 indicates the damage degree in the surrounding rock with transverse depth. Compared to the single-point displacement index, the VER index emphasizes result changes at different positions and the degree of damage and deformation between the rock units, which proves beneficial.
- (3)
Surrounding rock stress analysis.
Following the tunnel excavation, the stress equilibrium state is disrupted, and the stress in the surrounding rock is rapidly released. The closer to the orifice, the more intense the stress release. The stress then rebounds, and the stress balance state is re-established after a minor stress fluctuation. Both radial and tangential stresses undergo four stages of stress ‘Relief–Rise–Fluctuation–Stability’, as shown in
Figure 9b,c. As the depth of the measuring point increases, the degree of stress reduction decreases, and the stress level in the original rock is re-reached at a certain depth. The closer to the free surface, the more complete the pressure relief. The time when the radial stress decreases to the minimum value, increases with the depth of the measuring points, indicating that the stress release in the tunnel is gradually completed from the surface to the deep. The tangential stress gradually increases after a rapid and slight decrease, begins to fall after reaching the peak point, and finally achieves stability. The instantaneous stress reduction in the tangential stress after excavation is less than the radial stress. After the stress rebalances, the tangential stress is higher than the original rock stress at a certain depth, indicating that stress concentration occurs around the tunnel, as shown in
Figure 9c.
- (4)
Surrounding rock damage stage.
Based on the AE monitoring curve and the surrounding rock’s displacement mutation criterion, the surrounding rock’s deformation process in each condition is divided into several damage stages, as depicted in
Table 3. Conditions 1 and 2 are divided into two damage stages, conditions 3 to 5 are divided into three damage stages, and condition 6 is divided into four damage stages. Different damage stages carry different meanings under varying conditions. For conditions 1 and 2, the displacement of damage stage I increases rapidly, and its duration is brief. Damage stage II has essentially reached a stable state. However, for conditions 3 to 6, different damage stages correspond to various development trends of the microcracks in the surrounding rock and the failure stages of the measuring points at different depths.
Figure 8.
Displacement and AE monitoring curve.
Figure 8.
Displacement and AE monitoring curve.
Figure 9.
VER (a) and radial & tangential stress (b,c) monitoring curve for condition 4.
Figure 9.
VER (a) and radial & tangential stress (b,c) monitoring curve for condition 4.
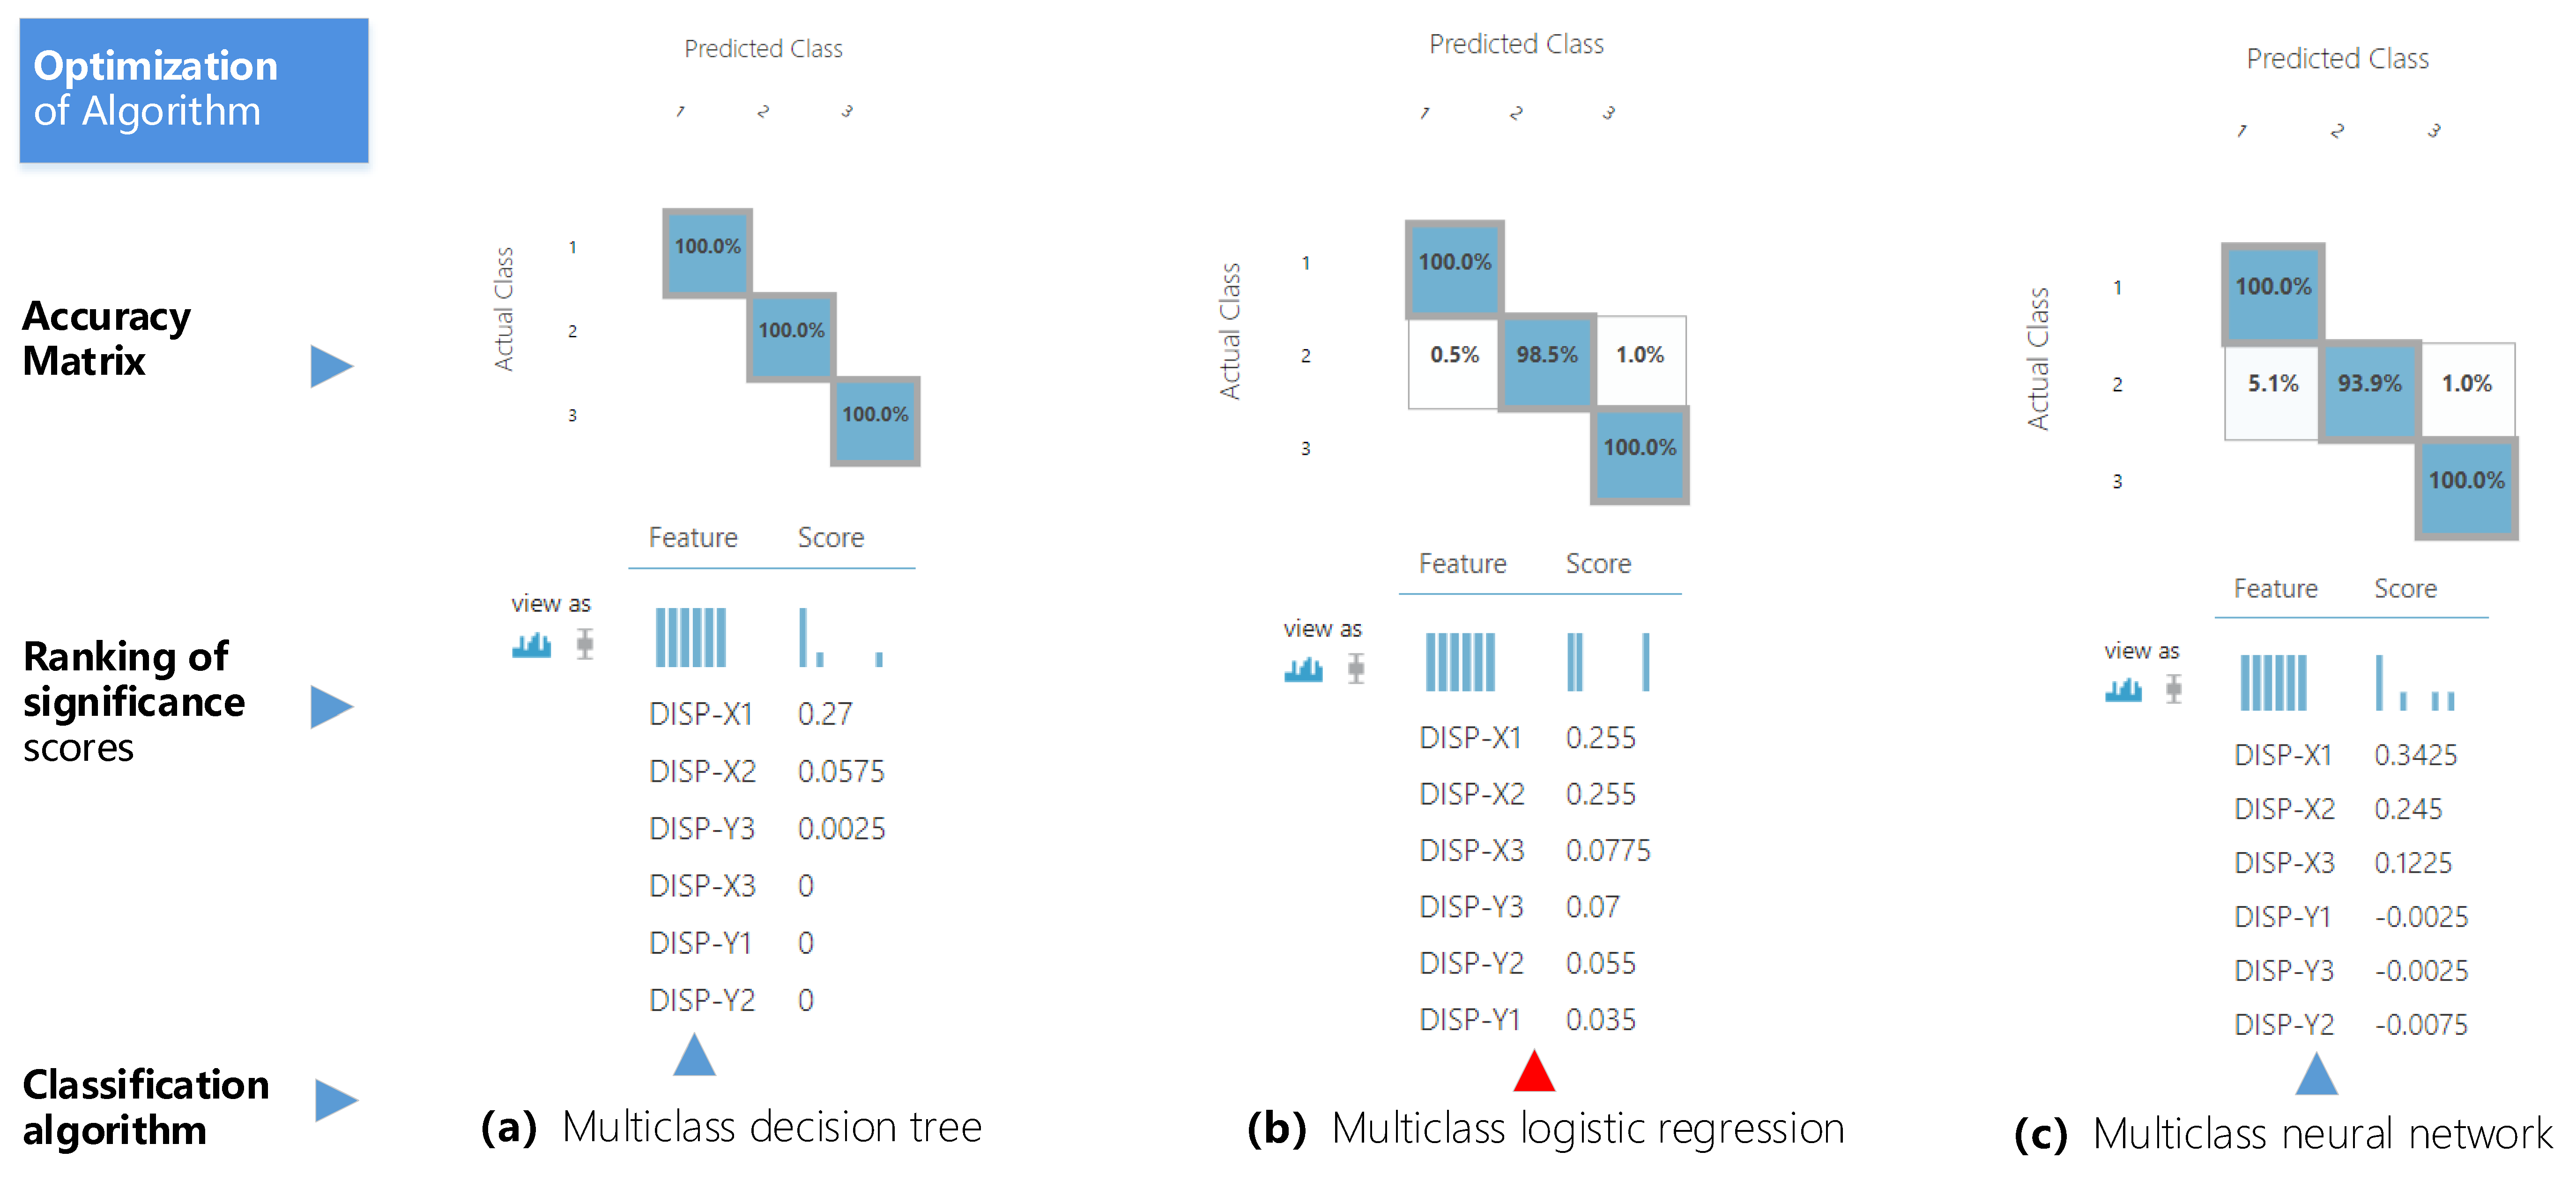
3.2. Algorithm Optimization
The optimal algorithm must be chosen from three classification prediction methods: multi-class decision tree, multi-class logistic regression, and multi-class neural network. Each of the three algorithms is applied for trial calculations in succession using the monitoring data from Condition 4 as the test subject, with only the displacement indices chosen as the data feature.
Figure 10 depicts the optimization results. It indicates that all three algorithms have a high level of accuracy when determining damage. The specific accuracy order is as follows: multi-class decision tree > multi-class logistic regression > multi-class neural network. The multi-class decision tree classifies all the data samples accurately, with the diagonal numbers in its accuracy matrix all being 100%. The results produced by the multi-class logistic regression had a 1.5% error in determining damage stage II, but were entirely correct for stages I and III. The results produced by the multi-class neural network had a 6.1% error in determining damage stage II, but were completely correct for stages I and III. Considering the determination accuracy, the multi-class neural network algorithm is eliminated first.
The algorithm’s quality is then considered from the perspective of the significant results from the index. The order of significance indices for the multi-class decision tree algorithm is DISP-X1 > DISP-X2 > DISP-Y3 > DISP-X3 = 0. The order of significance indices for the multiple logistic regression algorithm is DISP-X1 = DISP-X2 > DISP-X3 ≈ DISP-Y3 > DISP-Y1 ≈ DISP-Y2. For condition 4, the damage range for the surrounding rock covers the X1 and X2 measurement points on the side wall but does not reach the X3 measurement point; there is almost no damage at the top of the tunnel. Based on the above analysis, the multi-class logistic regression algorithm appears more suitable for the application scenario on determining surrounding rock damage.
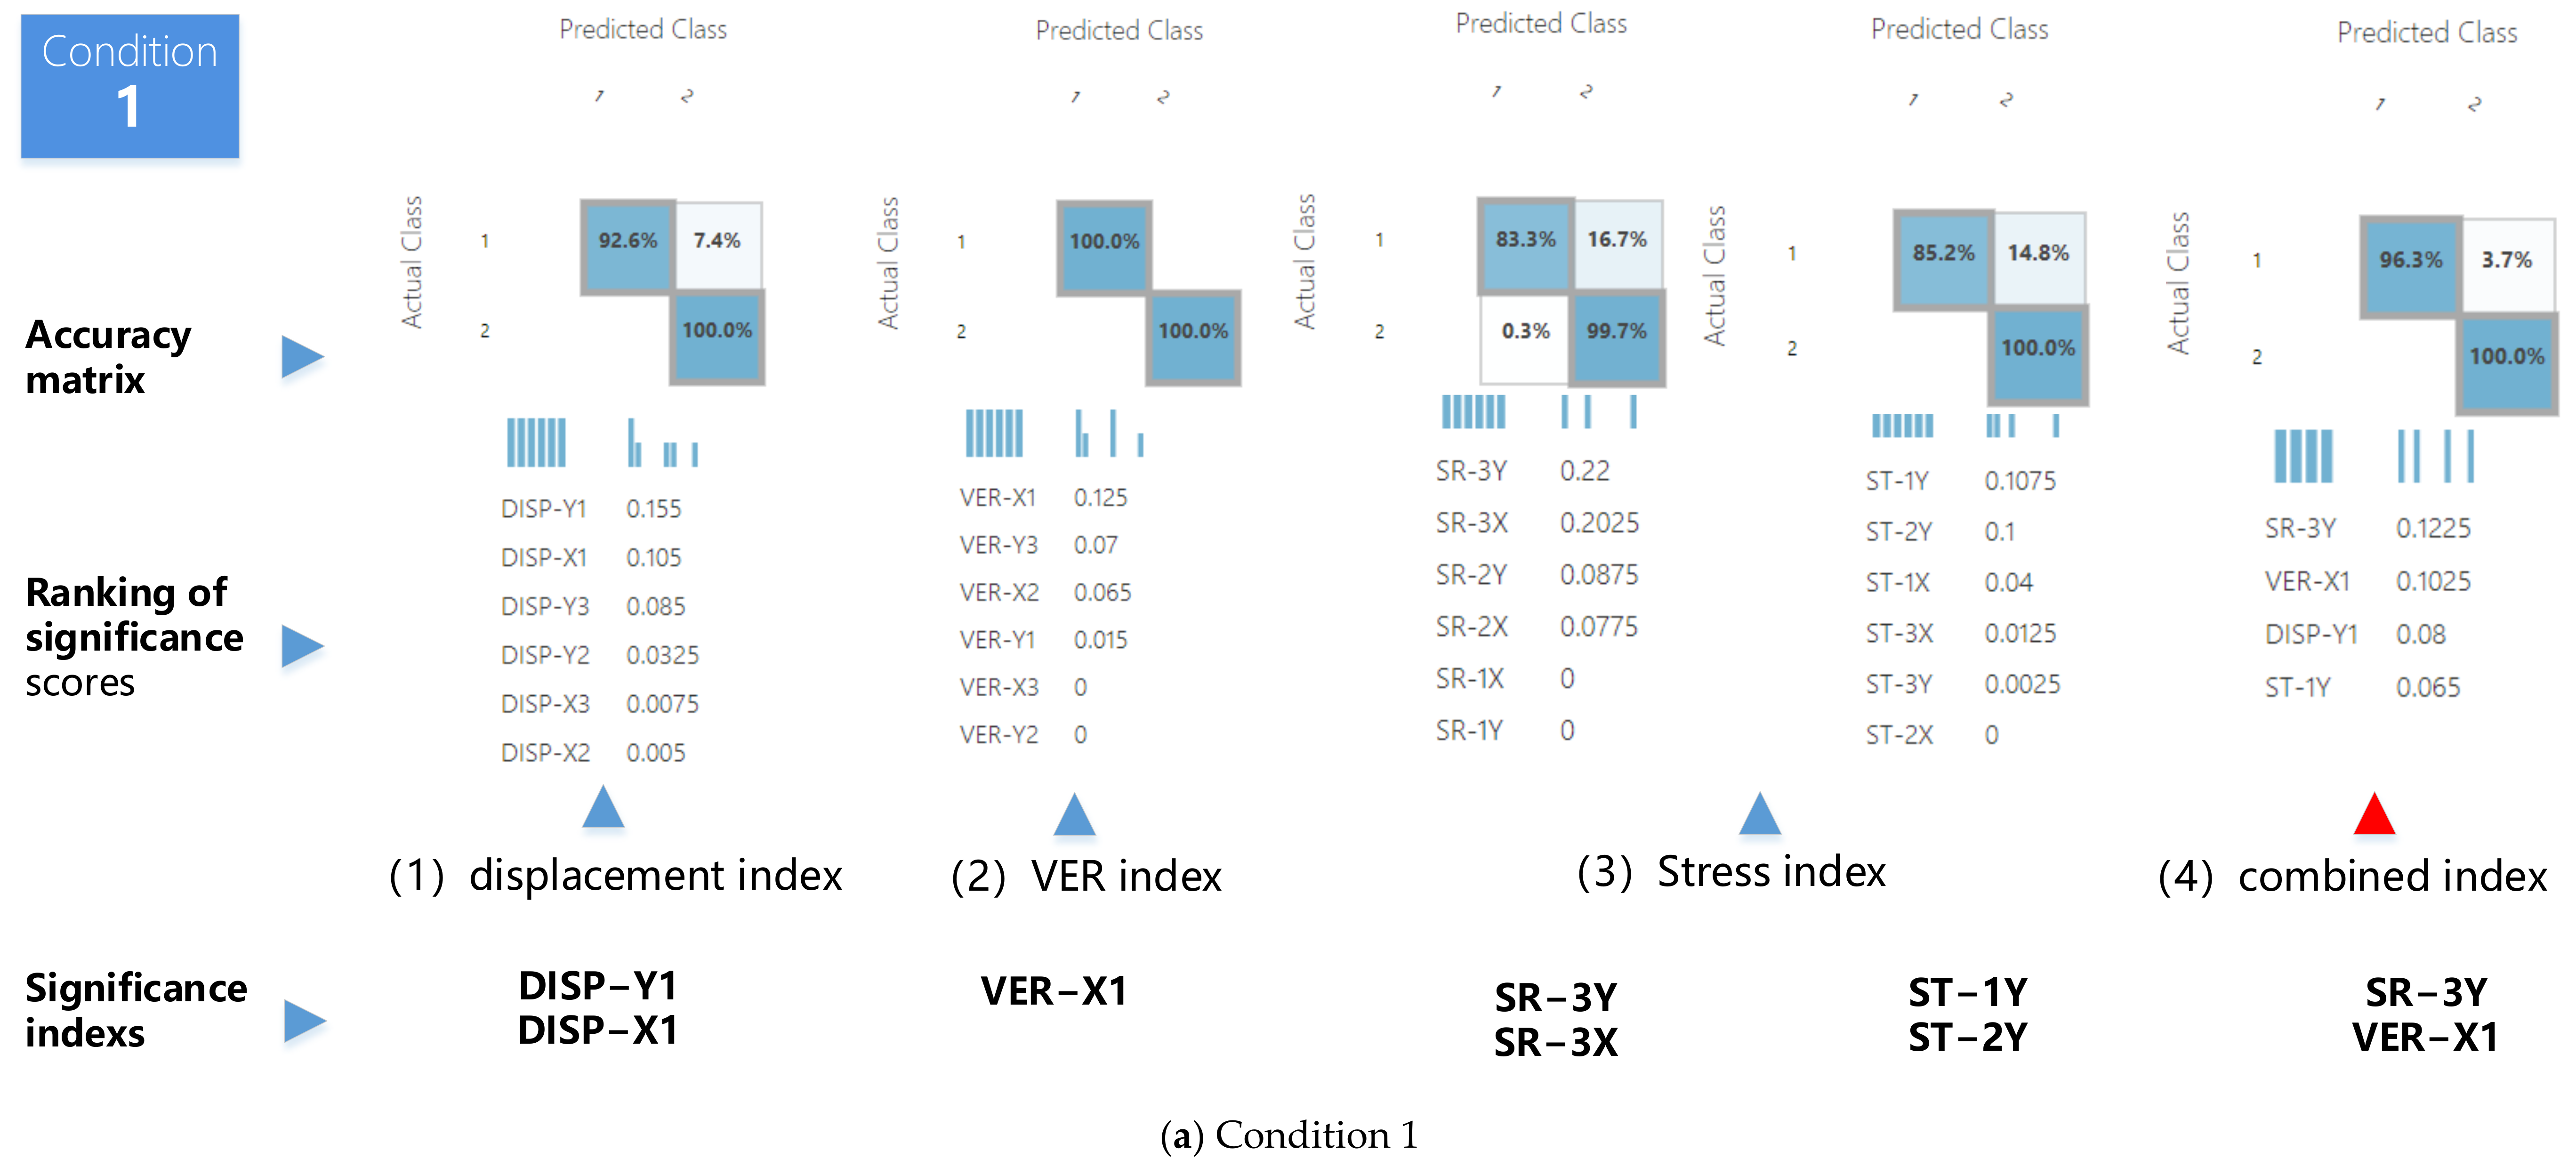
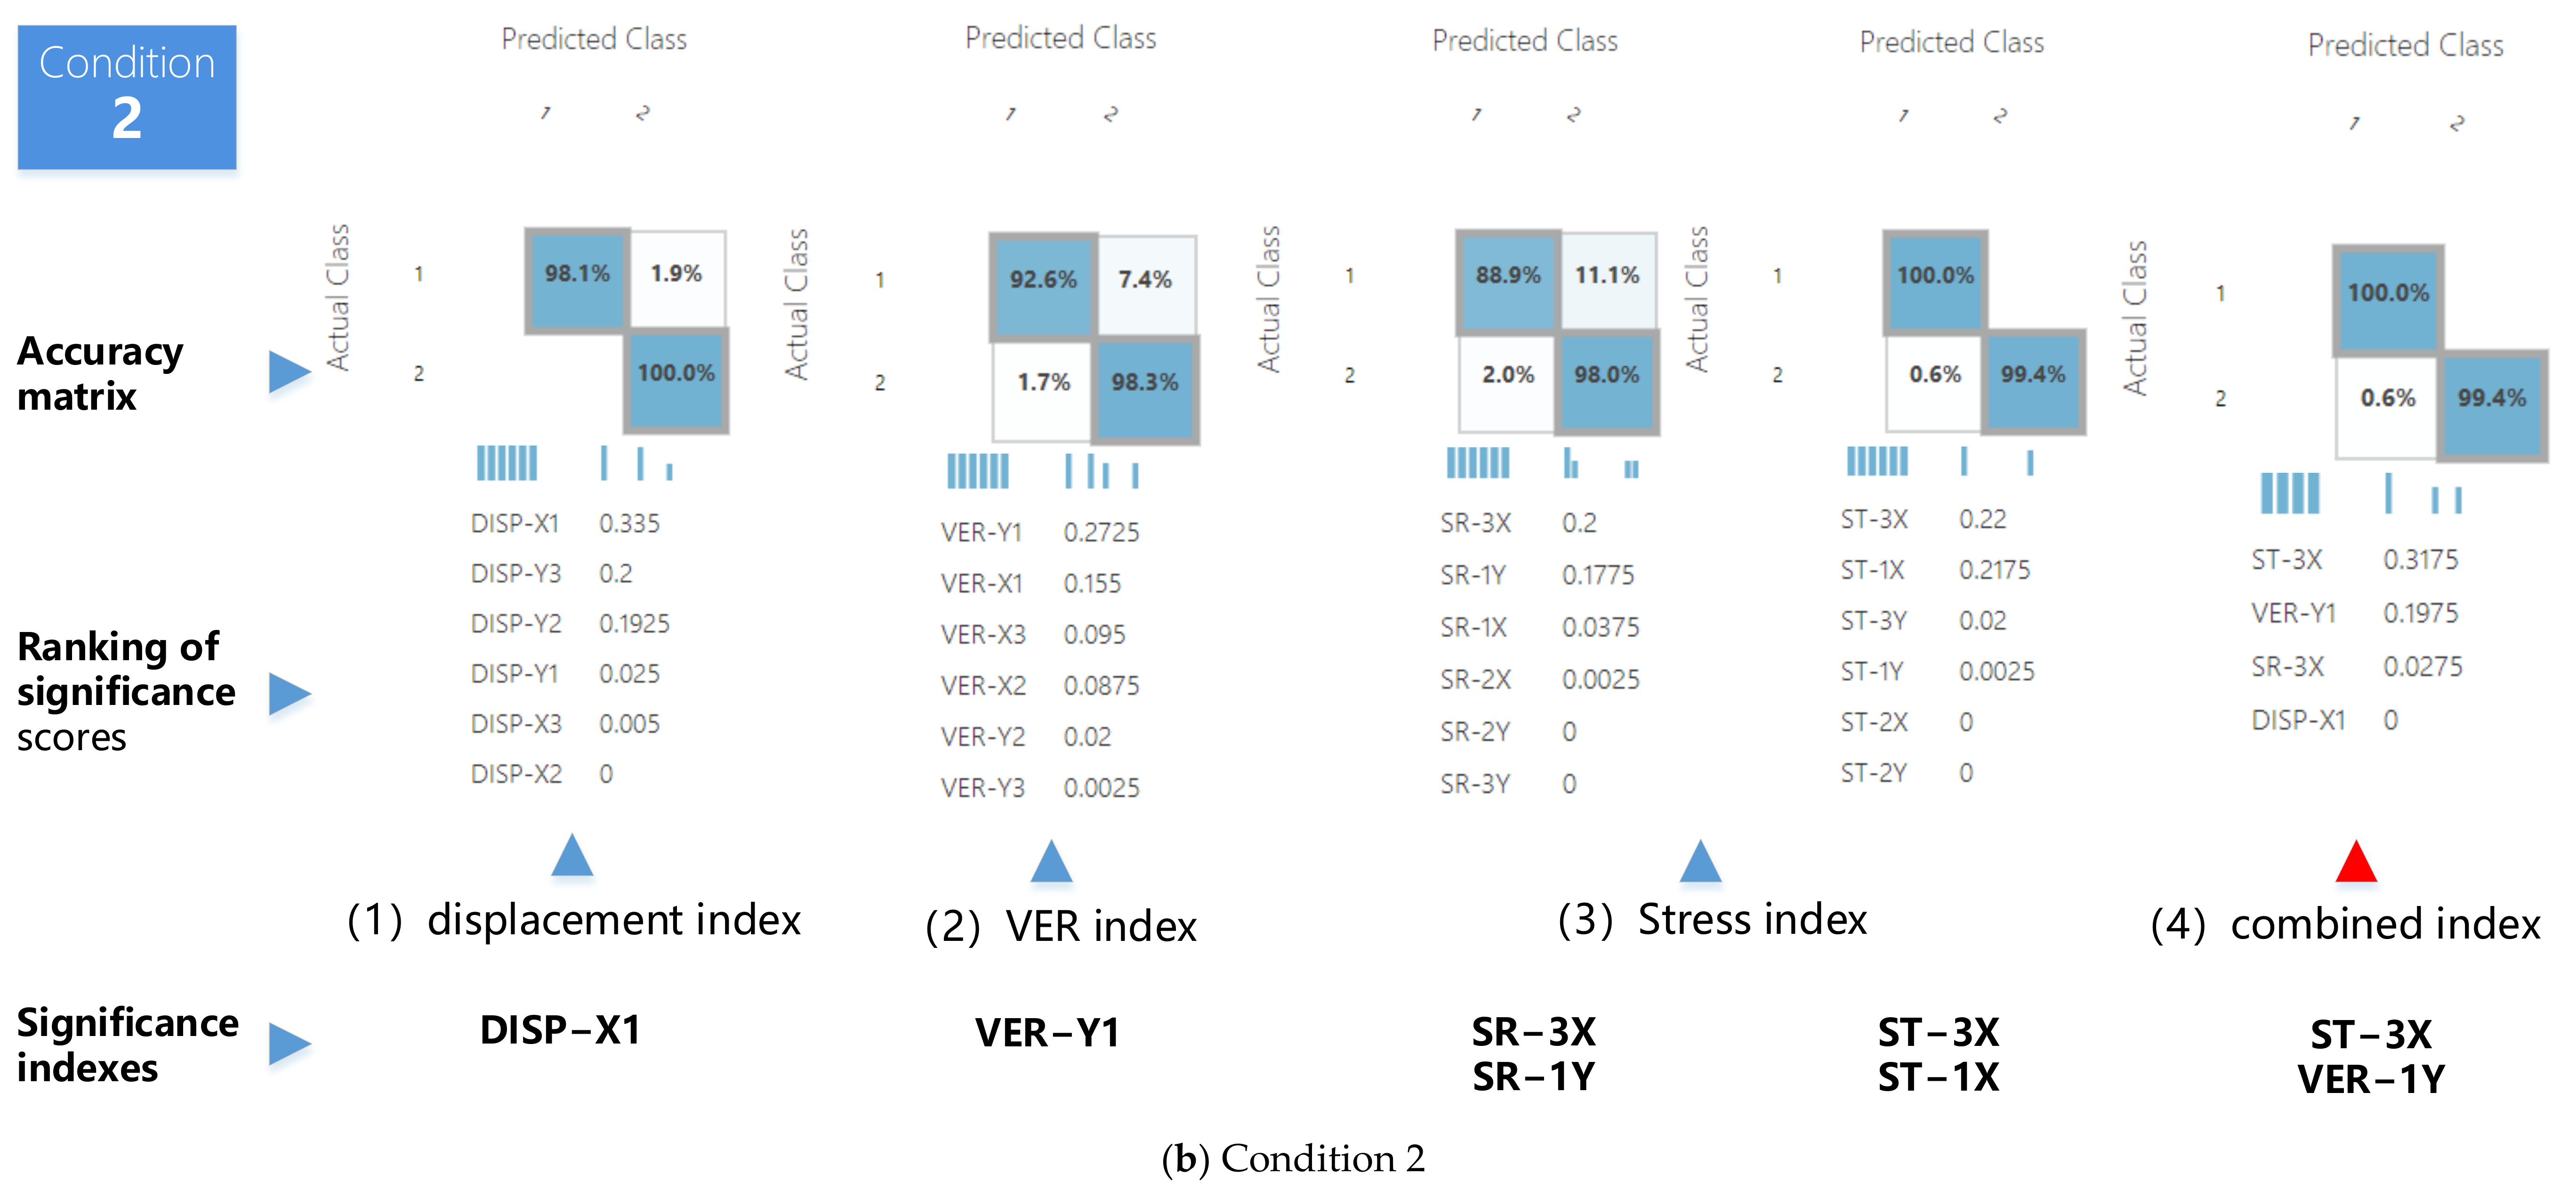
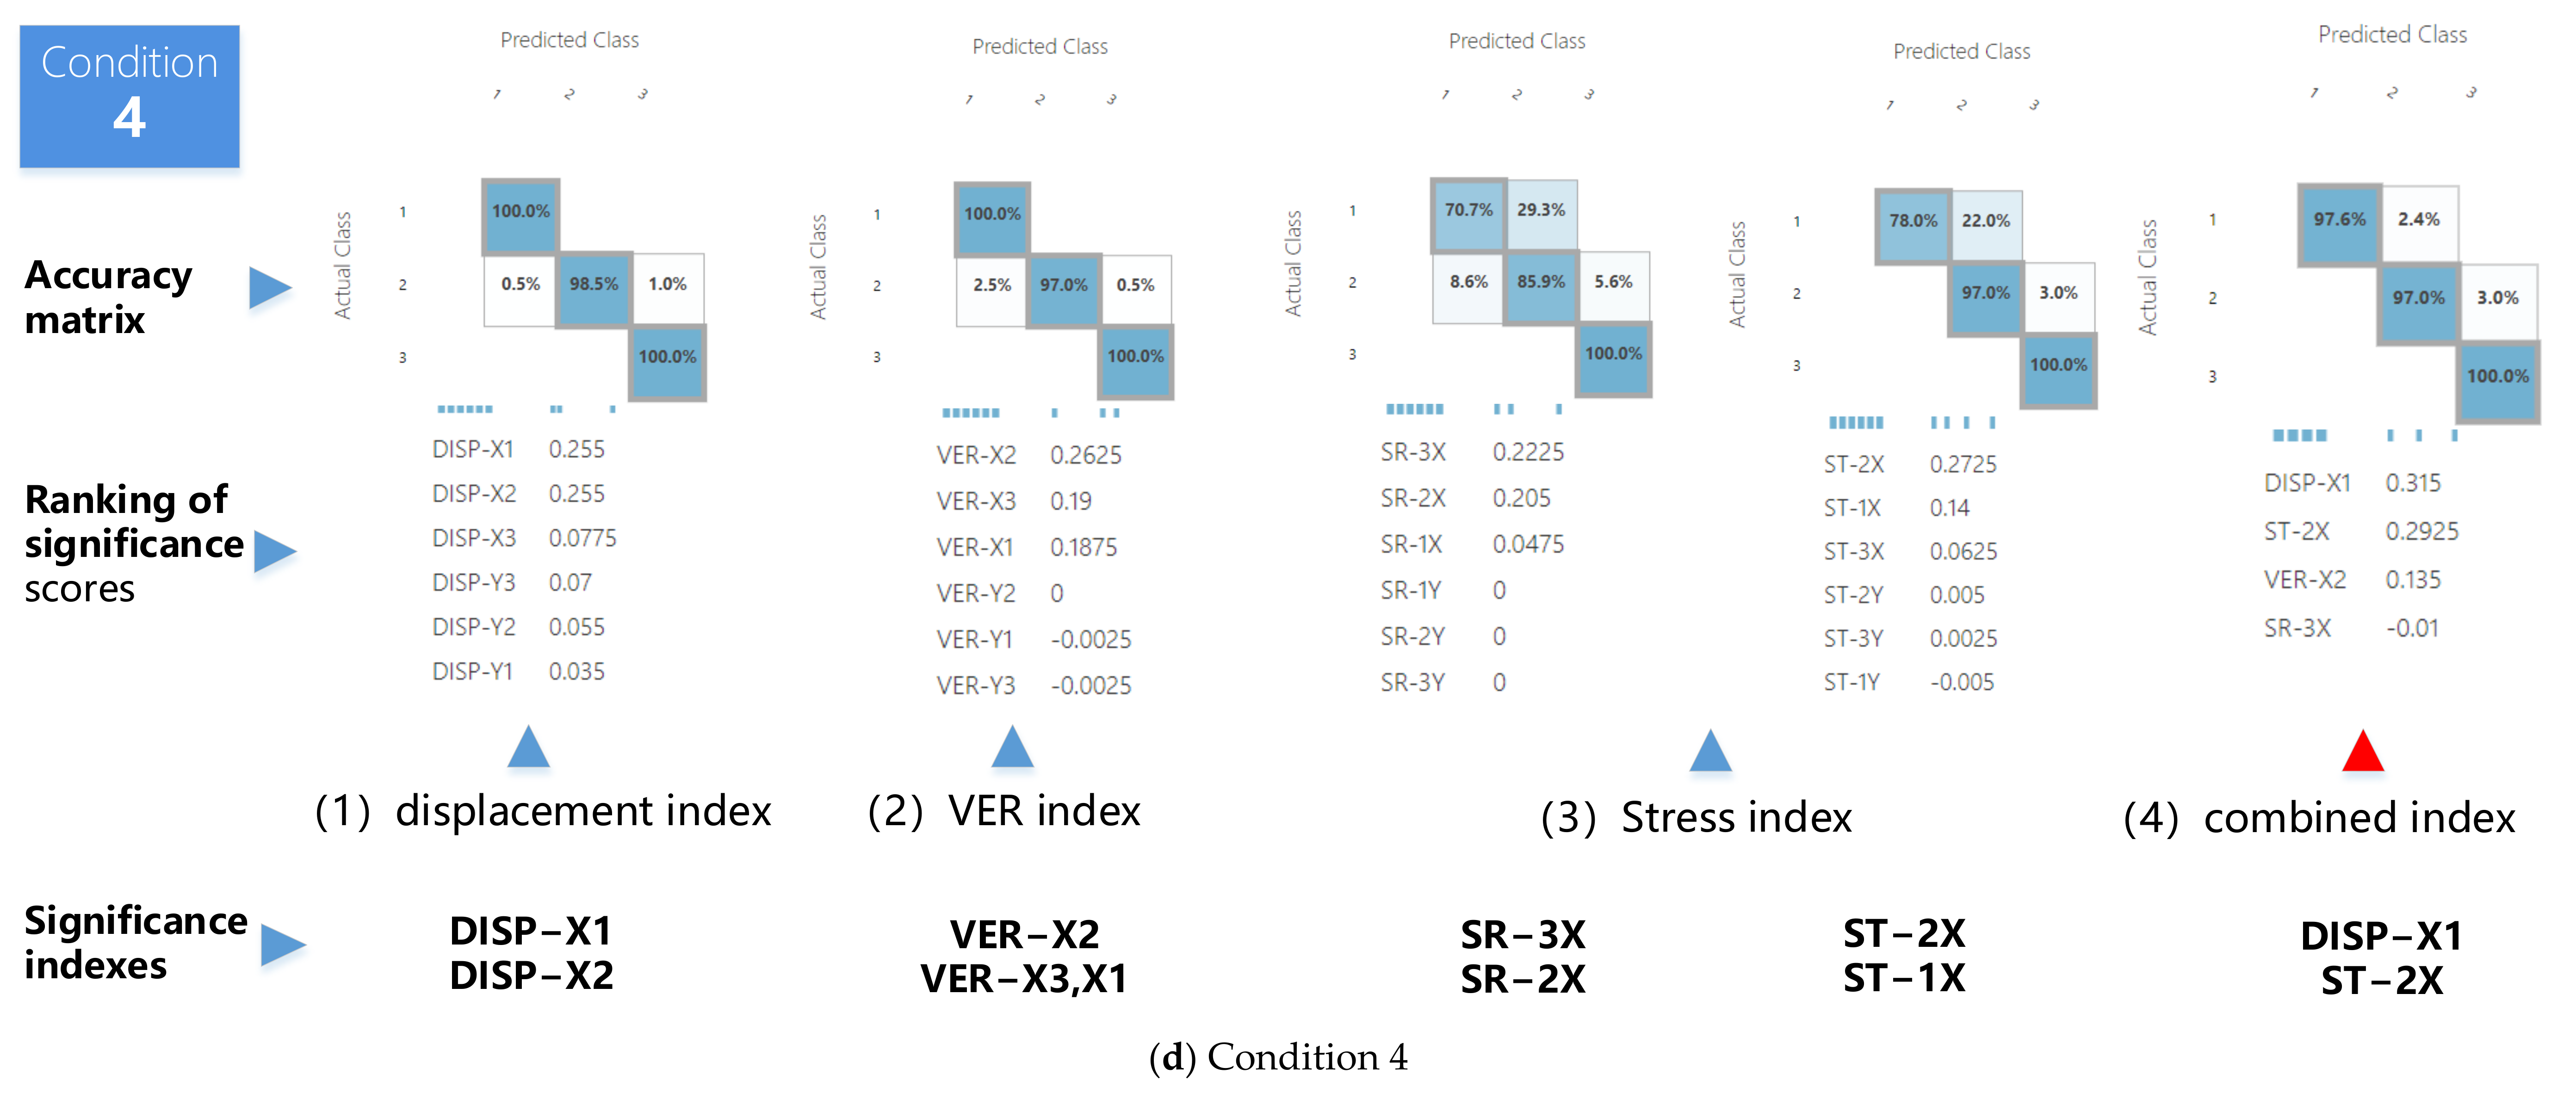
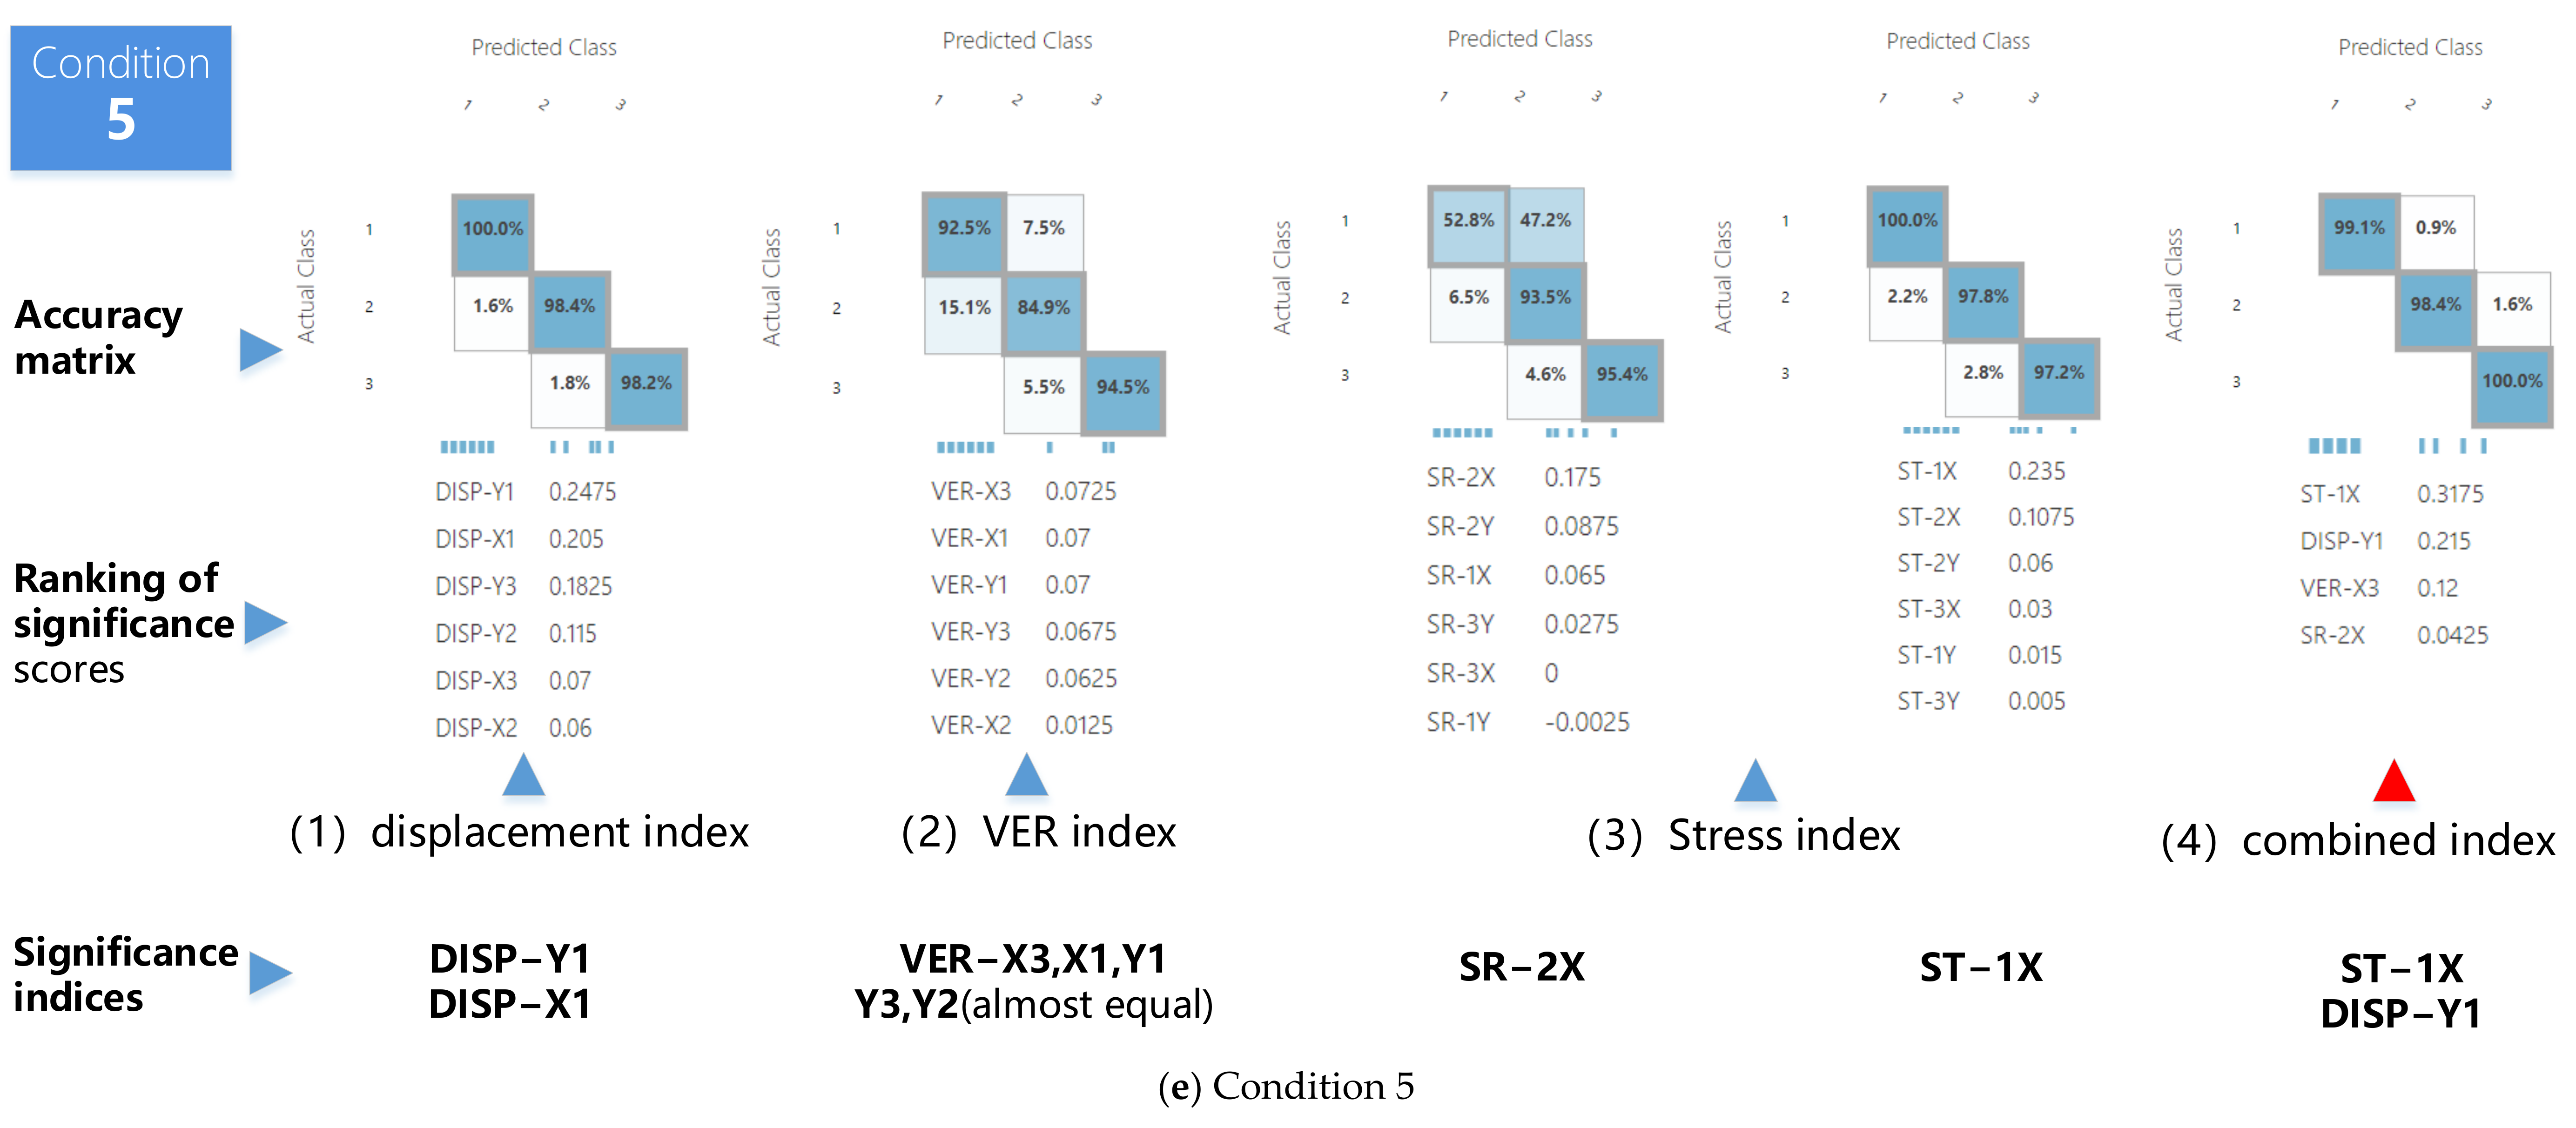
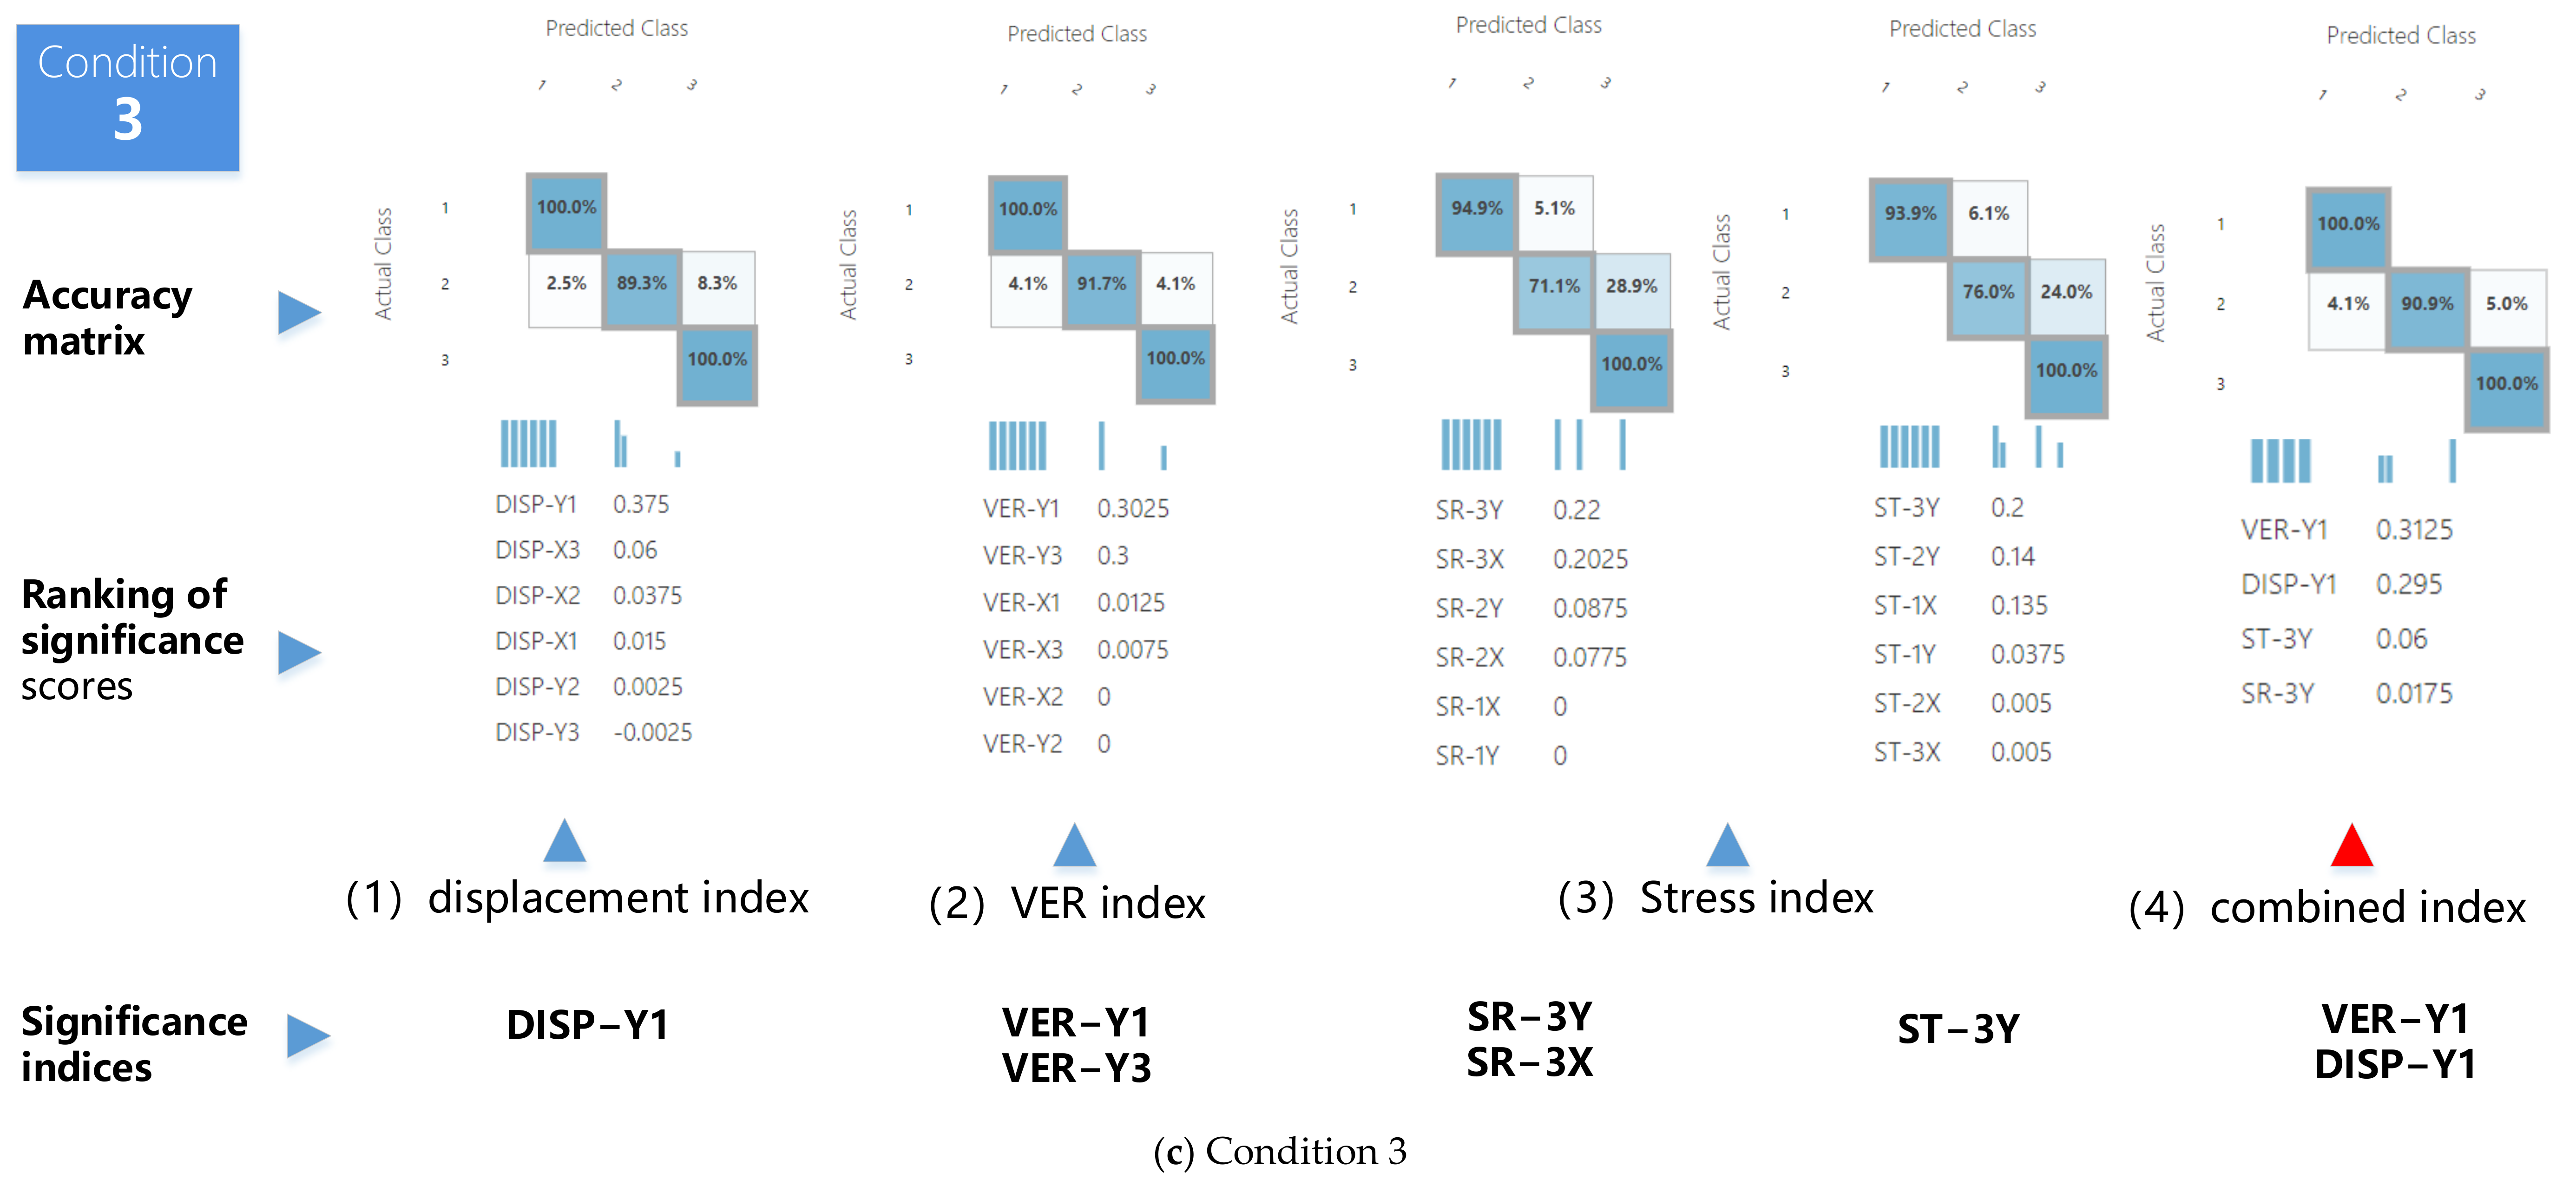
3.3. Effectiveness Evaluation
The test strategy design dictates that each condition must undergo five rounds of calculations. Specifically, all displacement, VER, radial, and tangential stress indices for each condition are separately calculated, following which the optimal results for the four indices are selected and combined into comprehensive indices for the collective calculation of different indices. Such testing strategies not only explore the effectiveness of the same type of indices, but also enable comparisons on the effectiveness of different indices. The prediction accuracy matrix diagram and the index significance score ranking for each condition are then derived. Following this process, the results are presented in
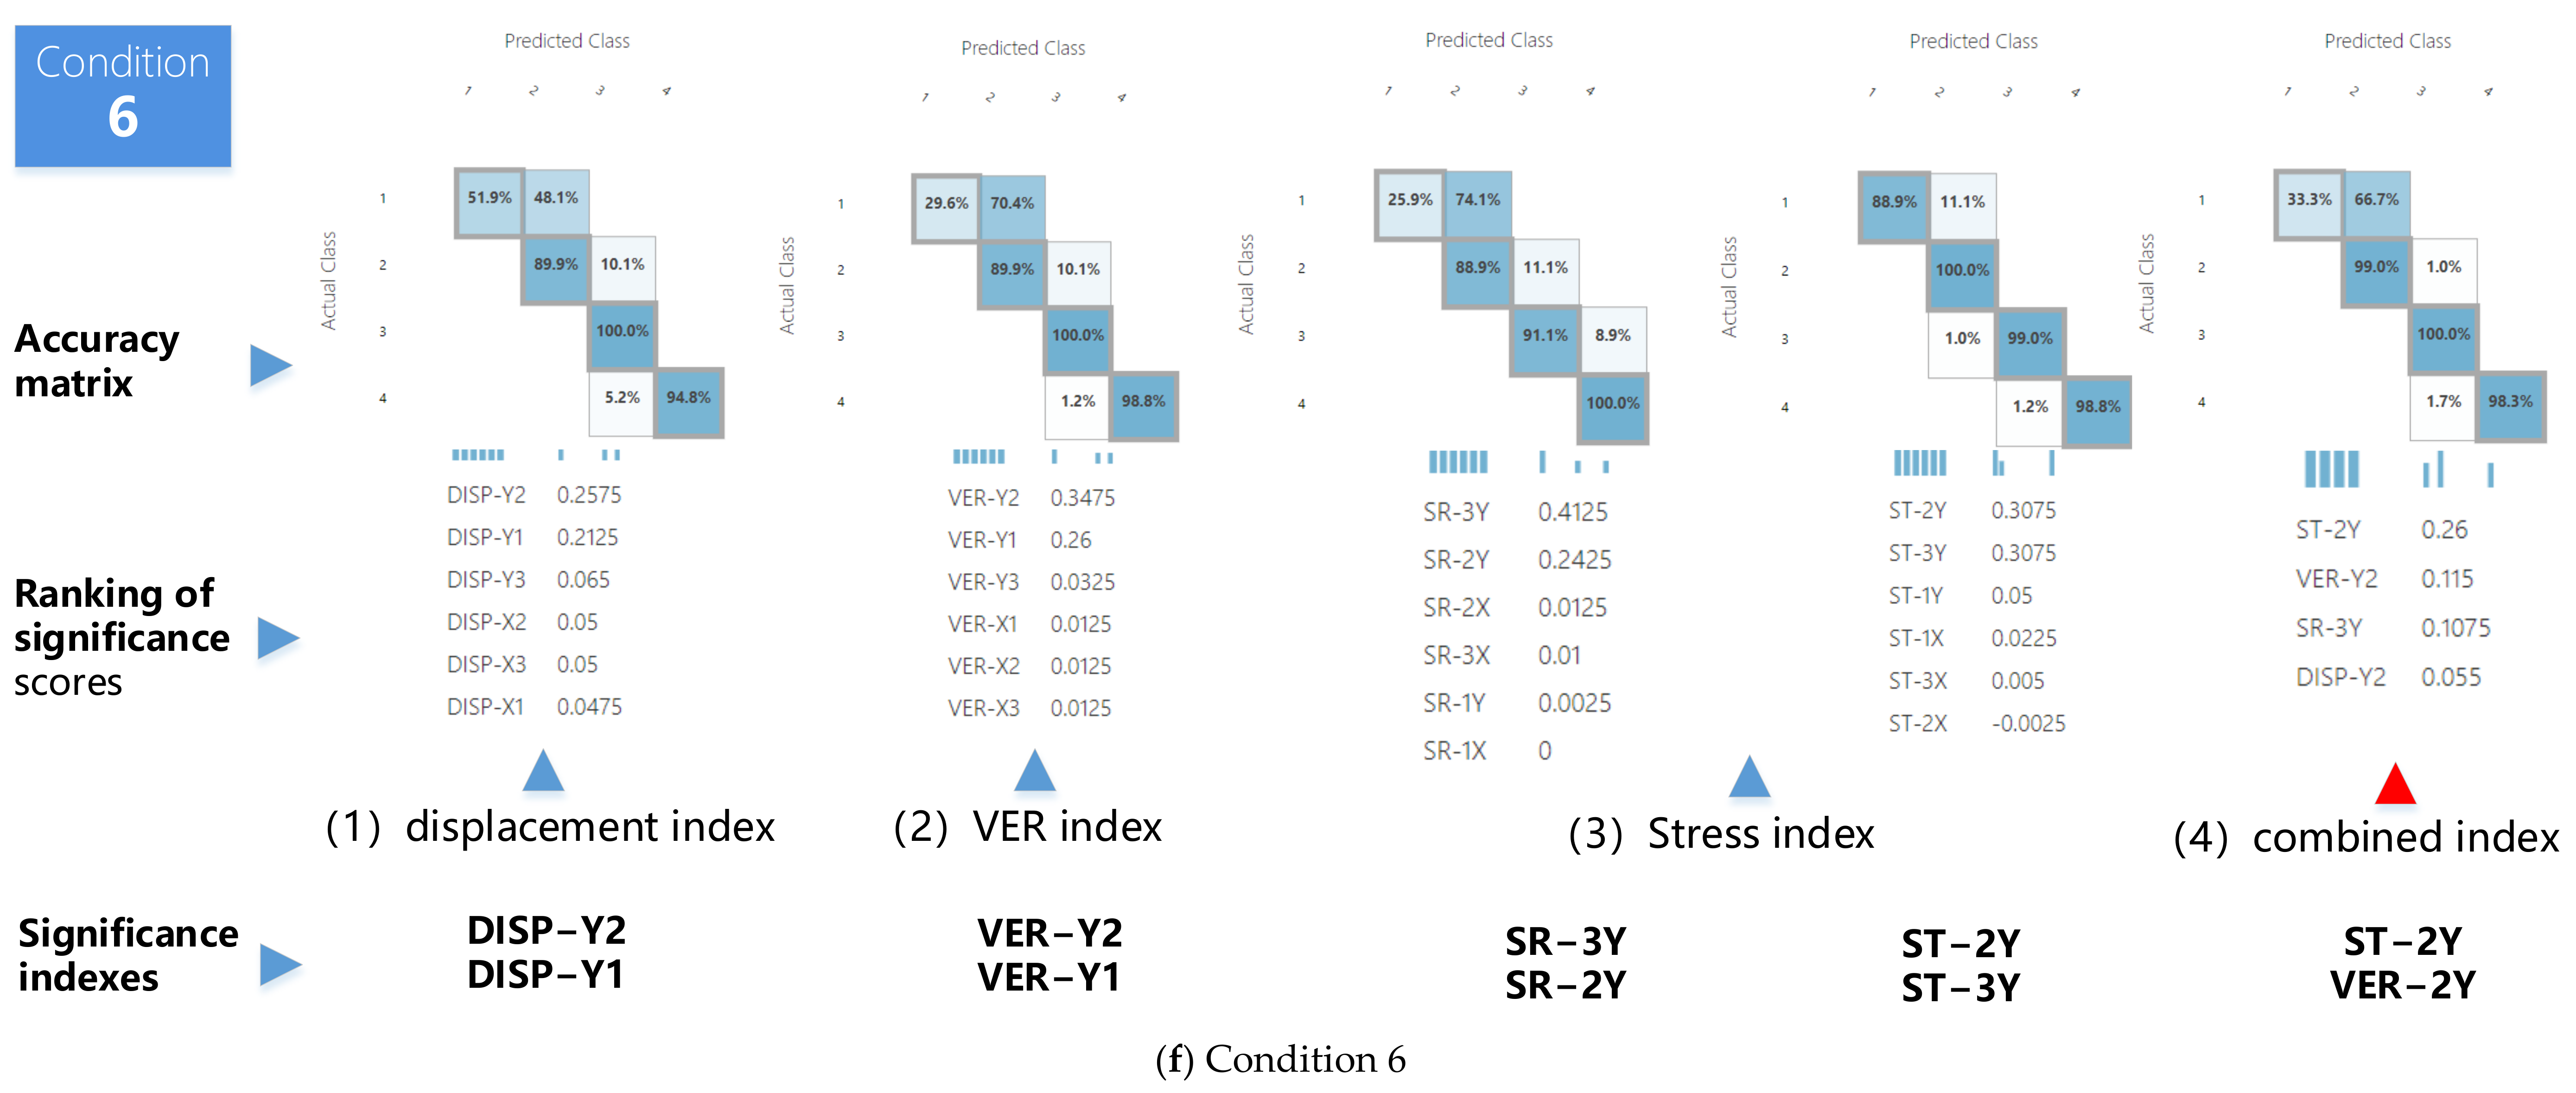
Figure 11 (conditions 1–6), each encompassing five sets of calculation results.
- (1)
Accuracy of damage determination.
In general, the results on damage determination exhibit high accuracy. Specifically, the accuracy of damage determination by displacement and VER indices proves the highest. The accuracy of the stress index in determining surrounding rock damage is not as high, although its accuracy generally surpasses 70%. However, significant errors in determining damage at stage I under conditions 5 and 6 are noted, possibly due to an insufficient data sample size. In order to reduce these errors, the proportion of training data samples can be increased, or the density of the data samples can be elevated. This can involve improving the input parameter value for data segmentation or increasing the data recording frequency. The accuracy of the surrounding rock damage determination is ranked as follows: displacement indices > VER indices > tangential stress indices > radial stress indices.
- (2)
The significance ranking of indexes: Analysis of the same condition.
Typical conditions are examined in depth. The significant indices for condition 3 are the DISP-Y1, the VER between Y1–Y2 and Y1–Y3, and the radial and tangential stresses of Y3. These results reveal the location and degree of damage on the tunnel top under condition 3. Comparatively, the significant indices for condition 6, which exhibits a higher level of in situ stress, are the DISP-Y2 and the VER between Y2 and Y3. These significant indices illuminate the damage degree difference between these two conditions. Condition 4’s significant indices point to the sidewall. The significant score of the VER index for the top and sidewall under condition 5 are equivalent, indicating equal vertical and horizontal in situ stress damage to the surrounding rock.
- (3)
Indices with high significance: Analysis of the different conditions.
A comprehensive index comprising different types of monitoring information offers better reflections on the effectiveness of the index under various conditions.
Table 4 summarizes the significant indices of the comprehensive index under each condition. For conditions 1 and 2, the VER between the shallow measuring points and the radial and tangential stress at the deep measuring points are sensitive to changes in the surrounding rock damage. For conditions 3 through to 6, where surrounding rock instability is observed, the displacement of the shallow measuring points and the tangential stress in the shallow and middle parts are sensitive to the changes in the surrounding rock damage. The tangential stress in the surrounding rock is a significant index reflecting the surrounding rock damage, and the change in the tangential stress signifies stress concentration phenomena in the surrounding rock.
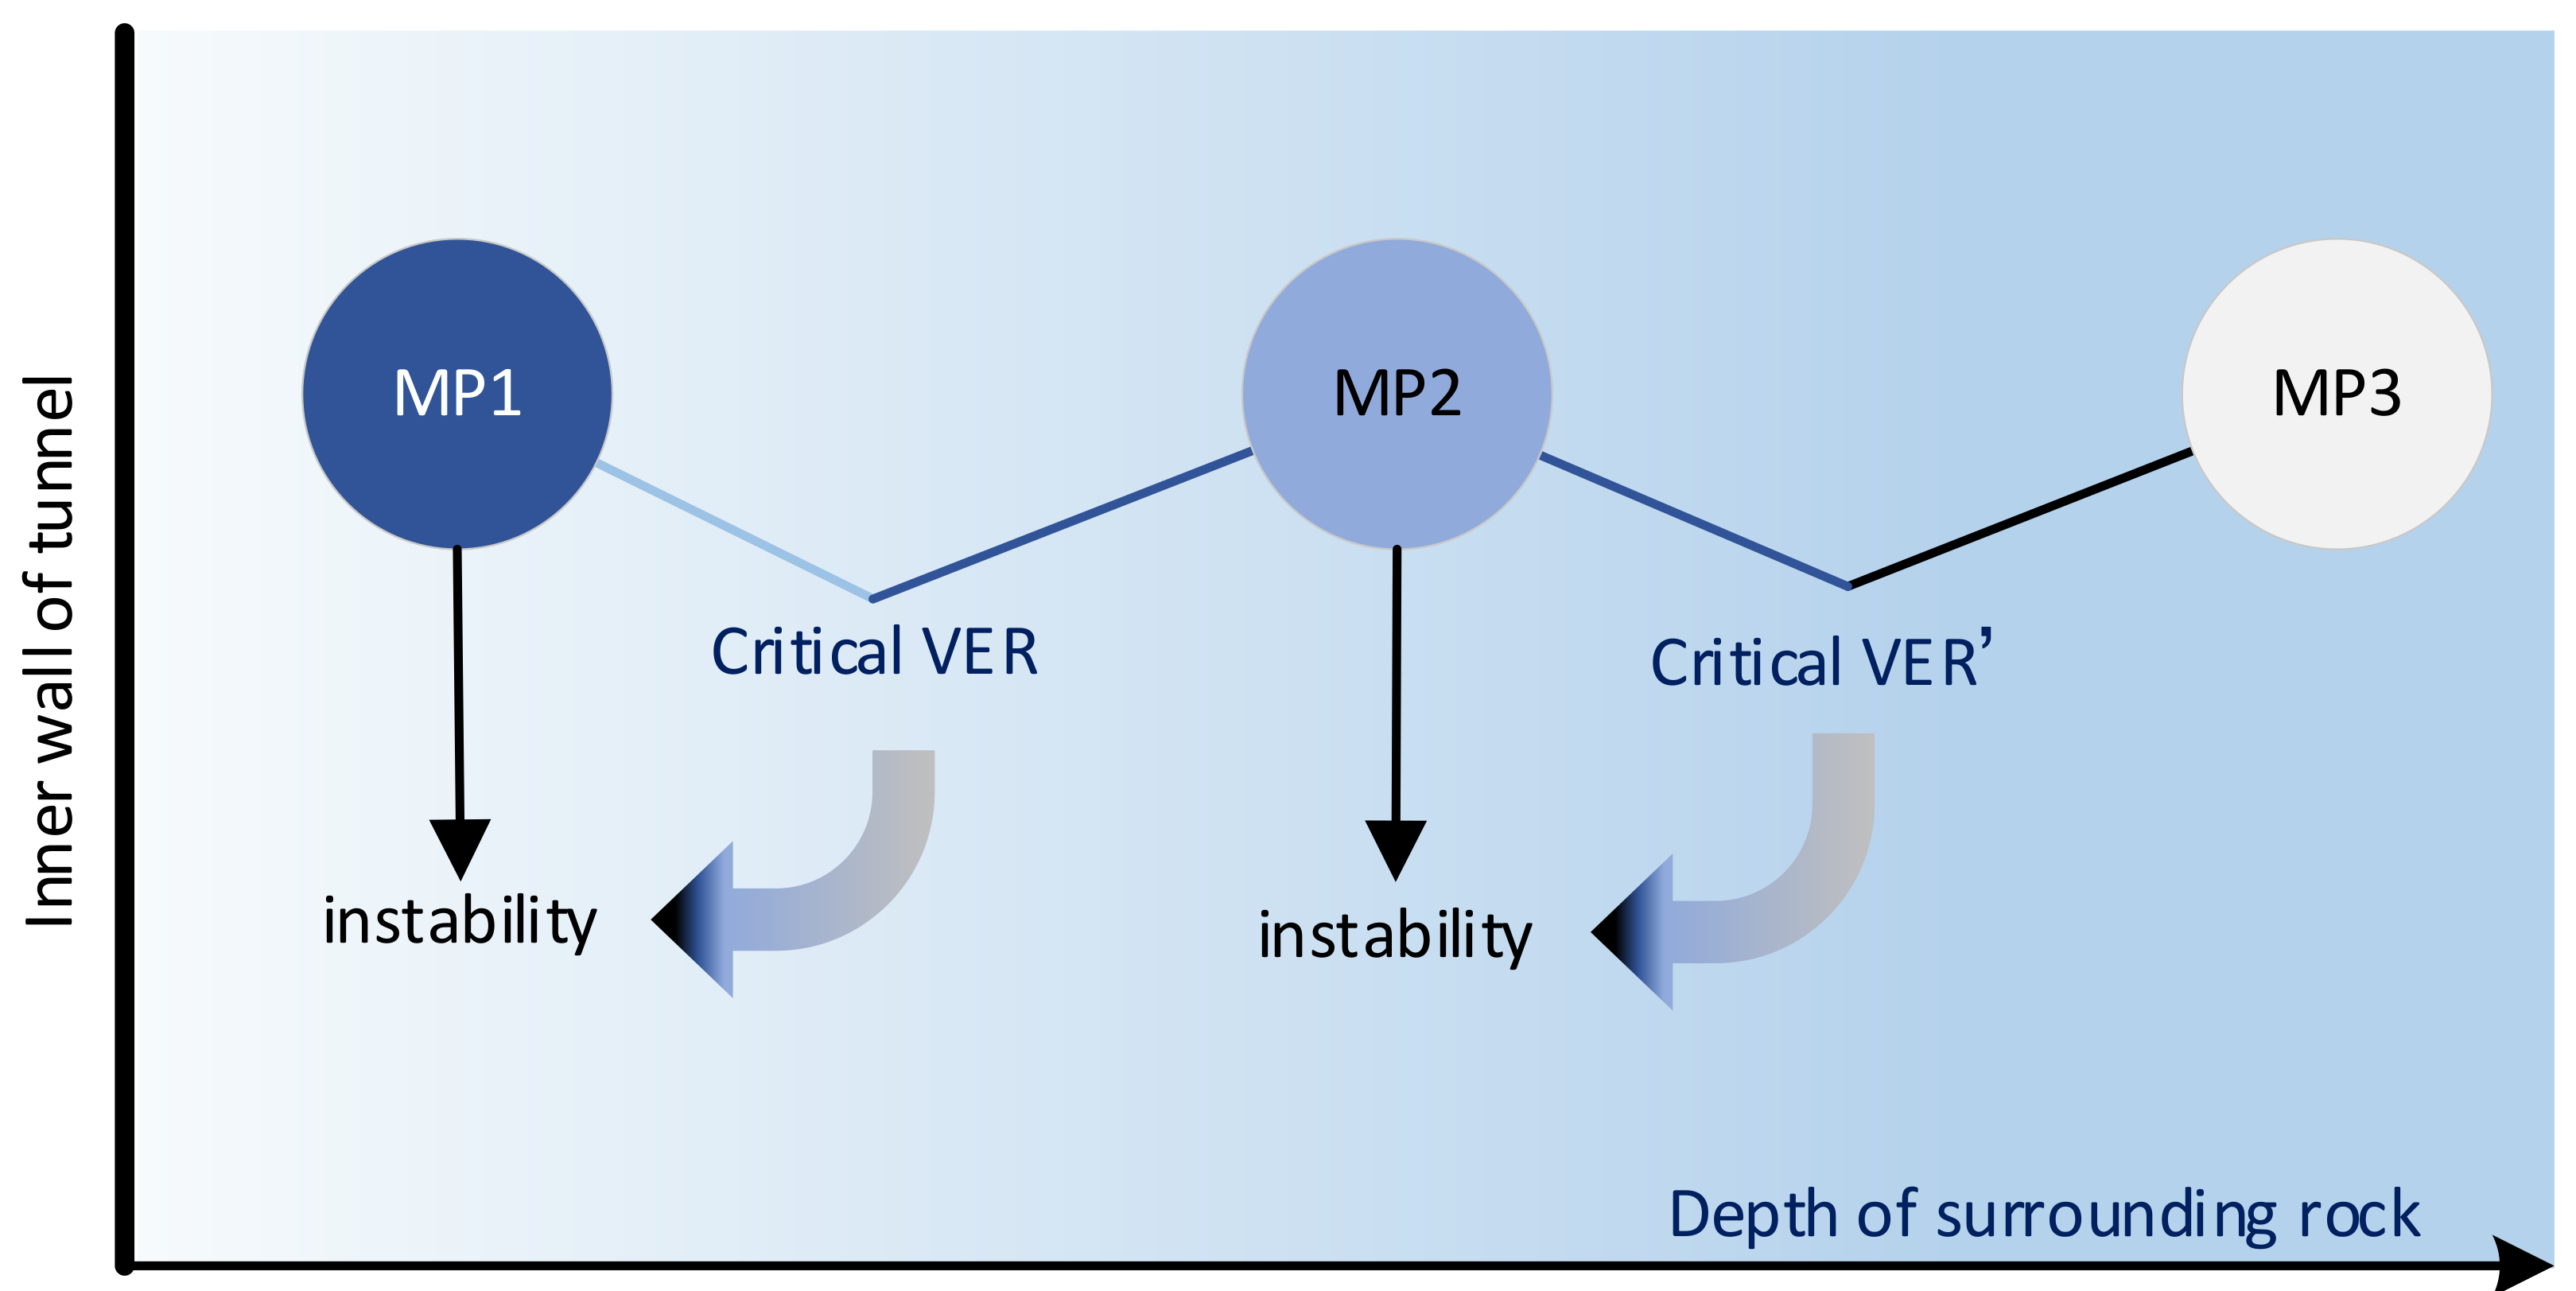
Upon further analysis, from conditions 1 to 6, with the increase in the in situ stress level, the significance index shows a pattern, namely the VER between the shallow measuring points (regional damage) → displacement of shallow measuring point (point failure) → VER between deep measuring points (regional damage) → displacement of deep measuring point (point failure), which represents the difference in the degree of surrounding rock damage under various conditions. As in situ stress increases, the significance index of the displacement information reveals a transition process from shallow to deep and from regional damage to point failure. This conclusion outlines the progression of surrounding rock damage to instability from a safety monitoring perspective: when the damage between the rock units reaches a certain threshold, the surrounding rock becomes unstable at a shallow measuring point. This observation can inspire a new instability criterion index, namely the critical VER thresholds of the surrounding rock, as illustrated in
Figure 12.


