


Enhancing Risk Analysis toward a Landscape Digital Twin Framework: A Multi-Hazard Approach in the Context of a Socio-Economic Perspective

Abstract
:1. Introduction
1.1. Background and Motivation
1.2. Literature Review
1.3. Significance of the Study
- To define and operationalize risk analysis indicators that capture the socio-economic effects of natural hazards.
- The definition and operationalization of risk analysis indicators can reflect the socio-economic effects of natural hazards on people’s lives.
- To present the risk analysis outcomes in terms of qualitative (risk maps) and quantitative (origin–destination matrix graphs) outputs.
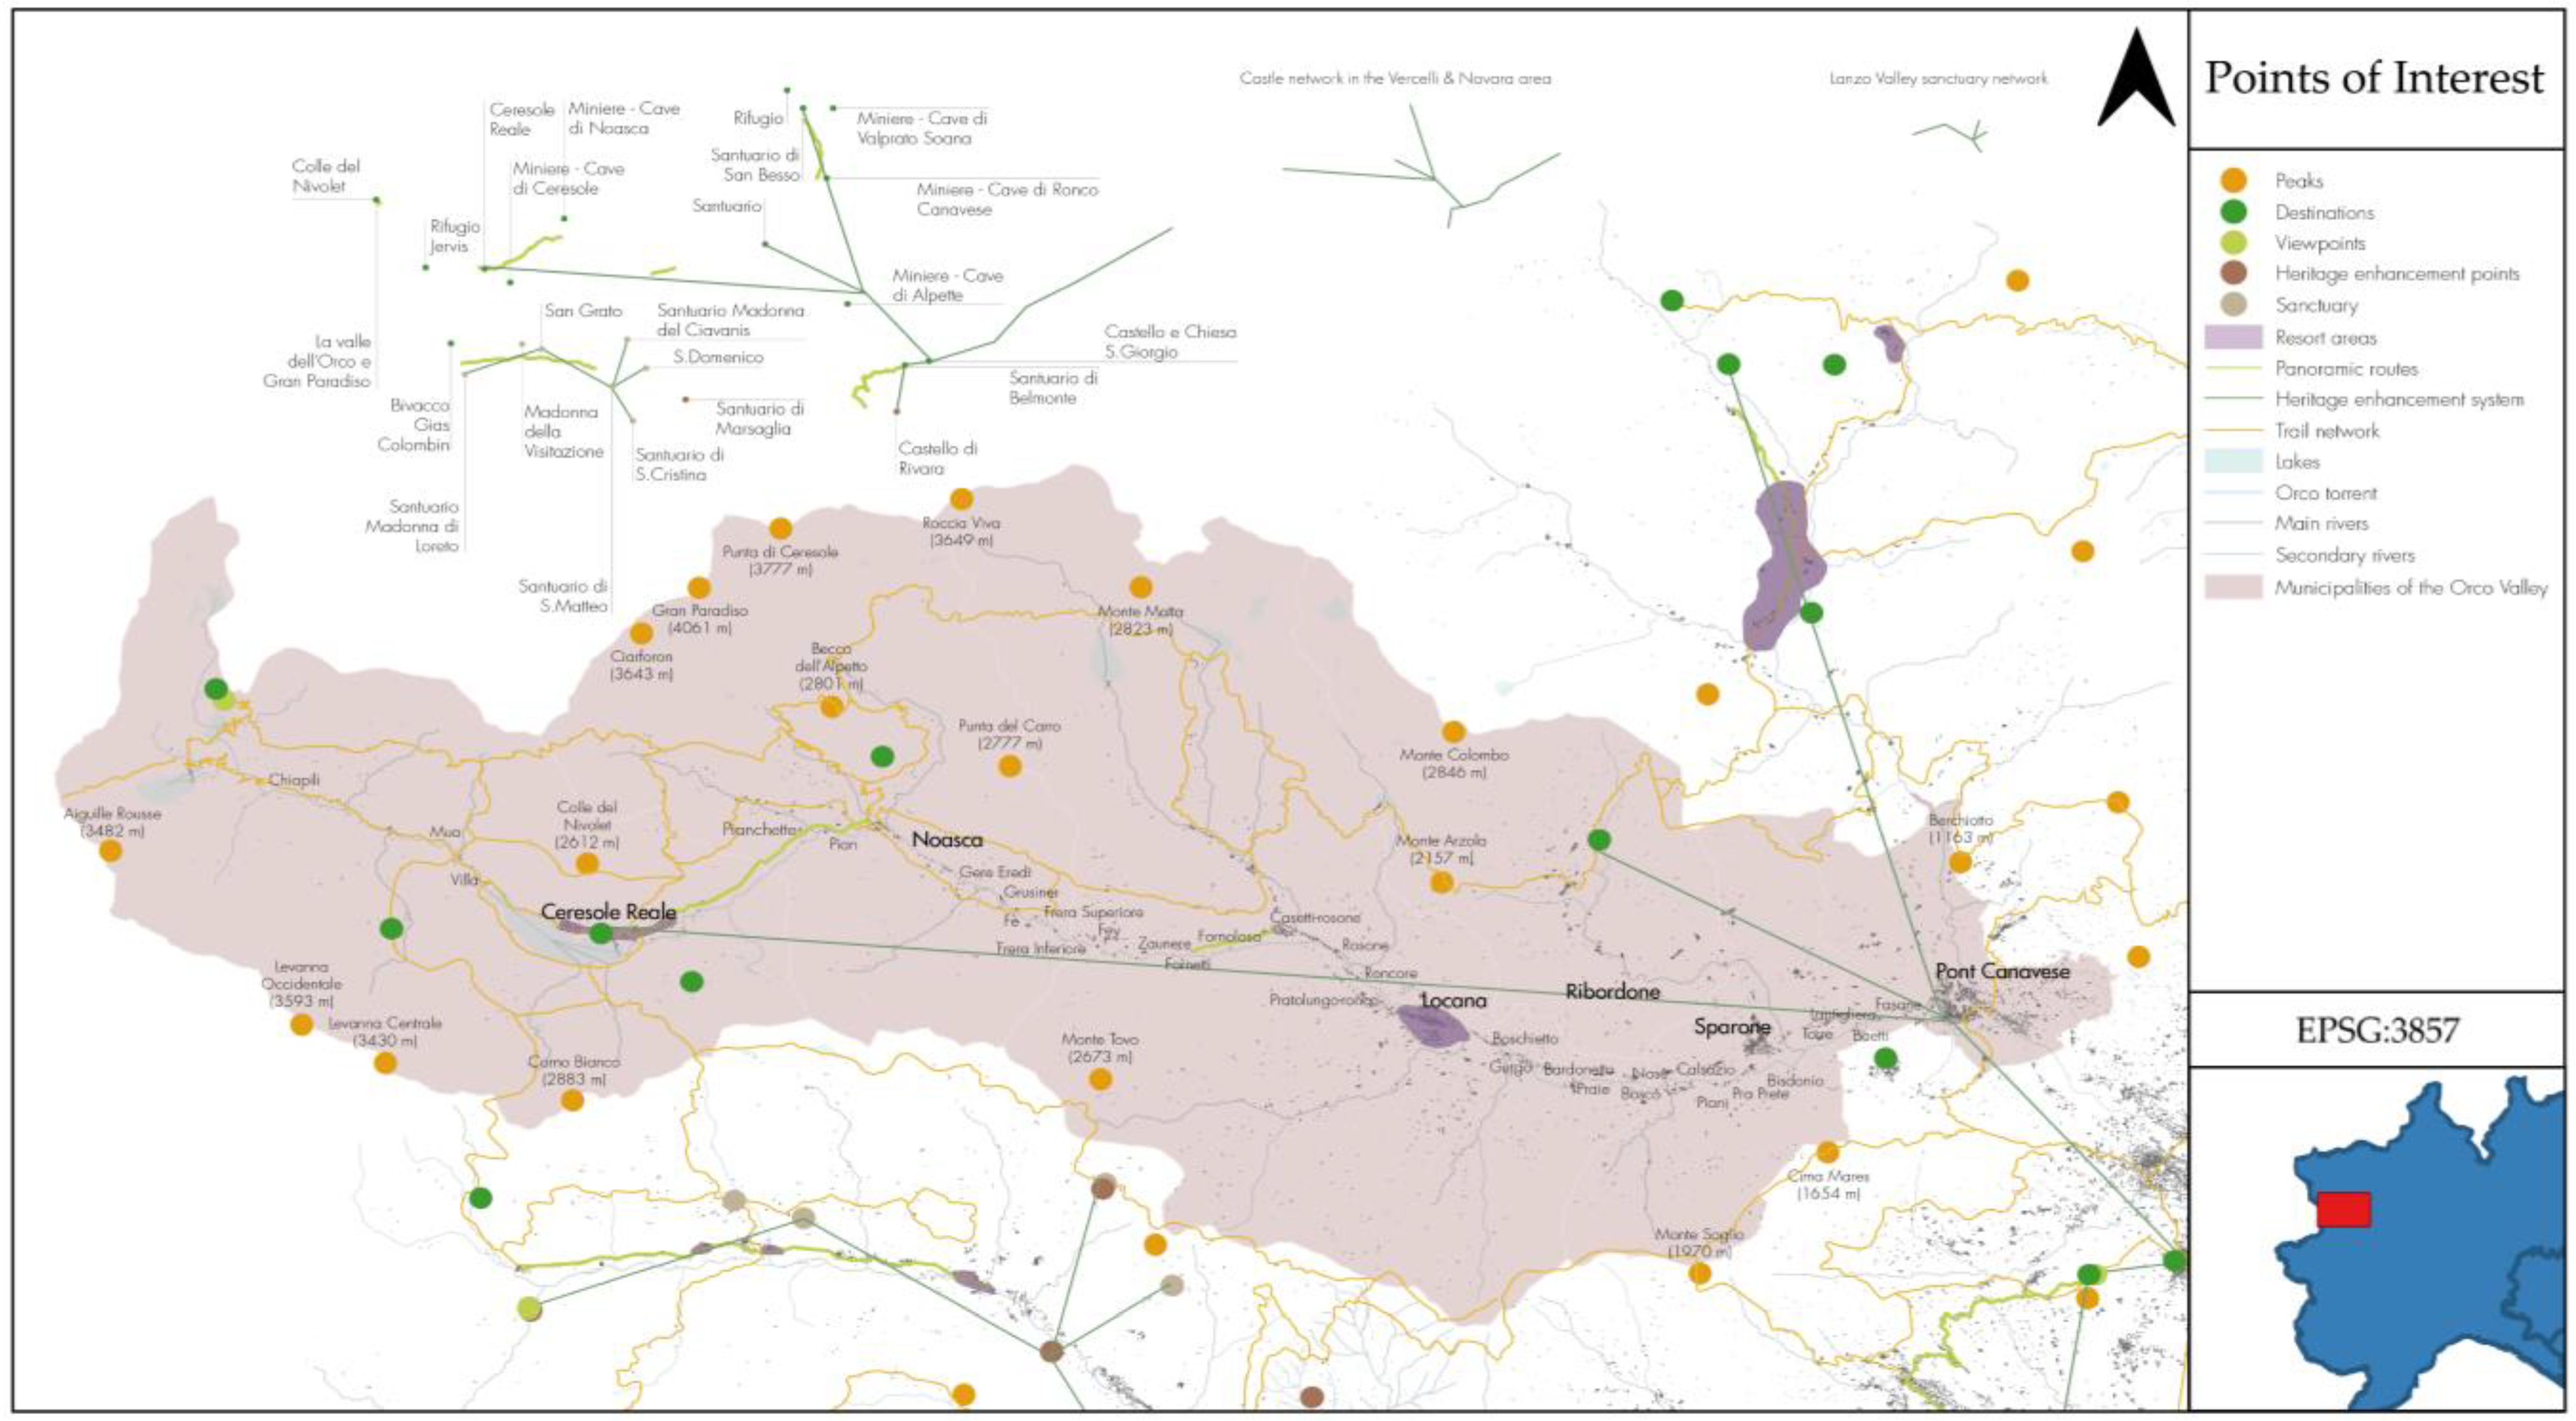
- To perform and compare risk analysis with several categories of points of interest (POIs) under different scenarios.
- To calculate risk scores based on a robust formula that considers the type of point of interest, the type of hazard, and the land cover classification.
- To propose a scalable methodology that can integrate multiple data sources and types for multi-hazard analysis.
- The focus on road network accessibility as a risk indicator.
- The road network analysis according to different types of points of interest (health facilities, public facilities, town centers, and tourism facilities) under different scenarios (basic, disrupted).
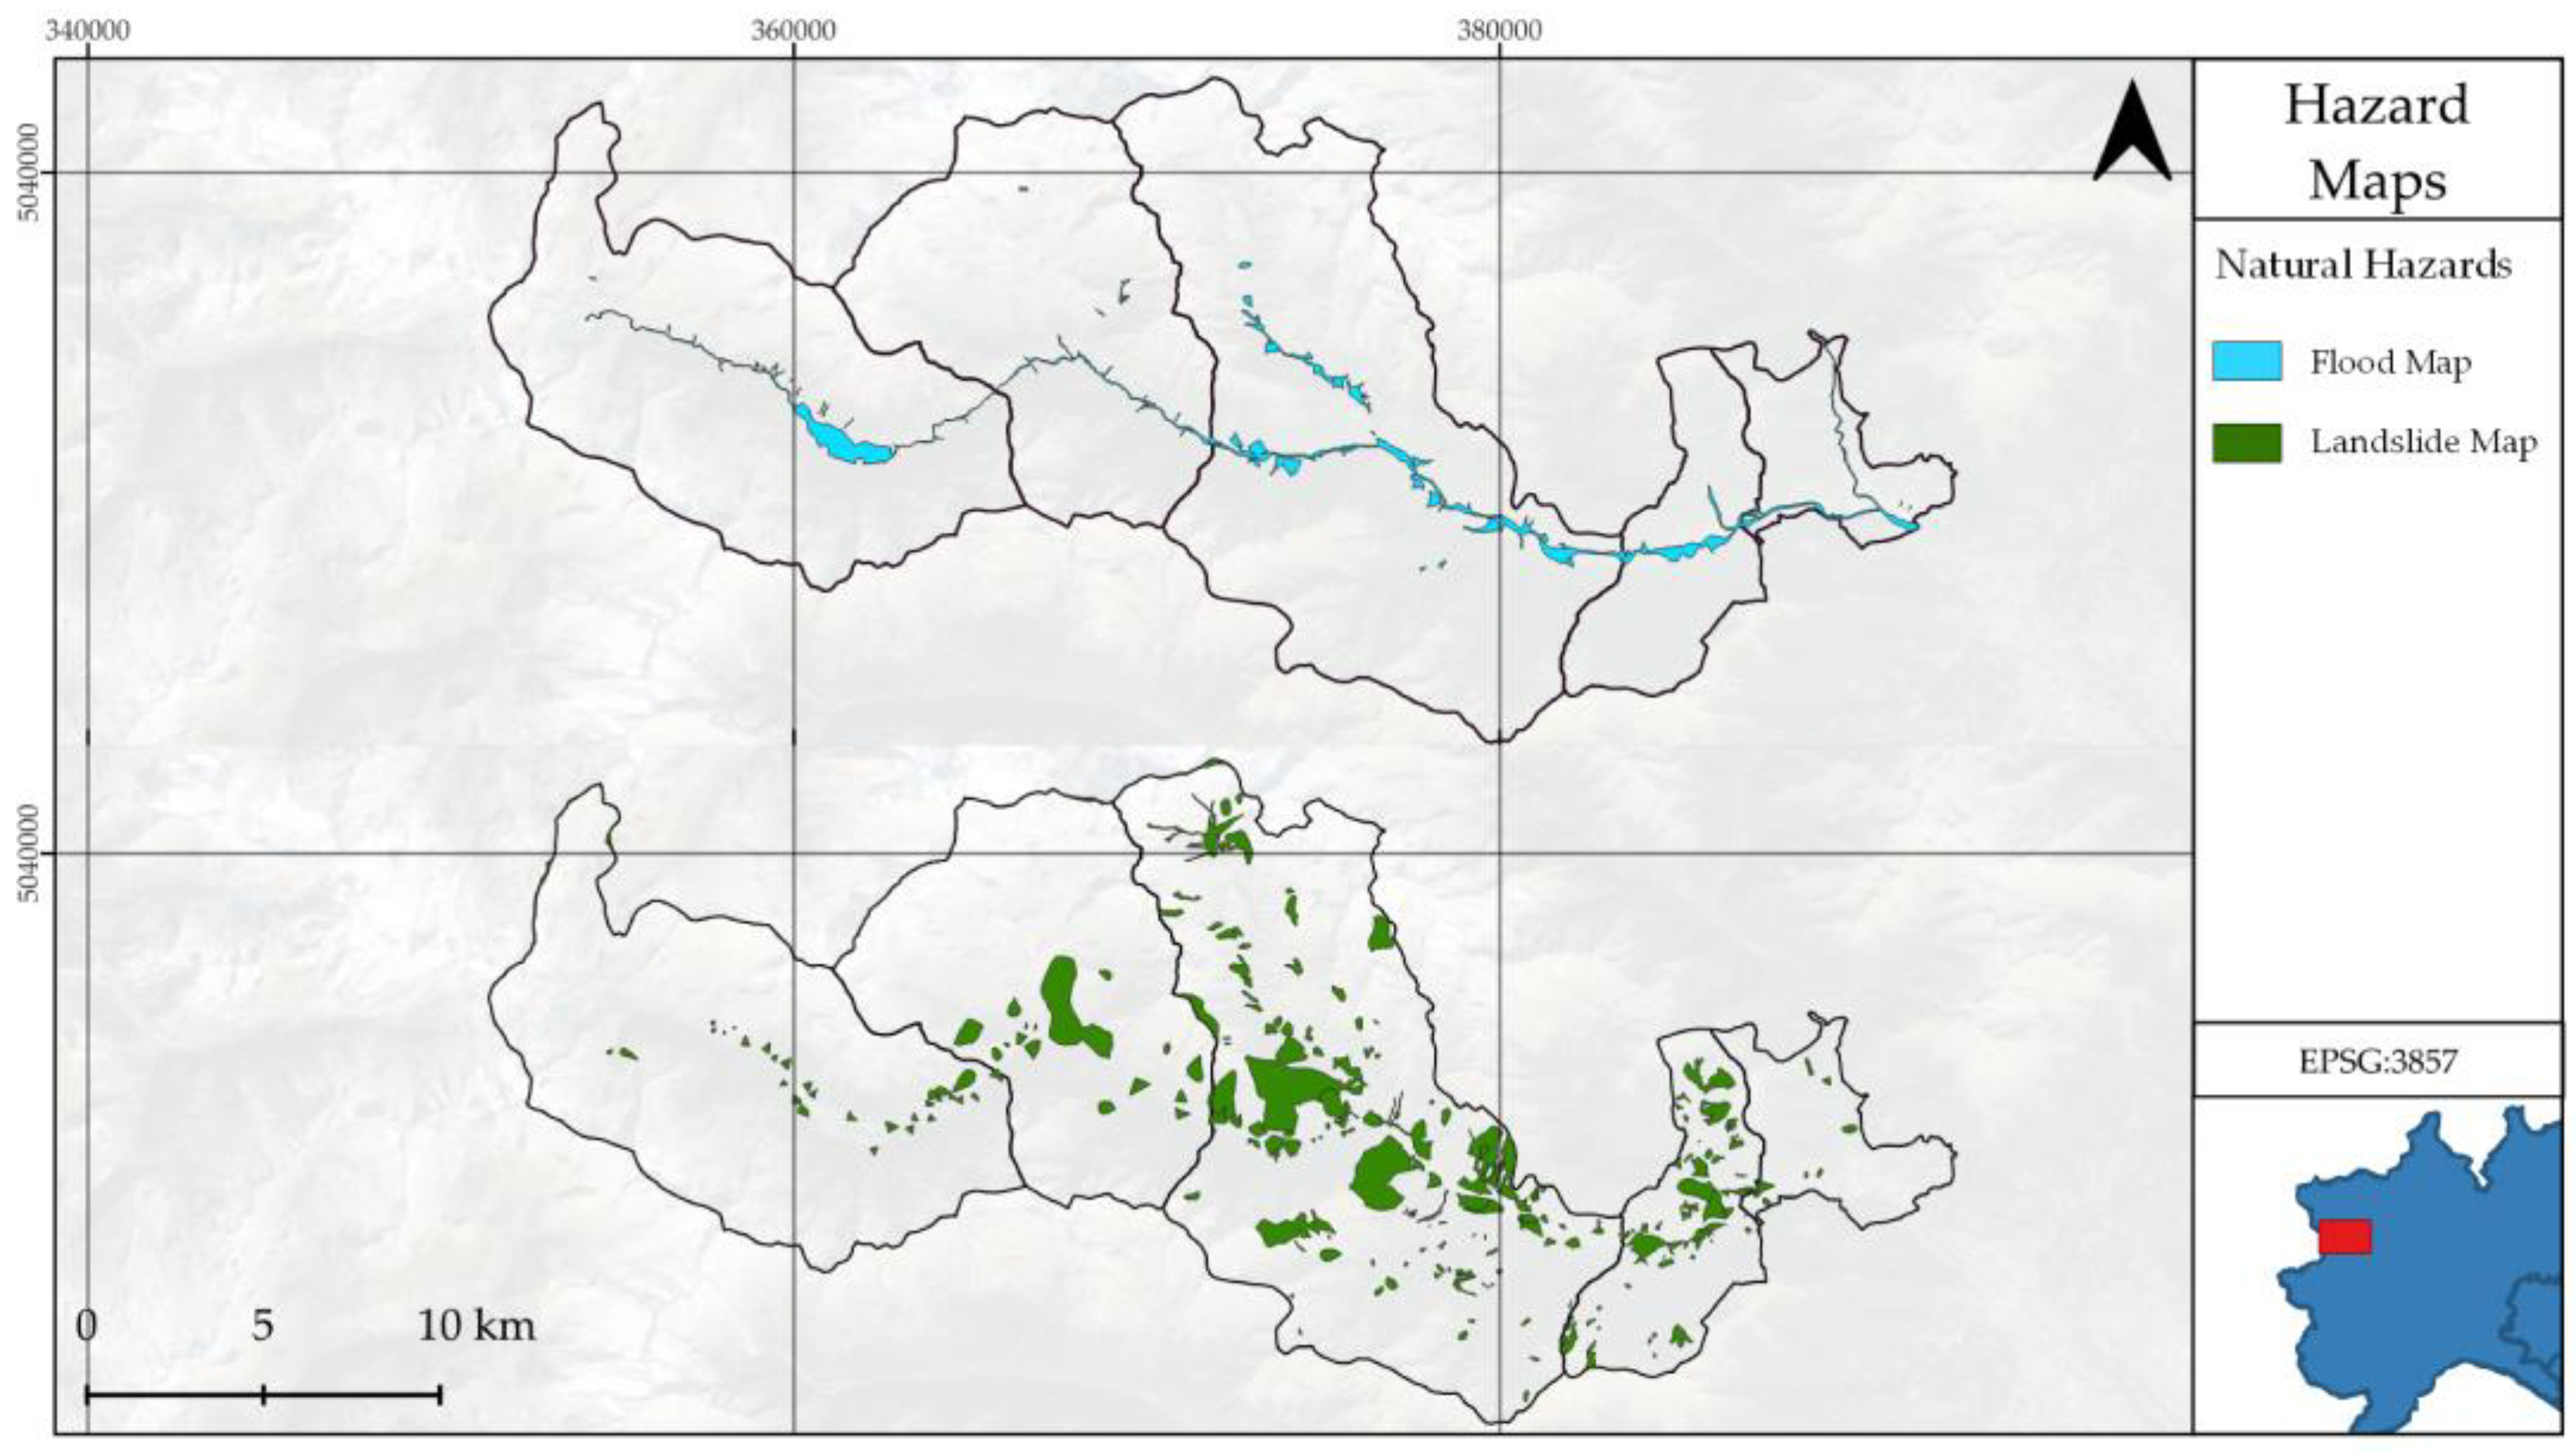
- The consideration of two types of natural hazards: landslides and floods.
- The use of publicly available credible data sources such as government portals.
- The application of open-source tools such as the quantum geographic information system (QGIS).
2. Materials and Methods
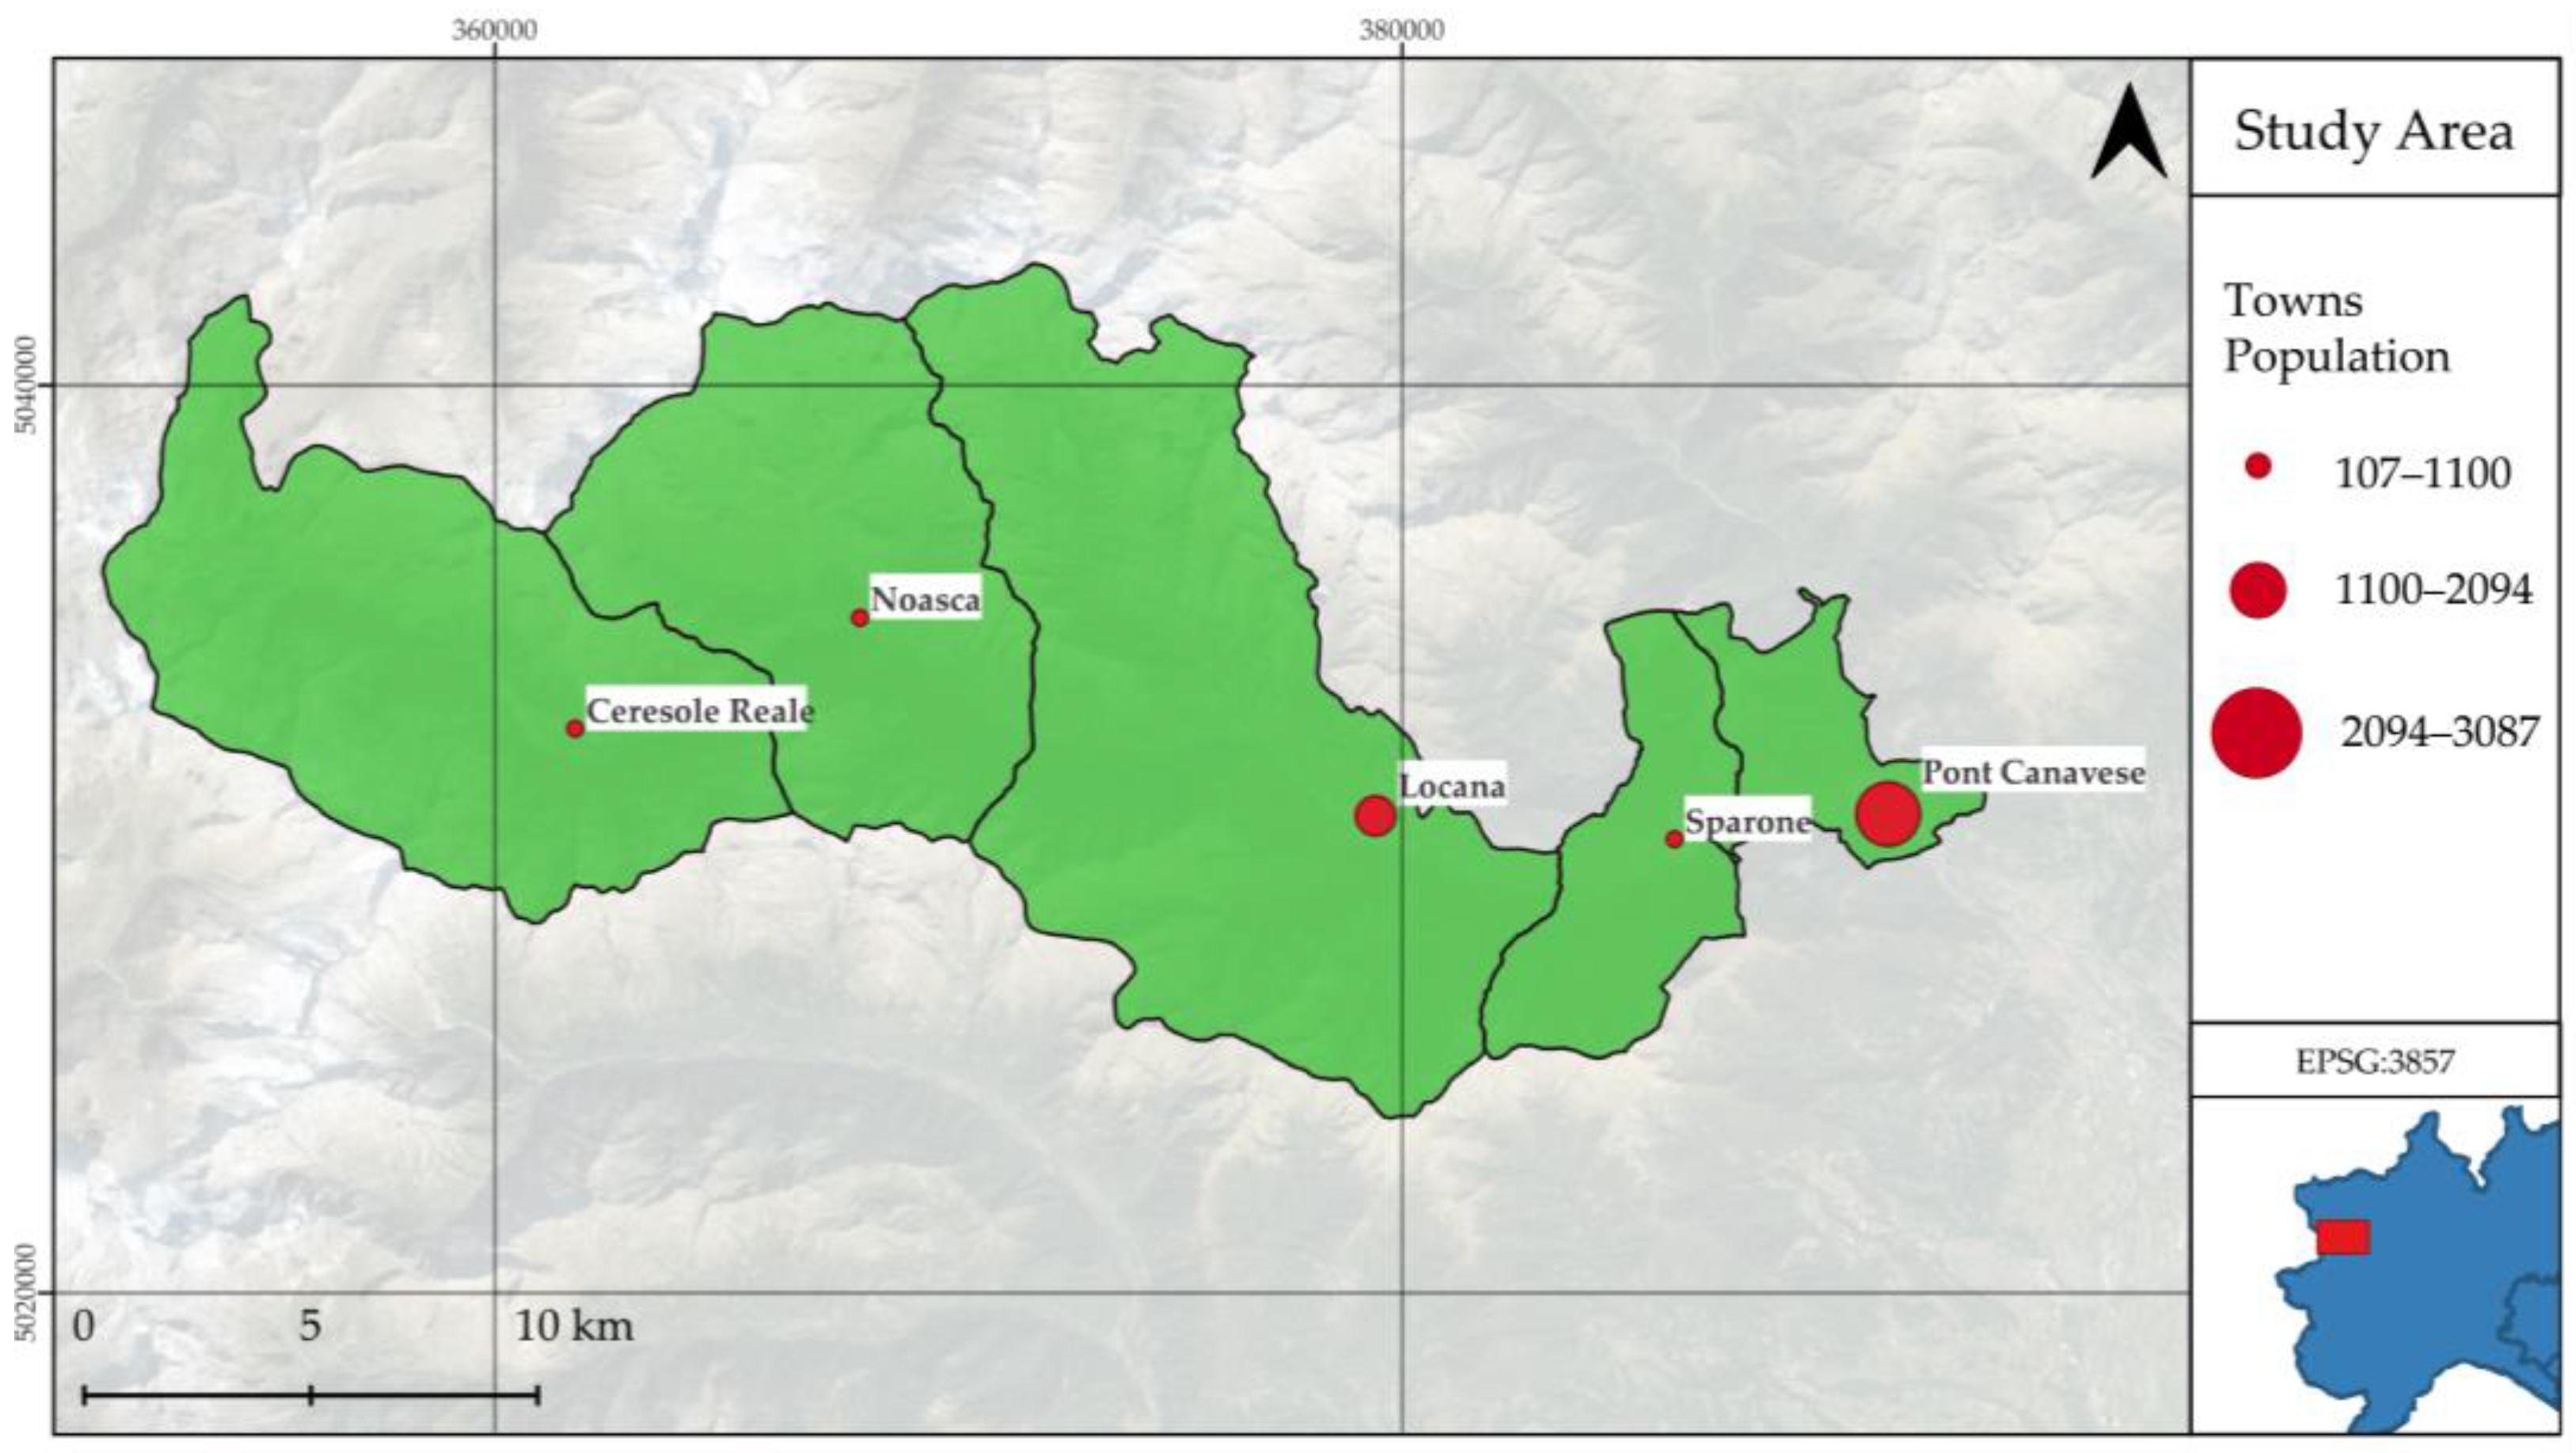
2.1. Case Study Area
2.2. Input
- Territory
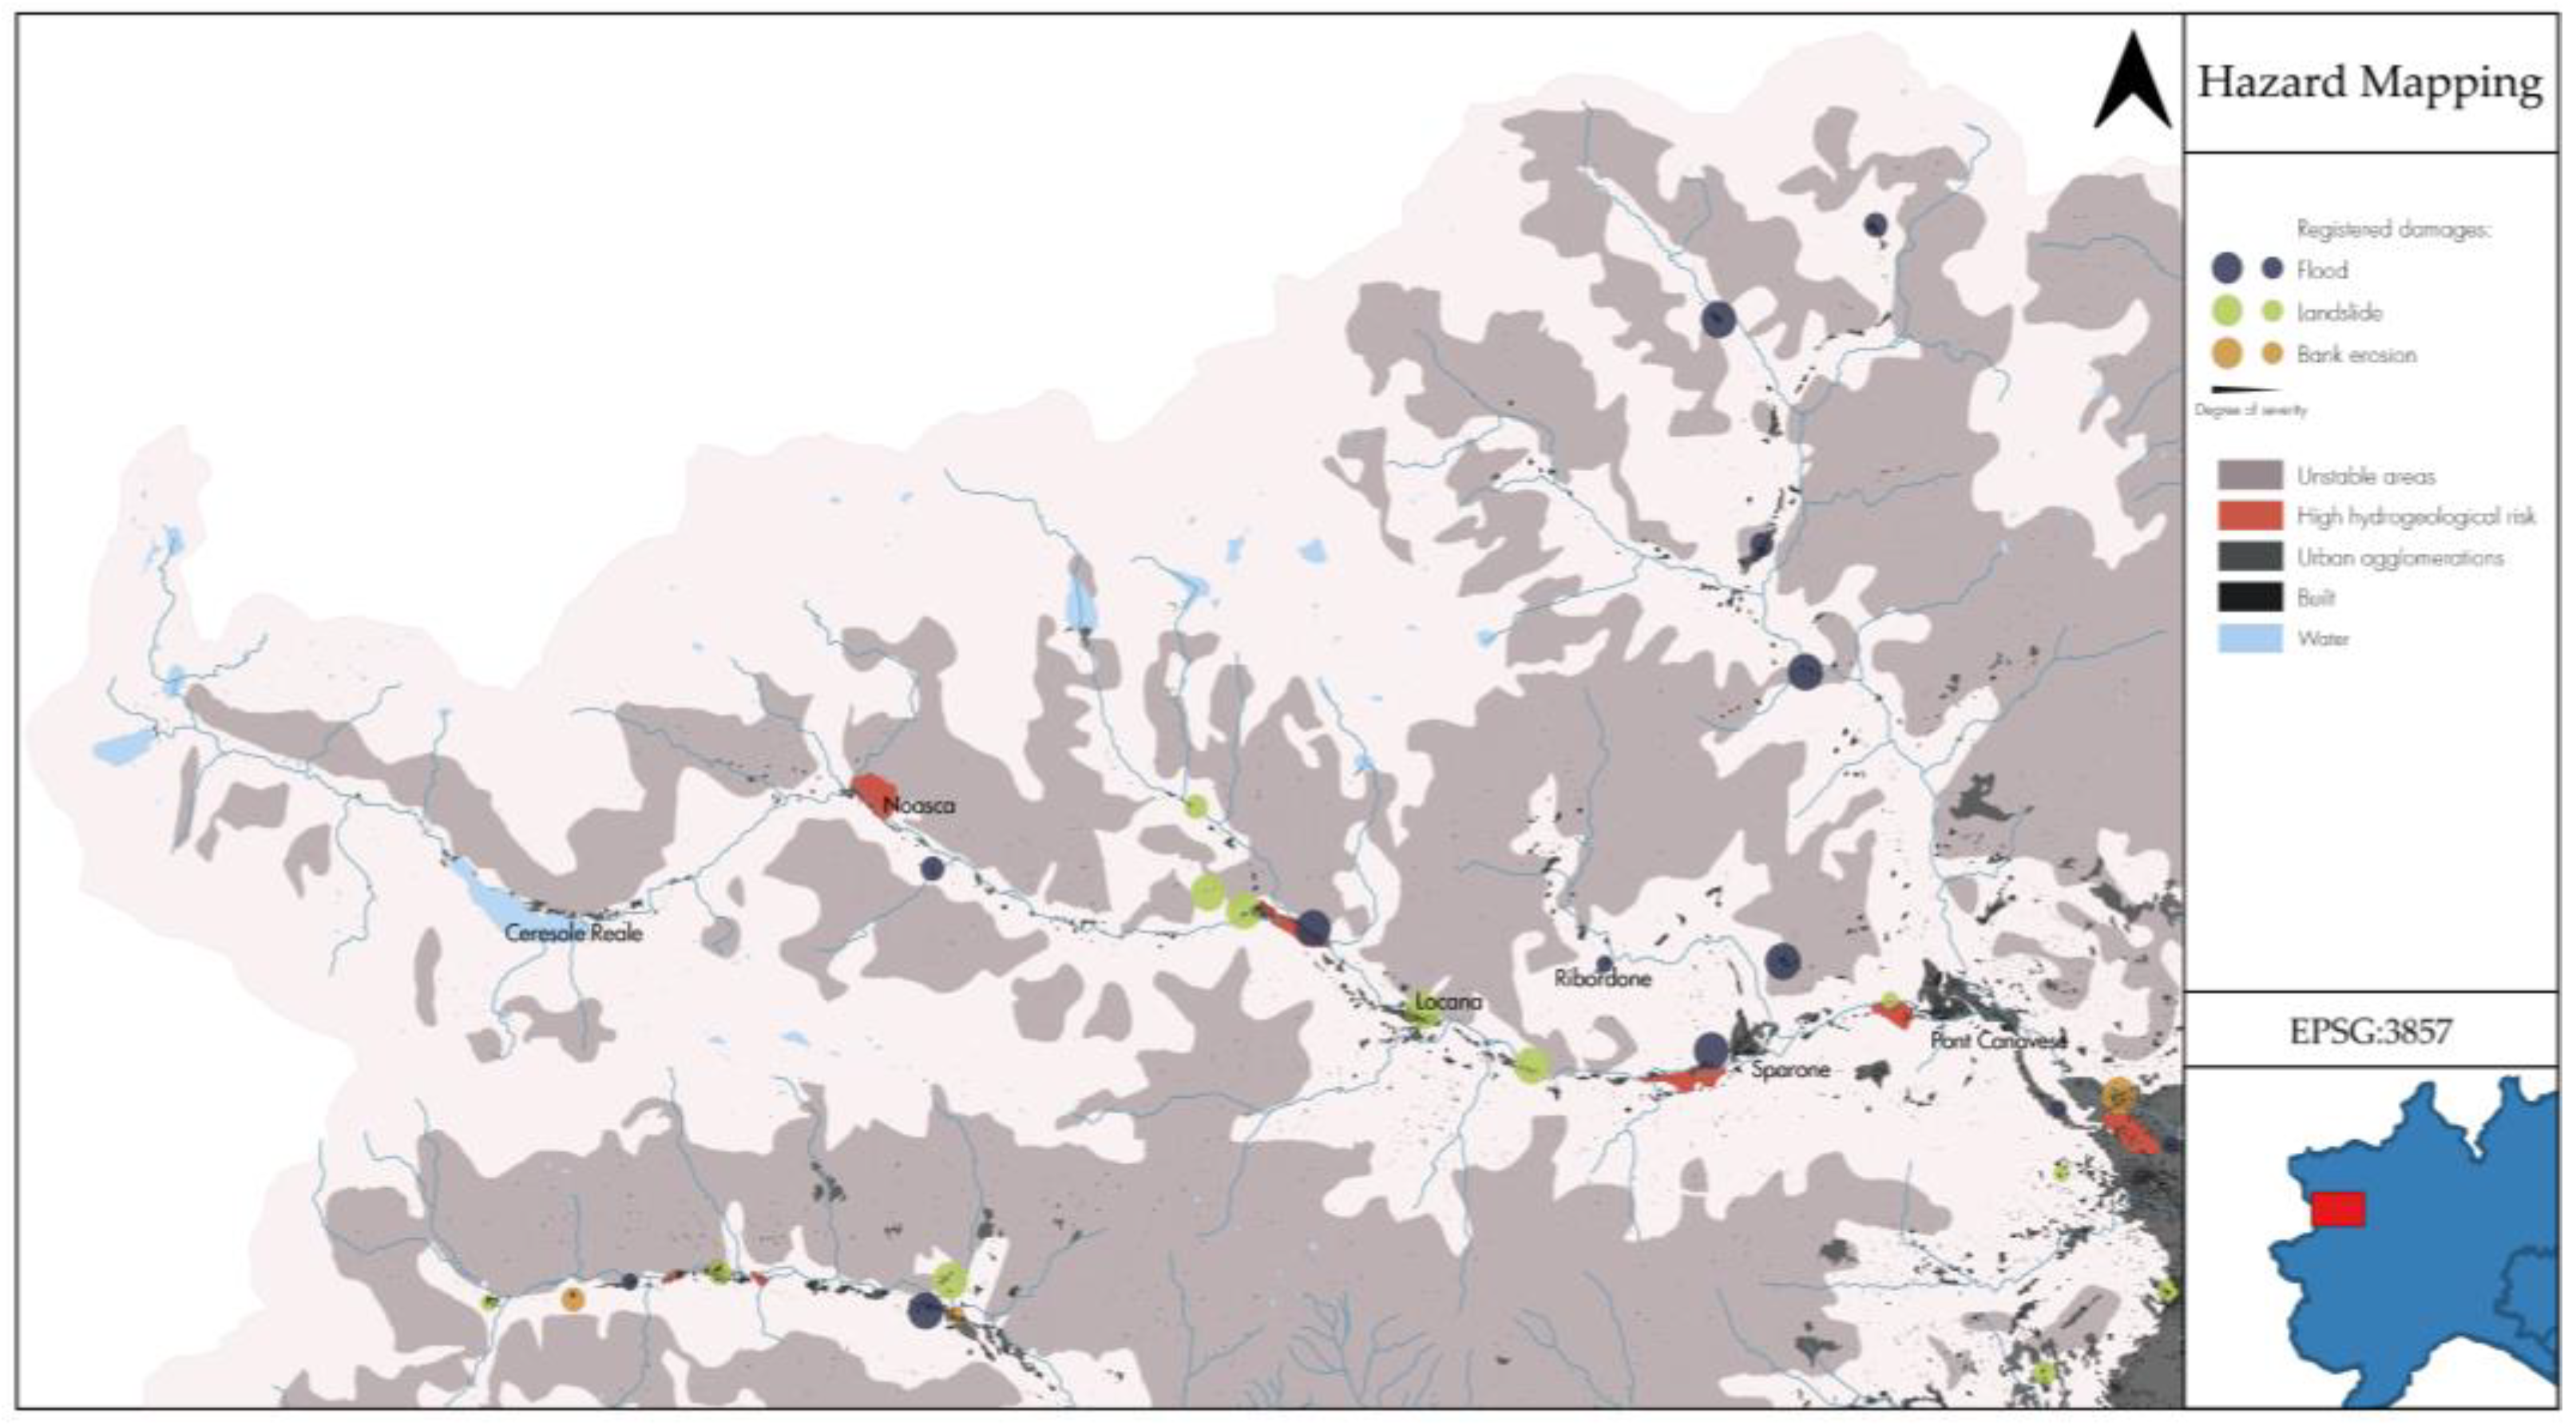
- Hazard
- Risk indicators
2.3. Risk Analysis
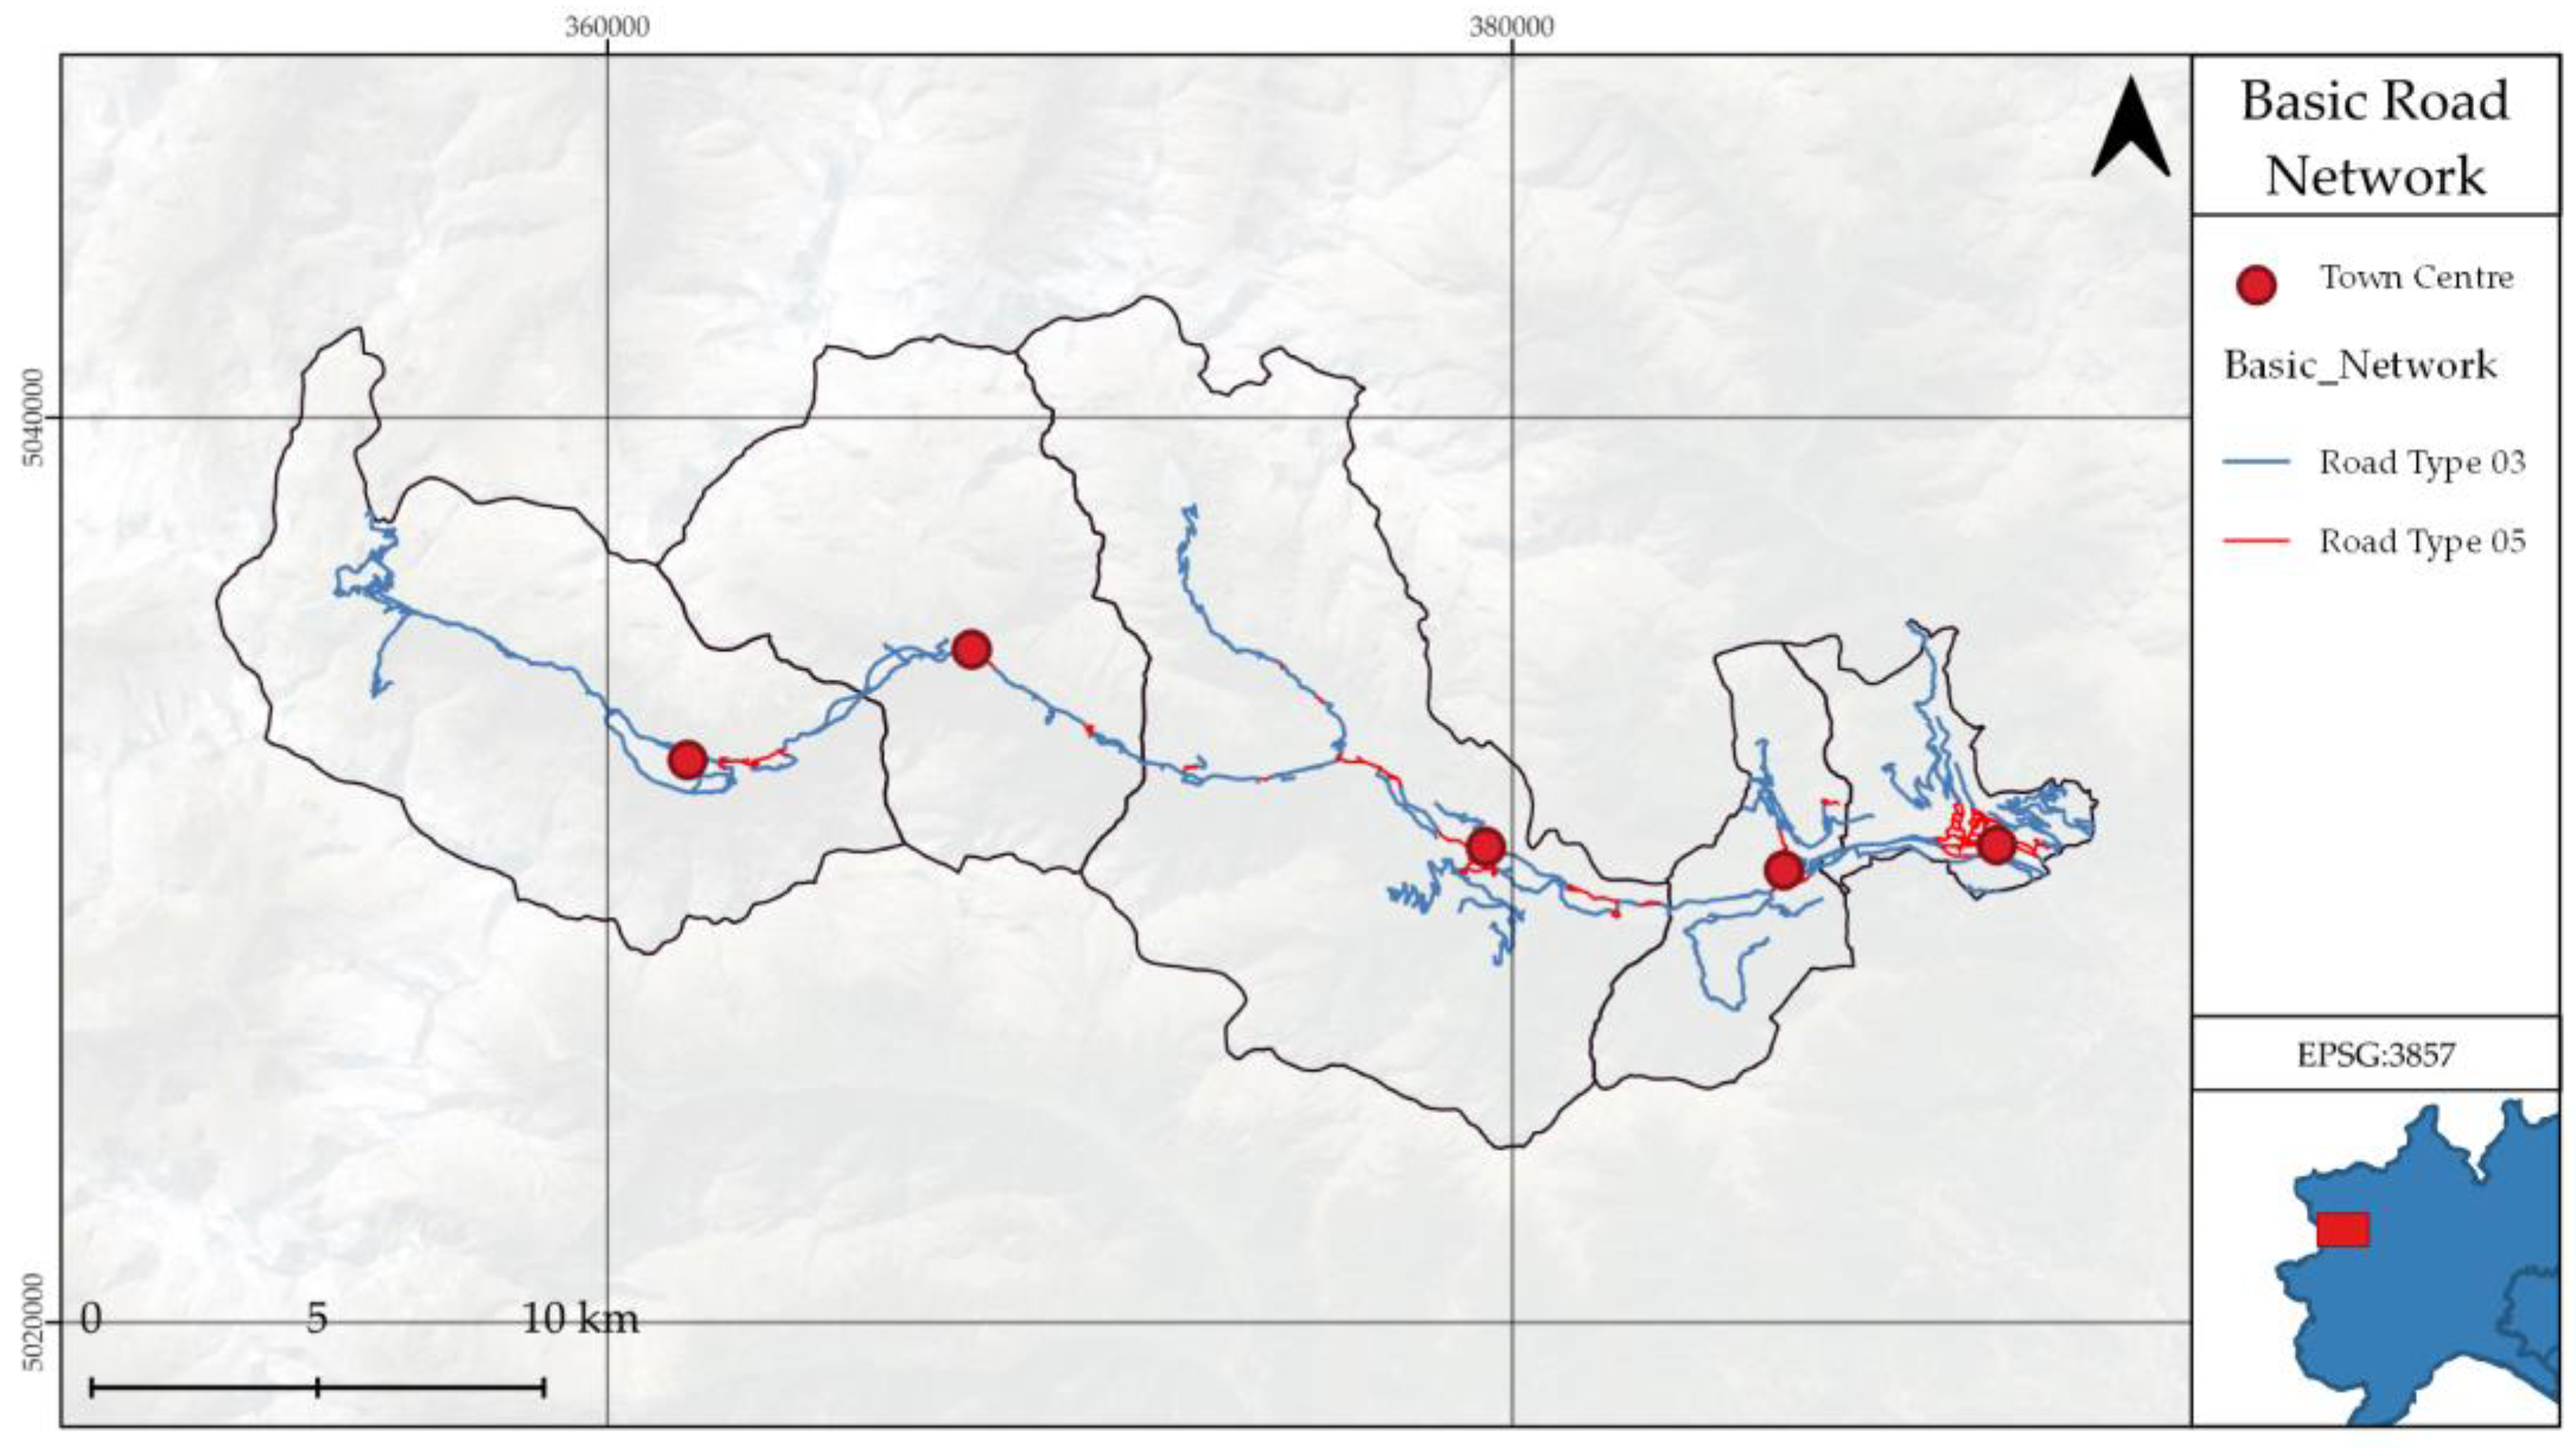
2.3.1. Road Network Analysis
2.3.2. Qualitative Research
2.3.3. Quantitative Research
2.4. Outputs
- R is the normalized risk score for a POI in a scenario.
- E is the exposure level for a POI in a scenario, measured by the service area from the qualitative analysis, representing the hazard’s potential impact on the POI.
- V is the vulnerability level for a POI in a scenario, measured by the change in travel cost from the quantitative analysis, which represents how much the hazard affects the accessibility and connectivity of the POI.
- O is another economic indicator derived from data availability, which can either increase or decrease the risk depending on how they affect the economic or social aspects of the POI.
3. Results
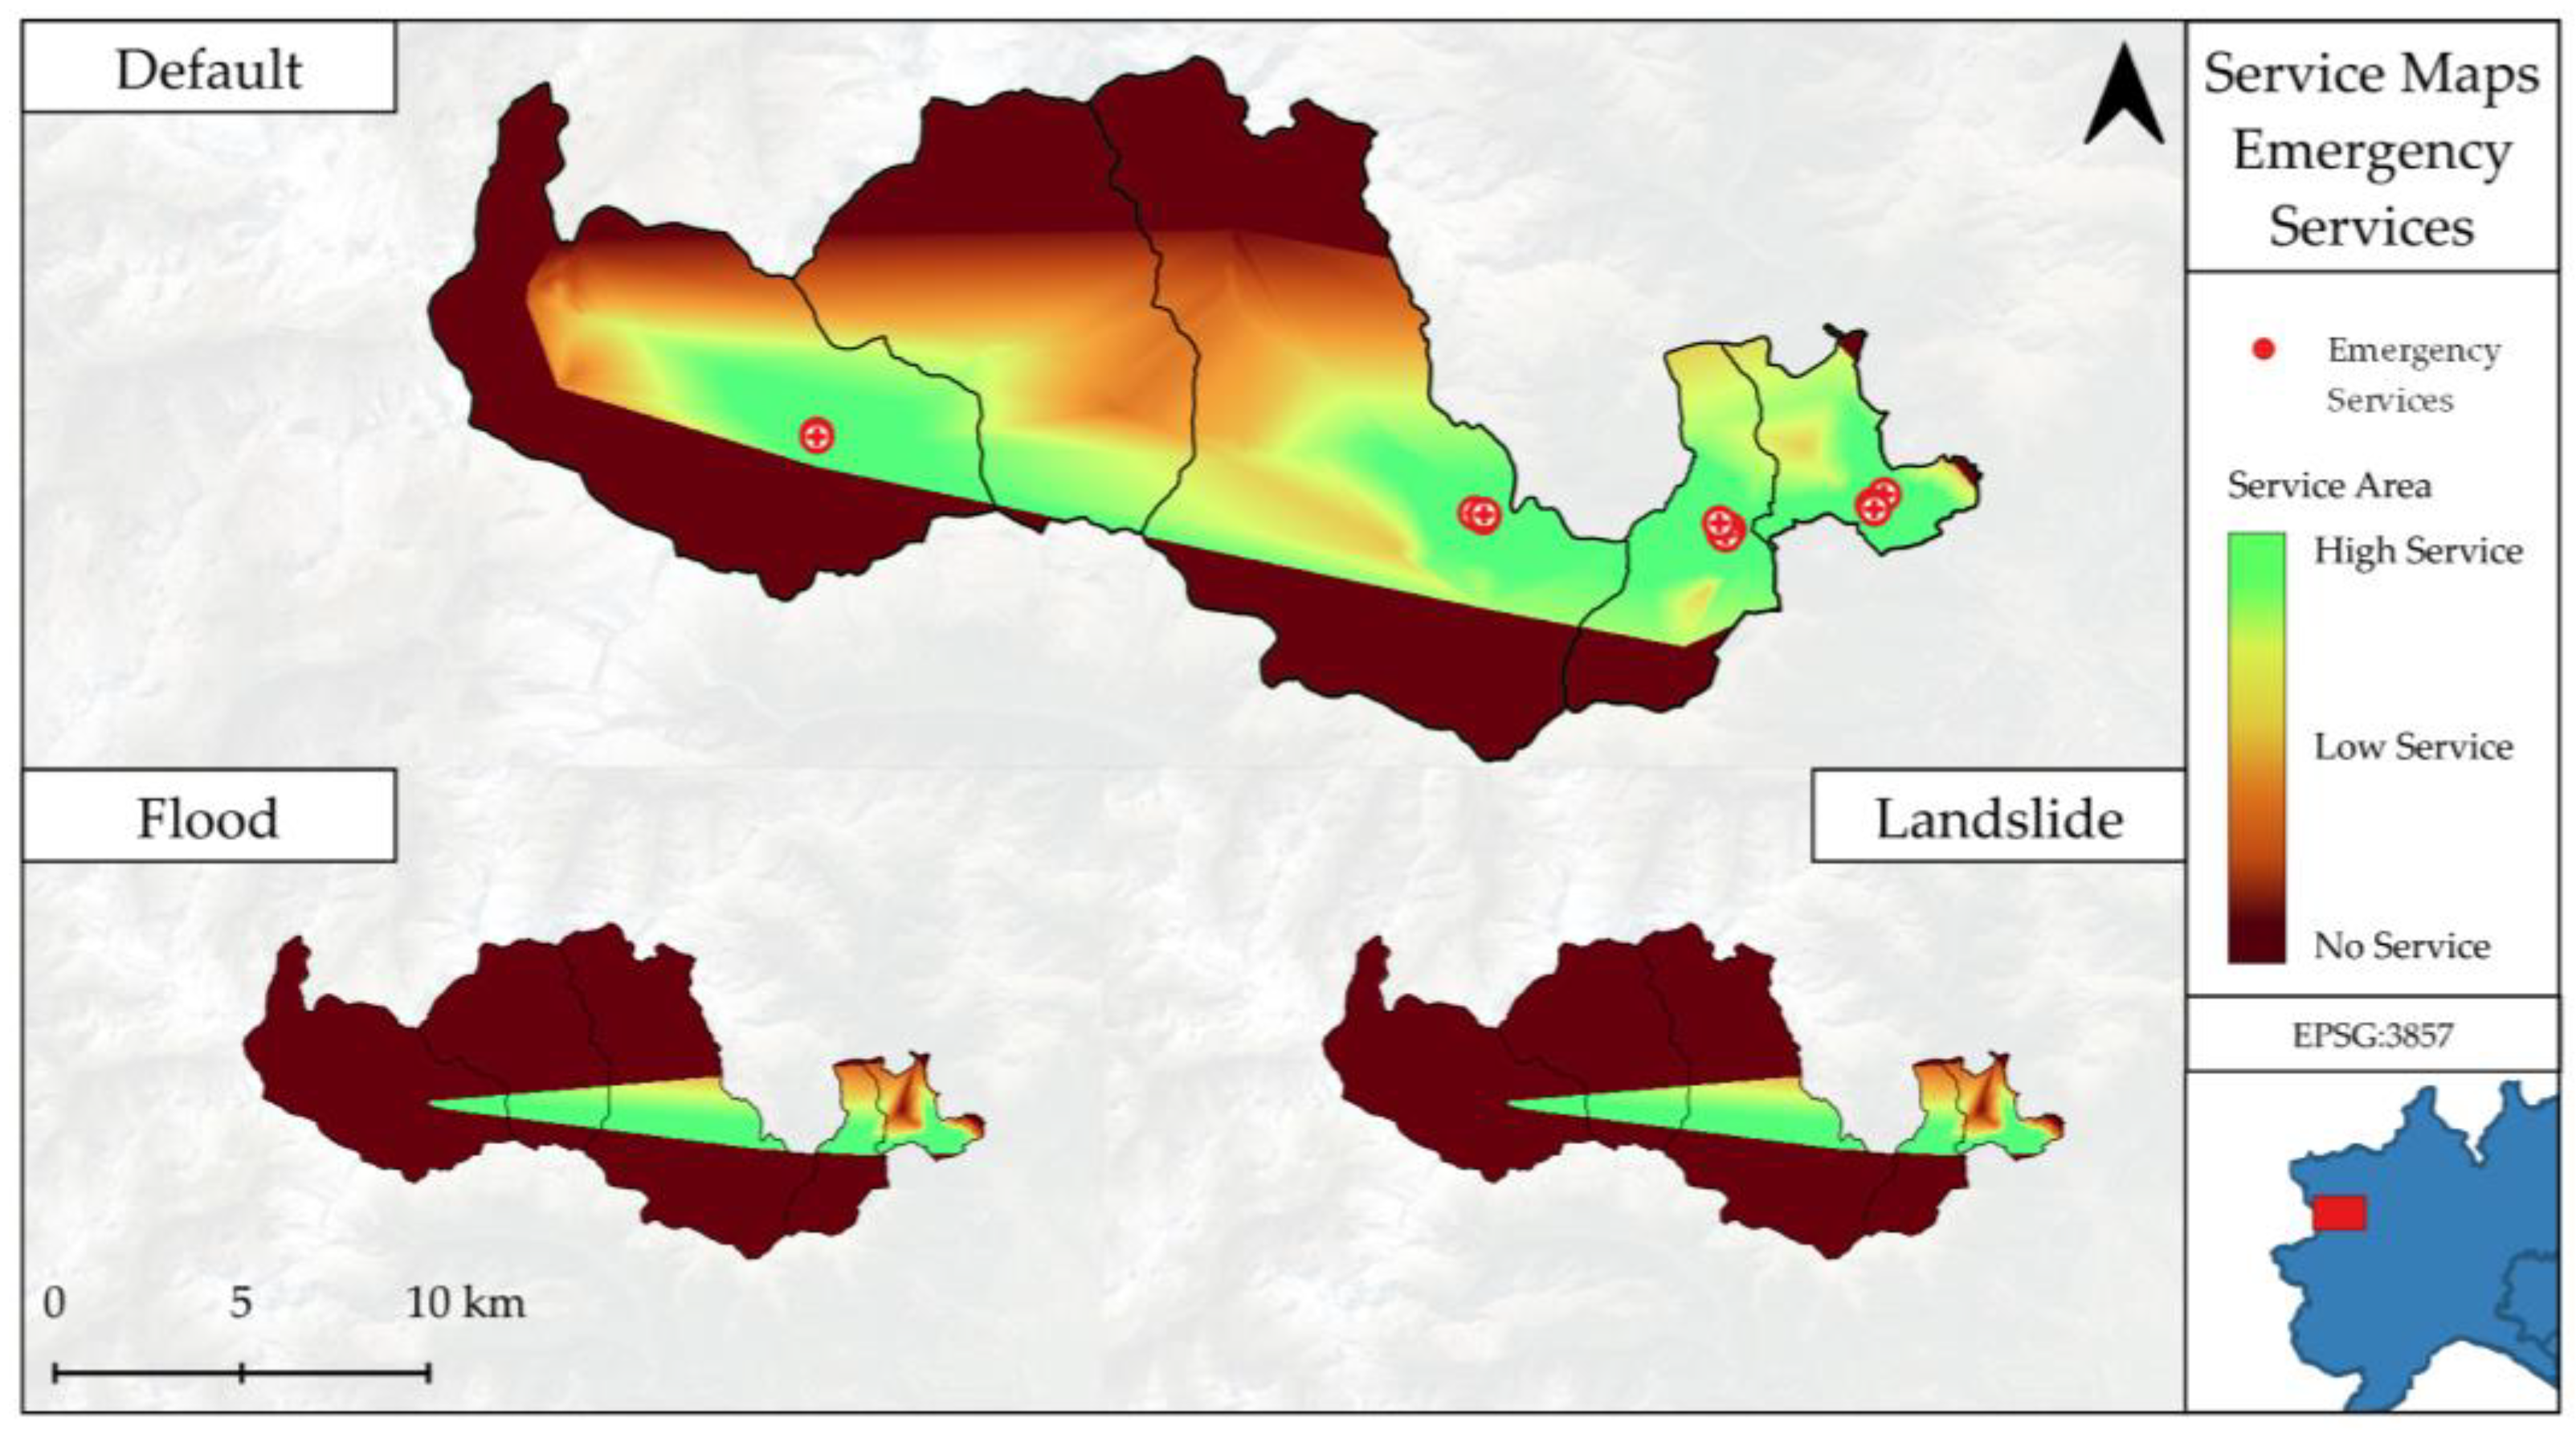
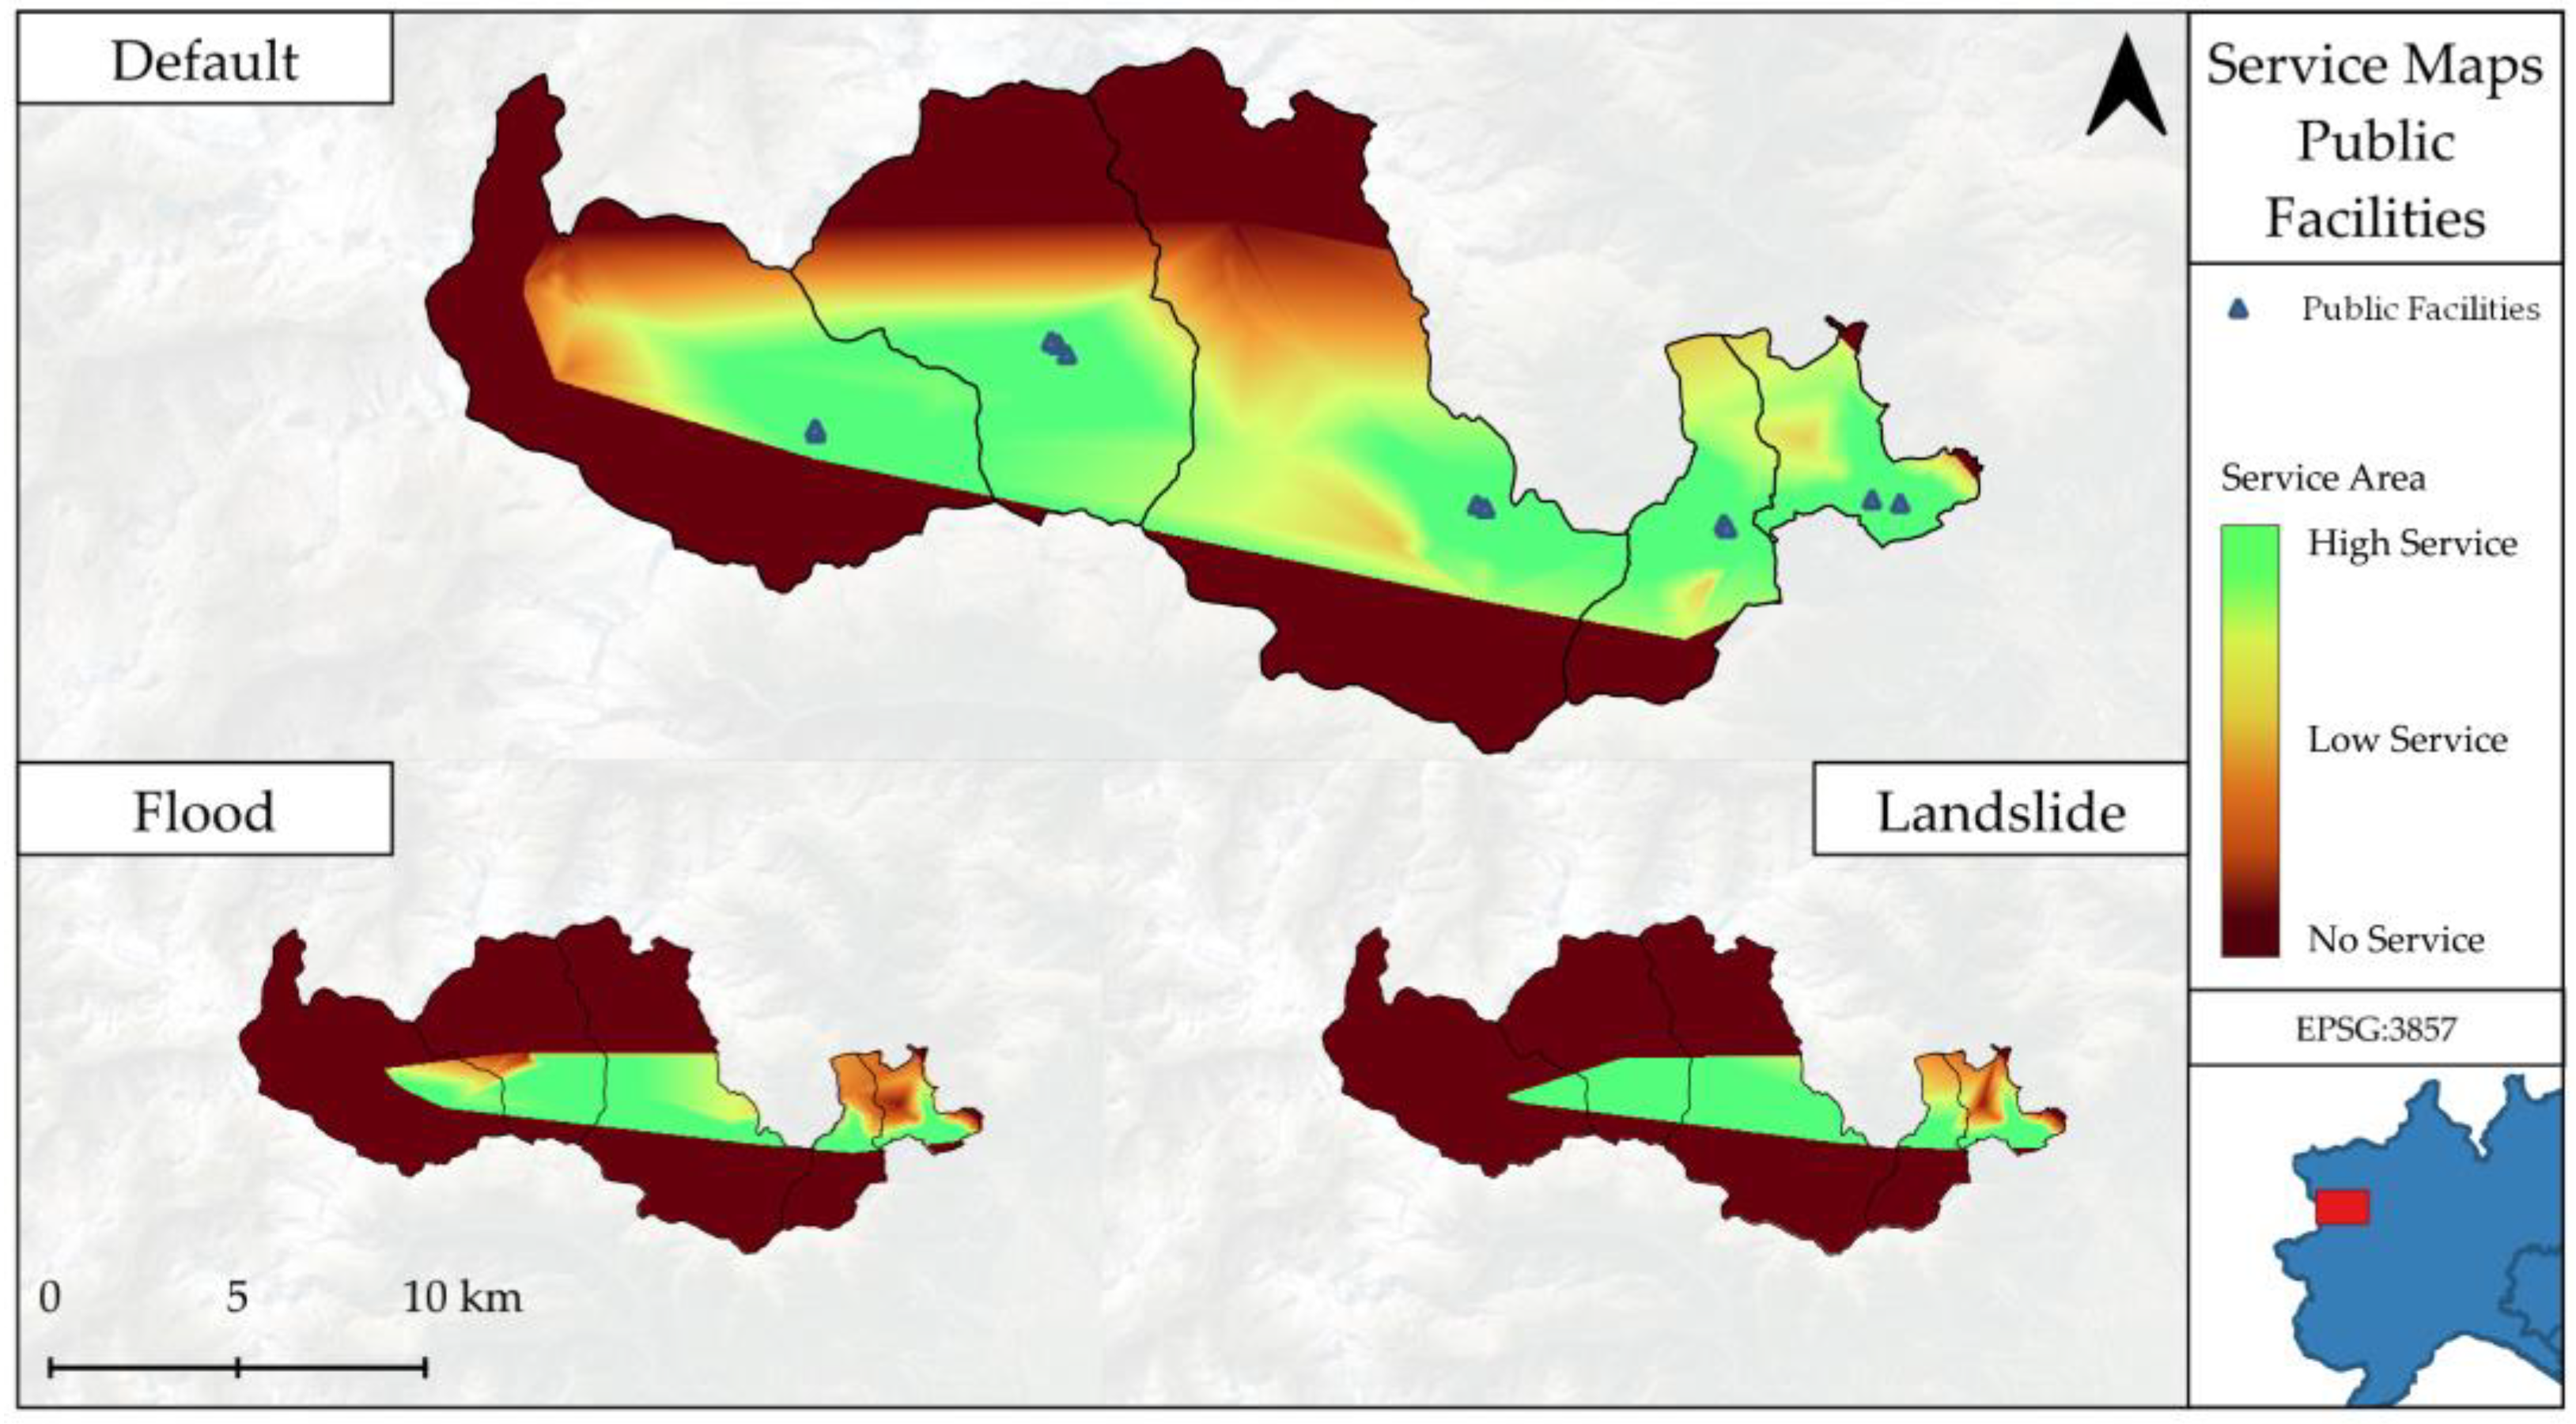
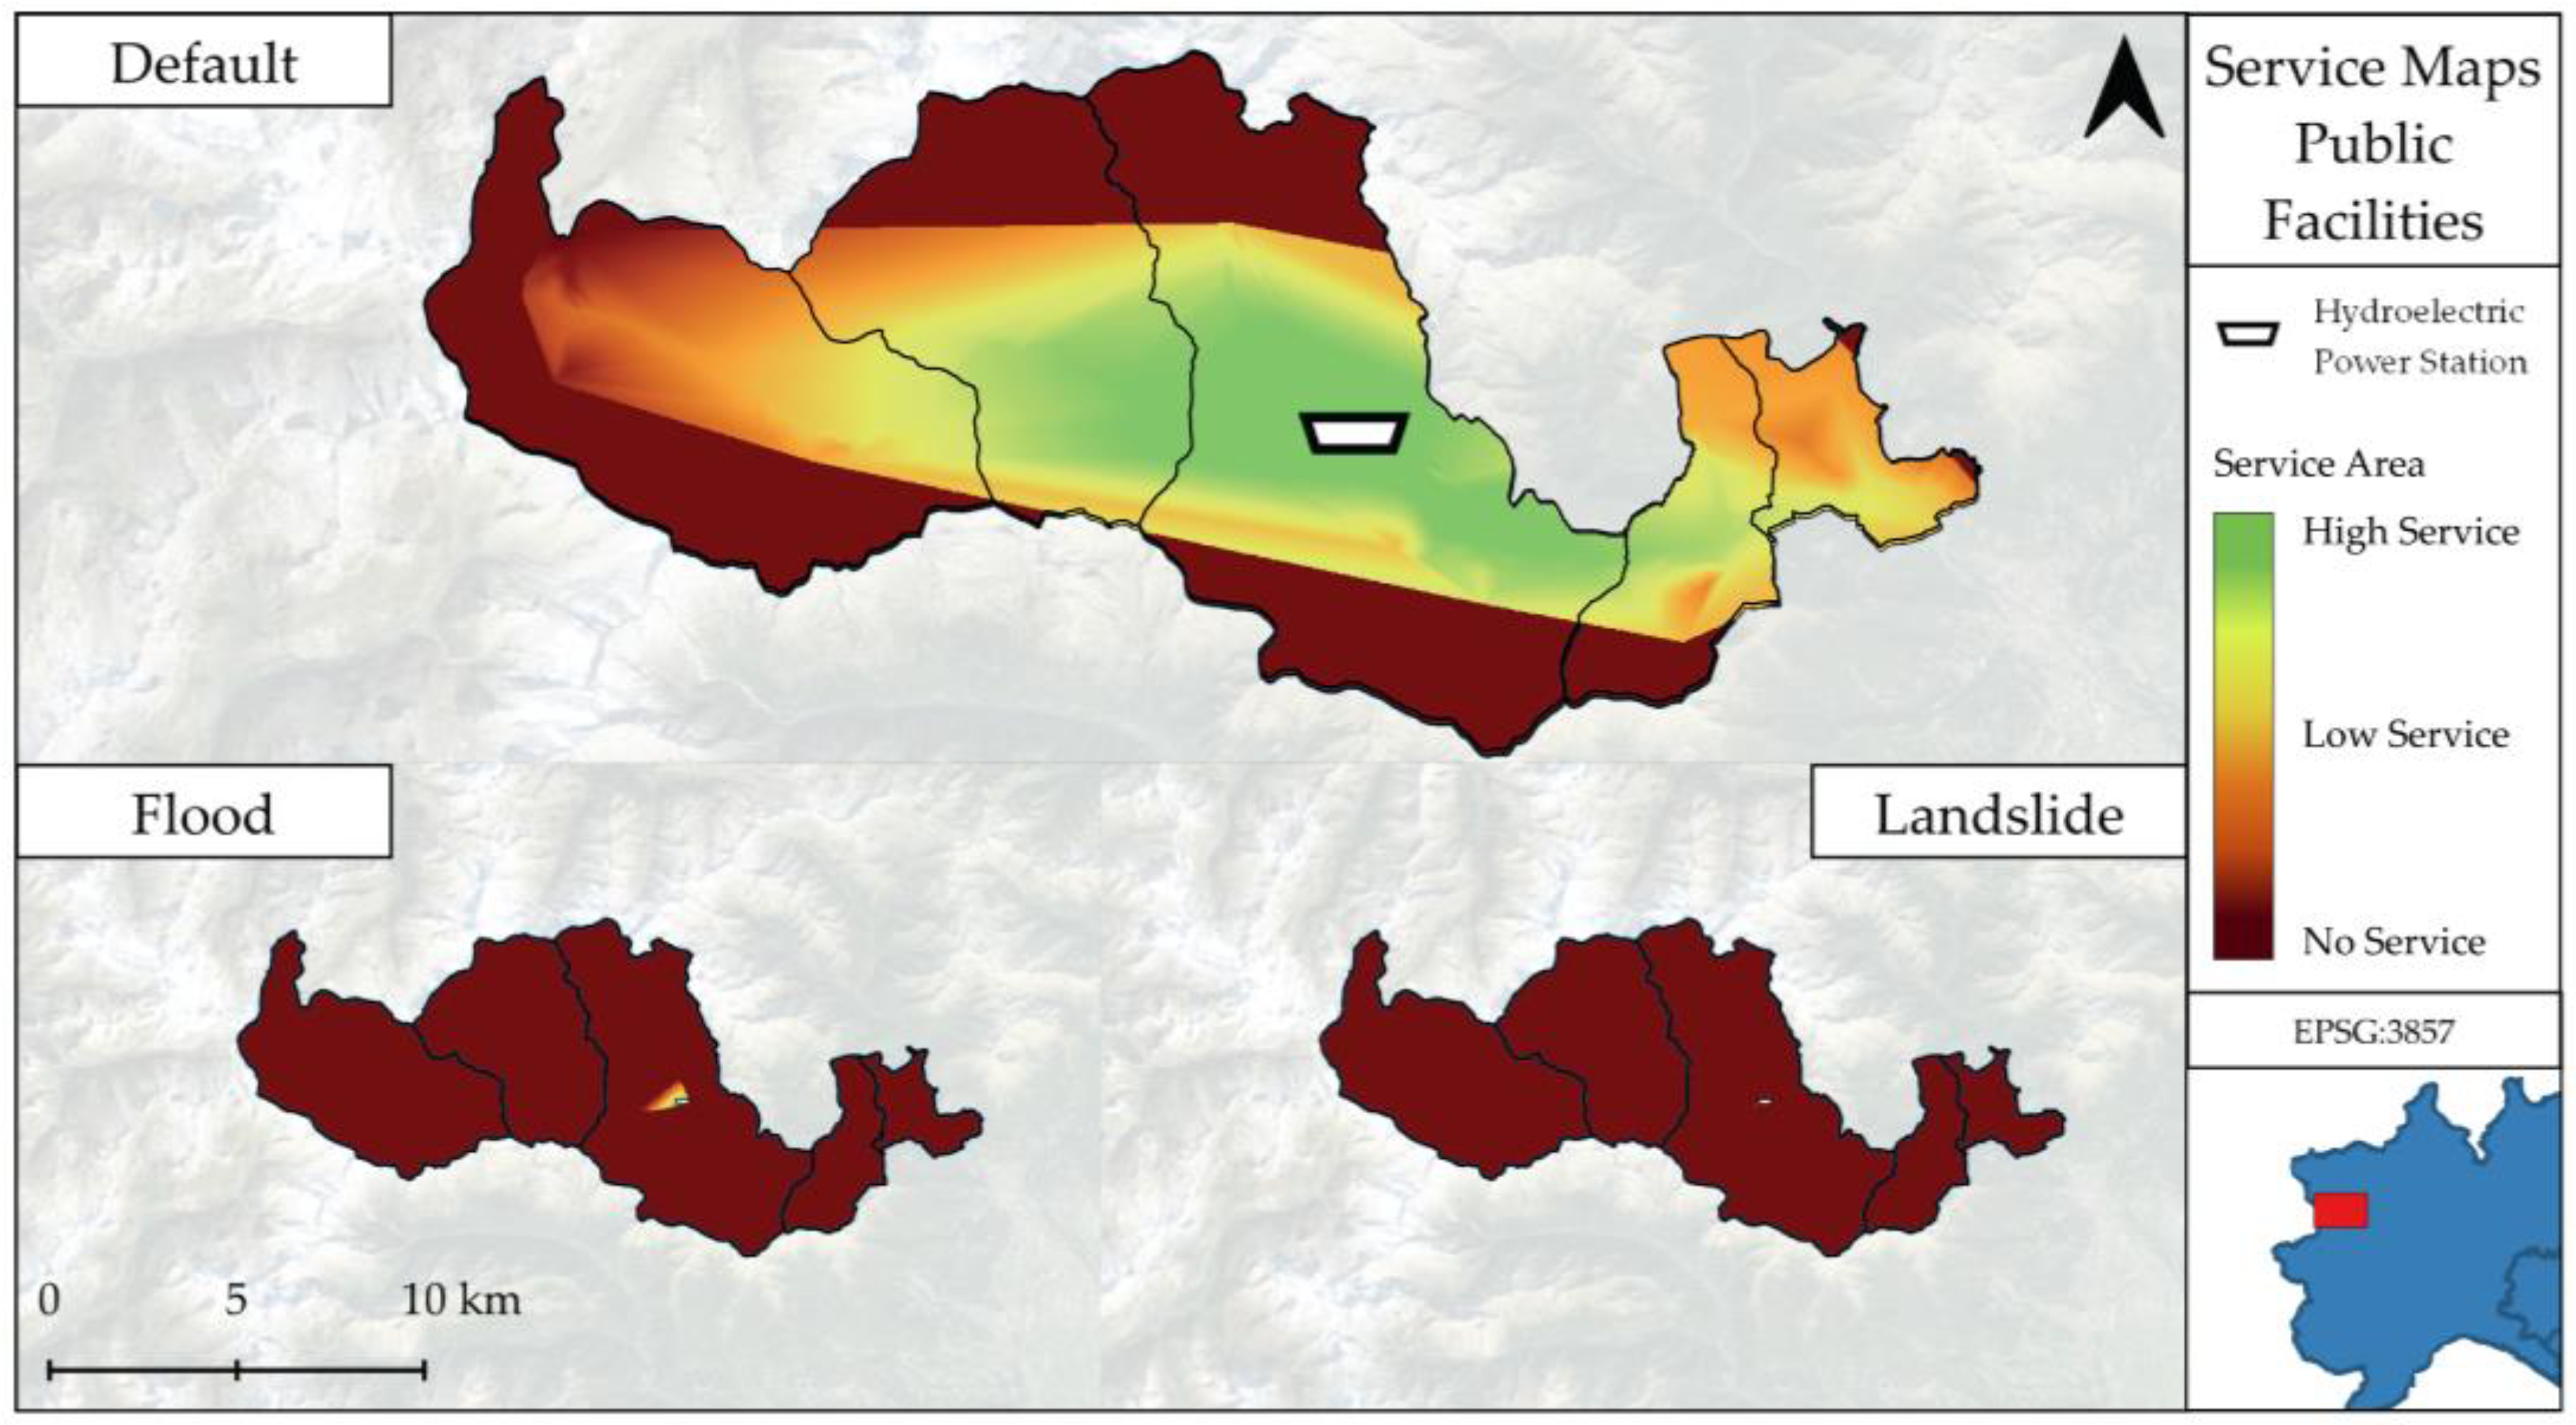
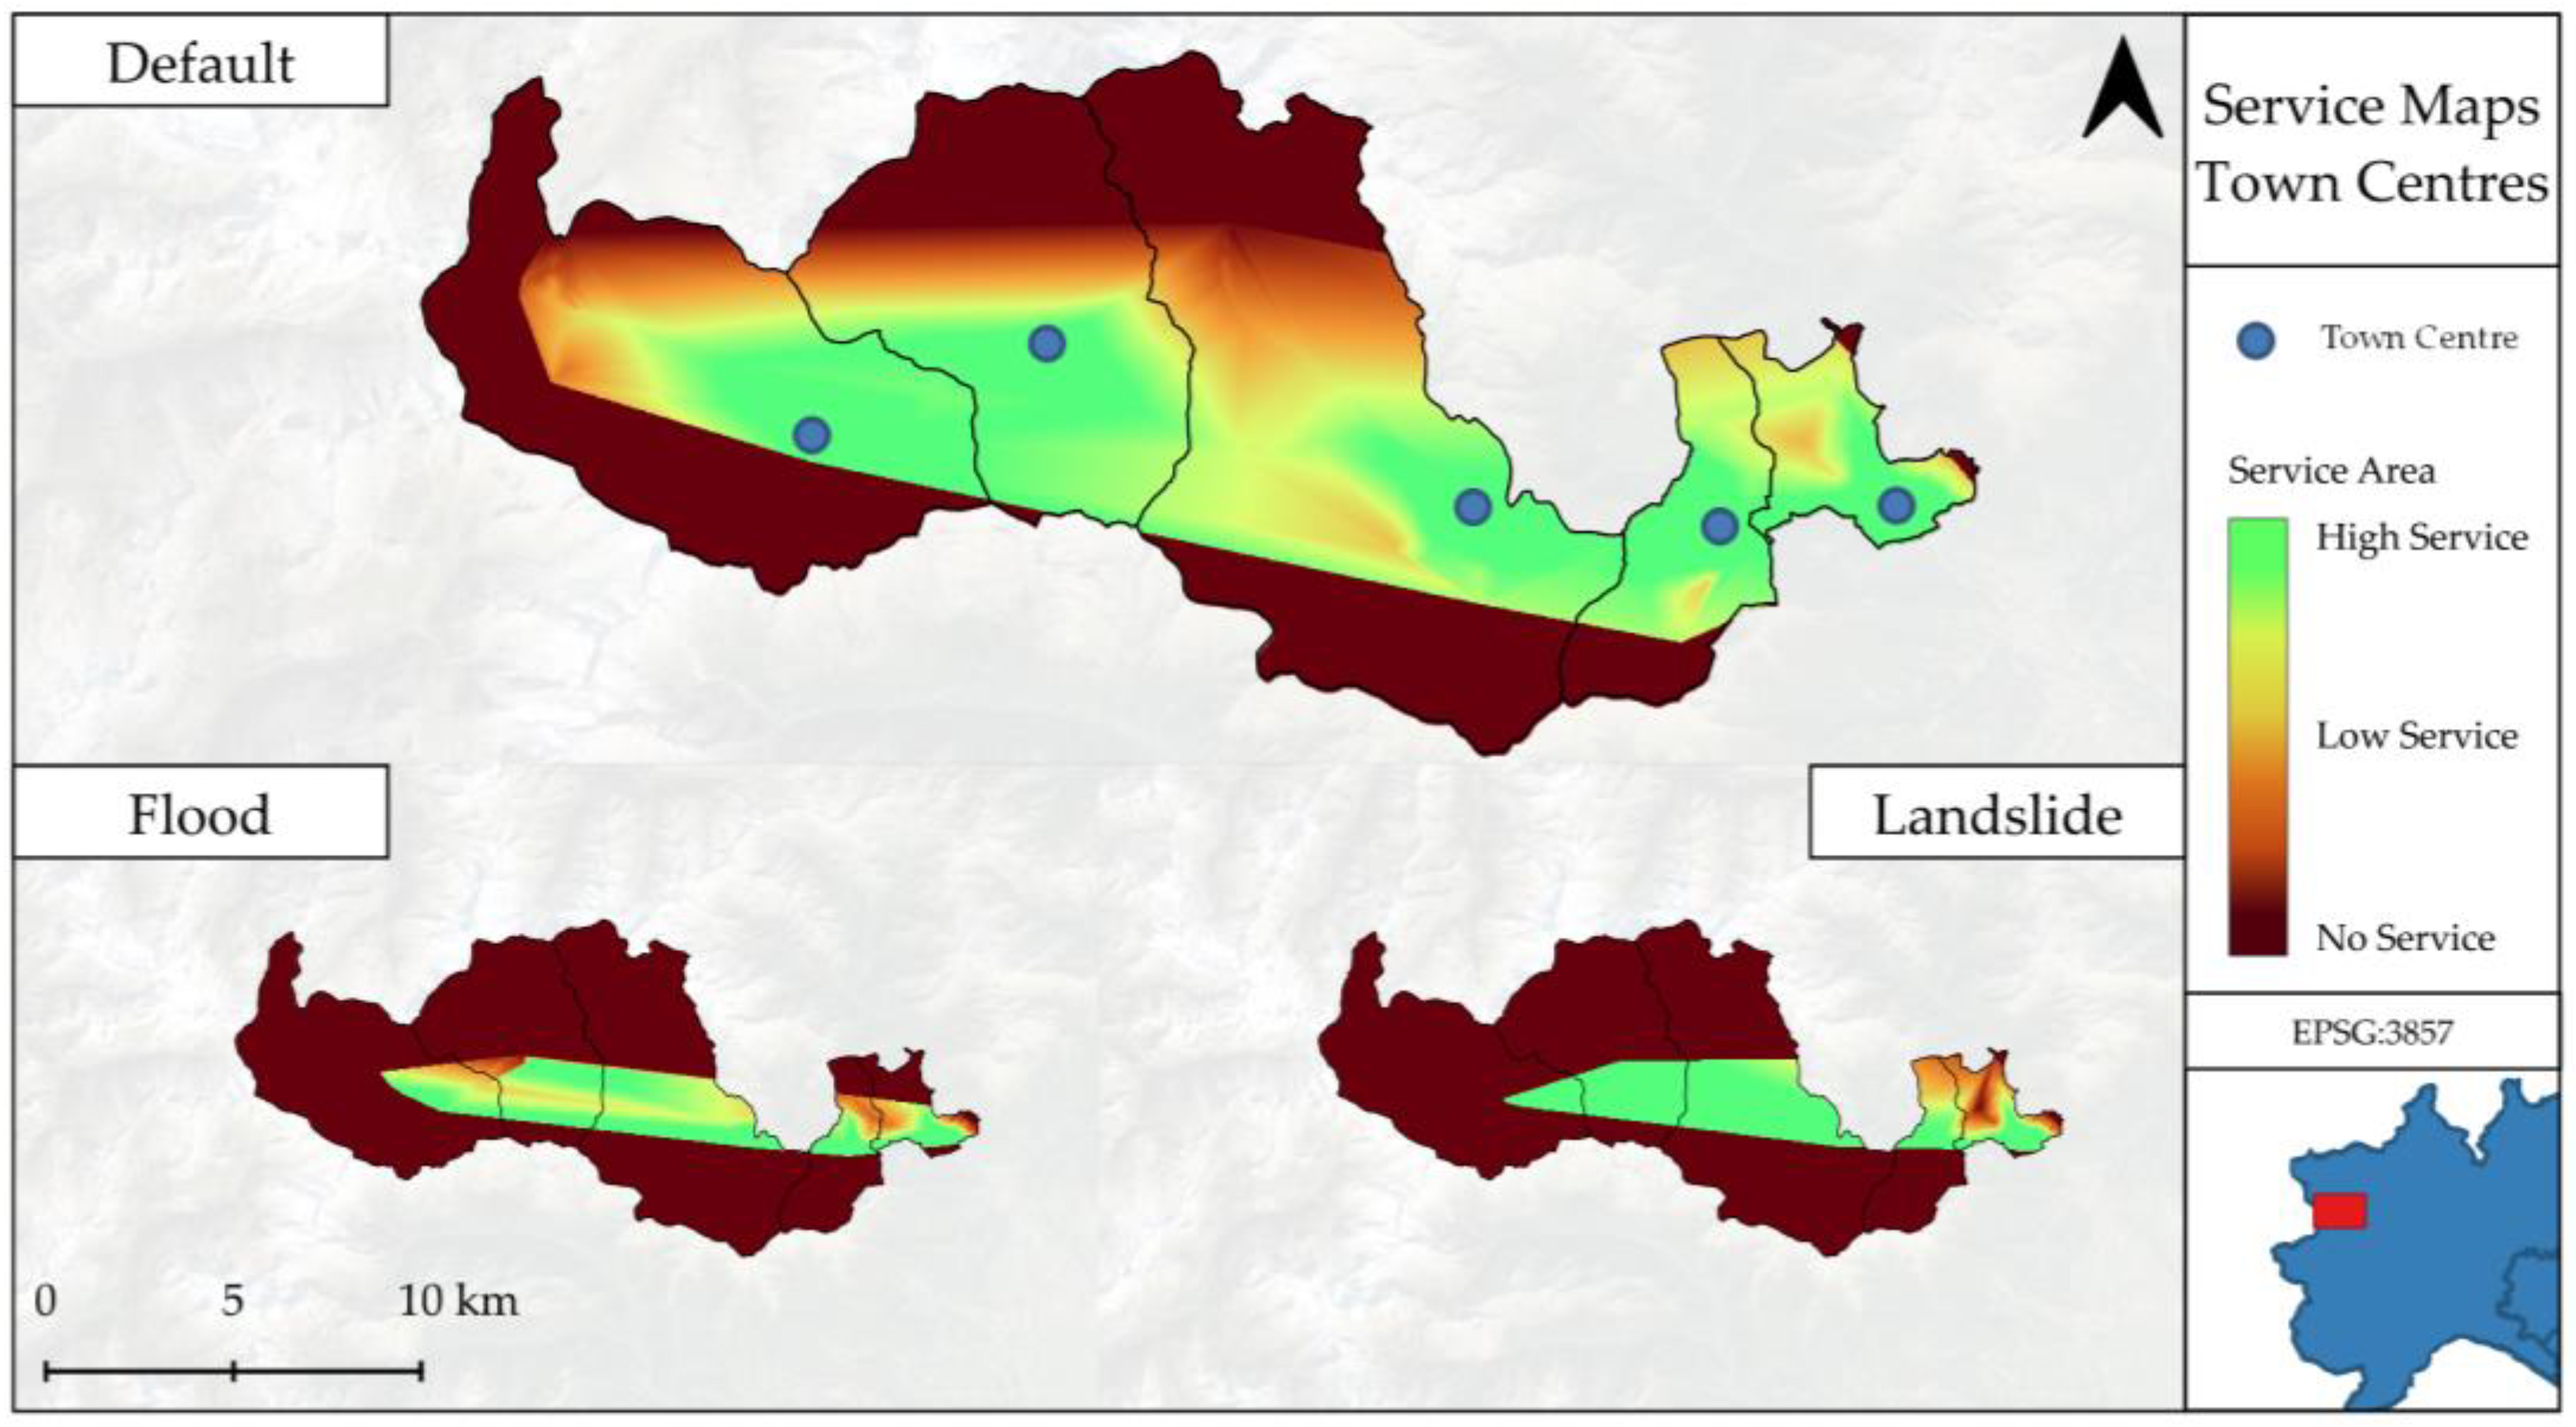
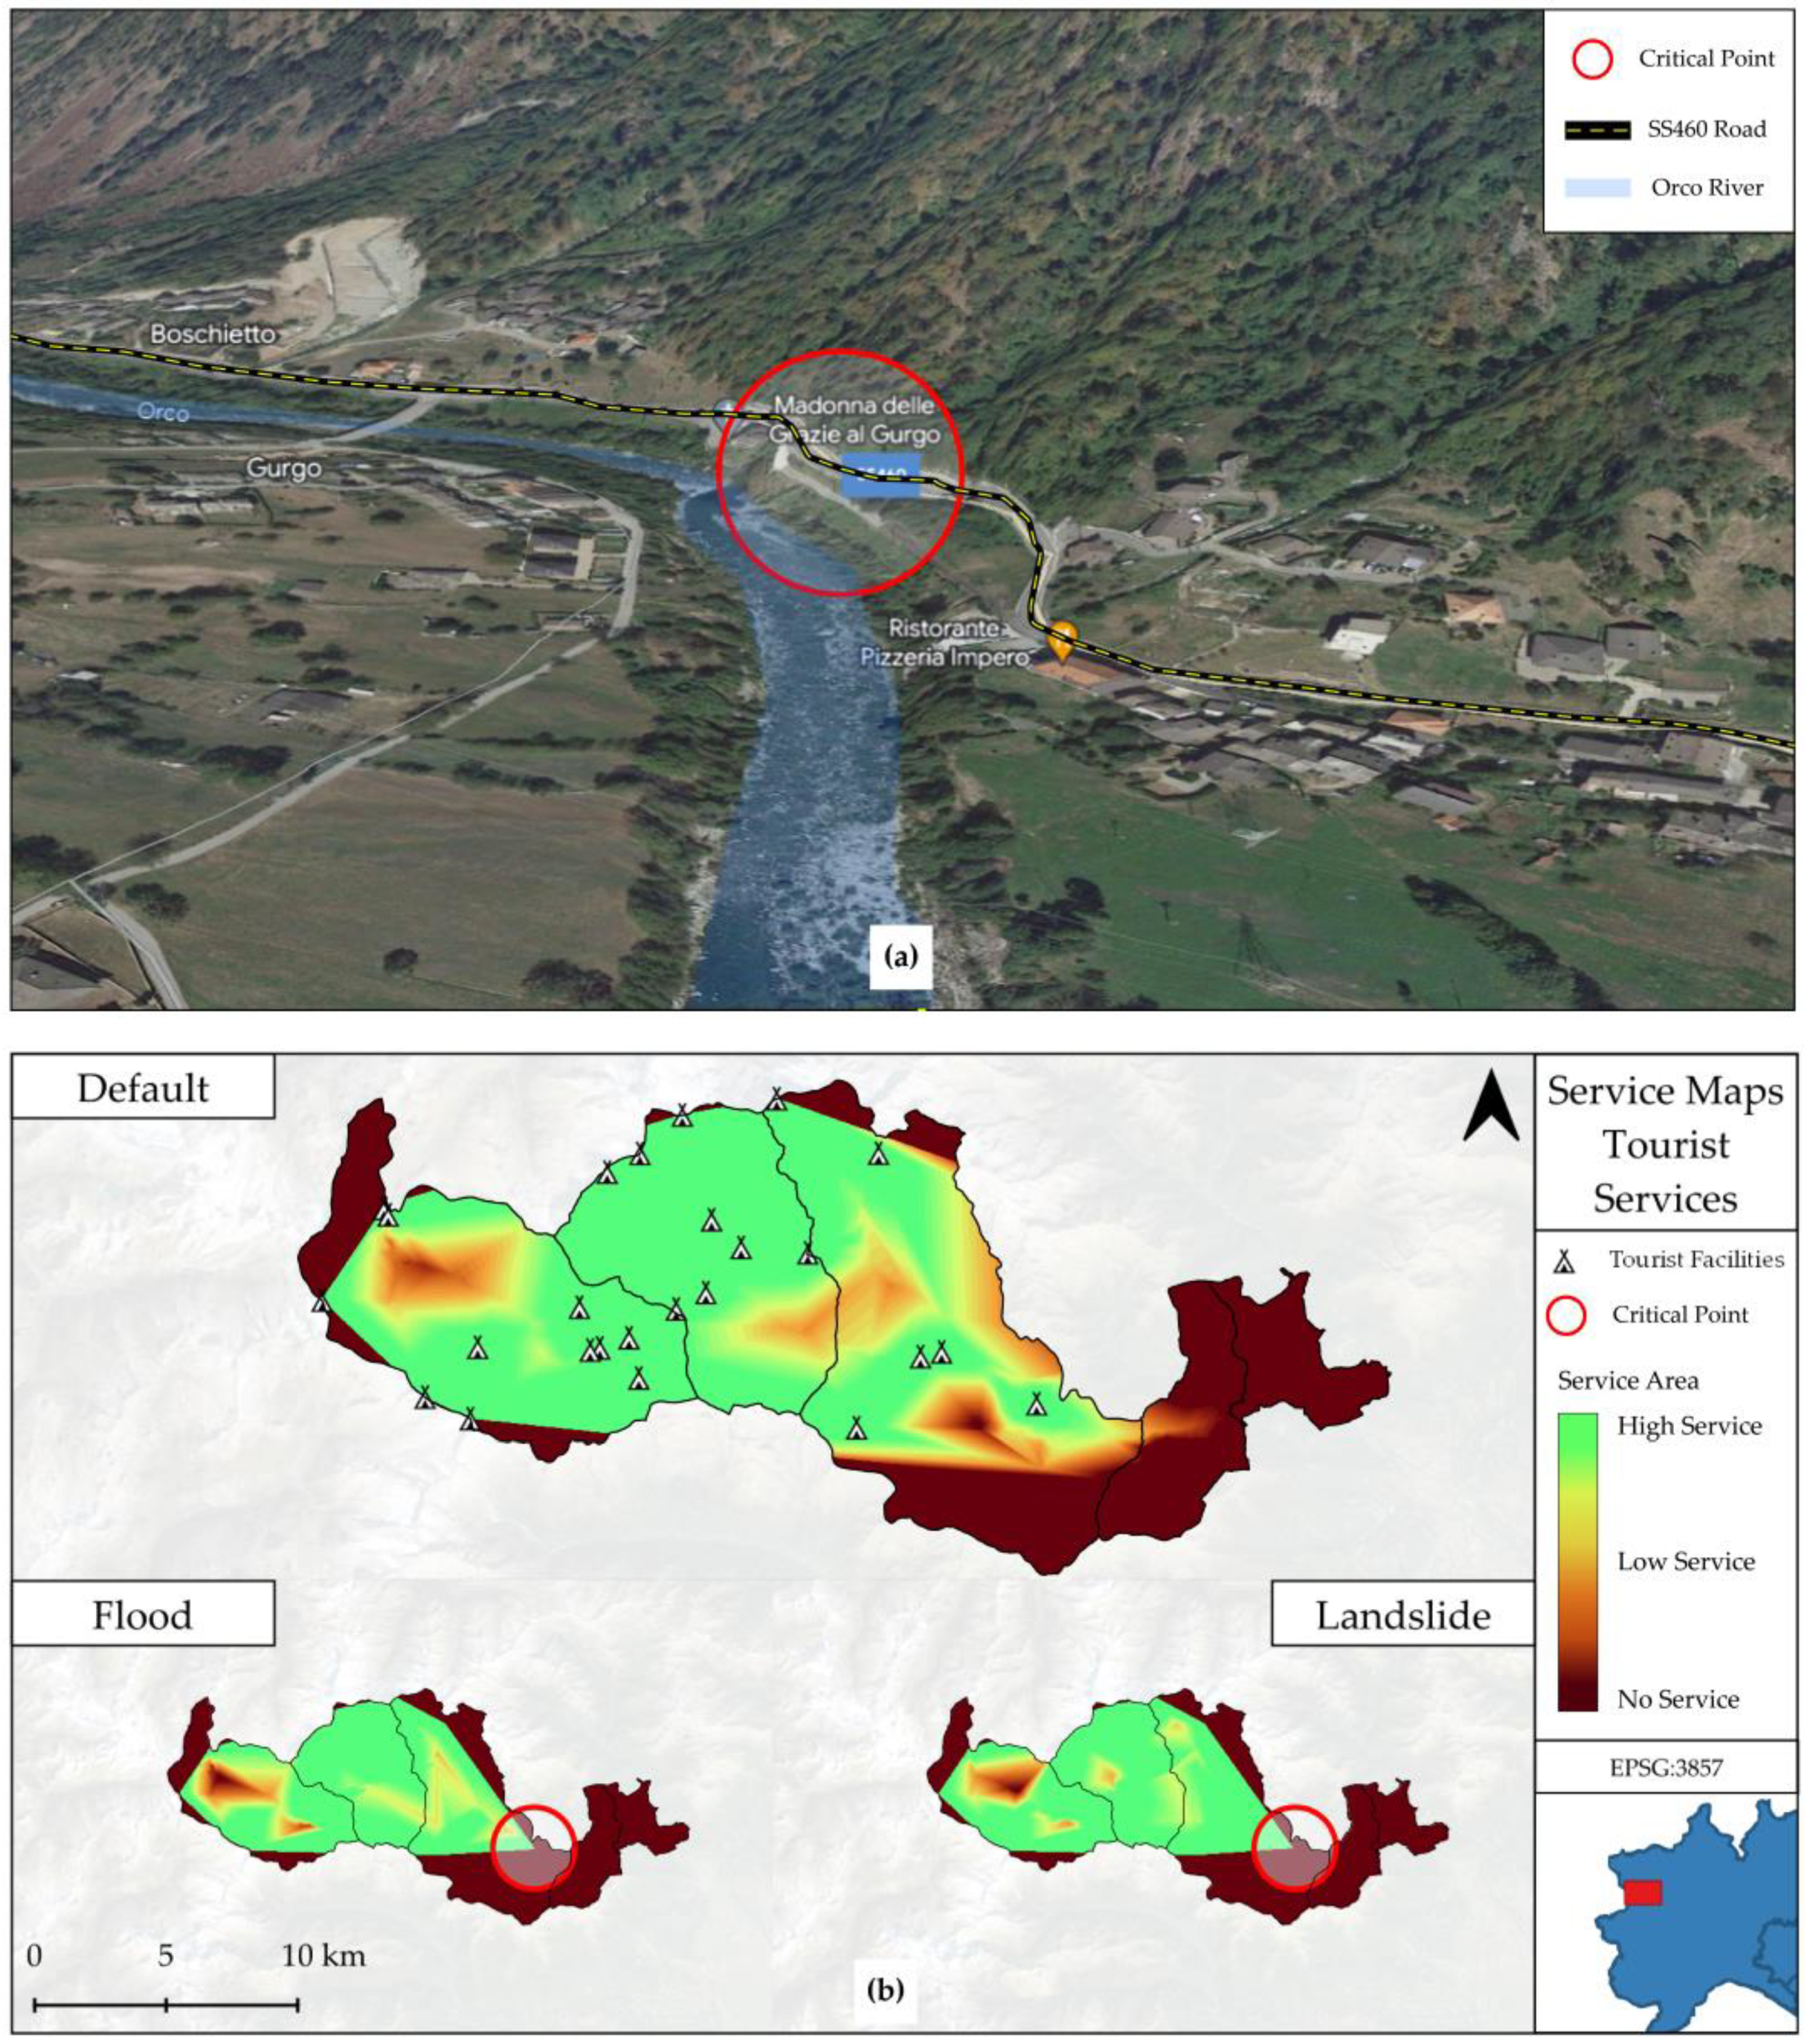
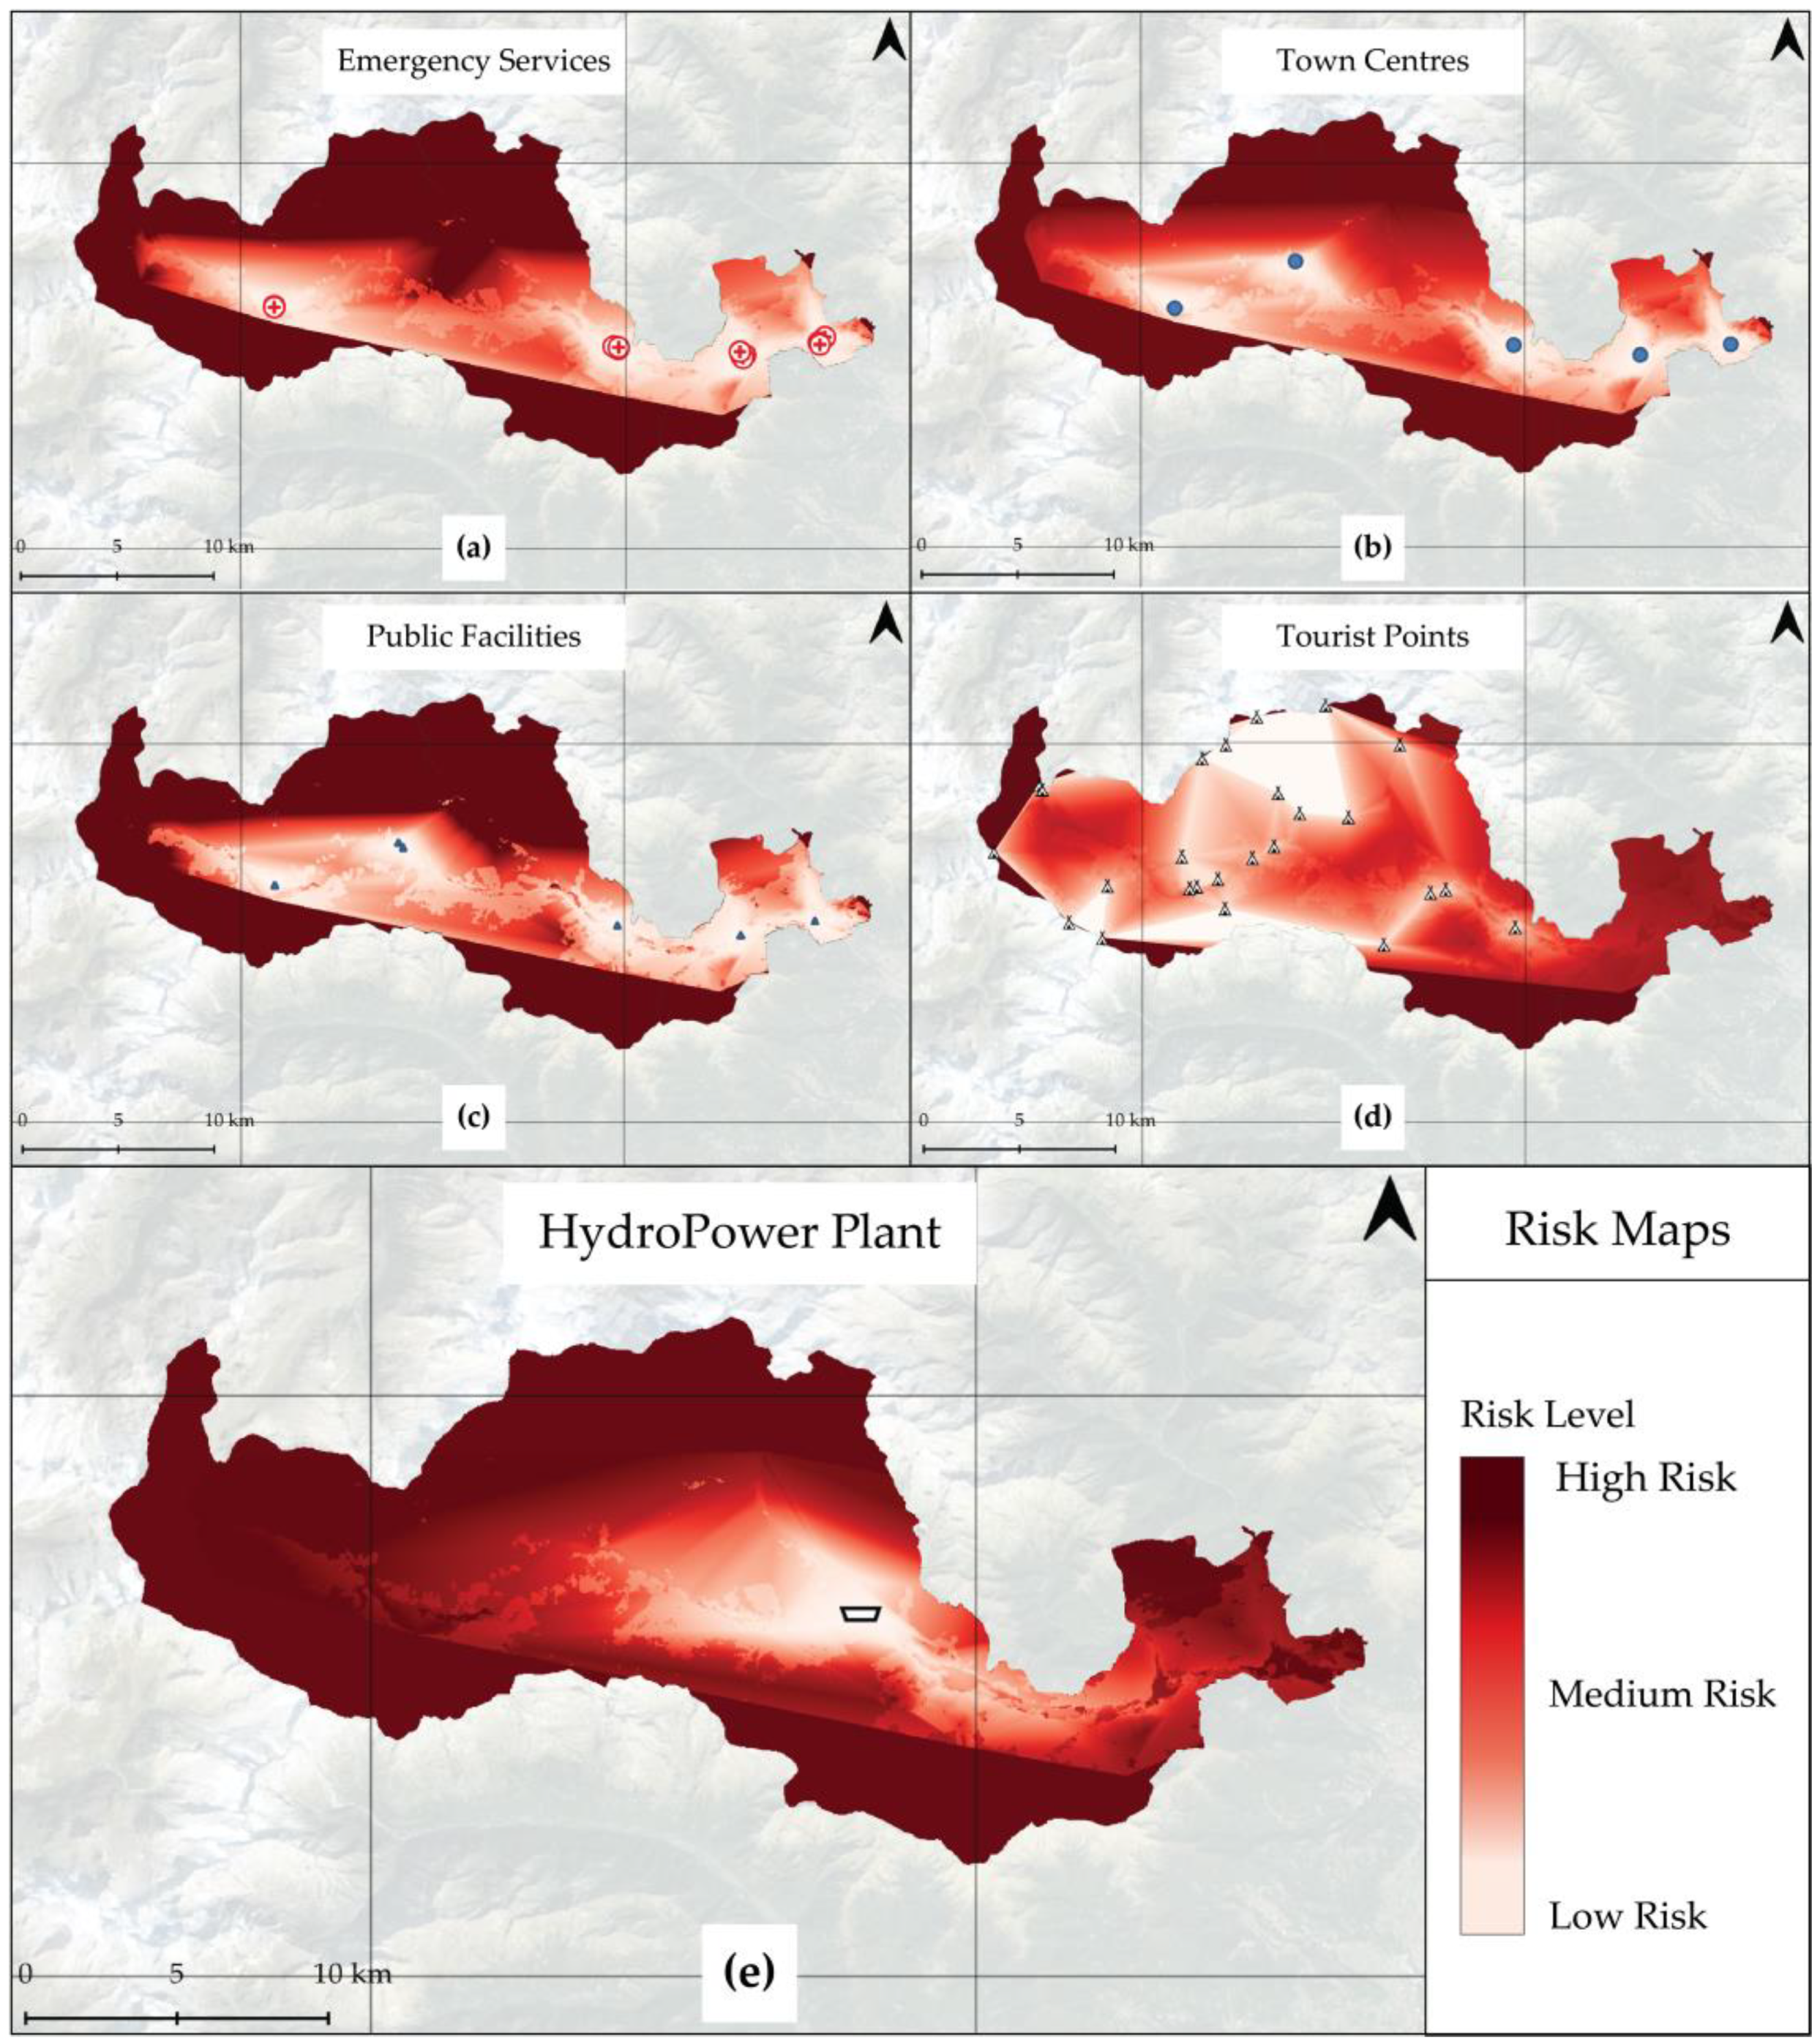
3.1. Quantitative Analysis: Service Maps
- Hazard Emergency Health Services Facilities
- Public Facilities
- Critical infrastructures
- Town Centers for Public Activity and Mobility
- Tourism Facilities
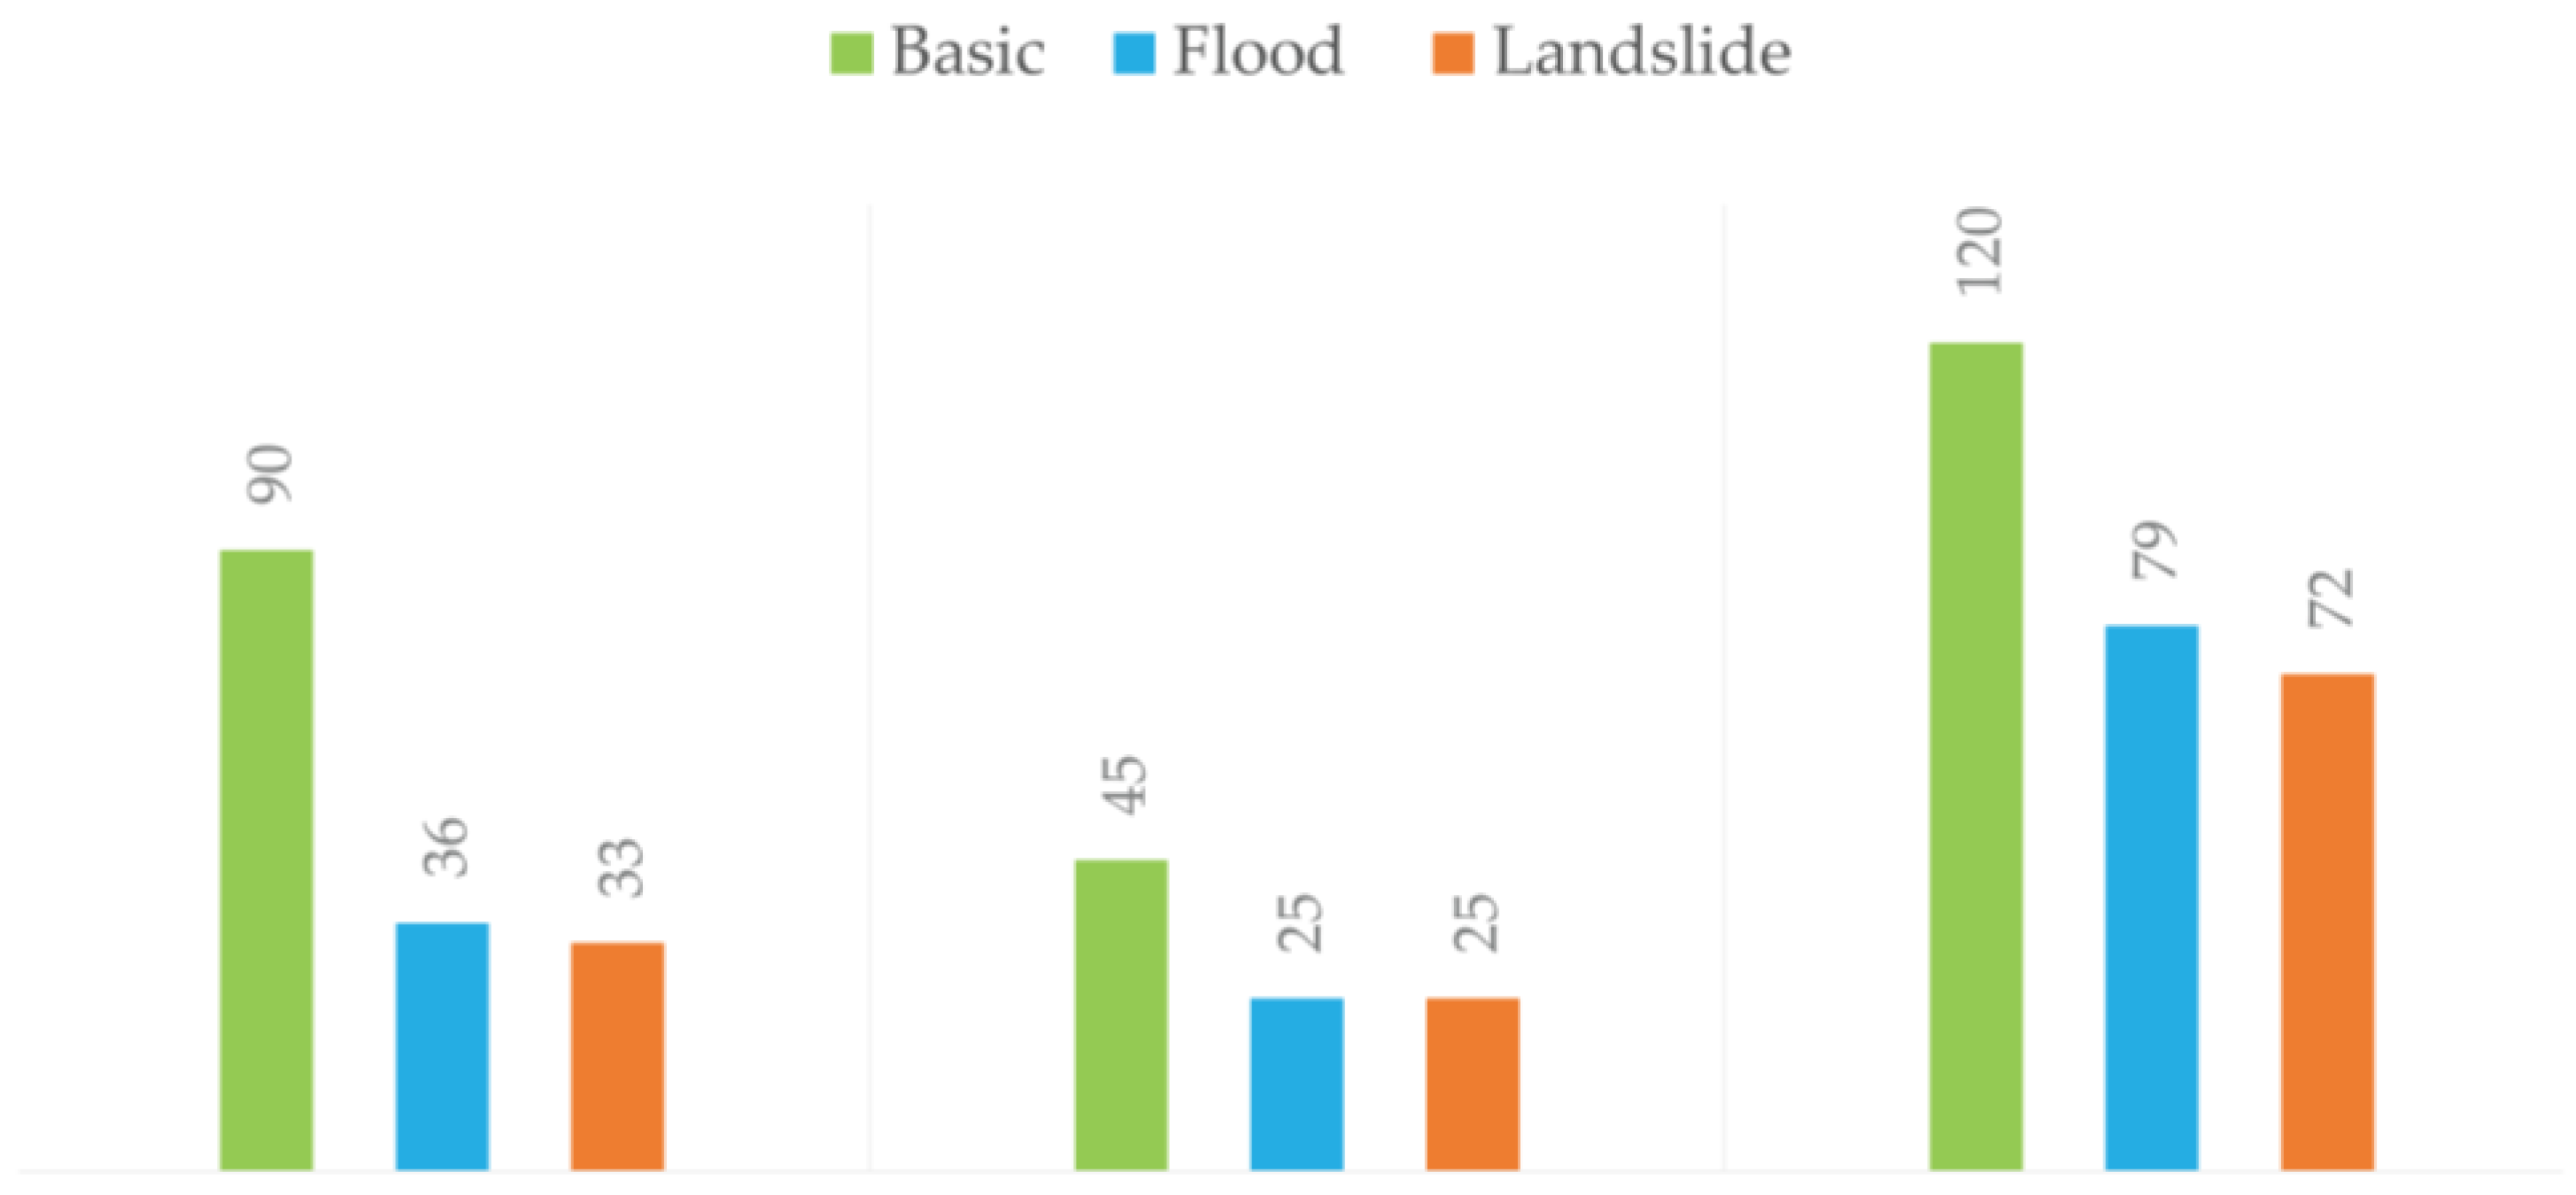
3.2. Quantitative Analysis: O-D Matrix Graphs
3.3. Risk Maps and Risk Scores
4. Discussion
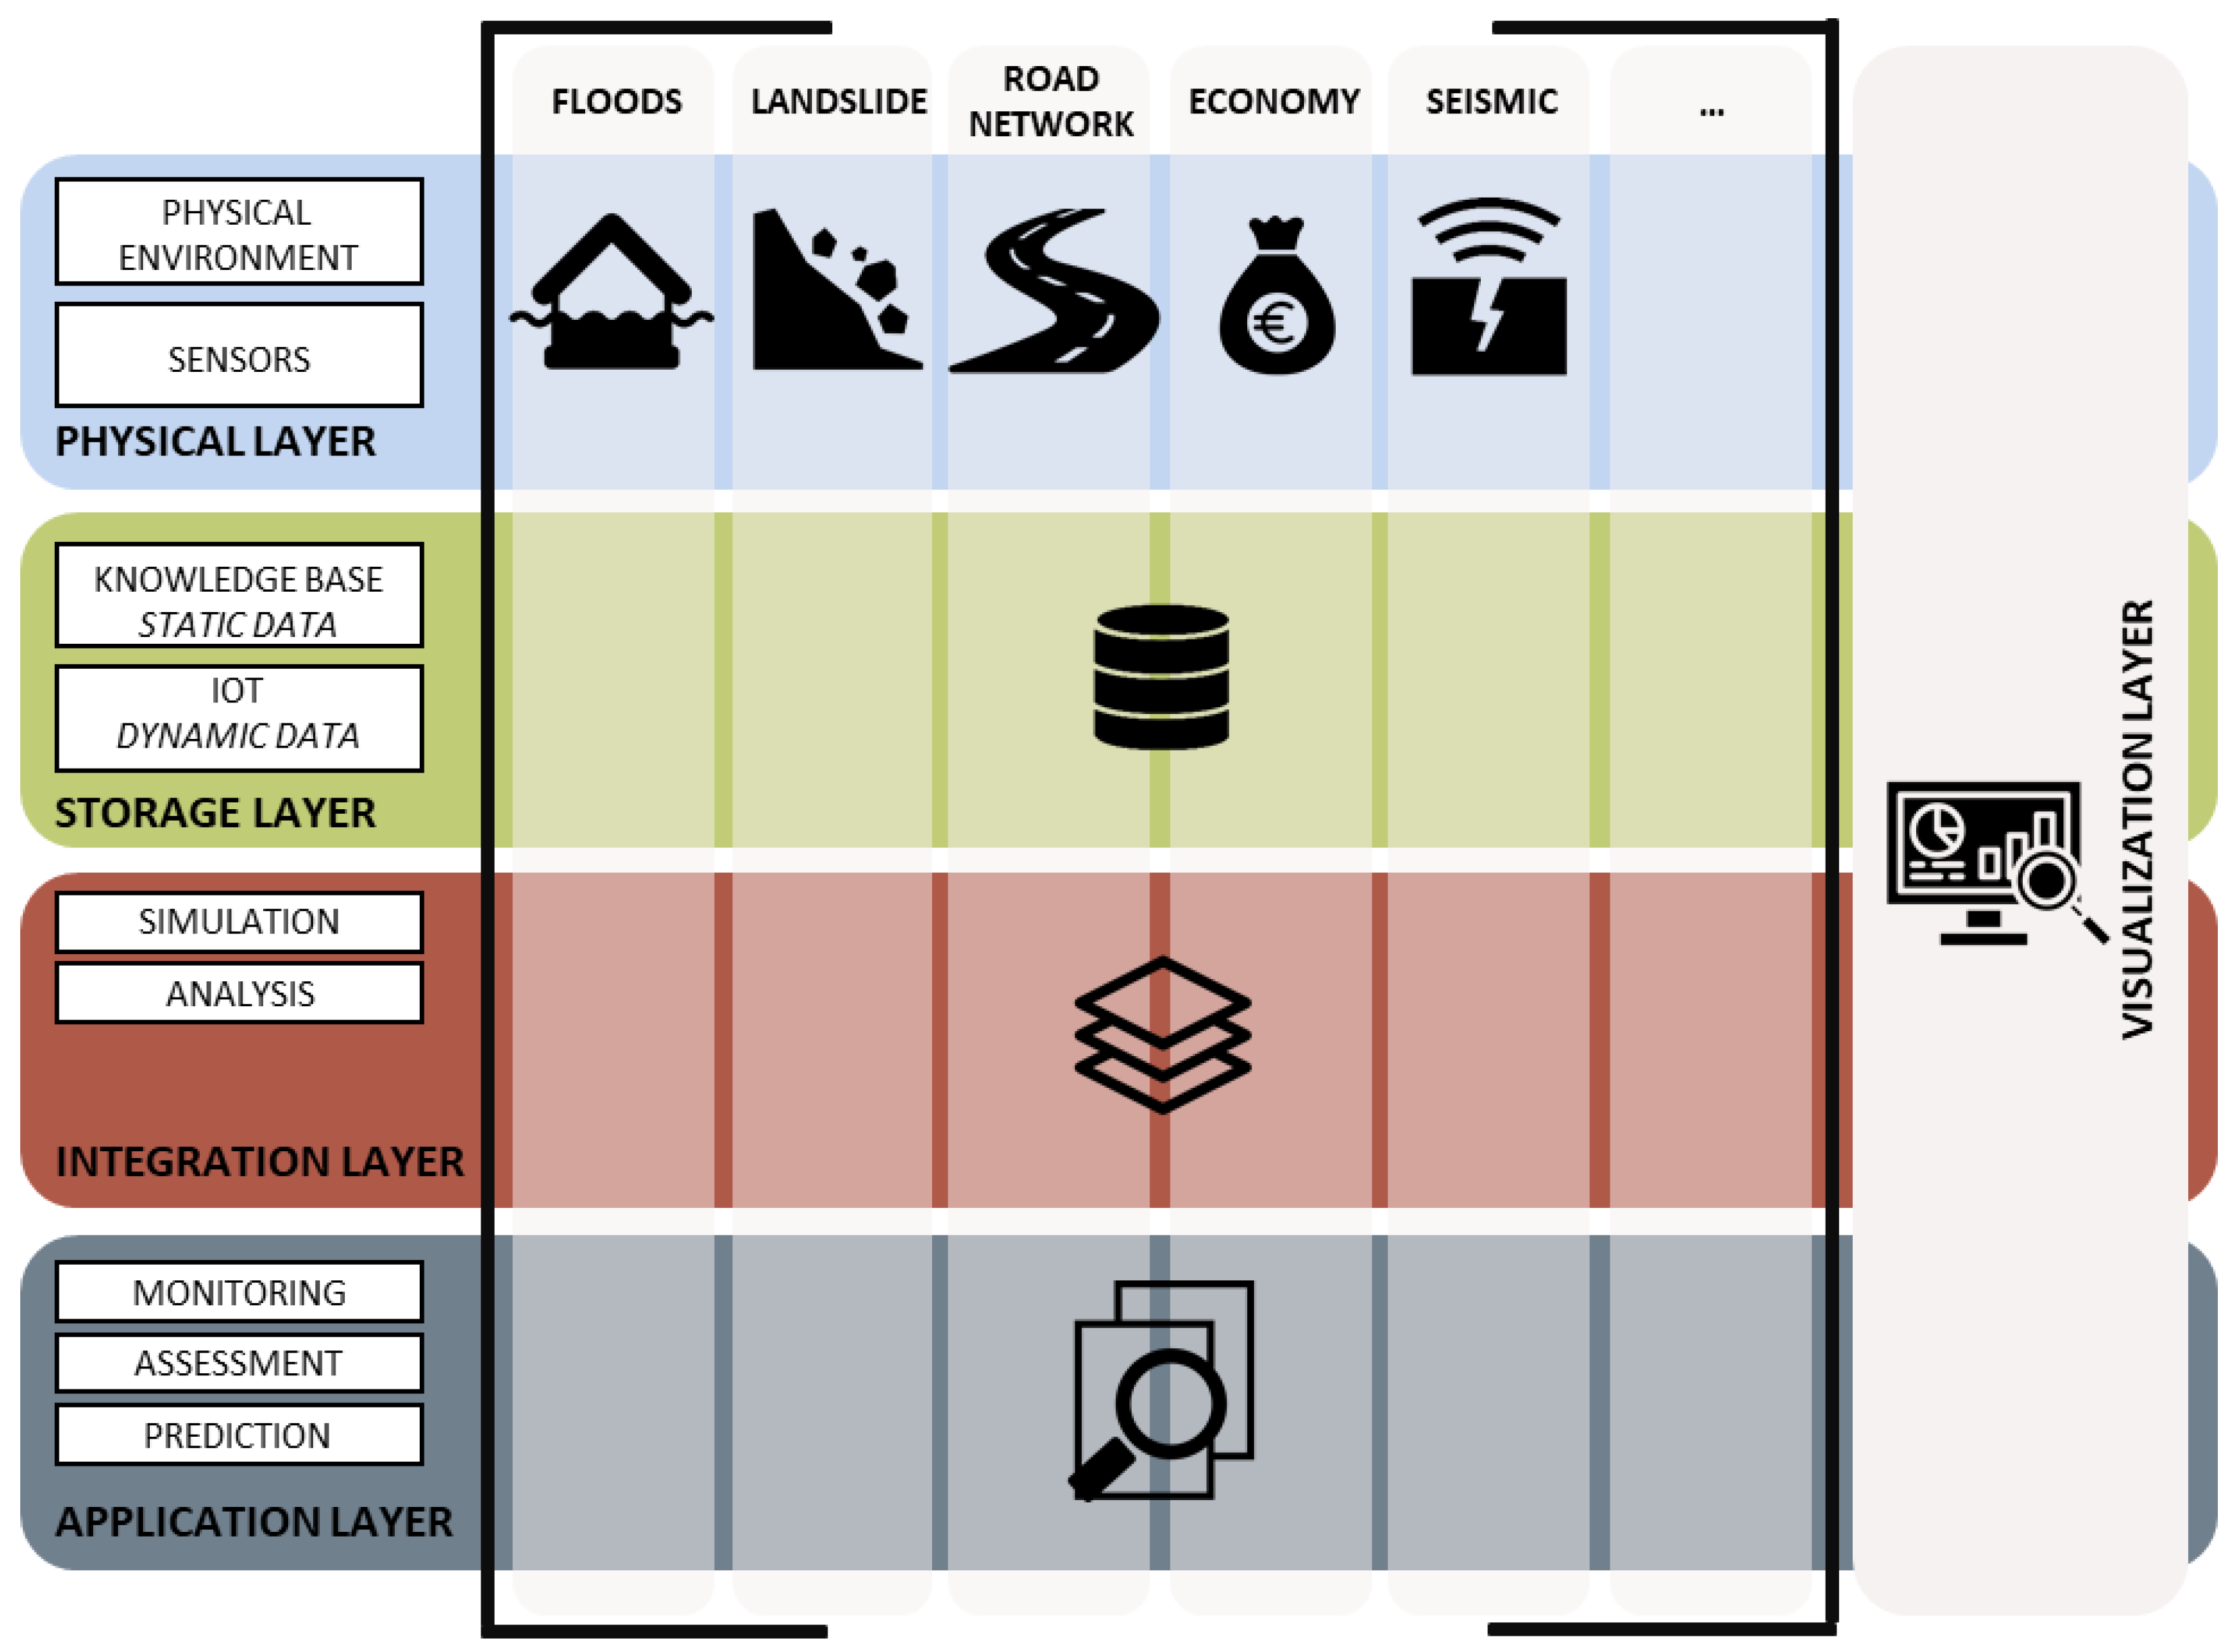
4.1. Scalability: Landscape Digital Twin Model
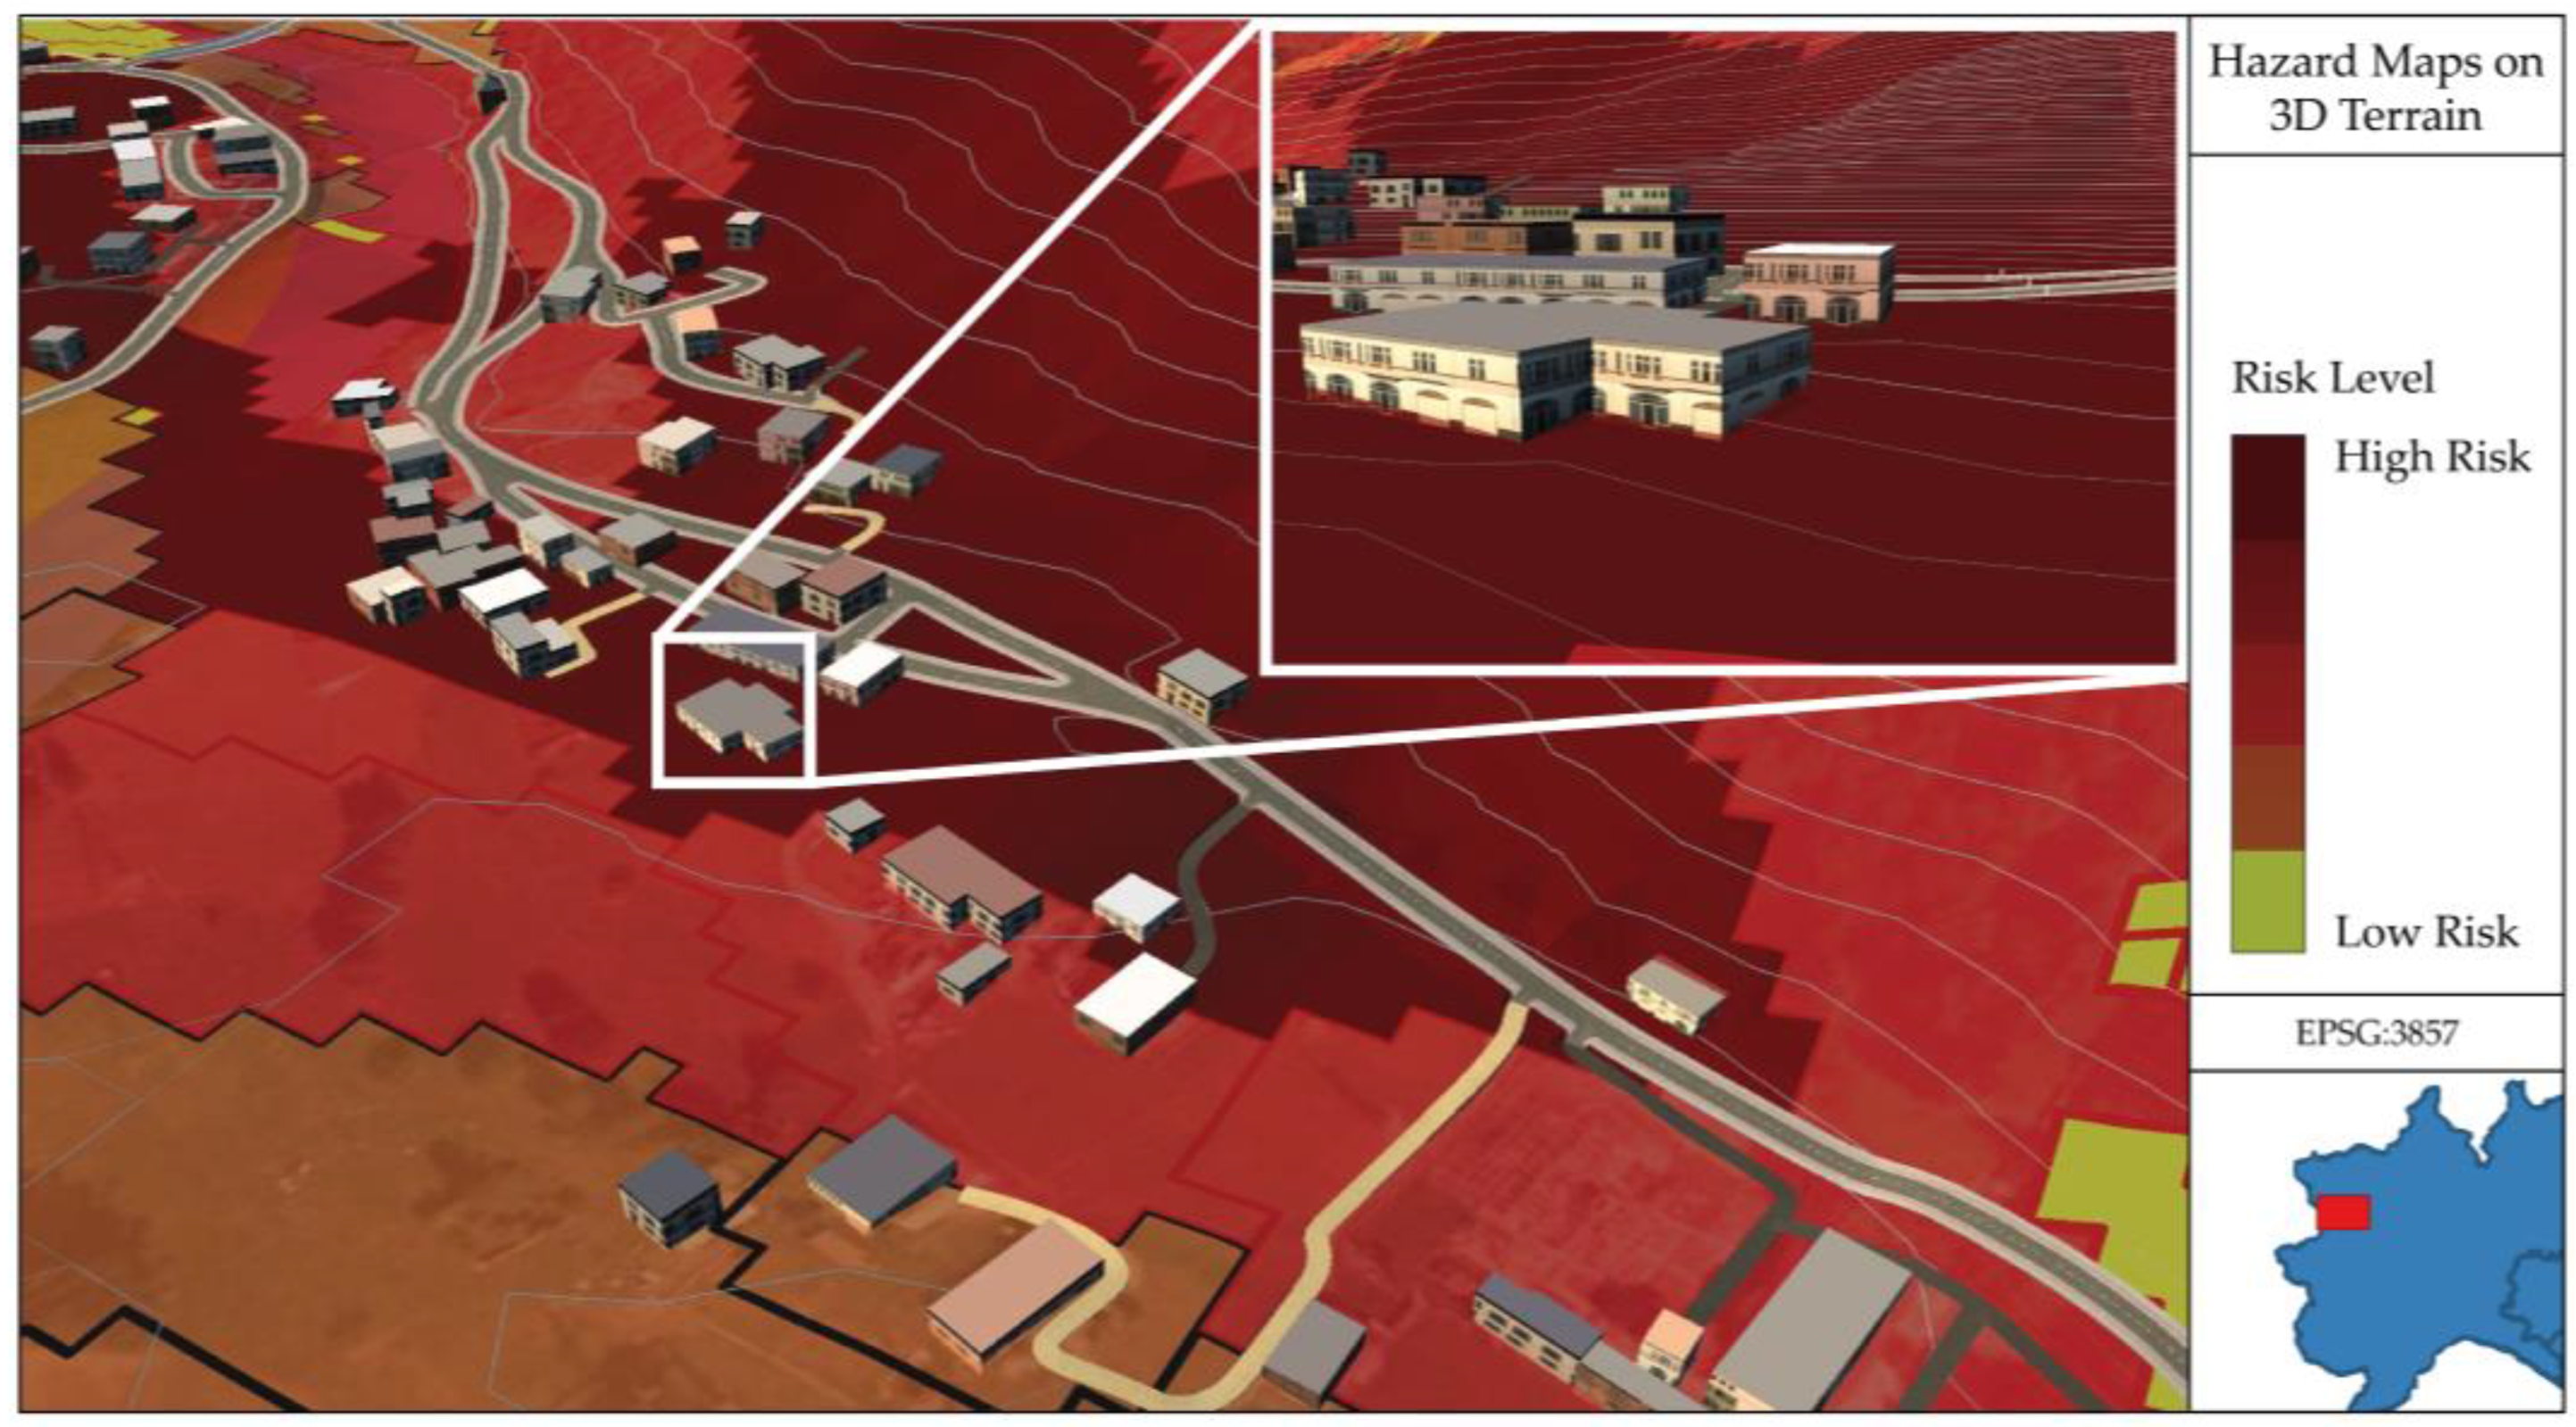
4.2. Sustainability: GIS-BIM Approach
5. Conclusions
- The identification of the most vulnerable areas and populations to natural hazards.
- The evaluation of the potential impacts and risks of different scenarios of natural hazards.
- The support for the decision-making process for disaster preparedness and mitigation.
- The enhancement of the resilience and recovery of affected populations and areas.
Author Contributions
Funding
Institutional Review Board Statement
Informed Consent Statement
Data Availability Statement
Conflicts of Interest
References
- Nord Ovest Digitale e Sostenibile. 4. Digital Innovation toward Sustainable Mountain. Available online: https://www.ecs-nodes.eu/en/4-digital-and-sustainable-mountain (accessed on 21 July 2023).
- Savi, S.; Comiti, F.; Strecker, M.R. Pronounced Increase in Slope Instability Linked to Global Warming: A Case Study from the Eastern European Alps. Earth Surf. Process. Landf. 2021, 46, 1328–1347. [Google Scholar] [CrossRef]
- Trigila, A.; Ladanza, C.; Lastoria, B.; Bussettini, M.; Barbano, A. Dissesto Idrogeologico in Italia: Pericolosità e Indicatori Di rischio-Edizione 2021. ISPRA, Rapporti 356/202. Available online: https://www.isprambiente.gov.it/files2022/pubblicazioni/rapporti/rapporto_dissesto_idrogeologico_italia_ispra_356_2021_finale_web.pdf (accessed on 21 July 2023).
- Monteleone, S.; Sabatino, M. Hydrogeological Hazards and Weather Events: Triggering and Evolution of Shallow Landslides. Int. Soil Water Conserv. Res. 2014, 2, 23–29. [Google Scholar] [CrossRef]
- Merz, B.; Kreibich, H.; Schwarze, R.; Thieken, A. Review Article “Assessment of Economic Flood Damage”. Nat. Hazards Earth Syst. Sci. 2010, 10, 1697–1724. [Google Scholar] [CrossRef]
- Dewita, Y.; Burke, M.; Yen, B.T.H. The Relationship between Transport, Housing and Urban Form: Affordability of Transport and Housing in Indonesia. Case Stud. Transp. Policy 2020, 8, 252–262. [Google Scholar] [CrossRef]
- He, Y.; Rentschler, J.; Avner, P. Mobility and Resilience: A Global Assessment of flood Impacts on Urban Road Networks. Available online: https://blogs.worldbank.org/developmenttalk/mobility-and-resilience-global-assessment-flood-impacts-urban-road-networks (accessed on 21 July 2023).
- Khallaf, R.; Khallaf, L.; Anumba, C.J.; Madubuike, O.C. Review of Digital Twins for Constructed Facilities. Buildings 2022, 12, 2029. [Google Scholar] [CrossRef]
- European Commission. Shaping Europe’s Digital Future. Available online: https://digital-strategy.ec.europa.eu/en/policies/destination-earth (accessed on 21 July 2023).
- The European Space Agency. Working towards a Digital Twin of Earth. Available online: https://www.esa.int/Applications/Observing_the_Earth/Working_towards_a_Digital_Twin_of_Earth (accessed on 21 July 2023).
- Swart, R.; Schwarze, R.; Pringle, P.; Jeuken, A.; Wolters, H. Climate Change Adaptation and Disaster Risk Reduction in Europe Enhancing Coherence of the Knowledge Base, Policies and Practices; EEA Report No 15/2017; Publications Office of the European Union: Luxembourg, 2017; p. 176. [Google Scholar]
- World Metereological Organization. Natural Hazards and Disaster Risk Reduction. Available online: https://public.wmo.int/en/our-mandate/focus-areas/natural-hazards-and-disaster-risk-reduction (accessed on 21 July 2023).
- United Nations Office for Disaster Risk Reduction. The Human Cost of Disasters: An Overview of the Last 20 Years (2000–2019). Available online: https://www.undrr.org/publication/human-cost-disasters-overview-last-20-years-2000–2019 (accessed on 21 July 2023).
- USGS Science for a Changing World. How Can Climate Change Affect Natural Disasters? Available online: https://www.usgs.gov/faqs/how-can-climate-change-affect-natural-disasters (accessed on 21 July 2023).
- UNDRR. Disaster Risk Reduction and Disaster Risk Management. Available online: https://www.preventionweb.net/understanding-disaster-risk/key-concepts/disaster-risk-reduction-disaster-risk-management (accessed on 21 July 2023).
- European Commission. DRMKC-INFORM. Available online: https://drmkc.jrc.ec.europa.eu/inform-index/INFORM-Risk/Methodology (accessed on 21 July 2023).
- Alexander, D.E. The L’Aquila Earthquake of 6 April 2009 and Italian Government Policy on Disaster Response. J. Nat. Resour. Policy Res. 2010, 2, 325–342. [Google Scholar] [CrossRef]
- Drennan, L.; McGowan, J.; Tiernan, A. Integrating Recovery within a Resilience Framework: Empirical Insights and Policy Implications from Regional Australia. Politics Gov. 2016, 4, 74–86. [Google Scholar] [CrossRef]
- House, Q.E.; Thiry, G.; Alkire, S.; Schleicher, J. Incorporating Environmental and Natural Resources within Analyses of Multidimensional Poverty. OPHI Res. Prog. 2018, 50a. Available online: https://www.ophi.org.uk/wp-content/uploads/OPHIRP50a_2.pdf (accessed on 21 July 2023).
- Rodriguez-Oreggia, E.; De La Fuente, A.; De La Torre, R.; Moreno, H.A. Natural Disasters, Human Development and Poverty at the Municipal Level in Mexico. J. Dev. Stud. 2013, 49, 442–455. [Google Scholar] [CrossRef]
- Ward, P.J.; Daniell, J.; Duncan, M.; Dunne, A.; Hananel, C.; Hochrainer-Stigler, S.; Tijssen, A.; Torresan, S.; Ciurean, R.; Gill, J.C.; et al. Invited perspectives: A research agenda towards disaster risk management pathways in multi-(hazard-)risk assessment. Nat. Hazards Earth Syst. Sci. 2022, 22, 1487–1497. [Google Scholar] [CrossRef]
- United Nation Office for Disaster Risk Reduction. Hazard. Available online: https://www.undrr.org/terminology/hazard (accessed on 21 July 2023).
- Gill, J.C.; Malamud, B.D. Hazard Interactions and Interaction Networks (Cascades) within Multi-Hazard Methodologies. Earth Syst. Dyn. 2016, 7, 659–679. [Google Scholar] [CrossRef]
- Ferreira, T.M.; Santos, P.P. An Introduction to Multi-Hazard Risk Interactions Towards Resilient and Sustainable Cities. In Multi-risk Interactions Towards Resilient and Sustainable Cities; Ferreira, T.M., Ed.; Springer: Singapore, 2023; pp. 1–14. [Google Scholar] [CrossRef]
- Kappes, M.S.; Keiler, M.; von Elverfeldt, K.; Glade, T. Challenges of Analyzing Multi-Hazard Risk: A Review. Nat. Hazards 2012, 64, 1925–1958. [Google Scholar] [CrossRef]
- Anticipation Hub. Multi-Hazard Risk Analysis Methodologies. Available online: https://www.anticipation-hub.org/news/multi-hazard-risk-analysis-methodologies (accessed on 21 July 2023).
- Skilodimou, H.D.; Bathrellos, G.D.; Chousianitis, K.; Youssef, A.M.; Pradhan, B. Multi-hazard assessment modeling via multi-criteria analysis and GIS: A case study. Environ. Earth Sci. 2019, 78, 47. [Google Scholar] [CrossRef]
- Zhou, Y.W.; Hu, Z.Z.; Lin, J.R.; Zhang, J.P. A Review on 3D Spatial Data Analytics for Building Information Models. Arch. Comput. Methods Eng. 2020, 27, 1449–1463. [Google Scholar] [CrossRef]
- Wikipedia. Orco Valley. Available online: https://en.wikipedia.org/wiki/Orco_Valley (accessed on 21 July 2023).
- Amatruda, G.; Campus, S.; Castelli, M.; Delle Piane, L.; Forlati, F.; Morelli, M.; Paro, L.; Piana, F.; Pirulli, M.; Polino, R.; et al. The Rosone Landslide. In Identification and Mitigation of Large Landslide Risks in Europe, 1st ed.; Bonnard, C., Forlati, F., Scavia, C., Eds.; CRC Press: London, UK, 2004; pp. 89–137. [Google Scholar] [CrossRef]
- Regione Piemonte. Database Statistici. Available online: https://www.regione.piemonte.it/web/amministrazione/finanza-programmazione-statistica/statistica/database-statistici (accessed on 21 July 2023).
- Gasco, I.; Gattiglio, M. Geological map of the middle Orco Valley, Western Italian Alps. J. Maps 2011, 7, 463–477. [Google Scholar] [CrossRef]
- Lollino, G.; Nigrelli, G.; Audisio, C. Bacino idrografico del Torrente Orco: Analisi integrata evento-fenomeno-danno. Quad. Di Geol. Appl. 2005, 12, 49–62. [Google Scholar]
- Automobile Club d’Italia. Available online: https://www.aci.it/i-servizi/normative/codice-della-strada/titolo-v-norme-di-comportamento/art-142-limiti-di-velocita.html (accessed on 21 July 2023).
- DatiOpen.it. Regione Piemonte. Grafo Viabilità. Available online: http://www.datiopen.it/it/opendata/Regione_Piemonte_Grafo_viabilit_ (accessed on 21 July 2023).
- Istituto Nazionale di Statistica. Confini Delle Unità Amministrative a Fini Statistici al 1° Gennaio 2023. Available online: https://www.istat.it/it/archivio/222527 (accessed on 21 July 2023).
- Istituto Superiore per la Protezione e la Ricerca Ambientale. Open Data. Available online: https://idrogeo.isprambiente.it/app/page/open-data (accessed on 21 July 2023).
- Geoportale Nazionale. Available online: http://www.pcn.minambiente.it/mattm/ (accessed on 21 July 2023).
- QGIS. QGIS Python Plugins Repository. QuickOSM. Available online: https://plugins.qgis.org/plugins/QuickOSM/ (accessed on 21 July 2023).
- European Union. Data.Europa.Eu-The Official Portal for European Data. Available online: https://data.europa.eu/en (accessed on 21 July 2023).
- Regione Piemonte. Geoportale Piemonte. Available online: https://www.geoportale.piemonte.it/cms/ (accessed on 21 July 2023).
- Copernicus Land Monitoring Service. CORINE Land Cover. Available online: https://land.copernicus.eu/pan-european/corine-land-cover (accessed on 21 July 2023).
- Natural Hazard Risk Assessment User Guide. Regional Policy Statement for the Bay of Plenty. Ngā Tikanga Whakahaere I Ngā Rawa o Te Taiao. Available online: https://www.boprc.govt.nz/media/579449/natural-hazard-risk-assessment-user-guide-web_final.pdf (accessed on 21 July 2023).
- Ward, P.J.; Blauhut, V.; Bloemendaal, N.; Daniell, E.J.; De Ruiter, C.M.; Duncan, J.M.; Emberson, R.; Jenkins, F.S.; Kirschbaum, D.; Kunz, M.; et al. Review Article: Natural Hazard Risk Assessments at the Global Scale. Nat. Hazards Earth Syst. Sci. 2020, 20, 1069–1096. [Google Scholar] [CrossRef]
- Ientile, S.; Schmidt, F.; Chevalier, C.; Orcesi, A.; Adelaide, L.; Nedjar, B. Road network analysis for risk and resilience assessment framework of road infrastructure systems. In Proceedings of the Risk Analysis XII, WIT Transactions on Engineering Sciences 12th International Conference on Risk Analysis and Hazard Mitigation, Lisbonne, Portugal, 23–25 June 2020; WIT Press: Southampton, UK, 2020; Volume 129, pp. 197–206. [Google Scholar] [CrossRef]
- QGIS. Available online: https://www.qgis.org/en/site/ (accessed on 21 July 2023).
- QNEAT3. Available online: https://root676.github.io/ (accessed on 21 July 2023).
- Ferlisi, S.; Marchese, A.; Peduto, D. Quantitative Analysis of the Risk to Road Networks Exposed to Slow-Moving Landslides: A Case Study in the Campania Region (Southern Italy). Landslides 2021, 18, 303–319. [Google Scholar] [CrossRef]
- Zhang, H.; Wang, R.; Wang, C. Monitoring and Warning for Digital Twin-Driven Mountain Geological Disaster. In Proceedings of the 2019 IEEE International Conference on Mechatronics and Automation (ICMA), Tianjin, China, 4–7 August 2019; IEEE: New York, NY, USA, 2019; pp. 502–507. [Google Scholar] [CrossRef]
- Arpa Piemonte. Accesso Ai Dati «Annali Meteorologici Ed Idrologici» Banca Dati Meteorologica. Available online: https://www.arpa.piemonte.it/rischinaturali/accesso-ai-dati/annali_meteoidrologici/annali-meteo-idro/banca-dati-meteorologica.html (accessed on 21 July 2023).
- Autodesk. InfraWorks. Available online: https://www.autodesk.com/products/infraworks/overview?term=1-YEAR&tab=subscription (accessed on 21 July 2023).
- Italian Government. Ministry of Economy and Finance. The National Recovery and Resilience Plan (NRRP). Available online: https://www.mef.gov.it/en/focus/The-National-Recovery-and-Resilience-Plan-NRRP/ (accessed on 21 July 2023).
- European Commission. NextGenerationEU. Available online: https://commission.europa.eu/strategy-and-policy/eu-budget/eu-borrower-investor-relations/nextgenerationeu_en (accessed on 21 July 2023).


| Type | Source | Format | Details |
|---|---|---|---|
| Population | Piedmont Statistical Database | Tabular | Population statistics by commune [31] |
| Road network | ACI—Speed limit data | Vector | Road network map with speed limits by road type [34,35] |
| Commune boundaries | ISTAT—Administrative boundary data | Tabular | Commune boundary polygons with codes [36] |
| Hazard maps | ISPRA Open data—Hazard data | Raster | Hazard maps for landslides and floods [37] |
| Points of interest (POIs) | National Geoportal—Public and private school dataset; Piedmont Geoportal—Healthcare building data; Piemonte Open Data Portal—Additional data sources; OpenStreetMap—QuickOSM | Vector | Points of interest for health facilities, public facilities, town centers, and tourism facilities [38,39,40,41] |
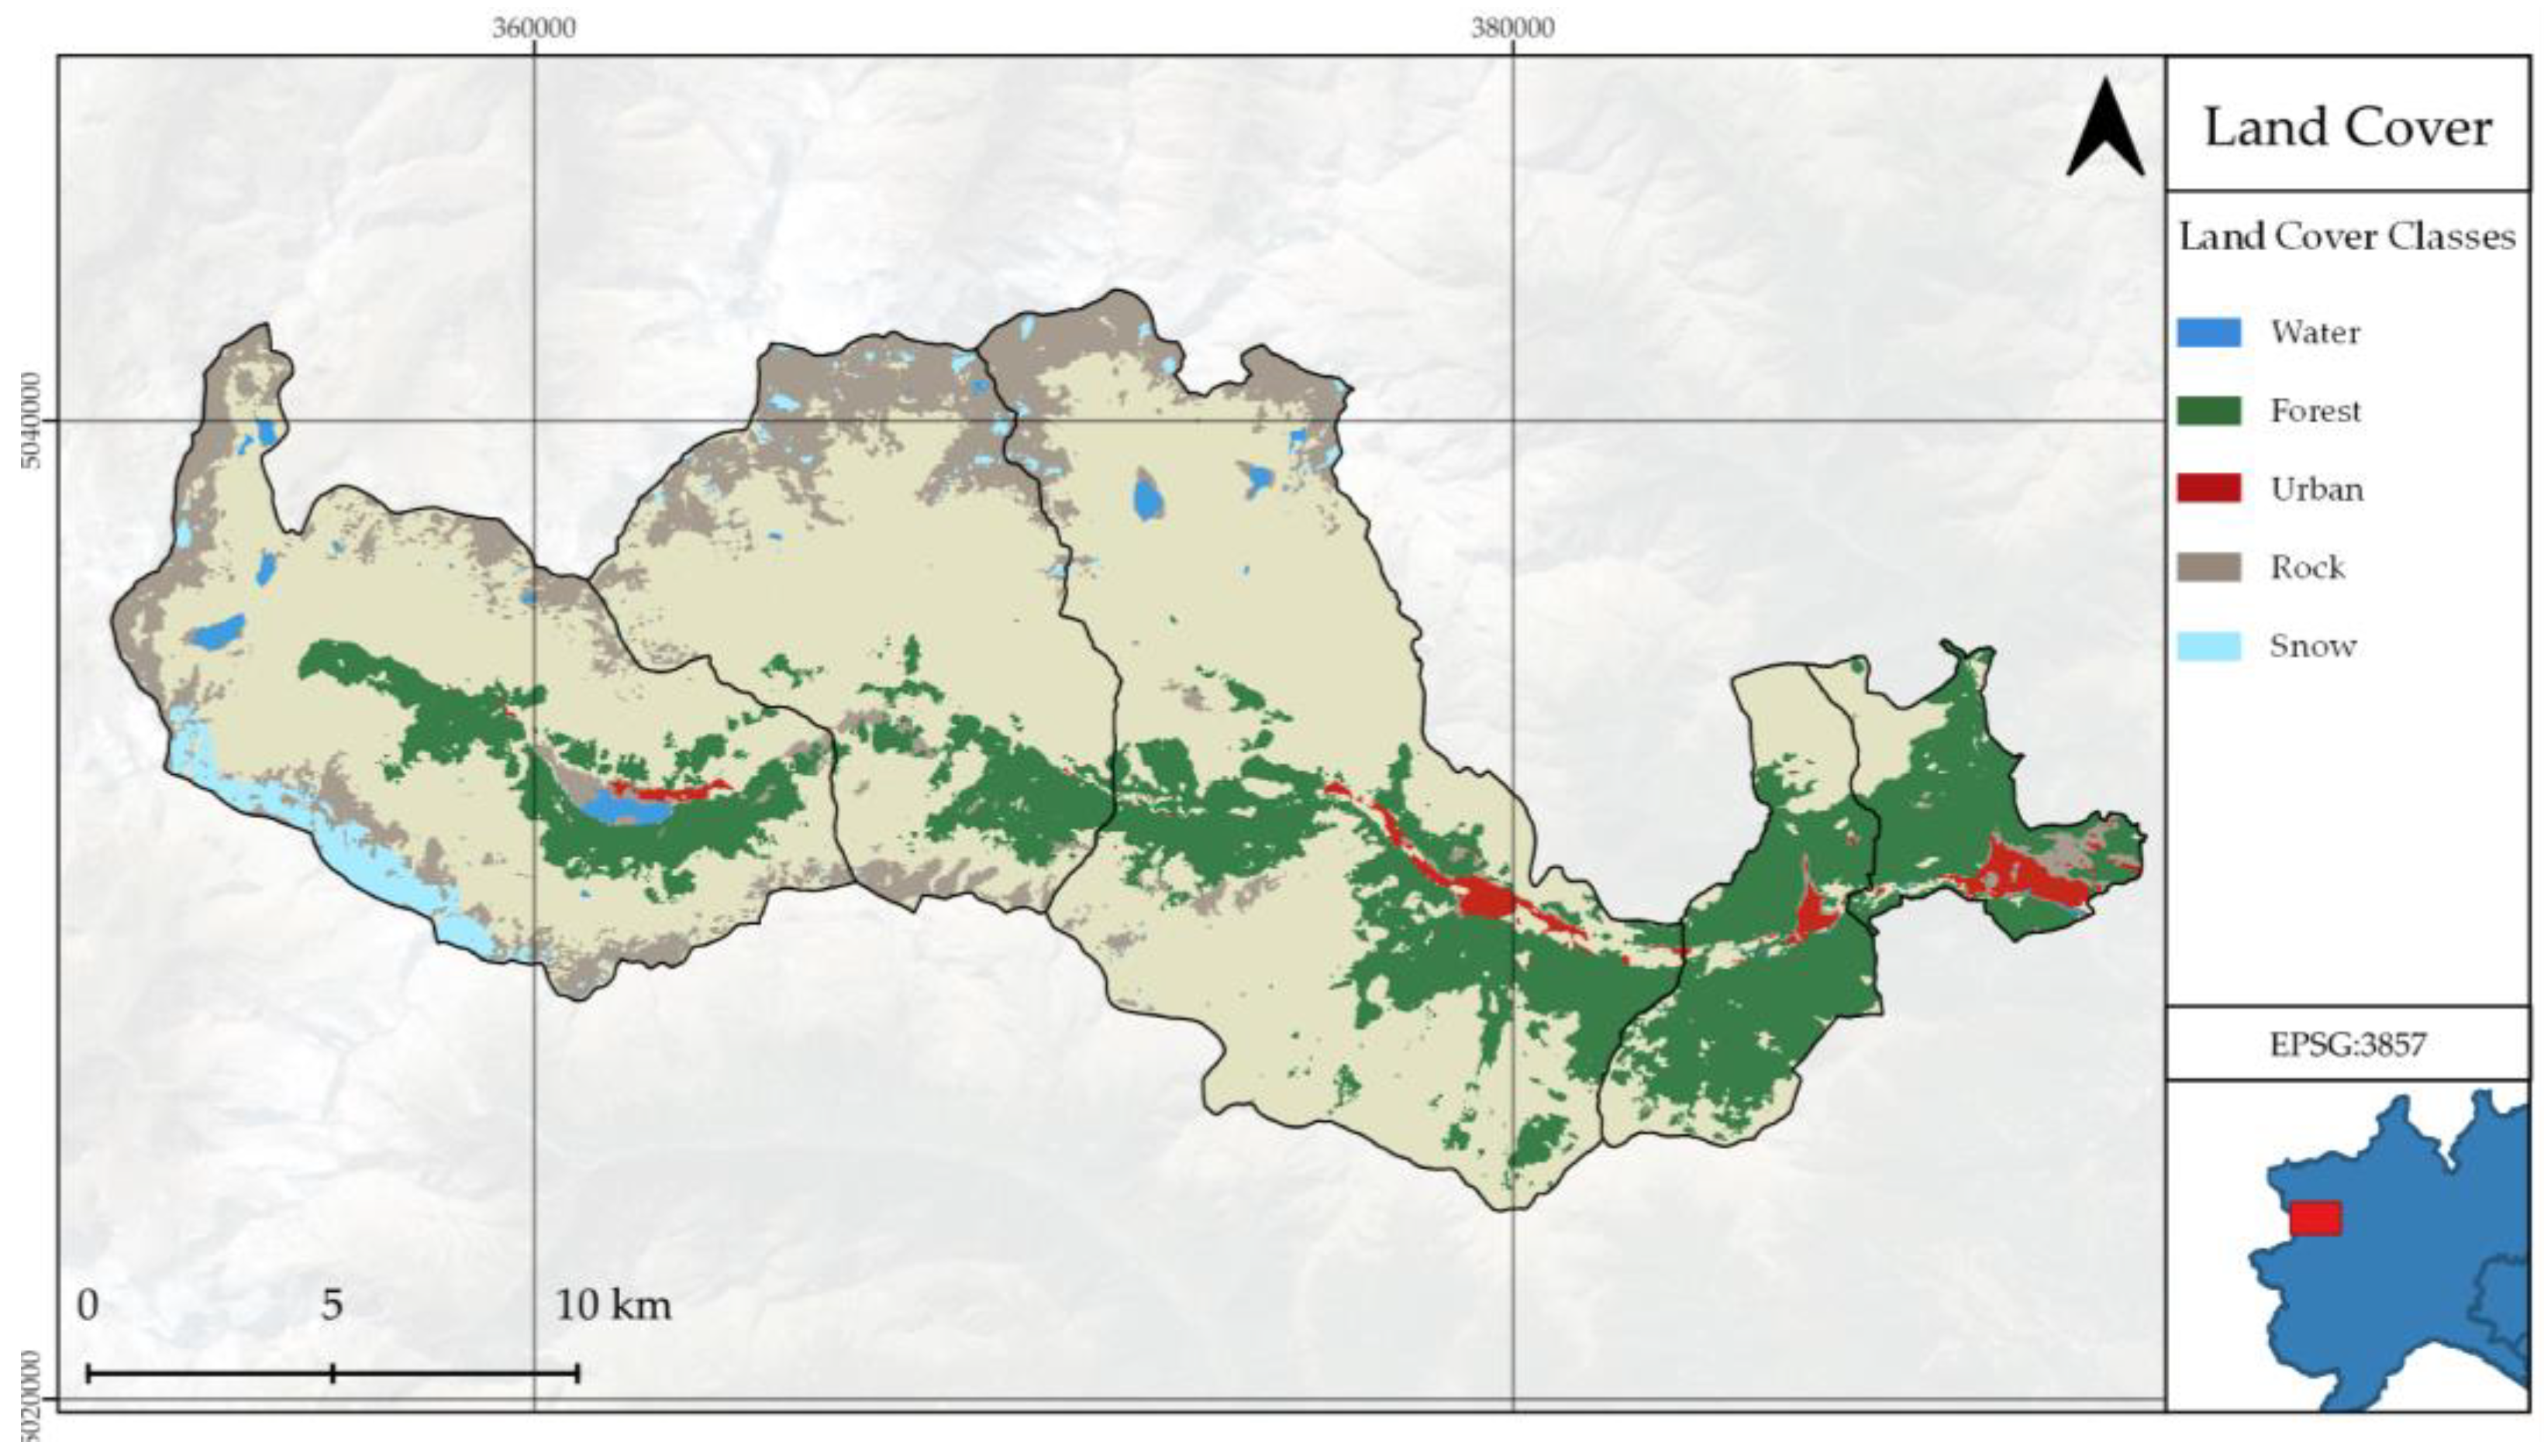
| Land use and land cover (LULC) | Copernicus Land Monitoring Service—CORINE Land Cover (CLC) | Raster | Land use and land cover map [42] |
| Monetary values | Literature review | Tabular | Monetary values for different types of assets [43,44] |
| Point of Interest | Consequence (C) |
|---|---|
| Health facility | 1.6–2.0 |
| Public facility | 1.4–1.6 |
| Town center | 1.2–1.4 |
| Tourism facility | 1–1.4 |
| Land Use/Land Cover Type | LULC (L) |
|---|---|
| Water | 1 |
| Forest | 0.8 |
| Urban | 1.4 |
| Rock | 1 |
| Snow | 0.6 |
| Hazard Type | Return Period (years) | Probability (P) |
|---|---|---|
| Landslide | 10 | 0.5 |
| Landslide | 50 | 1 |
| Landslide | 100 | 1.5 |
| Flood | 10 | 0.6 |
| Flood | 50 | 1.1 |
| Flood | 100 | 1.4 |
Disclaimer/Publisher’s Note: The statements, opinions and data contained in all publications are solely those of the individual author(s) and contributor(s) and not of MDPI and/or the editor(s). MDPI and/or the editor(s) disclaim responsibility for any injury to people or property resulting from any ideas, methods, instructions or products referred to in the content. |
© 2023 by the authors. Licensee MDPI, Basel, Switzerland. This article is an open access article distributed under the terms and conditions of the Creative Commons Attribution (CC BY) license (https://creativecommons.org/licenses/by/4.0/).
Share and Cite
Ugliotti, F.M.; Osello, A.; Daud, M.; Yilmaz, O.O. Enhancing Risk Analysis toward a Landscape Digital Twin Framework: A Multi-Hazard Approach in the Context of a Socio-Economic Perspective. Sustainability 2023, 15, 12429. https://doi.org/10.3390/su151612429
Ugliotti FM, Osello A, Daud M, Yilmaz OO. Enhancing Risk Analysis toward a Landscape Digital Twin Framework: A Multi-Hazard Approach in the Context of a Socio-Economic Perspective. Sustainability. 2023; 15(16):12429. https://doi.org/10.3390/su151612429
Chicago/Turabian StyleUgliotti, Francesca Maria, Anna Osello, Muhammad Daud, and Ozan Onur Yilmaz. 2023. "Enhancing Risk Analysis toward a Landscape Digital Twin Framework: A Multi-Hazard Approach in the Context of a Socio-Economic Perspective" Sustainability 15, no. 16: 12429. https://doi.org/10.3390/su151612429
APA StyleUgliotti, F. M., Osello, A., Daud, M., & Yilmaz, O. O. (2023). Enhancing Risk Analysis toward a Landscape Digital Twin Framework: A Multi-Hazard Approach in the Context of a Socio-Economic Perspective. Sustainability, 15(16), 12429. https://doi.org/10.3390/su151612429