Article

Optimization of Branch Airflow Volume for Mine Ventilation Network Based on Sensitivity Matrix

1
School of Civil and Resource Engineering, University of Science and Technology Beijing, Beijing 100083, China
2
Anhui Mine IOT and Security Monitoring Technology Key Laboratory, Hefei 230088, China
3
Sanshandao Gold Mine, Shandong Gold Group Mining (Laizhou) Co., Ltd., Yantai 261417, China
*
Author to whom correspondence should be addressed.
Sustainability 2023, 15(16), 12427; https://doi.org/10.3390/su151612427
Submission received: 5 July 2023 / Revised: 8 August 2023 / Accepted: 15 August 2023 / Published: 16 August 2023
(This article belongs to the Special Issue Advances in Intelligent and Sustainable Mining)

Abstract

:
Underground mines have gradually entered the stage of deep mining with the consumption of shallow mineral resources, which makes mine ventilation networks generally complicated and the problem of unstable supply of branch airflow volume in deep-level ventilation networks increasingly serious. The scientific distribution of the airflow volume between operation areas has become an important problem in the optimization of mine ventilation systems. This study takes the ventilation system of the Xinli Submine of Sanshandao Gold Mine as an example to analyze the airflow volume regulation demand of the deep-level section stope to further improve the coordination of the airflow volume distribution in the underground mine. The drawing and equivalent simplification of the ventilation network diagram are completed according to the engineering parameters of the target level roadway, and the sensitivity matrix is calculated using a formula. The optimization of the adjustment branch and the formulation of the adjustment scheme are carried out based on the sensitivity matrix. By realizing the adjustment objective of the branch airflow volume via comparing the airflow volume of the ventilation network before and after adjustment, the adjustment scheme can make the airflow volume distribution in the level more balanced. The results of our study show that branch sensitivity theory is theoretically feasible for analyzing and solving the problem of the mine ventilation network, which has certain practical significance for the adjustment of airflow volume in mines.

1. Introduction

Larger-scale mine ventilation networks have been built to meet the needs of underground ventilation as ore mining enters the deep mining stage, which also makes the complex characteristics of the mine ventilation system more prominent, and the location changes of the underground workplace and the mutual connection increase the uncertainty of the effect of ventilation to a certain extent [1,2]. Ensuring the coordination of airflow supply between underground regions is particularly important for the stable operation of mine ventilation systems. In actual production, the analysis and formulation of airflow volume adjustment schemes between underground regions are more based on human experience, in which scientific rationality and the final adjustment effect will be limited [3,4]. Therefore, improving the feasibility and rationality of ventilation regulation schemes using more theoretical analysis methods is one of the key problems of mine ventilation system optimization [5,6].
Substantial research on iterative algorithms, optimization models, and computational fluid dynamics has been carried out on the regulation and optimization of mine ventilation networks [7,8,9,10]. W. Nyaaba [11] presented a method of mine ventilation network optimization using the Lagrangian algorithm. The problem was then converted to a nonlinear problem with equality constraints. Xu [12] proposed a simple and effective calibration method based on a nonlinear optimization algorithm to solve the problem wherein the simulation results of the mine ventilation network model do not match the measured data. In order to improve the calculation efficiency of the nonlinear optimization model, Yu [13] proposed an improved equilibrium optimization algorithm to solve the nonlinear optimization model to minimize the total energy consumption of ventilation, which has a reference value for the construction of mine energy conservation and emission reduction. The experimental analysis of the algorithm showed that the convergence speed and accuracy are better than those of other algorithms. In order to obtain results meeting the production requirements, more conditions should be considered in the model. Li [14] discussed the basic principle of ventilation network optimization, established a multi-objective optimization model from the total cost perspective, and proposed an optimization algorithm based on airflow asymptotic calculation.
In recent years, heuristic algorithms have been widely applied to solve the nonlinear problem in ventilation network calculation. An Adaptive Neural Fuzzy Interface System (ANFIS) and genetic algorithm (GA) were proposed to predict the energy consumption and airflow of ventilation systems for underground mines. The hybrid ANFIS-GA model revealed an adequate improvement in precision compared to other models [15]. Wang [16] used the heat flow method and artificial neural network to model a deep mine ventilation system in metal mines and proposed an iterative algorithm combined with the stope model, which guided energy saving and consumption reduction in the deep mine ventilation system.
Scholars have continuously improved and refined the iterative algorithm and optimization model of ventilation networks through extensive research [17]. This has led to a more comprehensive theoretical analysis method for optimizing ventilation networks, as well as the development and promotion of mine ventilation simulation software [18,19,20,21]. With the advancements in theoretical research, certain ventilation network optimization methods have been applied and validated in real mines [22,23,24,25].
In order to save energy, ventilation network optimization has been treated as a problem of calculating the shortest path. Wang [26] studied the path method based on graph theory and optimized and improved the path algorithm using the path search algorithm, path calculation formula, fan path identification, and regulator optimization. Jia [27] proposed a ventilation network feature-map-drawing algorithm based on an independent path method and embedded improved adaptive genetic algorithm, which is of great significance to ventilation system optimization and daily management. However, relying solely on minimizing energy consumption does not effectively address the problem of large fluctuations in air volume during the control process. This can result in confusion and failure of the ventilation system. Therefore, some scholars have presented ventilation network optimization models that consider wind resistance. Hao [28] proposed the concept of sensitivity change rate, quantitatively analyzed the variation law of roadway air volume sensitivity to roadway wind resistance, and established a ventilation network air volume scheduling calculation model. Waclaw Dziurzynski [29] developed a formula for determining the sensitivity of the airflow volume by establishing the dependency degree of the airflow volume in each area on the variations in the resistance or air density of other areas of the network.
These research efforts have provided us with a greater comprehension of the ventilation parameters of roadways and networks within these mine ventilation systems. However, the stability of a mine ventilation system is determined by the relationships between each branch and other branches. It is necessary to have a comprehensive, macroscopic view of the ventilation system. Jia [30] expounded on the concepts of target branch, active branch, and passive branch and proposed a regulation algorithm based on sensitivity theory, which provided theoretical guidance for mine ventilation regulation. M. Bascompta [31] provided multiple solutions for a case study coal mine based on the cause analysis of air disorder problems in drifts and shafts in a multilevel and complex diagonal ventilation system. Therefore, selecting the optimal adjustment branch or ventilation structure arrangement position can minimize the number of adjustment branches, significantly decrease ventilation resistance and pressure loss during air circulation, and enhance the efficiency of mine roadway network ventilation while meeting the required airflow volume regulation.
This study takes the Xinli Submine of the Sanshandao Gold Mine as the research object. The analysis and selection of the adjustment branch are carried out based on fluid network sensitivity matrix theory, aiming to meet the demand for airflow volume distribution adjustment in the deep level of the mine, and the airflow volume adjustment scheme of the roadway is formulated. The effect of the scheme and the feasibility of the sensitivity theory for the airflow volume adjustment of the mine roadway is tested by considering the technical indicators and the adjustment effect.

2. Case Analysis and Optimization Process Construction

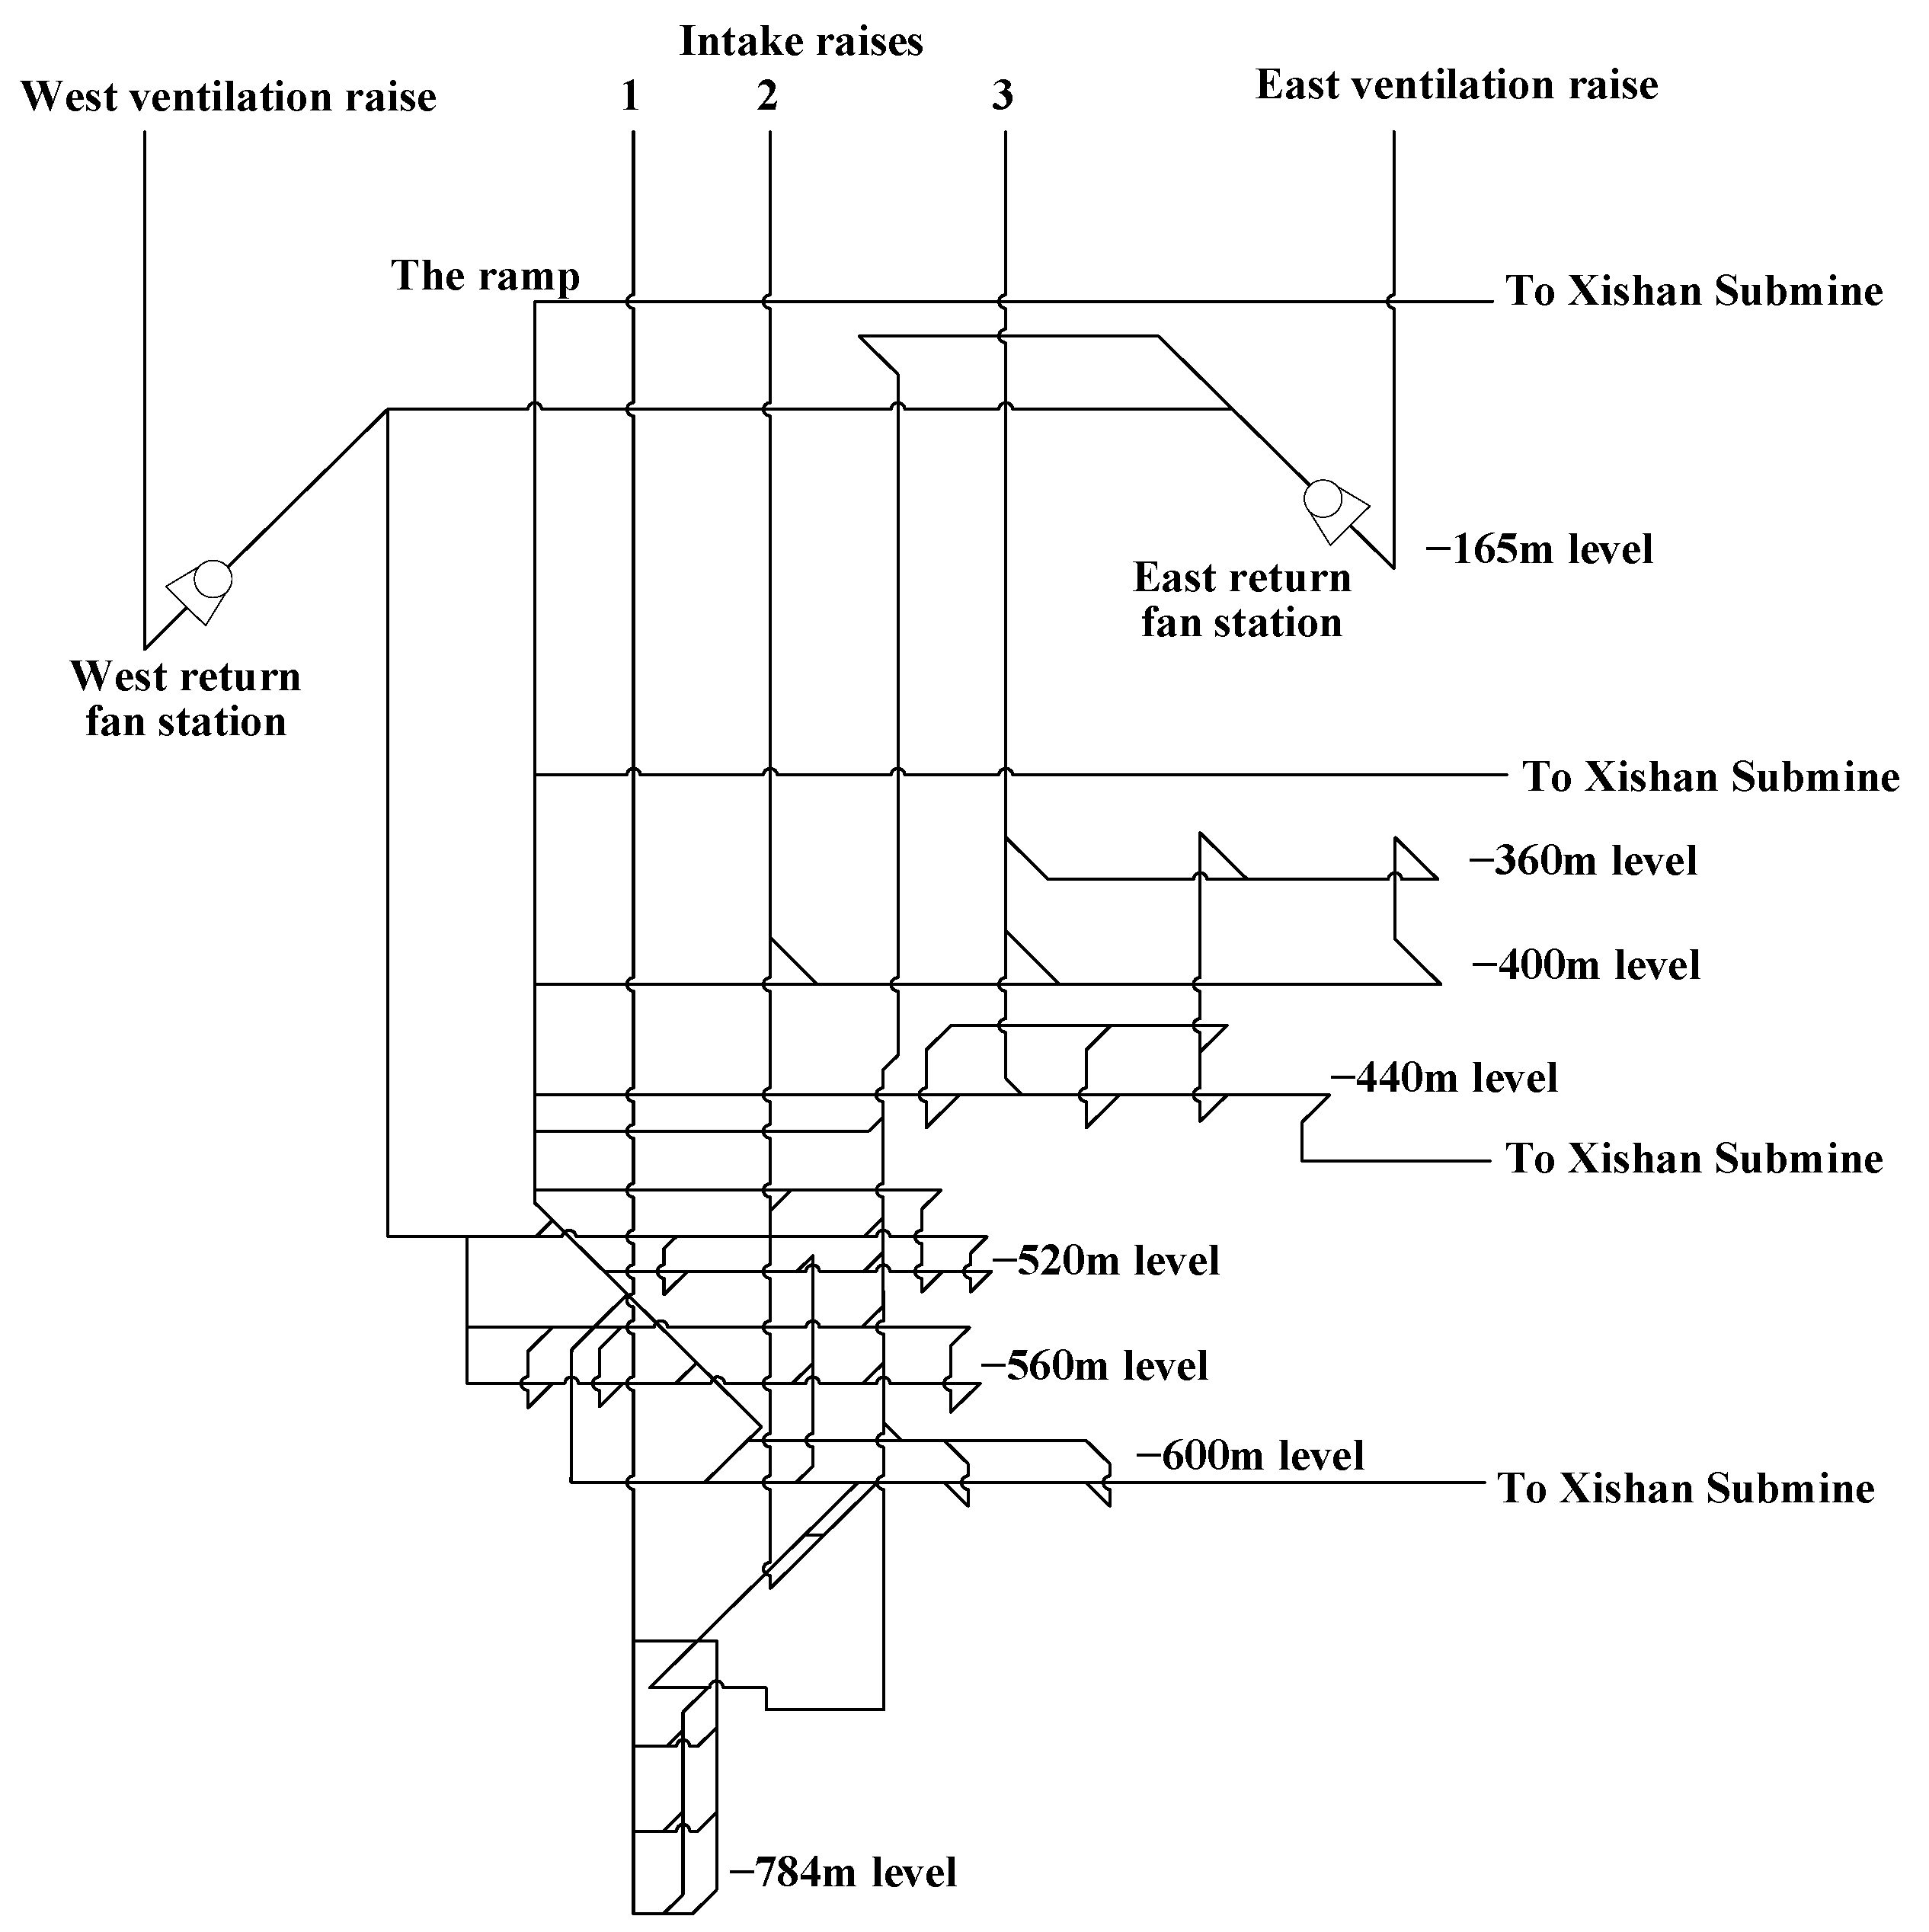
2.1. Case Mine Ventilation System Overview

The ventilation network structure of the Xinli Submine of Sanshandao Gold Mine is such that the central air shafts bring the air in, and the east and west air shafts return to the air. Figure 1 illustrates the ventilation system’s configuration. Fresh air is introduced into the mine via intake raises 1, 2, and 3. This air is subsequently directed to the stopes through the drifts present on each level. The exhausted air primarily travels through the ventilation raises until it reaches the −165 m level. From here, it is channeled to the east and west ventilation raises before being ultimately released into the atmosphere. The total air intake in the mine is 383.15 m3·s−1, and the air intake at each level is shown in Table 1.
According to the data of Table 1, about 52.7% of the fresh airflow reaches the −600 m level first and then enters the other level stope and working face through the ventilation roadway. Therefore, the −600 m level is an important part of the ventilation system of the Xinli Submine and is also the focus of ventilation optimization. The 3D ventilation model of the Xinli Submine was constructed with Ventsim (the model error is within the allowable range of Ventsim), and the data reporting tool of Ventsim was used to further analyze the airflow volume distribution of the roadway in the −600 m level under the current ventilation scheme. The simulation result is shown in Figure 2.
According to Figure 1, the airflow volume of each stope at the −600 m level of Xinli Submine can basically meet the demand under the current ventilation conditions, but there is a problem wherein the airflow volume in the concentrated area of the stope is slightly lower than that in other areas of the level. In other words, it is necessary to optimize the airflow volume distribution of the roadway in the −600 m level of Xinli Submine.
In summary, the −600 m level of Xinli Submine is one of the main underground production levels in the mine, and it is also an important part of the ventilation system in the mine. There is an inevitable fluctuation in the airflow supply in the concentrated area of the stope due to the influence of the ventilation environment, equipment, and other factors. It will have a certain impact on the stope production when this fluctuation is large. Thus, it is necessary to analyze and optimize the airflow volume distribution in the deep level of Xinli Submine and formulate the adjustment scheme to ensure the satisfactory ventilation environment of the stope and the safety of production operation.

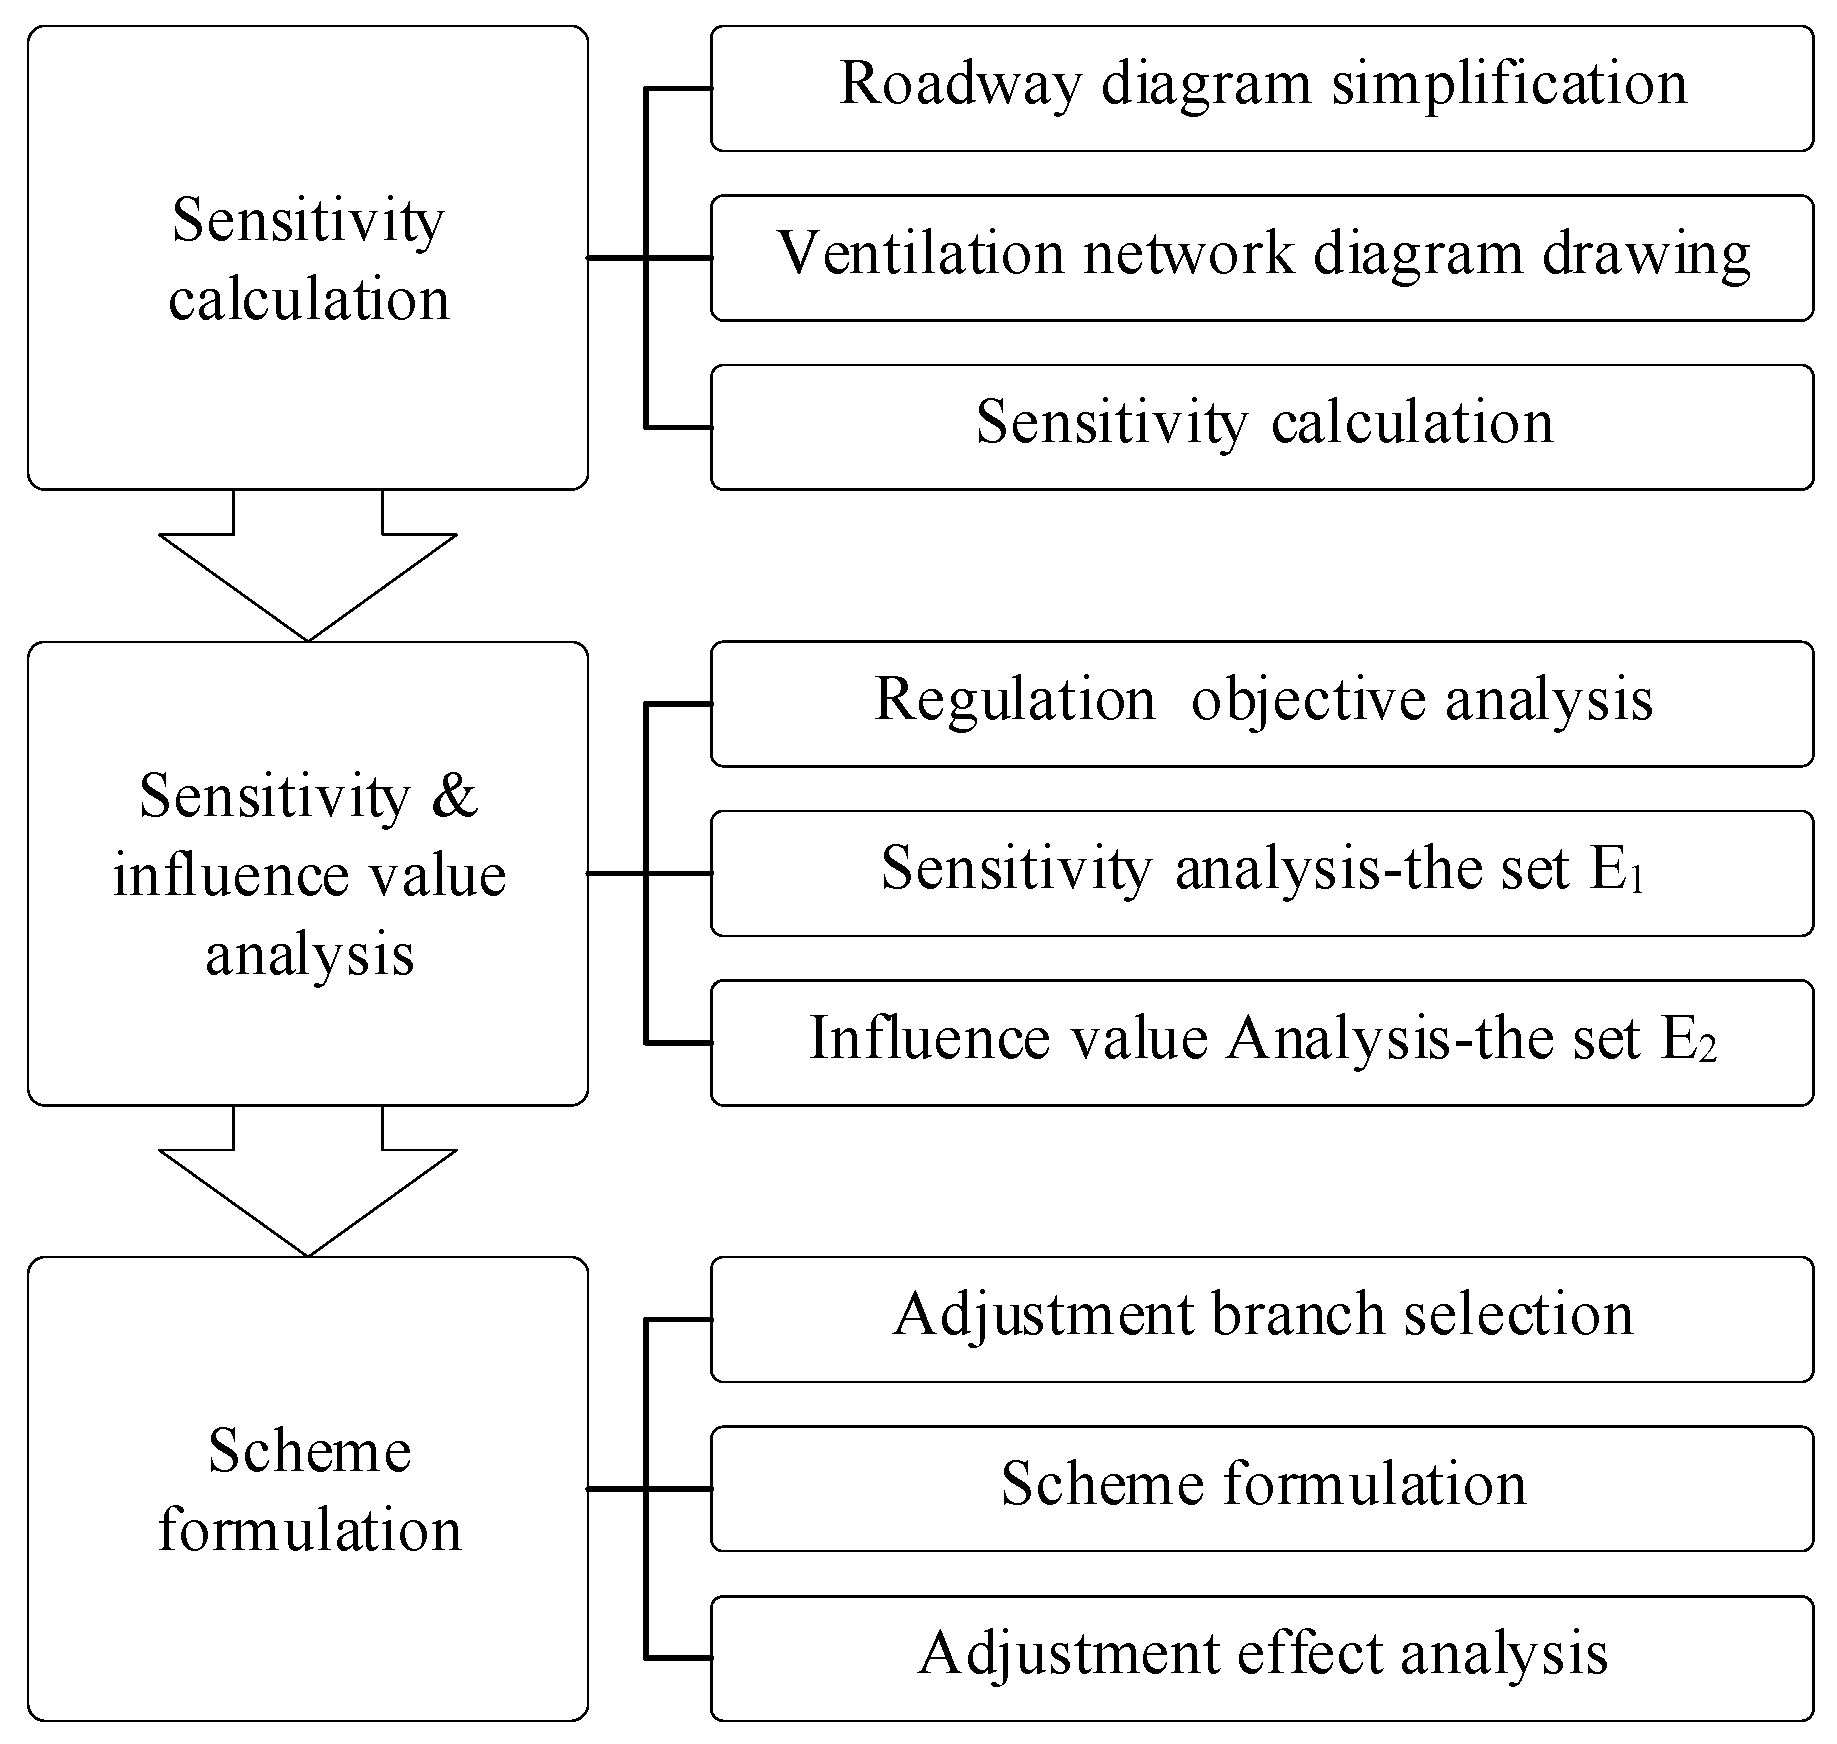
2.2. Optimization Analysis Process Construction

The −600 m level ventilation network is idealized as a fluid network based on the theory of fluid network according to the demand for optimal adjustment of air volume distribution. The optimal adjustment branch is selected through the analysis of branch sensitivity to enhance the theoretical value and optimize the effect of the adjustment scheme. The optimization analysis process is shown in Figure 3, and the analysis steps are as follows.
(1)
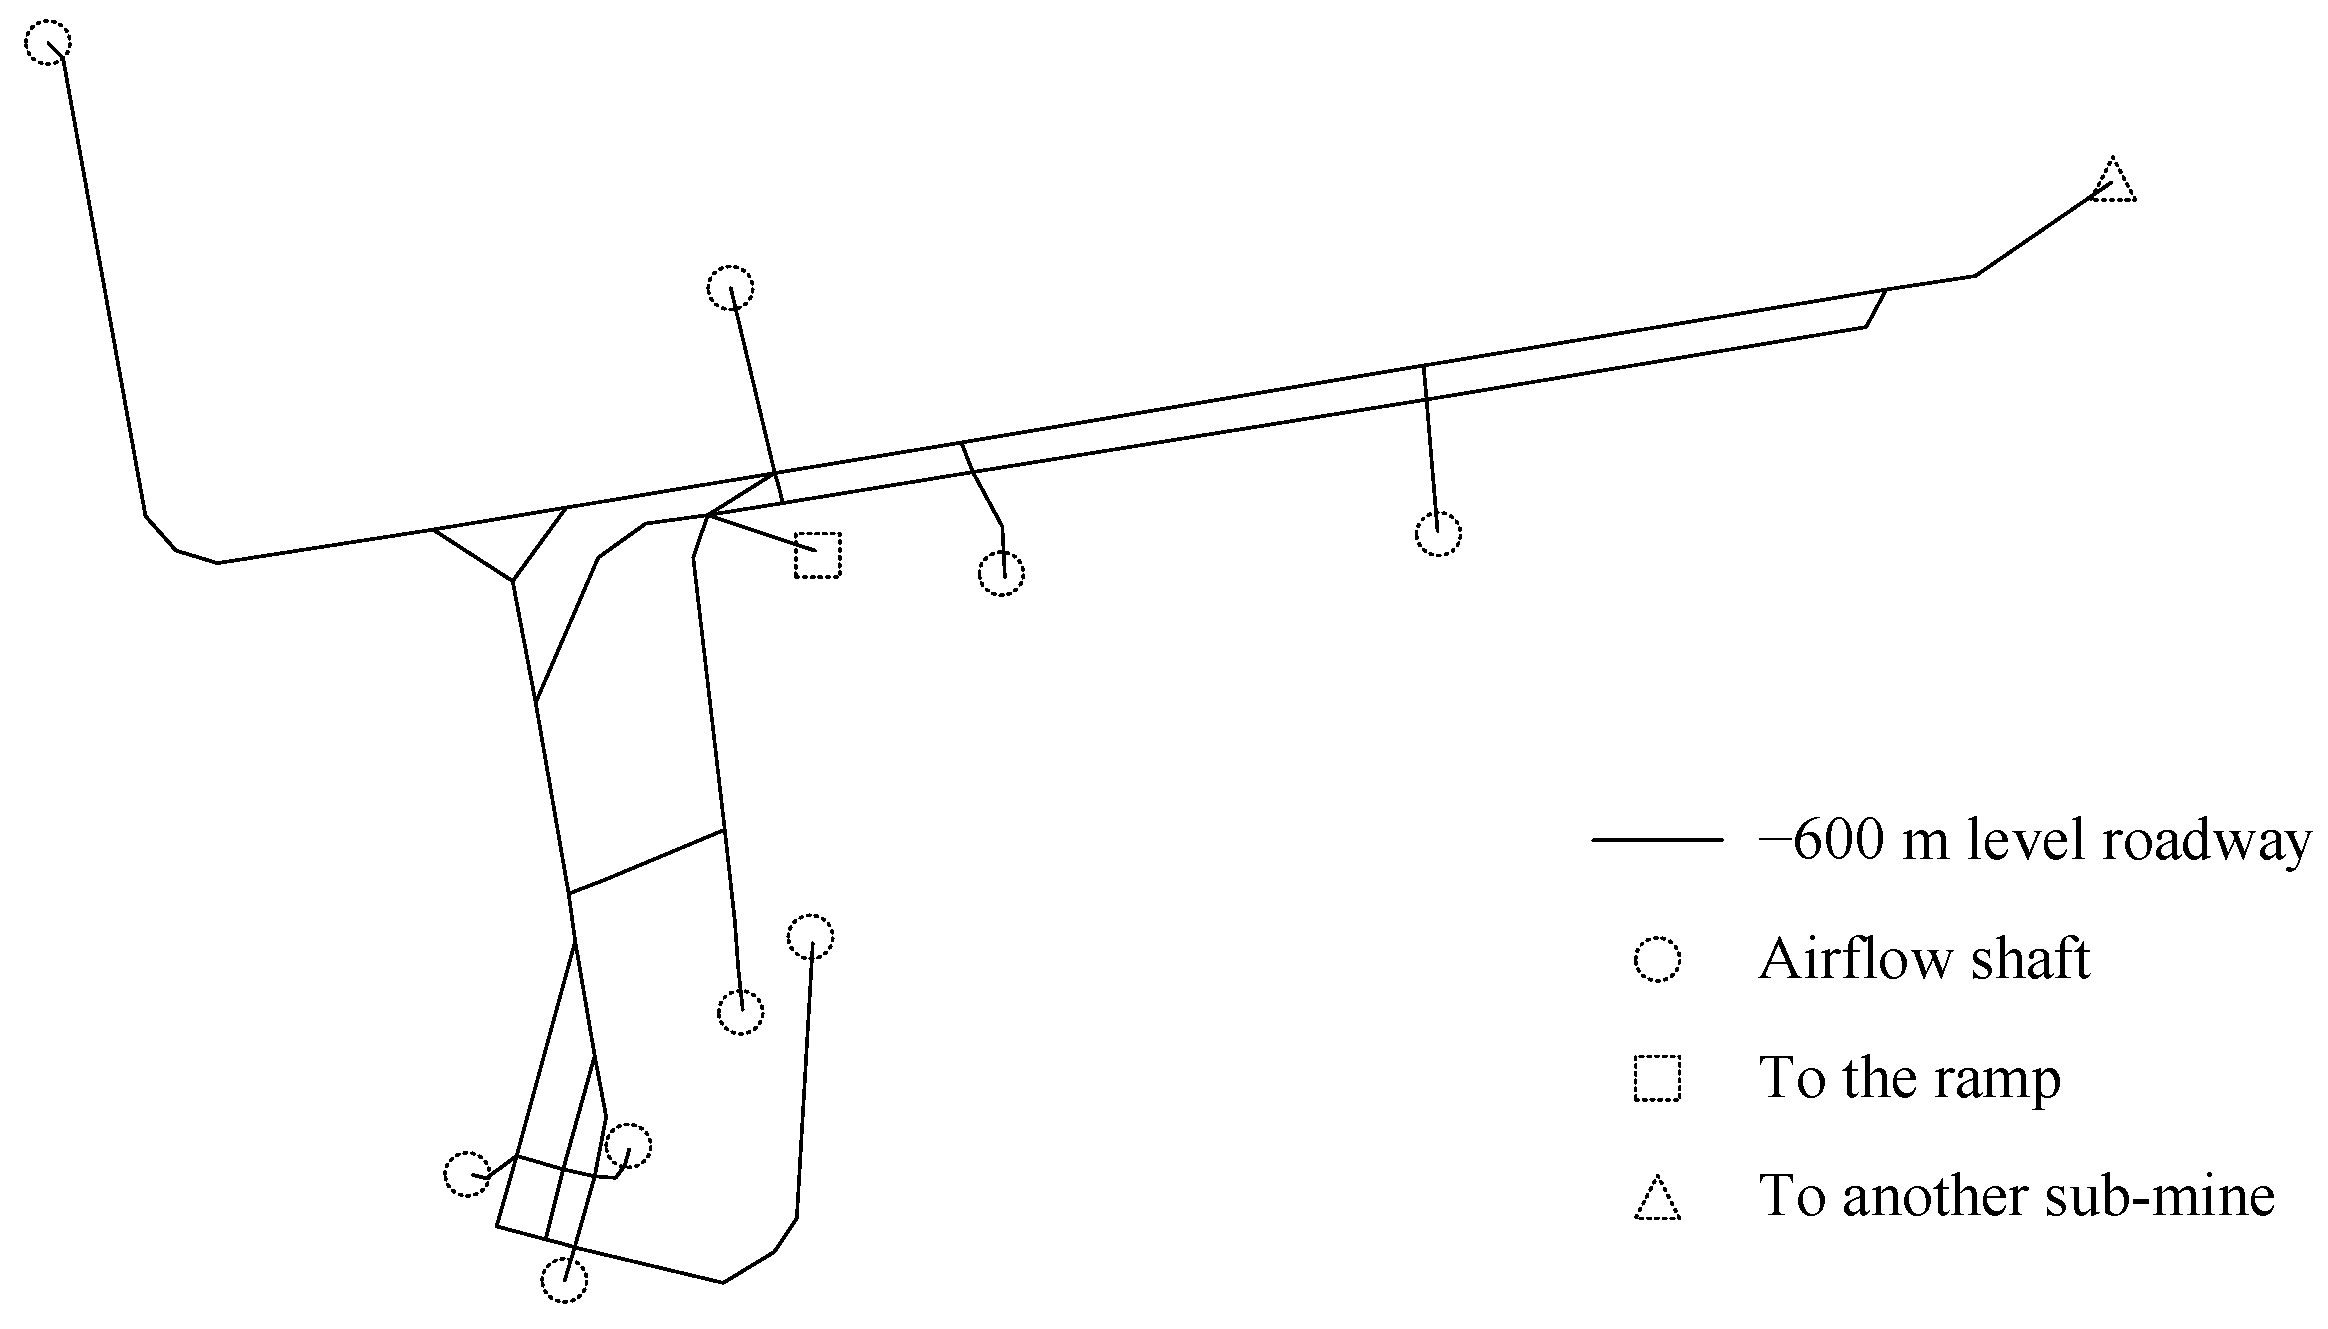
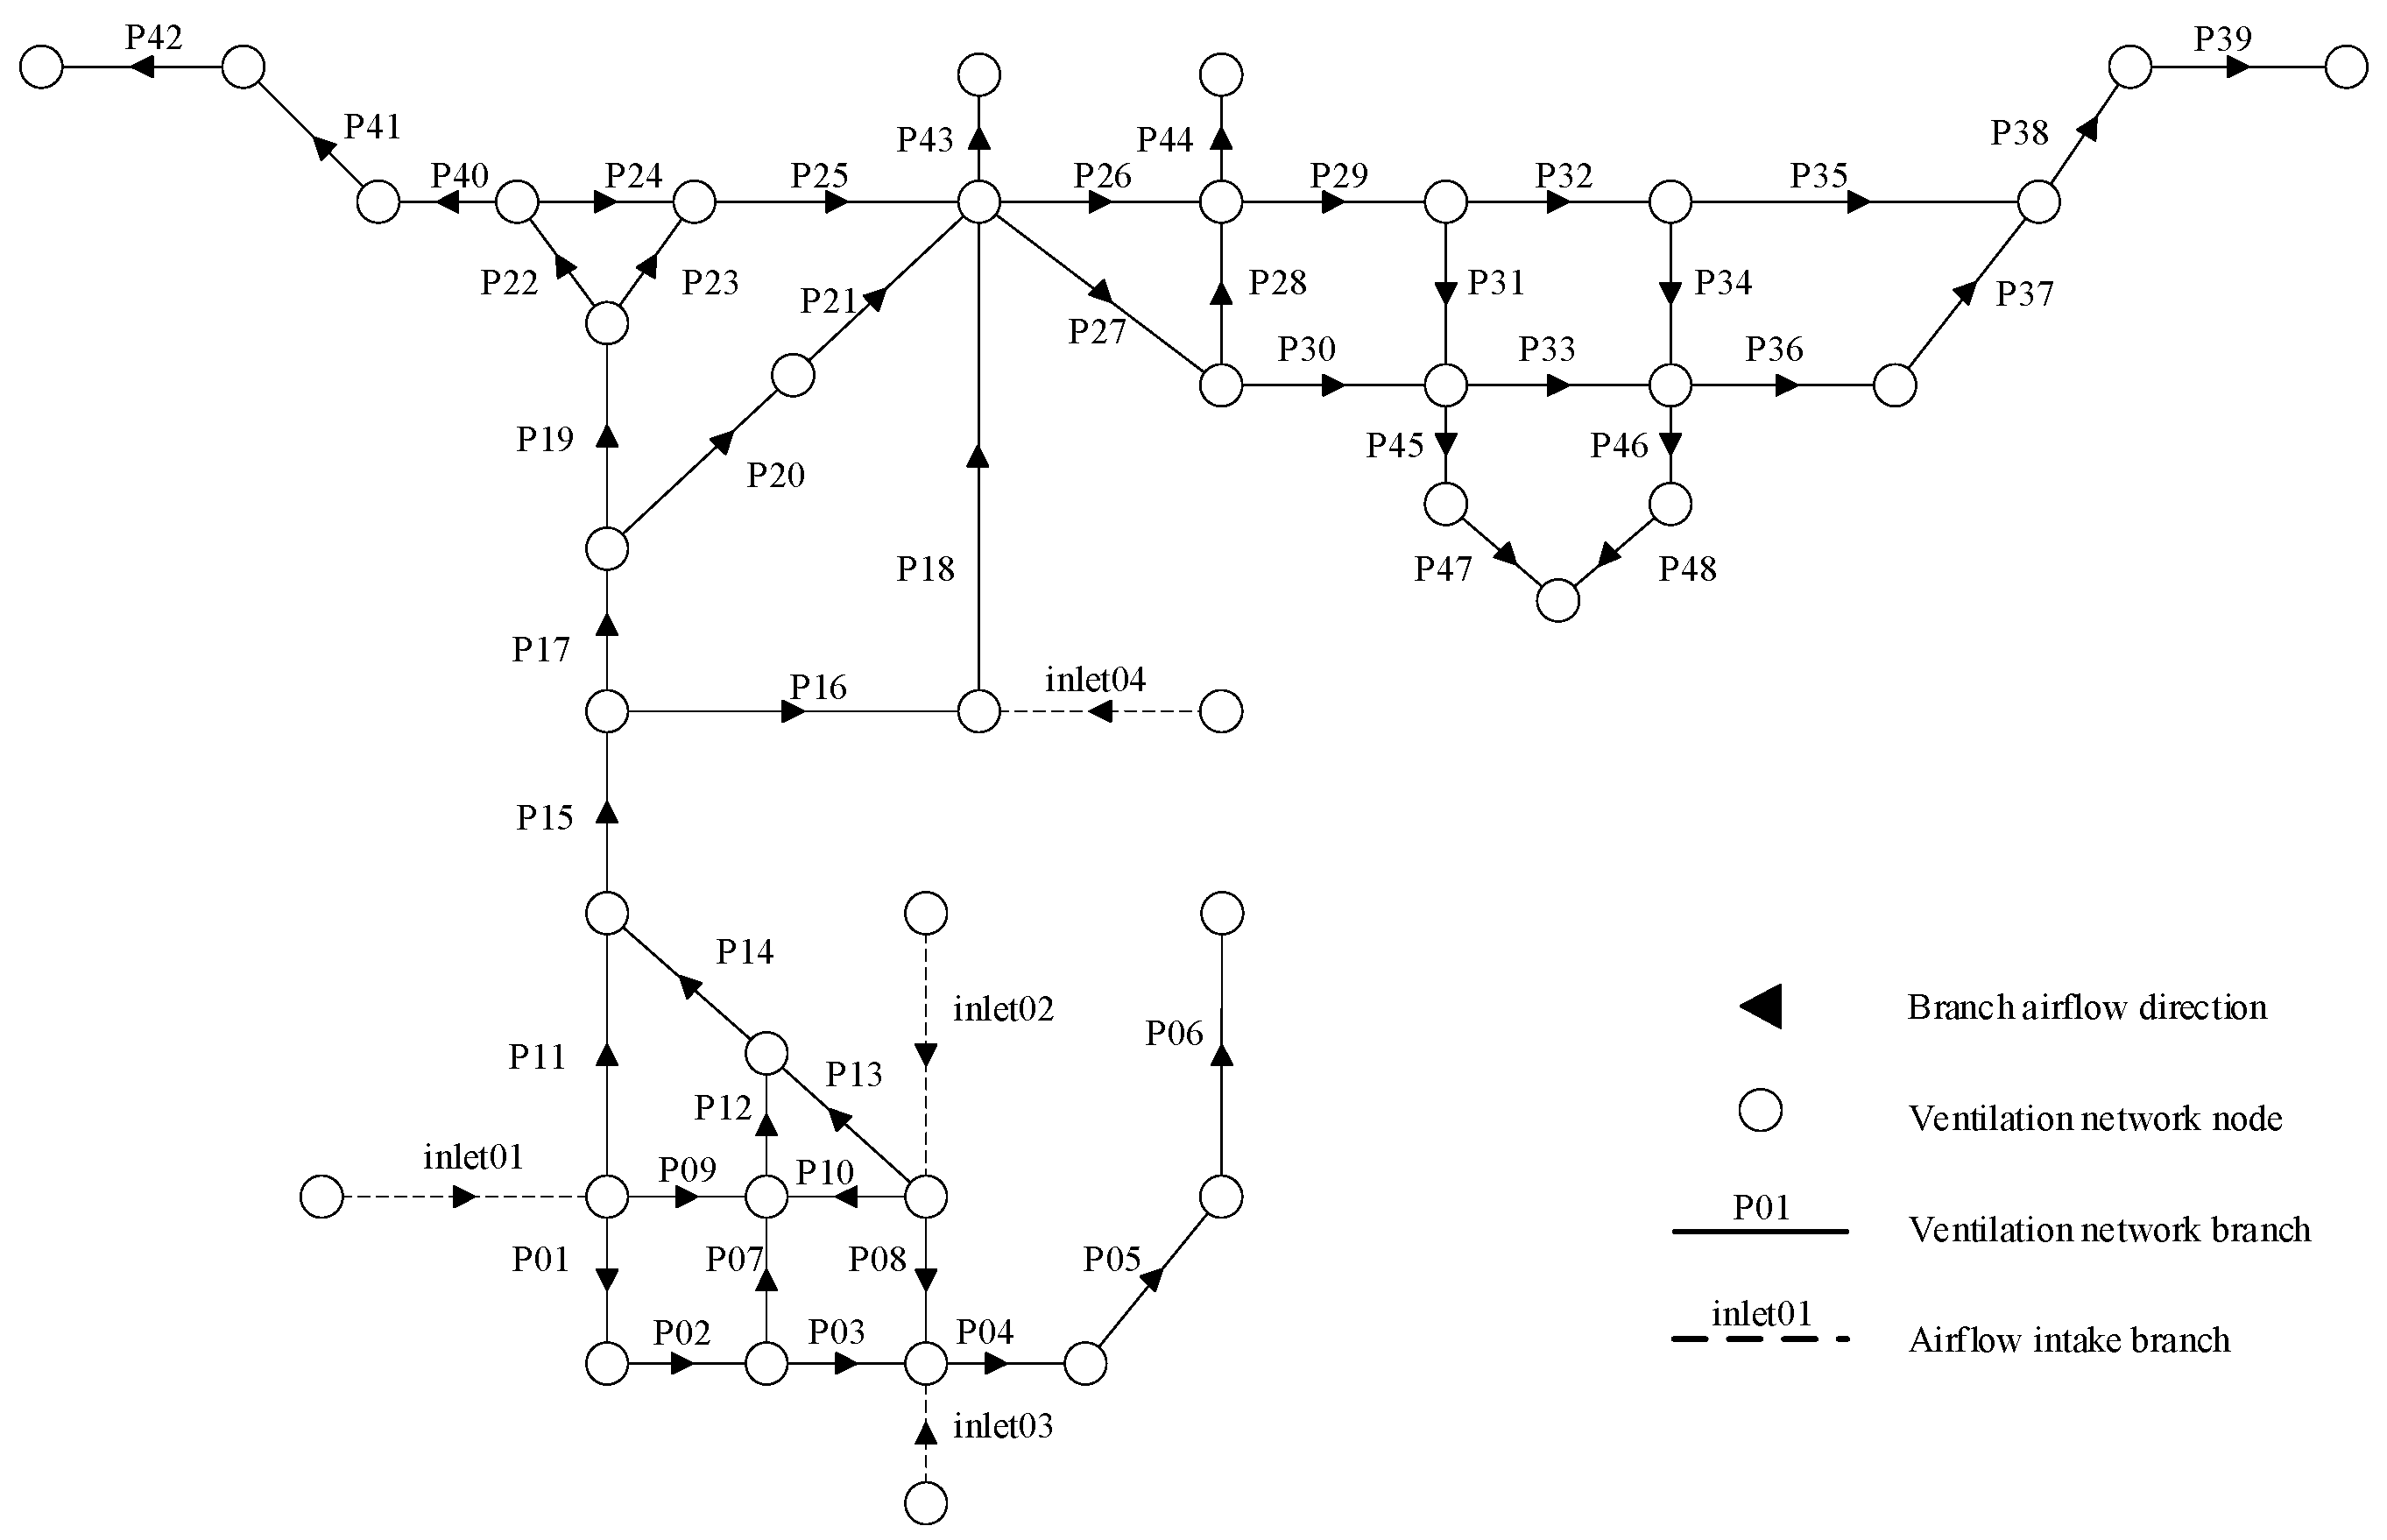
The ventilation network diagram of the −600 m level is drawn according to the main branches, nodes, airflow direction, and branch ventilation resistance in the ventilation roadway diagram of the −600 m level. Additionally, the sensitivity matrix D and influence matrix U of branches are calculated.
(2)
The airflow volume in the −600 m level to be adjusted to branch i is determined. According to the airflow volume adjustment demand of branch i, the resistance increase adjustment and resistance reduction adjustment are analyzed in turn. The branch sensitivity analysis of element dij in the i-th row of matrix D is carried out, and the corresponding branch j is arranged in descending order to obtain set E1. Branch j is arranged in ascending order according to the influence value Uj to obtain set E2. The front branches of sets E1 and E2 are selected as the preferred adjustment branches.
(3)
The ventilation resistance adjustment method is determined by analyzing the adjustment effect and engineering benefit, and the adjustment scheme of the roadway is formulated. The scheme is simulated to test the adjustment effect of the scheme with Ventsim.

3. Sensitivity Matrix Analysis and Scheme Formulation

3.1. Ventilation Network Sensitivity Matrix Calculation

The calculation amount and difficulty will increase significantly, and the calculation process will become relatively complex if the −600 m level plane diagram is directly used to calculate the branch sensitivity, considering that the ventilation network structure of the −600 m level in Xinli Submine is relatively complex, and the amount of data of actual engineering parameters such as roadway branches and nodes is relatively large. Therefore, it is necessary to simplify the ventilation network structure diagram appropriately to facilitate the study. The plane diagram of the −600 m level of the mining area (as shown in Figure 4) is idealized as a fluid network diagram according to the actual parameters of Xinli Submine, and the ventilation network structure is shown in Figure 5.
Composite simplification is used to perform fuzzy simplification and equivalent simplification in turn for Figure 5:
(1)
Fuzzy simplification
The branch with small pressure loss (<10 Pa) in the ventilation network diagram (Figure 4) of the −600 m level of Xinli Submine is simplified as a node.
(2)
Equivalent simplification
The series and parallel branches in the ventilation network diagram are simplified after completing the fuzzy simplification. That is, multiple merge simplifications are performed according to the simplification principle of series and parallel branches until the simplification requirements are met or the simplification cannot be furthered.
The formula for calculating the equivalent ventilation resistance after simplifying the series branches is as follows:
R s = R 1 + R 2 + + R n = i = 1 n R i
where Rs is the equivalent ventilation resistance of the simplified series branch, N·s2·m−8; and Ri is the ventilation resistance of branch i before simplification, N·s2·m−8.
The equivalent ventilation resistance calculation formula for the simplified parallel branches is as follows:
R p = 1 ( 1 R 1 + 1 R 2 + + 1 R n ) 2
where Rp is the equivalent ventilation resistance of the simplified parallel branch, N·s2·m−8; and Rn is the ventilation resistance of the branch before simplification, N·s2·m−8.
Finally, the simplified structure diagram of the −600 m level ventilation network is obtained, as shown in Figure 6, and the branch parameters are shown in Table 2.
The iterative operation of the sensitivity matrix of the ventilation network is carried out based on the theory of branch sensitivity of fluid network, and the construction of an iterative sequence d i j ( k ) (k = 0, 1, 2, …) is completed. That is, a minimal change d r j ( k ) is added to the ventilation resistance rj of branch j when the k th iteration is carried out, assuming that the airflow volume of branch I changes from q i ( k 1 ) to q i ( k ) . Thus, the iterative formula of sensitivity d i j ( k ) is as follows:
d i j ( k ) = q i ( k ) q i ( k 1 ) r j ( k ) r j ( k 1 ) = q i ( k ) q i ( k 1 ) d r j ( k )
where d i j ( k ) is the sensitivity of branch i airflow volume to branch j ventilation resistance change in the k th iteration; q i ( k ) and q i ( k 1 ) are the airflow volume of branch i in the kth and k − 1 th iterations; r j ( k ) and r j ( k 1 ) are the ventilation resistance of branch j in the kth and k − 1 th iteration; d r j ( k ) is the ventilation resistance variation of branch j in the kth and k − 1 th iterations; and dr(k)j = r j ( k ) r j ( k 1 ) = d r j ( k 1 ) /ω, ω is the acceleration factor, ω = 10.
It is worth noting that the airflow volume distribution in the ventilation network will also be affected when the ventilation resistance of branch j changes. Therefore, it is necessary to combine the influence value formula to analyze the influence value of branch j in the process of theoretical analysis:
U j = i = 1 n | d i j |
where Uj is the influence value of branch j’s ventilation resistance change on the ventilation network, and dij is the sensitivity of airflow volume of branch i to the change in the ventilation resistance of branch j.
The airflow volume distribution simulation (considering the air leakage of the roadway) was carried out with Ventsim, and the branch sensitivity matrix D and the influence value matrix U were obtained via iterative operation.
D = [ 11.7987 23.5974 542.7396 0 200.5777 47.1947 47.1947 94.3895 0 0 9.4389 0.2360 23.5974 0 0 0 11.7987 35.3961 542.7396 0 200.5777 23.5974 0 94.3895 0 0 9.4389 0 23.5974 0 0 0 11.7987 35.3961 542.7396 0 200.5777 47.1947 47.1947 106.1882 0 0 18.8779 23.5974 47.1947 9.4389 0 0 0 11.7987 212.3764 188.7790 2005.7767 1274.2581 519.1422 235.9737 0 0 75.5116 47.1947 70.7921 9.4389 0 0 0 11.7987 330.3632 188.7790 2218.1530 1250.6607 566.3369 129.7855 0 0 84.9505 47.1947 47.1947 9.4389 0 0 0 11.7987 212.3764 188.7790 2005.7767 1250.6607 566.3369 235.9737 0 0 75.5116 47.1947 47.1947 0 0 0 0 11.7987 212.3764 141.5842 1675.4134 1227.0634 1038.2844 530.9409 47.1947 0 198.2179 117.9869 117.9869 9.4389 0 0 0 11.7987 259.5711 47.1947 212.3764 23.5974 330.3632 2961.4702 188.7790 23.5974 169.9011 778.7133 684.3238 47.1947 5.2439 0 0 11.7987 94.3895 0 82.5908 23.5974 141.5842 1156.2713 802.3107 47.1947 66.0726 283.1685 1533.8292 217.0985 10.4877 0 0 0 47.1947 0 23.5974 0 47.1947 401.1553 283.1685 117.9869 28.3168 117.9869 542.7396 358.6801 36.7070 0 0 0 141.5842 0 542.7396 0 424.7527 660.7264 47.1947 0 292.6074 141.5842 141.5842 9.4389 0 0 0 11.7987 165.1816 0 129.7855 23.5974 188.7790 2194.5556 141.5842 0 103.8284 943.8949 519.1422 37.7558 31.4632 0 0 11.7987 141.5842 0 129.7855 0 141.5842 1805.1990 613.5317 23.5974 113.2674 495.5448 2218.1530 169.9011 10.4877 11.7987 0 0 70.7921 0 47.1947 0 47.1947 731.5185 471.9474 94.3895 47.1947 212.3764 991.0896 566.3369 31.4632 11.7987 0 0 47.1947 47.1947 11.7987 0 0 247.7724 188.7790 70.7921 18.8779 70.7921 330.3632 217.0958 141.5842 11.7987 0 0 23.5974 0 11.7987 0 0 153.3829 94.3895 47.1947 9.4389 47.1947 235.9737 141.5842 104.8772 35.3961 ]
U = [ 35.40 188.78 3586.80 802.31 9698.52 5191.42 4105.94 11739.69 2878.88 424.75 1321.45 3374.42 7574.76 1802.84 372.31 70.79 ]
It can be clearly seen in the branch sensitivity matrix D that the airflow distribution of other branches in the ventilation network will be affected and changed when the ventilation resistance of any branch of P03, P05, P08, P11, and P13 changes. The ventilation resistance changes in branches P01 and P16 have relatively little effect on other branches in the ventilation network. It can be concluded from the influence matrix U that the branch P08’s influence value (U8 = 11,739.69) is the maximum value of the ventilation network, and branch P01’s influence value (U1 = 35.40) is the minimum value. In other words, the ventilation resistance change in branch P08 has the greatest influence on the ventilation network, and the ventilation resistance change in branch P01 has the least influence on the ventilation network.

3.2. Sensitivity Matrix Analysis

The airflow volume adjustment measures of the −600 m level are analyzed based on the engineering data of Xinli Submine and the branch sensitivity matrix. The airflow volume in the concentrated area of the −600 m level of Xinli Submine is slightly lower than that in other areas of the same level under the current ventilation conditions according to the analysis results of the ventilation system in Xinli Submine, which needs to be optimized and adjusted. Therefore, it is necessary to increase the airflow volume in the area to ensure a better ventilation environment in the concentrated area of the stope. In other words, branch P09 in Figure 5 must increase the airflow volume. The optimal adjustment branch is analyzed by combining the sensitivity matrix D and the influence matrix U.
(1)
Adjust the airflow volume by increasing the ventilation resistance
Branch sensitivity analysis: The resistance-increasing branch is selected according to the branch sensitivity matrix. The ninth-row data in the sensitivity matrix D are selected for analysis because of the objective of increasing the airflow volume of branch P09. d9j = [0, 11.7987, −94.3895, 0, 82.5908, −23.5974, −141.5842, −1156.2713, −802.3107, −47.1947, 66.0726, 283.1685, 1533.8292, −217.0985, −10.4877, 0]. The elements greater than 0 in d9j and the corresponding branches are selected and arranged in descending order according to the sensitivity weight, that is, P13, P12, P05, P11, and P02.
Branch influence value analysis: The influence value of the above branches is selected according to the branch influence value matrix U. Ua = [188.75, 9698.52, 1321.45, 3374.42, 7574.76]. Five branches are arranged in ascending order of influence value, that is, P2, P11, P12, P13, and P5.
The branch that is first in the two groups of ranking results is selected as the optimal branch for branch P09 to increase airflow volume based on the above sensitivity ranking and influence value ranking. That is, branch P12 is selected to increase resistance adjustment.
(2)
Adjust the airflow volume by decreasing the ventilation resistance
Branch sensitivity analysis: The resistance-decreasing branch is selected according to the branch sensitivity matrix. The ninth-row data in the sensitivity matrix D are selected for analysis because of the objective of increasing the airflow volume of branch P09. d9j = [0, 11.7987, −94.3895, 0, 82.5908, −23.5974, −141.5842, −1156.2713, −802.3107, −47.1947, 66.0726, 283.1685, 1533.8292, −217.0985, −10.4877, 0]. The elements less than 0 in d9j and the corresponding branches are selected and arranged in descending order according to the sensitivity weight, that is, P08, P09, P14, P07, P03, P10, P06, and P15.
Branch influence value analysis: The influence value of the above branches is selected according to the branch influence value matrix U. Ub = [3586.80, 5191.42, 4105.42, 11,739.69, 2878.88, 424.75, 1802.84, 372.31]. Eight branches are arranged in ascending order of influence value, that is, P15, P10, P14, P09, P03, P07, P06, and P08.
The branch that is first in the two groups of ranking results is selected as the optimal branch for branch P09 to increase airflow volume based on the above sensitivity ranking and influence value ranking. That is, branch P14 is selected to decrease resistance adjustment.
It can be seen from the above analysis that the optimal branches of the two different adjustment modes of increasing resistance and decreasing resistance for branch P09 to increase airflow volume are obtained, combined with the sensitivity and influence value analyses: the optimal branch for increasing resistance regulation is P12, and the optimal branch for decreasing resistance regulation is P14.

3.3. Regulation Scheme Formulation

Theoretically, the optimal adjustment branch based on sensitivity and influence value analyses can achieve the optimal adjustment effect. However, many factors affect the adjustment effect of the scheme in the process of engineering practice, such as roadway airflow and environmental parameters. It is necessary to compare and analyze the theoretical optimal branches P12 and P14 to determine the better branch of the two and formulate an adjustment scheme.
(1)
Determine the adjustment branch and ventilation resistance mode
The simulation data analysis and engineering benefit analysis are carried out for the two branches to further test the feasibility of the above two adjustment methods, compare the differences between the adjustment effects, and provide a data basis for the final adjustment scheme.
Simulation data analysis: Branch P12’s ventilation resistance is increased by 40%, and branch P14’s ventilation resistance is reduced by 40% based on the initial ventilation resistance. The simulated airflow volume data of the branches before and after adjustment are shown in Table 3.
It can be seen from the data in Table 3 that the airflow volume of branch P09 is increased by a certain amount (1.74 m3·s−1) compared with that before the adjustment by increasing the resistance of branch P12, which meets the adjustment objective. The airflow volume of branch P09 is also increased (1.62 m3·s−1) compared with that before the adjustment by reducing the resistance of branch P14. It is worth noting that branch P12 has a more obvious effect on the airflow volume distribution in the ventilation network than branch P14. Among them, branch P03 has the smallest change in airflow volume (−0.15 m3·s−1), and branch P12 has the largest change (−4.76 m3·s−1), reduced to 19.61 m3·s−1, which is slightly lower than the minimum air volume requirement of the branch (20 m3·s−1).
Engineering economic benefit analysis: It is necessary to further analyze the adjustment scheme in terms of economic rationality and technical feasibility in the process of mine engineering practice. The resistance increase adjustment is usually set in the production stope or chamber to reduce the impact of the adjustment measures on the transportation operation and to consider the economy of the project implementation. The resistance reduction adjustment is usually set in the intake and return air areas to achieve better economic benefits for the relatively long service life of the intake and return air shafts.
It can be seen from the above analysis that the scheme of increasing branch P12’s ventilation resistance is more obvious in terms of the adjustment effect. However, branch P12 represents the contact road connecting the −600 m level and the ramp, which is mainly used for the deployment of equipment and materials. The actual engineering effect of increasing resistance in branch P12 will be weakened. Branch P14 represents a return airflow area. The ventilation resistance reduction adjustment of branch P14 can obtain a better effect considering the economic and long-term benefits.
(2)
Roadway ventilation resistance adjustment scheme
The commonly used ventilation resistance adjustment measures include improving the smoothness of the roadway surface, selecting a reasonable shape for the roadway section, avoiding a sudden change in roadway section size or direction, and avoiding an accumulation of materials in the roadway. The section shape and size parameters of the roadway represented by branch P14 have been determined. Therefore, it is necessary to reduce the accumulation of waste materials in the roadway as much as possible for the ventilation resistance reduction adjustment in this area. On the other hand, spray anchor support or concrete support measures can be carried out on the roadway wall in this area to ensure the smooth surface of the roadway and reduce the ventilation resistance in the area.
In summary, branch P14’s representative area is selected for roadway wall spray anchor support or concrete support measures. In this way, the friction resistance coefficient and ventilation resistance of the roadway are reduced, the airflow volume in the branch P09 area is increased, and the overall distribution of airflow volume in the−600 m level is optimized.

4. Analysis of Scheme Adjustment Effect

4.1. Branch Airflow Volume Adjustment and Influence

It is found, by comparing the data of branch airflow volume before and after adjustment, that the airflow volume of branch P09 increased to a certain extent after the ventilation resistance reduction adjustment of branch P14, which realized the adjustment objective of increasing the air volume of the branch. The distribution of the branch airflow volume in the ventilation network also changes, but it still met the minimum airflow volume demand of each branch. The change in branch airflow volume is shown in Table 4.
It can be seen in Table 4 that the air volume of branch P09 was increased (+1.62 m3·s−1) by decreasing the ventilation resistance of branch P14, and the airflow volumes of other branches still met the minimum airflow volume demand of branches, which realized the optimal adjustment of the airflow volume distribution. Additionally, the change in airflow volume distribution in the ventilation network conforms to the data in branch sensitivity matrix D after the ventilation resistance of branch P14 is reduced, which shows the theoretical feasibility of applying the branch sensitivity concept in ventilation network analysis.

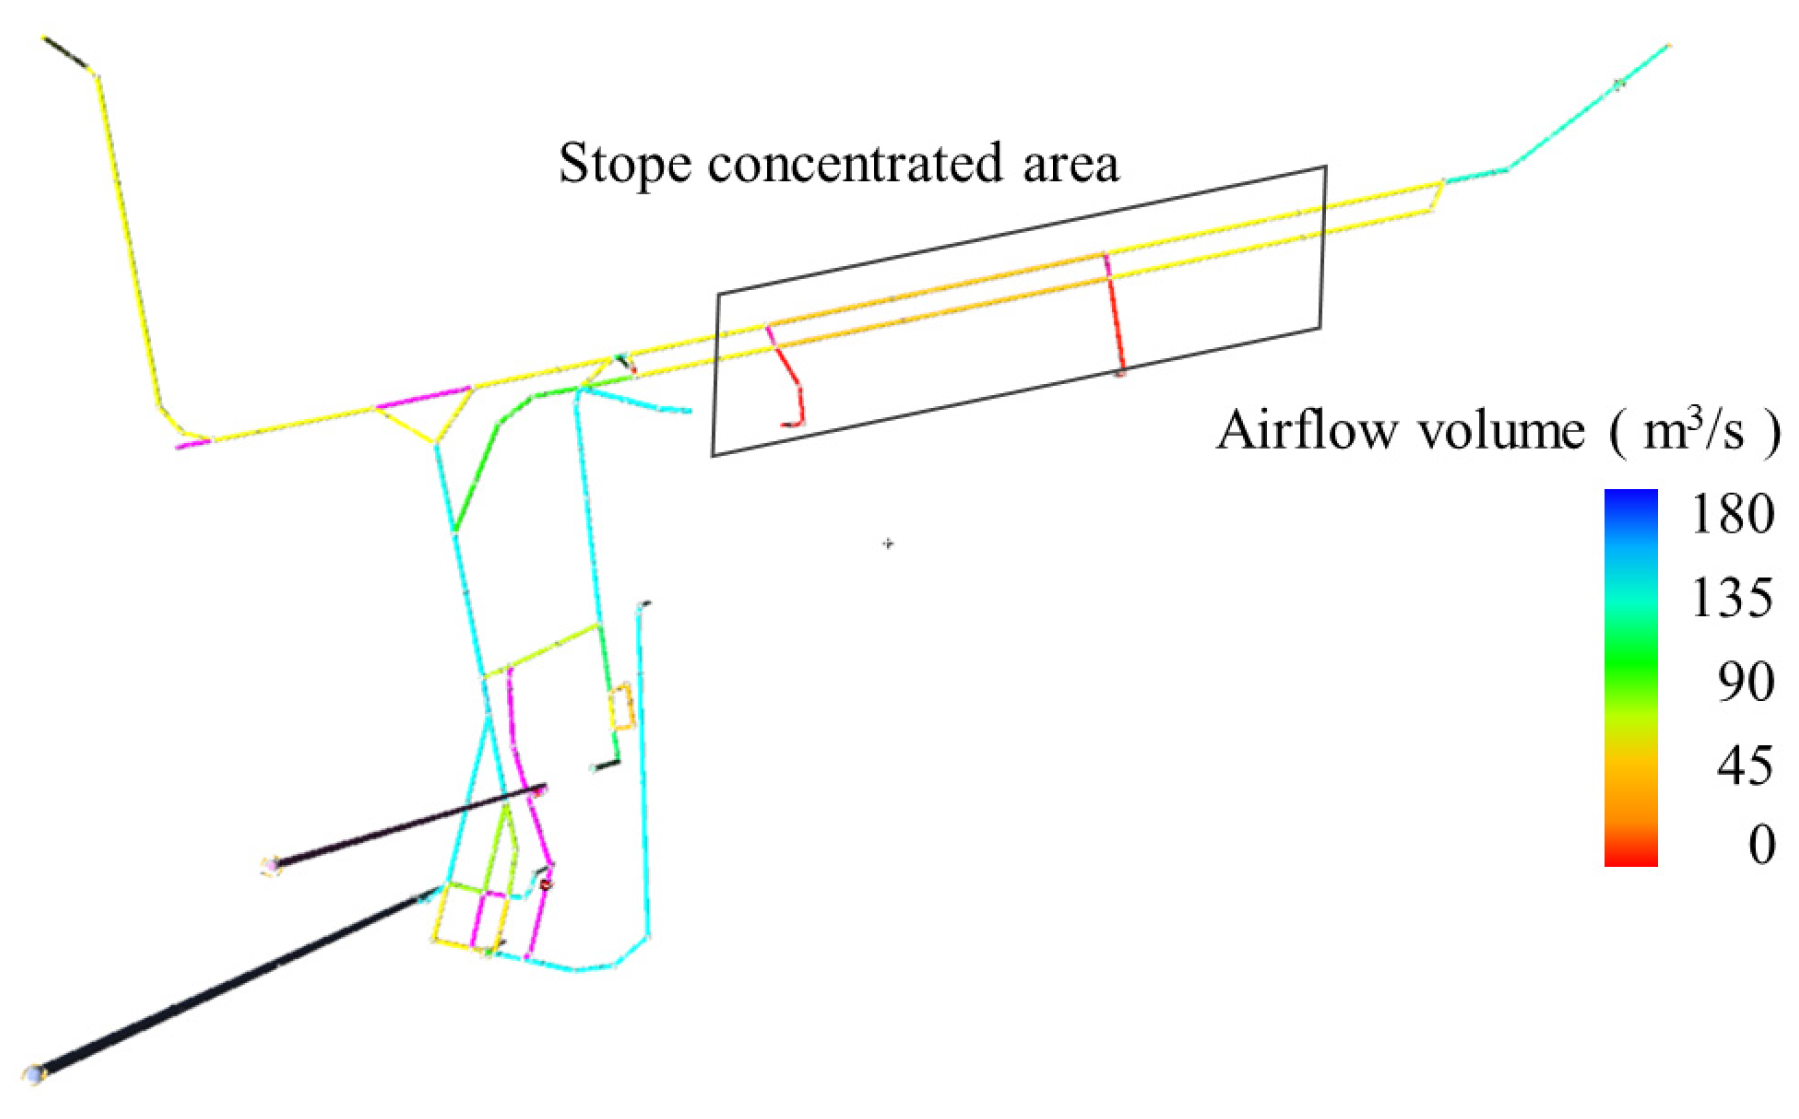
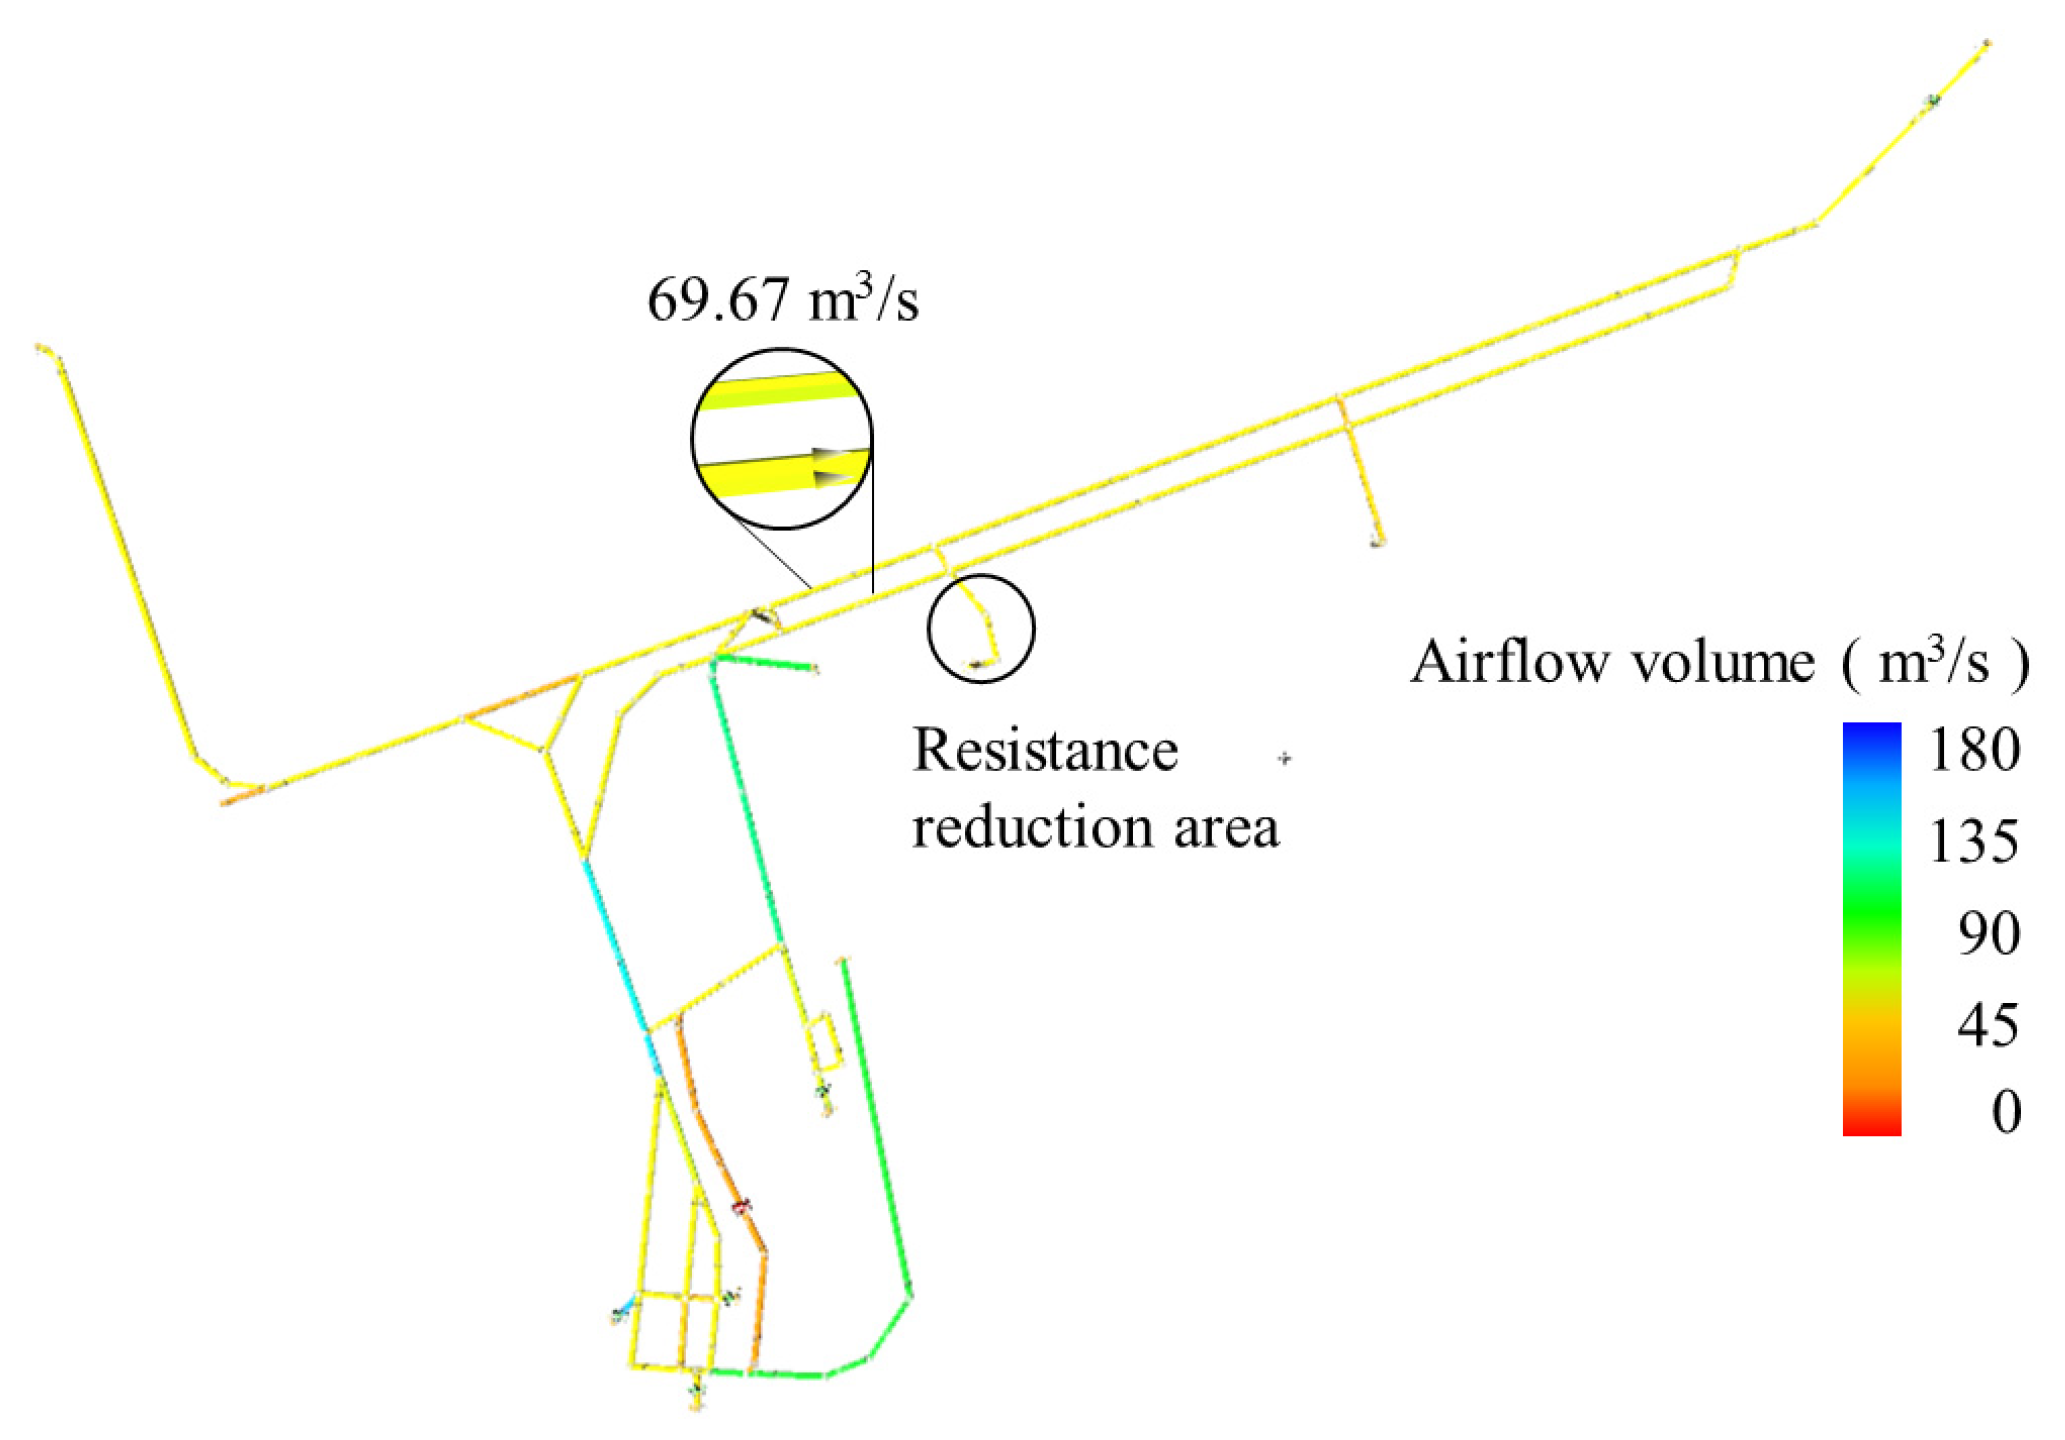
4.2. Analysis of Airflow Volume Regulation Effect in the Ventilation System

There may be some deviation between the actual adjustment effect and the theoretical analysis results because of the influence of the airflow in other ventilation shafts in the actual engineering of the mine. Therefore, it is necessary to simulate the adjustment scheme at the −600 m level of Xinli Submine in the ventilation system model to test the scheme’s effect from the global perspective of the ventilation system. The simulation results are shown in Figure 7.
It can be seen in Figure 6 that the airflow volume distribution of each roadway branch at the −600 m level is more balanced after the resistance adjustment. The resistance adjustment scheme can still optimize the airflow volume distribution at the −600 m level from the global perspective of the ventilation system. The scenario was applied in the mine to validate the optimization effect. The airflow volume of P09 was measured on site. The actual airflow volume is 68.70 m3·s−1, demonstrating that the actual result is similar to the optimization result.
In summary, the analysis and formulation of the adjustment scheme based on branch sensitivity theory can lead to the application and practice of the basic theory concept in mine engineering. It has certain technical feasibility for the airflow volume adjustment and distribution optimization of the mine, which can provide analysis and research ideas for solving such engineering problems.

5. Discussion

This study focused on analyzing and selecting adjustment branches to meet the airflow volume distribution requirements of Xinli Submine in Sanshandao Gold Mine. The sensitivity matrix theory of fluid networks was utilized to guide this process. The theoretical analysis results were used to develop an air volume adjustment scheme for the middle roadway, and the feasibility of utilizing sensitivity theory to adjust the airflow volume in the mine roadway was tested. During the study, Ventsim’s airflow simulation function was employed to calculate the airflow distribution. This software considered various factors, such as natural air pressure and roadway air leakage, which affected the sensitivity matrix. By integrating fluid network sensitivity matrix theory with the ventilation simulation software, the calculation workload was reduced while maintaining solution accuracy. This approach enhanced the practicality of the analysis concepts presented in this paper.
The fundamental concept and calculation formula of sensitivity in this study were based on fluid network theory. In other words, the mine ventilation network was transformed into a fluid network, and the problem was analyzed using the principles and mathematical models of fluid network analysis. Applying basic theory to practical engineering problems demonstrates the feasibility of fluid network branch sensitivity theory in solving mine ventilation problems. However, there are some limitations to consider. The data in Table 4 indicate that the airflow volume regulation achieved through the regulation scheme has limited effectiveness. Therefore, future research may yield better results by combining sensitivity analysis methods with the arrangement of ventilation power facilities, such as auxiliary fans.

6. Conclusions

The airflow volume adjustment analysis was carried out based on the sensitivity theory of the fluid network branch for the −600 m level of Xinli Submine in Sanshandao Gold Mine, and the optimal adjustment scheme was formulated. The adjustment scheme was simulated with Ventsim. Additionally, by comparing the simulation data before and after adjustment, it was found that the adjustment scheme could make the airflow volume distribution in the level more balanced as it could achieve the adjustment target of the branch air volume. The change in branch airflow volume in the simulation process basically conforms to the calculation results of the sensitivity matrix, which further shows the theoretical feasibility of branch sensitivity theory for analyzing and solving the problem in mine ventilation networks.
The ventilation network is idealized as a fluid network to address the problem of air volume regulation in deep middle shafts of mines. The research idea based on branch sensitivity analysis can optimize the airflow volume distribution of the ventilation network to meet the objective of airflow volume regulation and ensure that the adjustment measures will not significantly impact the ventilation efficiency, which has certain theoretical feasibility and practicability. It provides a theoretical analysis idea for the adjustment of the airflow volume in a mine or for selecting the location of the ventilation facilities, which has certain practical significance for optimizing mine ventilation systems.

Author Contributions

Software, G.N. and W.Z.; Formal analysis, G.N.; Investigation, J.H. and G.L.; Resources, B.S.; Data curation, J.H. and G.L.; Writing—original draft, J.H. and G.L.; Writing—review & editing, J.H. All authors have read and agreed to the published version of the manuscript.

Funding

This research was supported by the National Key R&D Program of China (No. 2022YFC2903905), the National Natural Science Foundation of China (No. 52074022), and the Anhui Mine IOT and Security Monitoring Technology Key Laboratory (Grant No. 2109Y-09-03).

Institutional Review Board Statement

Not applicable.

Informed Consent Statement

Not applicable.

Data Availability Statement

Not applicable.

Conflicts of Interest

The authors declare no conflict of interest.

References

  1. Nel, A.J.H.; Vosloo, J.C.; Mathews, M.J. Evaluating complex mine ventilation operational changes through simulations. J. Energy South. Afr. 2018, 29, 22–32. [Google Scholar] [CrossRef]
  2. Acuña, E.I.; Lowndes, I.S. A Review of Primary Mine Ventilation System Optimization. Interfaces 2014, 44, 163–175. [Google Scholar] [CrossRef]
  3. Kurnia, J.C.; Sasmito, A.P.; Mujumdar, A.S. CFD simulation of methane dispersion and innovative methane management in underground mining faces. Appl. Math. Model. 2014, 38, 3467–3484. [Google Scholar] [CrossRef]
  4. Roghanchi, P.; Kocsis, K.C. Challenges in Selecting an Appropriate Heat Stress Index to Protect Workers in Hot and Humid Underground Mines. Saf. Health Work 2018, 9, 10–16. [Google Scholar] [CrossRef]
  5. Brodny, J.; Tutak, M. Determination of the Zone Endangered by Methane Explosion in Goaf with Caving of Longwalls Ventilated on Y System. Manag. Syst. Prod. Eng. 2016, 24, 247–251. [Google Scholar] [CrossRef]
  6. Wallace, K.; Prosser, B.; Stinnette, J.D. The practice of mine ventilation engineering. Int. J. Min. Sci. Technol. 2015, 25, 165–169. [Google Scholar] [CrossRef]
  7. Yi, H.; Kim, M.; Lee, D.; Park, J. Applications of Computational Fluid Dynamics for Mine Ventilation in Mineral Development. Energies 2022, 15, 8405. [Google Scholar] [CrossRef]
  8. Sjöström, S.; Klintenäs, E.; Johansson, P.; Nyqvist, J. Optimized model-based control of main mine ventilation air flows with minimized energy consumption. Int. J. Min. Sci. Technol. 2020, 30, 533–539. [Google Scholar] [CrossRef]
  9. Ajayi, K.M.; Shahbazi, K.; Tukkaraja, P.; Katzenstein, K. Prediction of airway resistance in panel cave mines using a discrete and continuum model. Int. J. Min. Sci. Technol. 2019, 29, 781–784. [Google Scholar] [CrossRef]
  10. Prince; Hati, A.S.; Chakrabarti, P.; Abawajy, J.H.; Keong, N.W. Development of energy efficient drive for ventilation system using recurrent neural network. Neural Comput. Appl. 2021, 33, 8659–8668. [Google Scholar] [CrossRef]
  11. Nyaaba, W.; Frimpong, S.; El-Nagdy, K.A. Optimisation of mine ventilation networks using the Lagrangian algorithm for equality constraints. Int. J. Min. Reclam. Environ. 2014, 29, 201–212. [Google Scholar] [CrossRef]
  12. Xu, G.; Huang, J.; Nie, B.; Chalmers, D.; Yang, Z. Calibration of Mine Ventilation Network Models Using the Non-Linear Optimization Algorithm. Energies 2017, 11, 31. [Google Scholar] [CrossRef]
  13. Yu, B.-C.; Shao, L.-S. A Mine Ventilation System Energy Saving Technique Based on an Improved Equilibrium Optimizer. Front. Energy Res. 2022, 10, 913817. [Google Scholar] [CrossRef]
  14. Li, B.-R.; Inoue, M.; Shen, S.-B. Mine Ventilation Network Optimization Based on Airflow Asymptotic Calculation Method. J. Min. Sci. 2018, 54, 99–110. [Google Scholar] [CrossRef]
  15. Prince; Hati, A.S.; Kumar, P. An adaptive neural fuzzy interface structure optimisation for prediction of energy consumption and airflow of a ventilation system. Appl. Energy 2023, 337, 913817. [Google Scholar]
  16. Wang, S.; Wang, W.-P.; Shao, K.; Ding, W.-H.; Cui, Z.; Shao, W.; Ji, W.-X. Operation optimization of a refrigeration ventilation system for the deep metal mine. Case Stud. Therm. Eng. 2023, 44, 102817. [Google Scholar] [CrossRef]
  17. Chatterjee, A.; Zhang, L.; Xia, X. Optimization of mine ventilation fan speeds according to ventilation on demand and time of use tariff. Appl. Energy 2015, 146, 65–73. [Google Scholar] [CrossRef]
  18. Natalie, G. 3D Simulation Software Package for Mine Ventilation. Creamer Media’s Min. Wkly. 2011, 17, 1–27. [Google Scholar]
  19. Șuvar, M.C.; Cioclea, D.; Arad, V.; Lupu, C.; Vlasin, N.I. Method for Improving the Management of Mine Ventilation Networks After an Explosion. Environ. Eng. Manag. J. 2017, 16, 1373–1381. [Google Scholar] [CrossRef]
  20. Park, J.; Jo, Y.; Park, G. Flow characteristics of fresh air discharged from a ventilation duct for mine ventilation. J. Mech. Sci. Technol. 2018, 32, 1187–1194. [Google Scholar] [CrossRef]
  21. Morar, M.S.; Radu, S.M.; Lupu, C.; Cioclea, D.; Gherghe, I. Optimization of Underground Environment by Improving the Management of Ventilation Networks. Environ. Eng. Manag. J. 2017, 16, 1409–1414. [Google Scholar] [CrossRef]
  22. Zhou, L.; Thomas, R.A.; Yuan, L.; Bahrami, D. Experimental Study of Improving a Mine Ventilation Network Model Using Continuously Monitored Airflow. Min. Metall. Explor. 2022, 39, 887–895. [Google Scholar] [CrossRef]
  23. Semin, M.A.; Levin, L.Y. Stability of air flows in mine ventilation networks. Process Saf. Environ. Prot. 2019, 124, 167–171. [Google Scholar] [CrossRef]
  24. Develo, E.; Pillalamarry, M.; Garab, E. Improving the ventilation system at Rosh Pinah zinc mine. J. South. Afr. Inst. Min. Metall. 2016, 116, 301–305. [Google Scholar] [CrossRef]
  25. Grzegorz, P. Optimization of Forced Air Flow by the Comparison of Positive and Negative Regulations in Mine Ventilation Network. Arch. Min. Sci. 2018, 63, 853–870. [Google Scholar]
  26. Wang, J.; Jia, M.; Bin, L.; Wang, L.; Zhong, D. Regulation and optimization of air quantity in a mine ventilation network with multiple fans. Arch. Min. Sci. 2022, 67, 179–193. [Google Scholar]
  27. Jia, P.; Jia, J.; Song, L.; Li, Z.; Li, B. Theory of RPOD adjustment of air volume for mine intelligent ventilation. Int. J. Vent. 2021, 21, 316–329. [Google Scholar] [CrossRef]
  28. Hao, H.; Jiang, S.; Wang, K.; Zhang, Y.; Wu, Z. Multi-branch joint adjustment method of mine ventilation based on sensitivity. Int. J. Vent. 2022, 22, 207–224. [Google Scholar] [CrossRef]
  29. Dziurzyński, W.; Krach, A.; Pałka, T. Airflow Sensitivity Assessment Based on Underground Mine Ventilation Systems Modeling. Energies 2017, 10, 1451. [Google Scholar] [CrossRef]
  30. Jia, J.; Li, B.; Ke, D.; Wu, Y.; Zhao, D.; Wang, M. Optimization of mine ventilation network feature graph. PLoS ONE 2020, 15, e0242011. [Google Scholar] [CrossRef]
  31. Bascompta, M.; Sanmiquel, L.; Zhang, H. Airflow Stability and Diagonal Mine Ventilation System Optimization: A Case Study. J. Min. Sci. 2019, 54, 813–820. [Google Scholar] [CrossRef]
Figure 1. Ventilation network diagram of Xinli Submine.
Sustainability 15 12427 g001
Figure 2. Schematic diagram of airflow volume distribution at −600 m level.
Sustainability 15 12427 g002
Figure 3. Schematic diagram of optimization analysis process.
Sustainability 15 12427 g003
Figure 4. Xinli Submine −600 m level roadway and shaft schematic diagram.
Sustainability 15 12427 g004
Figure 5. Ventilation network diagram of −600 m level in Xinli Submine.
Sustainability 15 12427 g005
Figure 6. Simplified ventilation network diagram of −600 m level.
Sustainability 15 12427 g006
Figure 7. Airflow volume distribution of −600 m level after adjustment.
Sustainability 15 12427 g007
Table 1. Xinli Submine airflow intake data.
Level/mAirflow Volume/m3·s−1Percentage/%
Intake Air Shaft 1Intake Air Shaft 2Intake Air Shaft 3Subtotal
−40022.9022.906.0
−44028.0045.1973.1919.1
−48014.5614.563.8
−600136.0166.08202.0952.7
−67560.2860.2815.7
−7204.854.851.3
−7845.285.281.4
Subtotal206.42108.6468.09383.15100
Table 2. Branch parameters of simplified ventilation network diagram of −600 m level.
BranchAirflow Volume/m3·s−1Ventilation Resistance/N·s2·m−8BranchAirflow Volume/m3·s−1Ventilation Resistance/N·s2·m−8
inlet01136.00P07138.460.01236
inlet0255.00P08185.390.00420
inlet0315.40P0967.020.00997
inlet0466.10P1055.010.02469
P0114.930.00402P1129.540.04763
P0230.030.41221P1224.370.01500
P03175.030.01525P13117.380.00193
P046.510.00896P1412.000.00503
P05168.480.00434P1513.110.00897
P0672.200.01714P1641.820.04435
Table 3. Comparison of airflow volume before and after ventilation resistance adjustment.
BranchAirflow Volume Requirement
/m3·s−1
Before/m3·s−1After/m3·s−1
P12 (Increasing Ventilation Resistance)P14 (Decreasing Ventilation Resistance)
P01914.9314.9314.93
P022530.0330.0330.03
P0386175.03174.88175.05
P0456.516.206.53
P0589168.48168.79168.45
P067072.2072.5072.20
P0776138.46137.64138.49
P08126185.39188.74185.69
P091367.0268.7668.64
P101355.0155.8253.08
P111329.5430.3229.52
P122024.3719.6124.21
P1360117.38119.19116.36
P141012.0013.2114.78
P151013.1113.3911.85
P164041.8241.9141.20
Note: airflow volume requirement in the table mainly considers the intake and return air requirements of the stope and chamber.
Table 4. Branch airflow volume before and after volume resistance adjustment.
BranchAirflow Volume
Requirement/m3·s−1
Airflow Volume/m3·s−1Difference/m3·s−1
BeforeAfter
P01914.9314.930
P022530.0330.030
P0386175.03175.050.02
P0456.516.530.02
P0589168.48168.45−0.03
P067072.2072.200
P0776138.46138.490.03
P08126185.39185.690.30
P091367.0268.641.62
P101355.0153.08−1.93
P111329.5429.52−0.02
P122024.3724.21−0.16
P1360117.38116.36−1.02
P141012.0014.782.78
P151013.1111.85−1.26
P164041.8241.20−0.62
Note: airflow volume requirement in the table mainly considers the intake and return air requirements of the stope and chamber.
Disclaimer/Publisher’s Note: The statements, opinions and data contained in all publications are solely those of the individual author(s) and contributor(s) and not of MDPI and/or the editor(s). MDPI and/or the editor(s) disclaim responsibility for any injury to people or property resulting from any ideas, methods, instructions or products referred to in the content.

