Article

A Sustainable Way to Determine the Water Content in Torreya grandis Kernels Based on Near-Infrared Spectroscopy

1
College of Optical, Mechanical and Electrical Engineering, Zhejiang A&F University, Hangzhou 311300, China
2
Key Laboratory of Agricultural Equipment for Hilly and Mountainous Areas in Southeastern China (Co-Construction by Ministry and Province), Ministry of Agriculture and Rural Affairs, Hangzhou 311300, China
3
College of Chemical and Material Engineering, Zhejiang A&F University, Hangzhou 311300, China
4
US-Pakistan Centre for Advanced Studies in Energy, National University of Science and Technology, Islamabad 44000, Pakistan
*
Authors to whom correspondence should be addressed.
Sustainability 2023, 15(16), 12423; https://doi.org/10.3390/su151612423
Submission received: 3 June 2023 / Revised: 9 August 2023 / Accepted: 11 August 2023 / Published: 16 August 2023
(This article belongs to the Special Issue Sustainable Technology in Agricultural Engineering)

Abstract

:
Water content is an important parameter of Torreya grandis (T. grandis) kernels that affects their quality, processing and storage. The traditional drying method for water content determination is time-consuming and laborious. Water content detection based on modern analytical techniques such as spectroscopy is accomplished in a fast, accurate, nondestructive, and sustainable way. The aim of this study was to realize the rapid detection of the water content in T. grandis kernels using near-infrared spectroscopy. The water content of T. grandis kernels was measured by the traditional drying method. Meanwhile, the corresponding near-infrared spectra of these samples were collected. A quantitative water content model of T. grandis kernels was established using the full spectrum after 10 outlier samples were removed by the Mahalanobis distance method and concentration residual analysis. The results showed that the prediction model developed from the partial least squares regression (PLS) method after the spectra were pretreated by the standard normal variate transform (SNV) achieved optimal performance. The correlation coefficient of the calibration set (R2c) and the cross-validation set (R2cv) were 0.9879 and 0.9782, respectively, and the root mean square error of the calibration set (RMSEC) and the root mean square error of the cross-validation set (RMSECV) were 0.0029 and 0.0039, respectively. Thus, near-infrared spectroscopy is feasible for the rapid nondestructive detection of the water content in T. grandis seeds. Detecting the water content of agricultural and forestry products in such an environmentally friendly manner is conducive to the sustainable development of agriculture.

1. Introduction

Water content is an important parameter affecting the quality, processing, and storage of T. grandis kernels. Excessive water content in T. grandis kernels tends to cause relatively fast oxidation and corruption, while a too low water content tends to cause crushing and damage in the process of processing and transportation [1]. Water content also affects the taste, quality, and medicinal efficacy of T. grandis kernels. The prevalence of the water content detection of T. grandis kernels is determined by the traditional drying method, which is to dry them at 105 °C to a constant weight. This method is time-consuming and laborious. In the process of processing and storage, the water content of T. grandis kernels is difficult to quantify, and it often depends on the empirical judgement of workers. The accurate determination of the water content in T. grandis kernels is conducive to processing and storage, effectively improving the quality of the nuts [2]. In view of this, acquiring a sustainable method to achieve large-scale production of the online detection for the rapid and nondestructive examination of water content in T. grandis kernels is of great significance. To be more specific, water content detection for T. grandis kernels in a sustainable way could reduce the loss of the T. grandis kernels after picking and improve the economic benefits of the relevant industry. The sustainable testing technology of agricultural products and the sustainable development of agriculture would inevitably promote the sustainable development of humans [3].
At present, modern water content detection methods mainly include the capacitance method, the resistance method, and microwave methods [4]. The principle of the capacitance method is to measure the change of dielectric coefficient ε during the process of the measured object passing through the medium. Meanwhile, the capacitance of the capacitance sensor would change; so, the water content can be measured indirectly. The capacitance method exhibits a simple structure, low cost and rapid measurement. However, it shows low measurement accuracy and poor stability [5]. The resistance method uses the change in the resistance value to indirectly reflect the water content of the measured object causing the different water content of the measured object and a different conductivity. The advantages of the resistance method are its simple structure and low cost. The disadvantages are the small signal intensity, high sampling requirements, unsuitability for the determination of trace water content, and the high water content [4]. The principle of microwave water content detection is to calculate the water content by using the power change, amplitude change, phase change, or frequency change generated by microwave action on the measured object. The advantages of the microwave method are its high sensitivity, fast speed, nonintrusive and nondestructive measurement. However, the measurement results would be easily affected by the shape, the density of the sample, and the high price of the instrument [6]. Consequently, the above methods are difficult to use to detect the water content of T. grandis kernels.
Spectral technology is a green and sustainable technology that has been widely used in agriculture and food detection in recent years. Among them, near-infrared spectroscopy is widely used in the detection of organic matter. The principle of detection of organic matter using near-infrared spectroscopy is to analyze the state, composition, structure, and information of molecules based on the vibration of hydrogen-containing groups (such as O–H, N–H, C–H) and the absorption spectrum [7]. Near-infrared spectroscopy has the advantages of a fast detection speed, high accuracy, and no damage to the samples and has been widely used in agriculture, food, medicine, tobacco, alcohol, petroleum, and other fields. The water content detection model of walnut in southern Xinjiang was established using near-infrared spectroscopy, and the study showed that the optimal model was the PLS model established after SNV pretreatment, and the average error of the optimal model was 0.35% [8]. The statistic showed that this technology could be fully applied to the water content detection of the nut industry. Jin et al. collected the near-infrared spectra of wheat flour and established the best water content prediction model by comparing an internal cross-validation method. The results showed that the PLS modeling was more suitable for the performance of water content prediction, as the correlation coefficient (R2) and standard error prediction (SEP) of the modeling were 0.9848 and 0.0929, respectively [9]. A PLS prediction model including the water content and activity of dried apricot was established using Fourier transform near-infrared (FT-NIR) technology. The study showed that the model had excellent prediction on the water content (R2p = 0.986, RMSEP = 1.22%, RPD = 9.15) and water activity (R2p = 0.987, RMSEP = 0.016, RPD = 9.37) [10]. These studies indicated that near infrared spectroscopy could be widely used in the water content detection of food.
According to the abovementioned studies, water is an important parameter for T. grandis kernels, which affects its quality, processing, and storage. However, the traditional drying method for water content determination is time-consuming and laborious. Although near-infrared technology is widely used in the food industry, to our knowledge, it has not been applied to the detection of water content for T. grandis kernels. In this study, near-infrared spectroscopy technology was used to establish a quantitative water content prediction model for T. grandis kernels. The application of near-infrared spectroscopy technology could help enterprises quickly to accurately determine the water content in T. grandis kernels, an important quality parameter, so as to improve the market competitiveness of products and reduce the quality risk. The application of green technology in the detection of agricultural products would directly promote the development of the T. grandis kernel industry, improve the level of food testing, and promote the sustainable development of agriculture.

2. Materials and Methods

2.1. Sample Collection

The T. grandis kernels were harvested from Jidong town, Shaoxing, Zhejiang Province, China in September 2022. The T. grandis trees were more than 15 years old. The kernels were cleaned after compost processing. In total, 180 T. grandis kernels were randomly selected as the experimental samples for spectral collection and water content measurement. The 180 samples were divided into a calibration set, validation set, and prediction set, from which 144 samples were randomly selected for model establishment and cross validation, and the remaining 36 samples were used for external independent prediction as the prediction set.

2.2. Near-Infrared Spectral Acquisition

The near-infrared spectra of the T. grandis kernels was collected by a portable NIR spectrometer (SmartEye1700, FireEye Golden Eye Co. Ltd., Hangzhou, China) with a wavelength range of 1000~1650 nm and a sampling interval of 1 nm. The light source was a dual integrated vacuum tungsten lamp, and the detector was a 128-line source uncooled indium gallium arsenic (In Ga As) diode array. According to the collection requirements of near-infrared spectroscopy, the T. grandis kernels were kept in the same environment of temperature and humidity with an NIR spectrometer for 24 h. Before spectrum acquisition, the NIR spectrometer needed to be preheated for 30 min, and the laboratory temperature and relative humidity were controlled at 23 °C and 55%, respectively. The diffuse reflection integration method was adopted with a 100% Spectralon TM standard white board as the background in this study. The average scanning times were 50, and the integration time was 12.7 ms with a resolution of 8 cm−1. In order to reduce the experimental error, each sample was repeatedly scanned 3 times at different positions to take the average value of the spectra.

2.3. Water Content Measurement of the T. grandis Kernels

The water content of the T. grandis kernels was determined by the traditional drying method according to the National Food Safety Standard GB 5009.3-2016 (China) [11]. The laboratory oven (DHG-9240A, Jinghong Experimental Equipment Co. Ltd., Shanghai, China) was set to 60 °C, and the sample was weighed with a balance (AL204, Mettler-Toledo Instruments Co. Ltd., Shanghai, China) every 12 h. The drying process ended when the relative weight between two consecutive measurements was less than 0.01 g. The calculation formula for the water content is shown as Equation (1).
W = M m M × 100 %
  • W—water content, %;
  • M—Mass of T. grandis kernels before drying, g;
  • m—Mass of T. grandis kernels after drying, g.

2.4. Methods for Removing the Outlier Samples of T. grandis Kernels

In near-infrared detection and analysis, the removal of outlier samples and the selection of the calibration and prediction samples affected the predictive performance of the model [12]. In general, the outlier samples included spectral outlier samples and chemical outlier samples. The causes of these two types of outlier samples were different. The former was usually caused by inappropriate operations during the near-infrared spectral acquisition process, while the latter was mostly caused during the physicochemical experimental measurement process [13]. Studies have shown that the Mahalanobis distance method and concentration residual method could effectively remove spectral and chemical outlier samples and improve the predictive ability of the calibration model [14,15].

2.4.1. Mahalanobis Distance Method

The Mahalanobis distance method can effectively remove spectral outlier samples, and it has been widely used in the application of gastrodia elata and red dates [14]. In this study, the Mahalanobis distance method was used to remove outlier near-infrared spectra samples of T. grandis kernels. This method used the matrix to calculate the Mahalanobis distance of each sample. Samples with excessively large Mahalanobis distances were removed as outlier spectra. The specific calculation equation was as follows:
M i = x i x ¯ x s p e c T x s p e c n 1 x i x ¯ T
  • M i —The Mahalanobis distance of x i ;
  • x i —The row vector of the spectrum of the i sample;
  • x ¯ —Average spectrum of class x ;
  • x s p e c —Centered spectral matrix of Class x mean;
  • x s p e c T —Transport centered spectral matrix of Class x mean.
The calculation of the threshold range for the outlier spectra is:
M i = M ¯ + e σ M
  • M ¯ —The average Mahalanobis distance of sample;
  • e—Threshold coefficient for adjusting threshold range;
  • σ M —Standard deviation of Mahalanobis distance of sample.
In Equation (3), the higher M i M ¯ , the lower the normalization of the sample i, which negatively affects the stability of the model. I f   M i > M ¯ + e σ M , t h e s a m p l e i was judged as an outlier spectral sample. Therefore, it was necessary to adjust the threshold coefficient “ e ” to adjust the threshold range of the outlier sample.

2.4.2. Concentration Residual Method

The concentration residual method determined outlier samples by detecting the ratio (F) of the variance of Res(i) to the average of the absolute error variance of the entire sample set [16]. The specific calculation equation was as follows:
R e s i = y i   y ¯  
  • Res(i)—The absolute concentration residual;
  • y i —The measured value of sample i;
  • y ¯ —Average measured value of samples.
F = R e s 2 ( i ) R e s 2 ( j ) = n s 1 R e s 2 ( i ) j i j R e s 2 ( j )
B y setting a certain hard threshold F 0 C (usually set from 1 to 5) to determine the chemical outlier sample, if the actual F i C of sample i was greater than F 0 C , the sample i was considered as a chemical outlier sample.
F i c > F 0 C

2.5. T. grandis Kernels’ Sample Division

After removing outlier samples, the remaining samples were divided into a calibration set and a validation set for the establishment and validation of the infrared quantitative model for the water content of T. grandis kernels. The common sample division methods include the Reed–Solomon (RS) method, the Kennard–Stone (KS) method, and the sample set partitioning based on the joint x-y distance (SPXY) method [17]. Among them, the RS method randomly selects samples as the calibration set, which is convenient and simple. However, the calibration set composed of the selected samples might have significant differences and cannot guarantee the representativeness of the samples. The principle of the KS method is to select the two samples with the farthest Euclidean distance to enter the calibration set and then add the samples with the largest minimum distance in the following iteration process. The advantage of the KS method is that it can ensure the uniform distribution of the spatial distance among samples in the validation set, but the distance between every two samples needs to be calculated, which requires a large computation cost [17]. The SPXY method was proposed by Galvão based on the KS method. In the use of near-infrared quantitative models, it combines the advantages of the KS method in the uniform distribution of the x-variable (spectral data) spatial distance and also takes the y-variable (physical and chemical data) into consideration, which can cover multidimensional vector space and improve the prediction ability of the model [18]. According to the abovementioned, the SPXY method for sample division was used in this study.

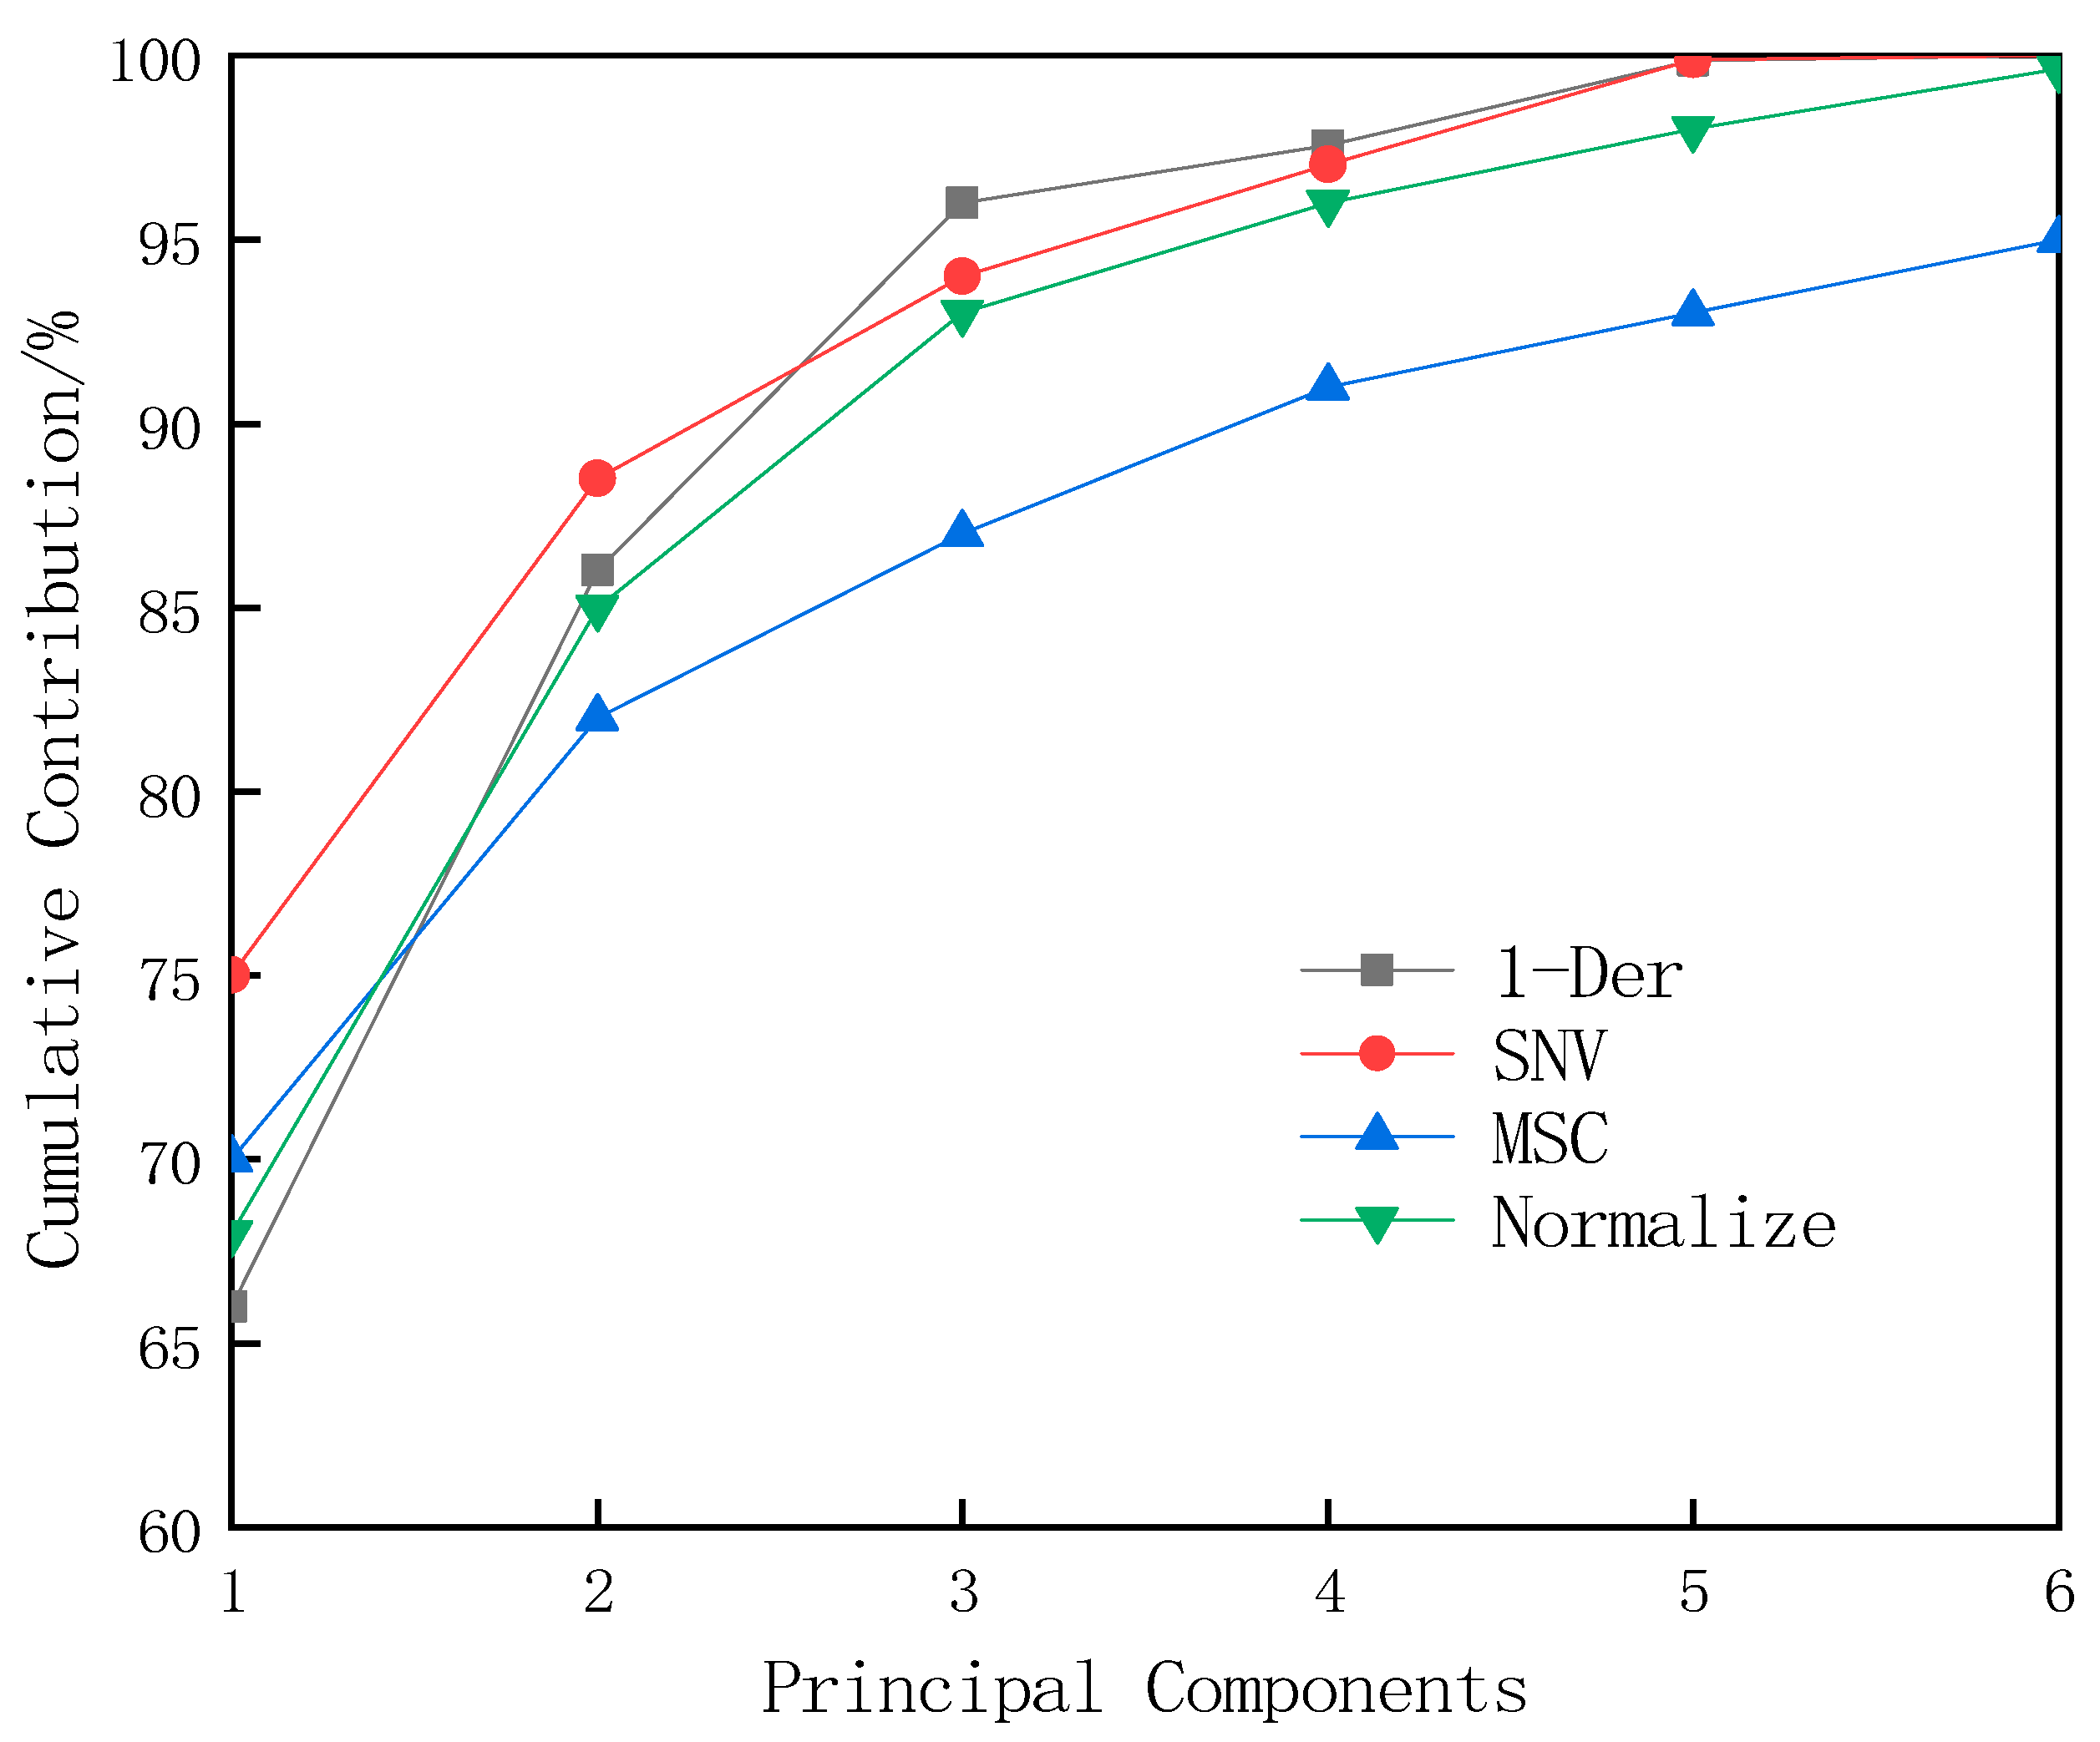
2.6. Preprocessing of the Spectra Data of T. grandis Kernels

After dividing the samples, a near-infrared quantitative water content model of T. grandis kernels was established using the samples included in the calibration set. To improve the accuracy of the model, standard normal transformation (SNV), multiplicative scatter correction (MSC), Savitzky–Golay (SG), normalization, baseline offset correction (Baseline), first-order derivative (1-Der), second-order derivative (2-Der), and the combination of the abovementioned methods were applied to preprocess the collected spectra.

2.7. Establishment and Validation of a Near-Infrared Water Content Model of T. grandis Kernels

After preprocessing the spectra, a quantitative water content model of T. grandis kernels was established using the PLS method. The model was evaluated by four indexes: the correlation coefficient of the calibration set (R2c), the root mean square error of the calibration set (RMSEC), the correlation coefficient of the cross-validation set (R2cv), and the root mean square error of the cross-validation set (RMSECV). Models with a higher correlation coefficient (closer to 1) and a lower RMSE (closer to 0) had a higher prediction accuracy [7]. By comparing the four indexes of the different models obtained using different preprocessing methods, the optimal model for determining the water content of T. grandis kernels was found.

3. Results and Discussion

3.1. Analysis of the Water Content in T. grandis Kernels

The measurement results for the water content in T. grandis kernels are shown in Table 1. The water content of the samples ranged from 15.47% to 28.77%, with an average of 22.58%. It was close to the results of other scholars’ research on the water content of T. grandis kernels (17.8%) [2]. One study determined the water content of fresh peanut seeds with shells and found that it ranged from 59.0% to 82.1% [11]. The water content of fresh sunflowers seeds ranged from 2.92% to 5.79%, with an average of 4.88% [19]. Under such a large change in water content, the near-infrared water content prediction models of peanut and sunflower seeds were established. It could be seen that it was feasible to predict the water content in T. grandis kernels using near-infrared spectroscopy technology according to the water content in this study.

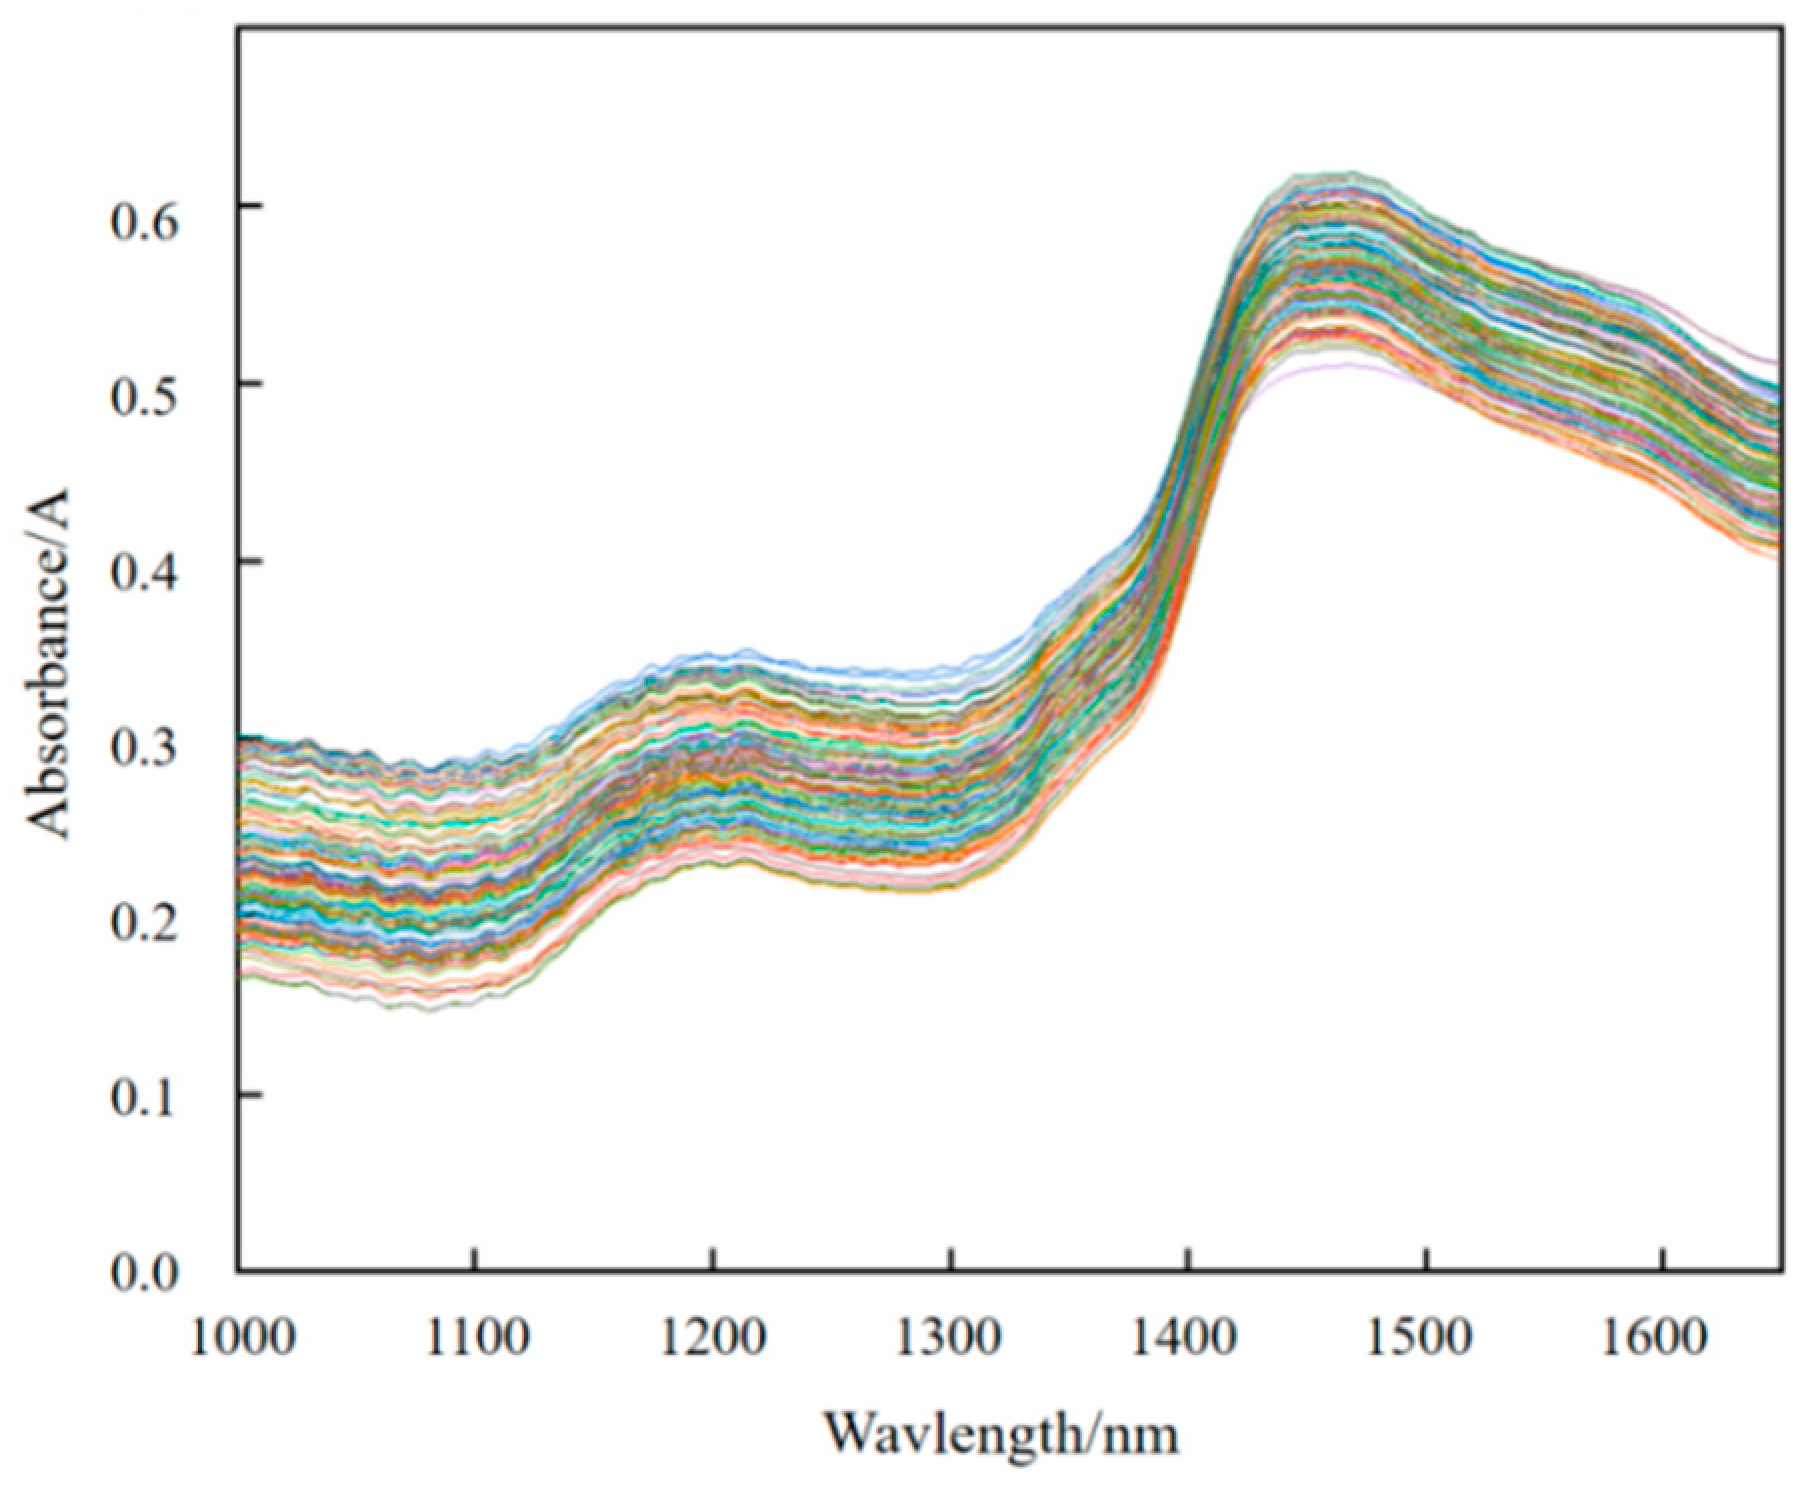
3.2. Near-Infrared Spectra Analysis of the T. grandis Kernels

Figure 1 shows the near-infrared spectra of the water content for the 144 T. grandis kernel samples. It was observed that the characteristic groups of water content mainly had the overtone spectra of O–H bonds in the range from 1000 nm to 1650 nm. A study reported that the absorption peaks corresponding to the water content were located near 1170 nm and 1450 nm by comparing the spectral differences between 6,000 apple samples [20]. Similar results were observed for the absorption peaks corresponding to water content in corn stalk silage samples, which were around 1190 nm and 1450 nm [7]. As depicted in Figure 1, two obvious absorption peaks of water content-related groups were located at 1200 nm and 1470 nm, which laid the foundation for the calibration of the near-infrared quantitative model of the water content.

3.3. Analysis and Removal of the Outlier Samples

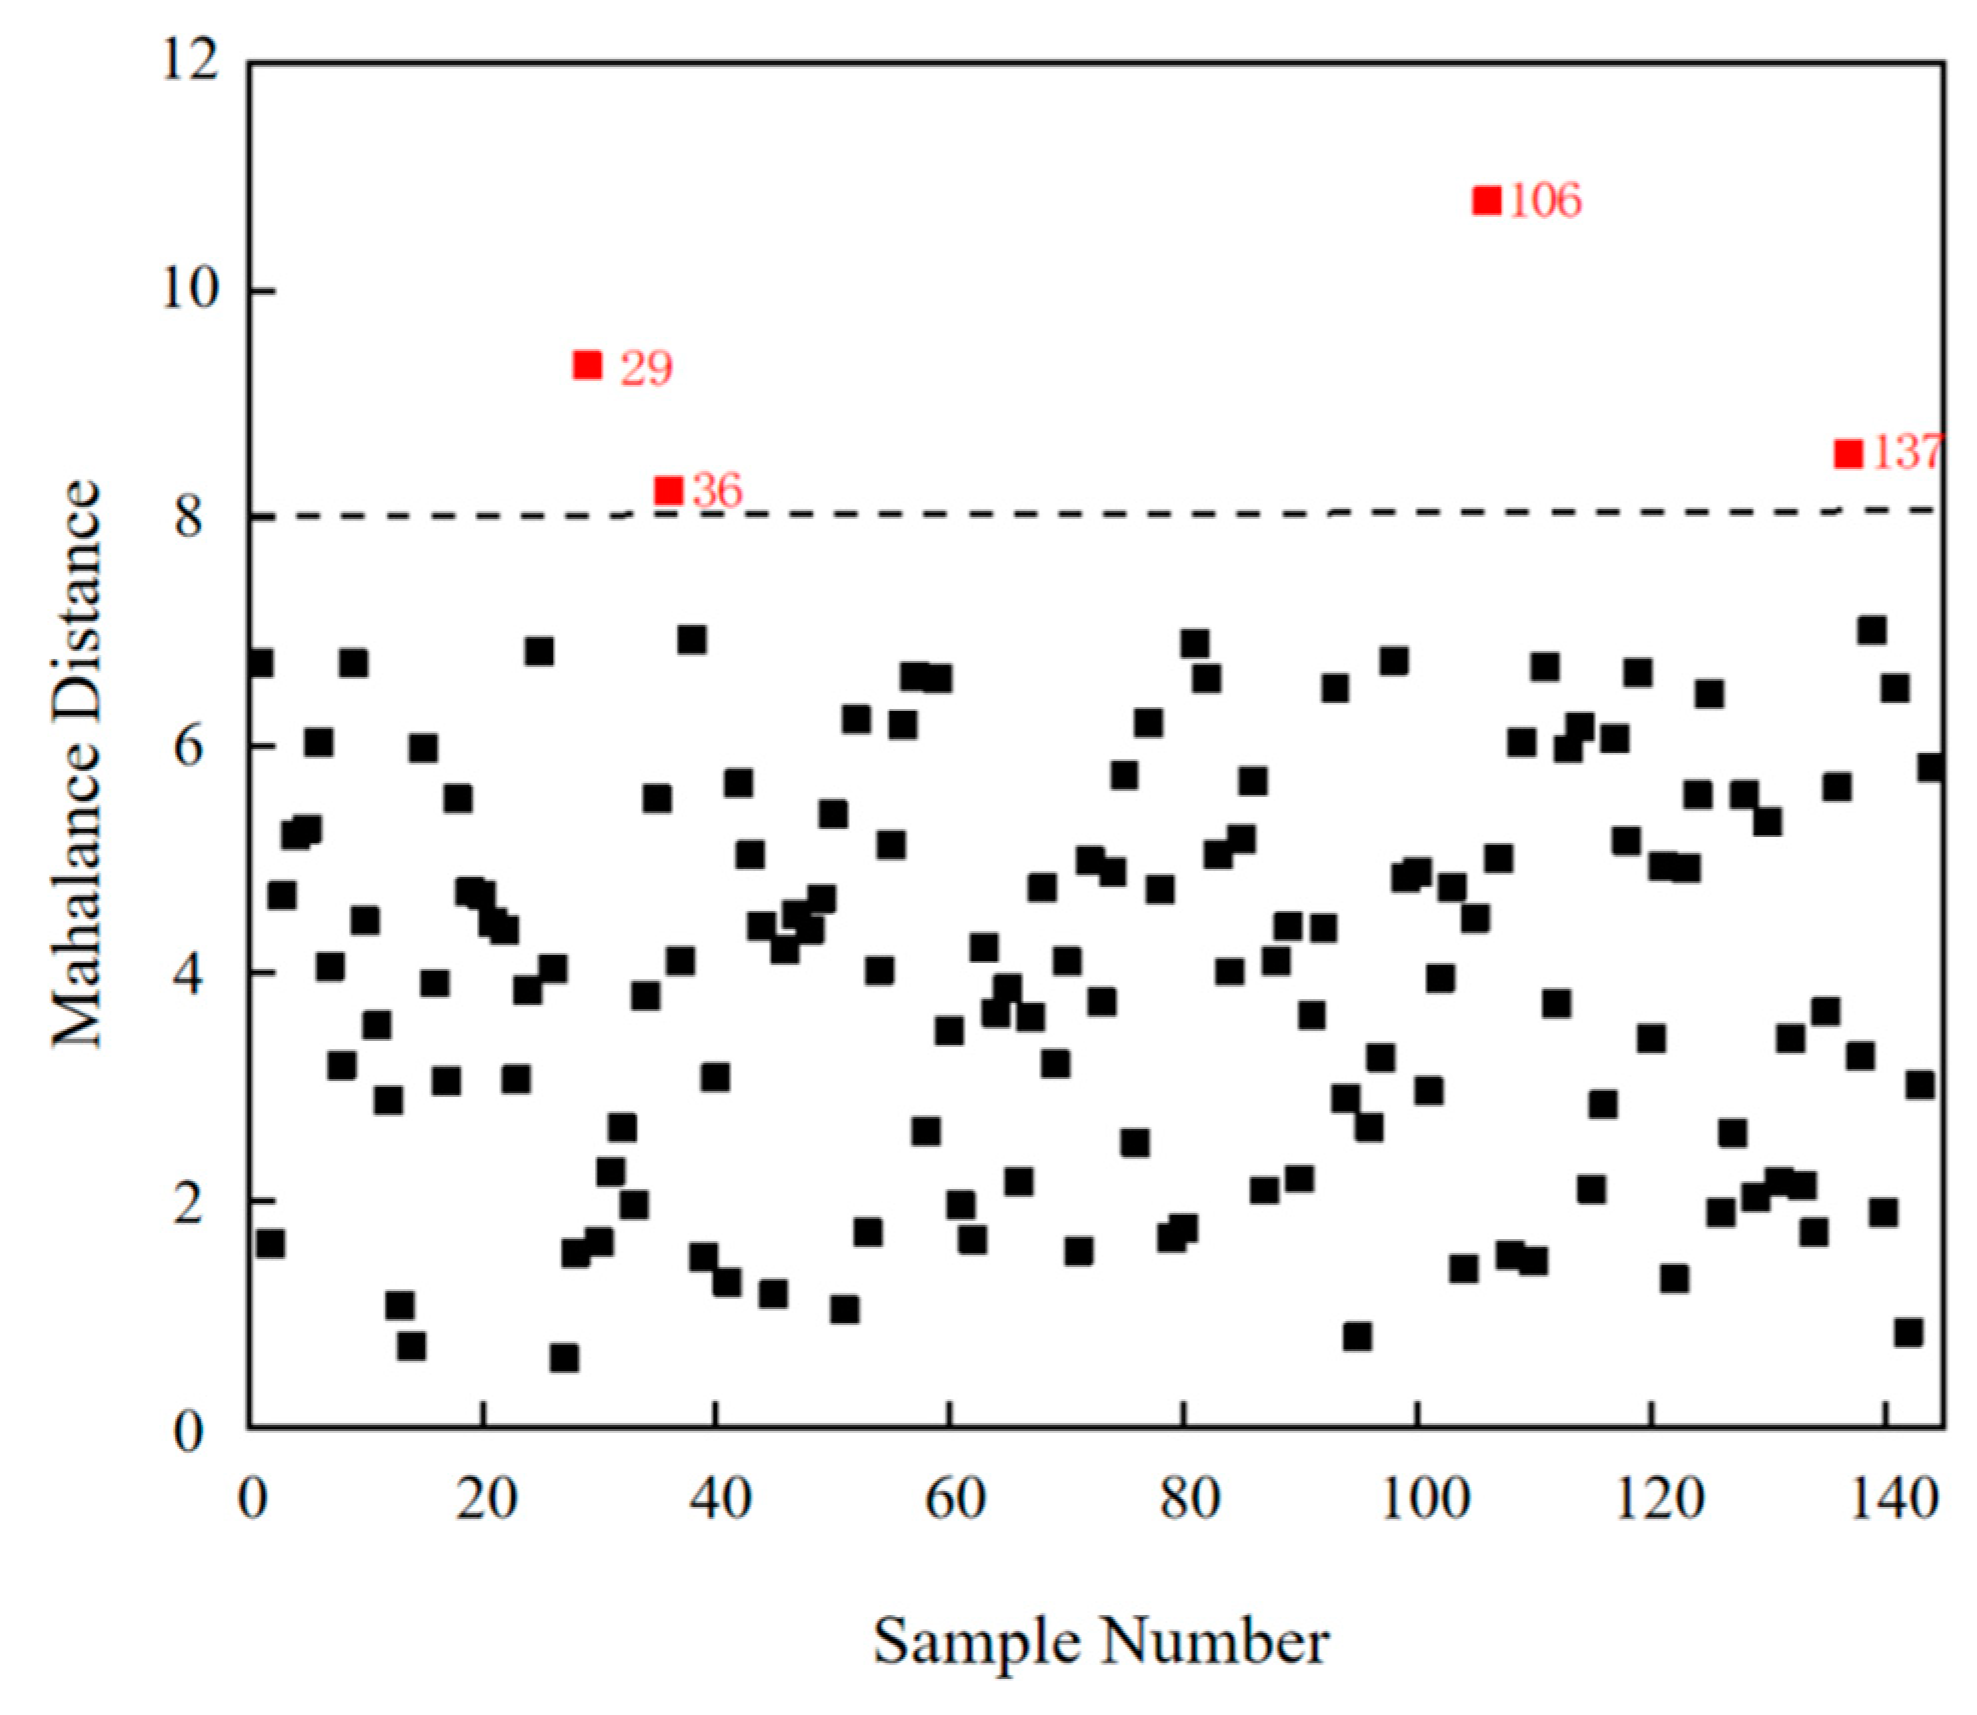
3.3.1. Mahalanobis Distance Method—Removal of Spectral Outlier Samples

To calculate the Mahalanobis distance, the original spectra needed to be dimensionally reduced by PCA in order to decrease the number of variables. Figure 2 shows the comparison of the cumulative contribution of the first six principal components obtained from four different spectral preprocessing methods. As shown in Figure 2, the contribution rate of the first principal component of the different preprocessed spectra did not exceed 76%, indicating that the first principal component could not be representative of the original spectra. Therefore, it was necessary to add more principal components to increase the contribution rate. The results showed that the first four principal components of the spectra after the 1-Der preprocessing had the highest contribution rate, reaching 98.47%. Combined with the clustering effect of the principal components, the Mahalanobis distance of samples was calculated by the scores of the first four principal components after 1-Der preprocessing of the spectra.
Figure 3 shows the scatter plot of the Mahalanobis distance for the test samples. A threshold coefficient of 3.5 was selected, and the threshold for rejection based on the Mahalanobis distance was eight according to Magwaza’s research [21]. Among the 144 samples of T. grandis kernels, the Mahalanobis distance of 140 samples was smaller than eight, and they were randomly distributed within the range. This indicated that these 140 samples met the experimental standards. The samples marked in red had a Mahalanobis distance greater than eight and were considered outlier samples. Four outlier samples numbered 29, 36, 106, and 137 were removed from the sample set.

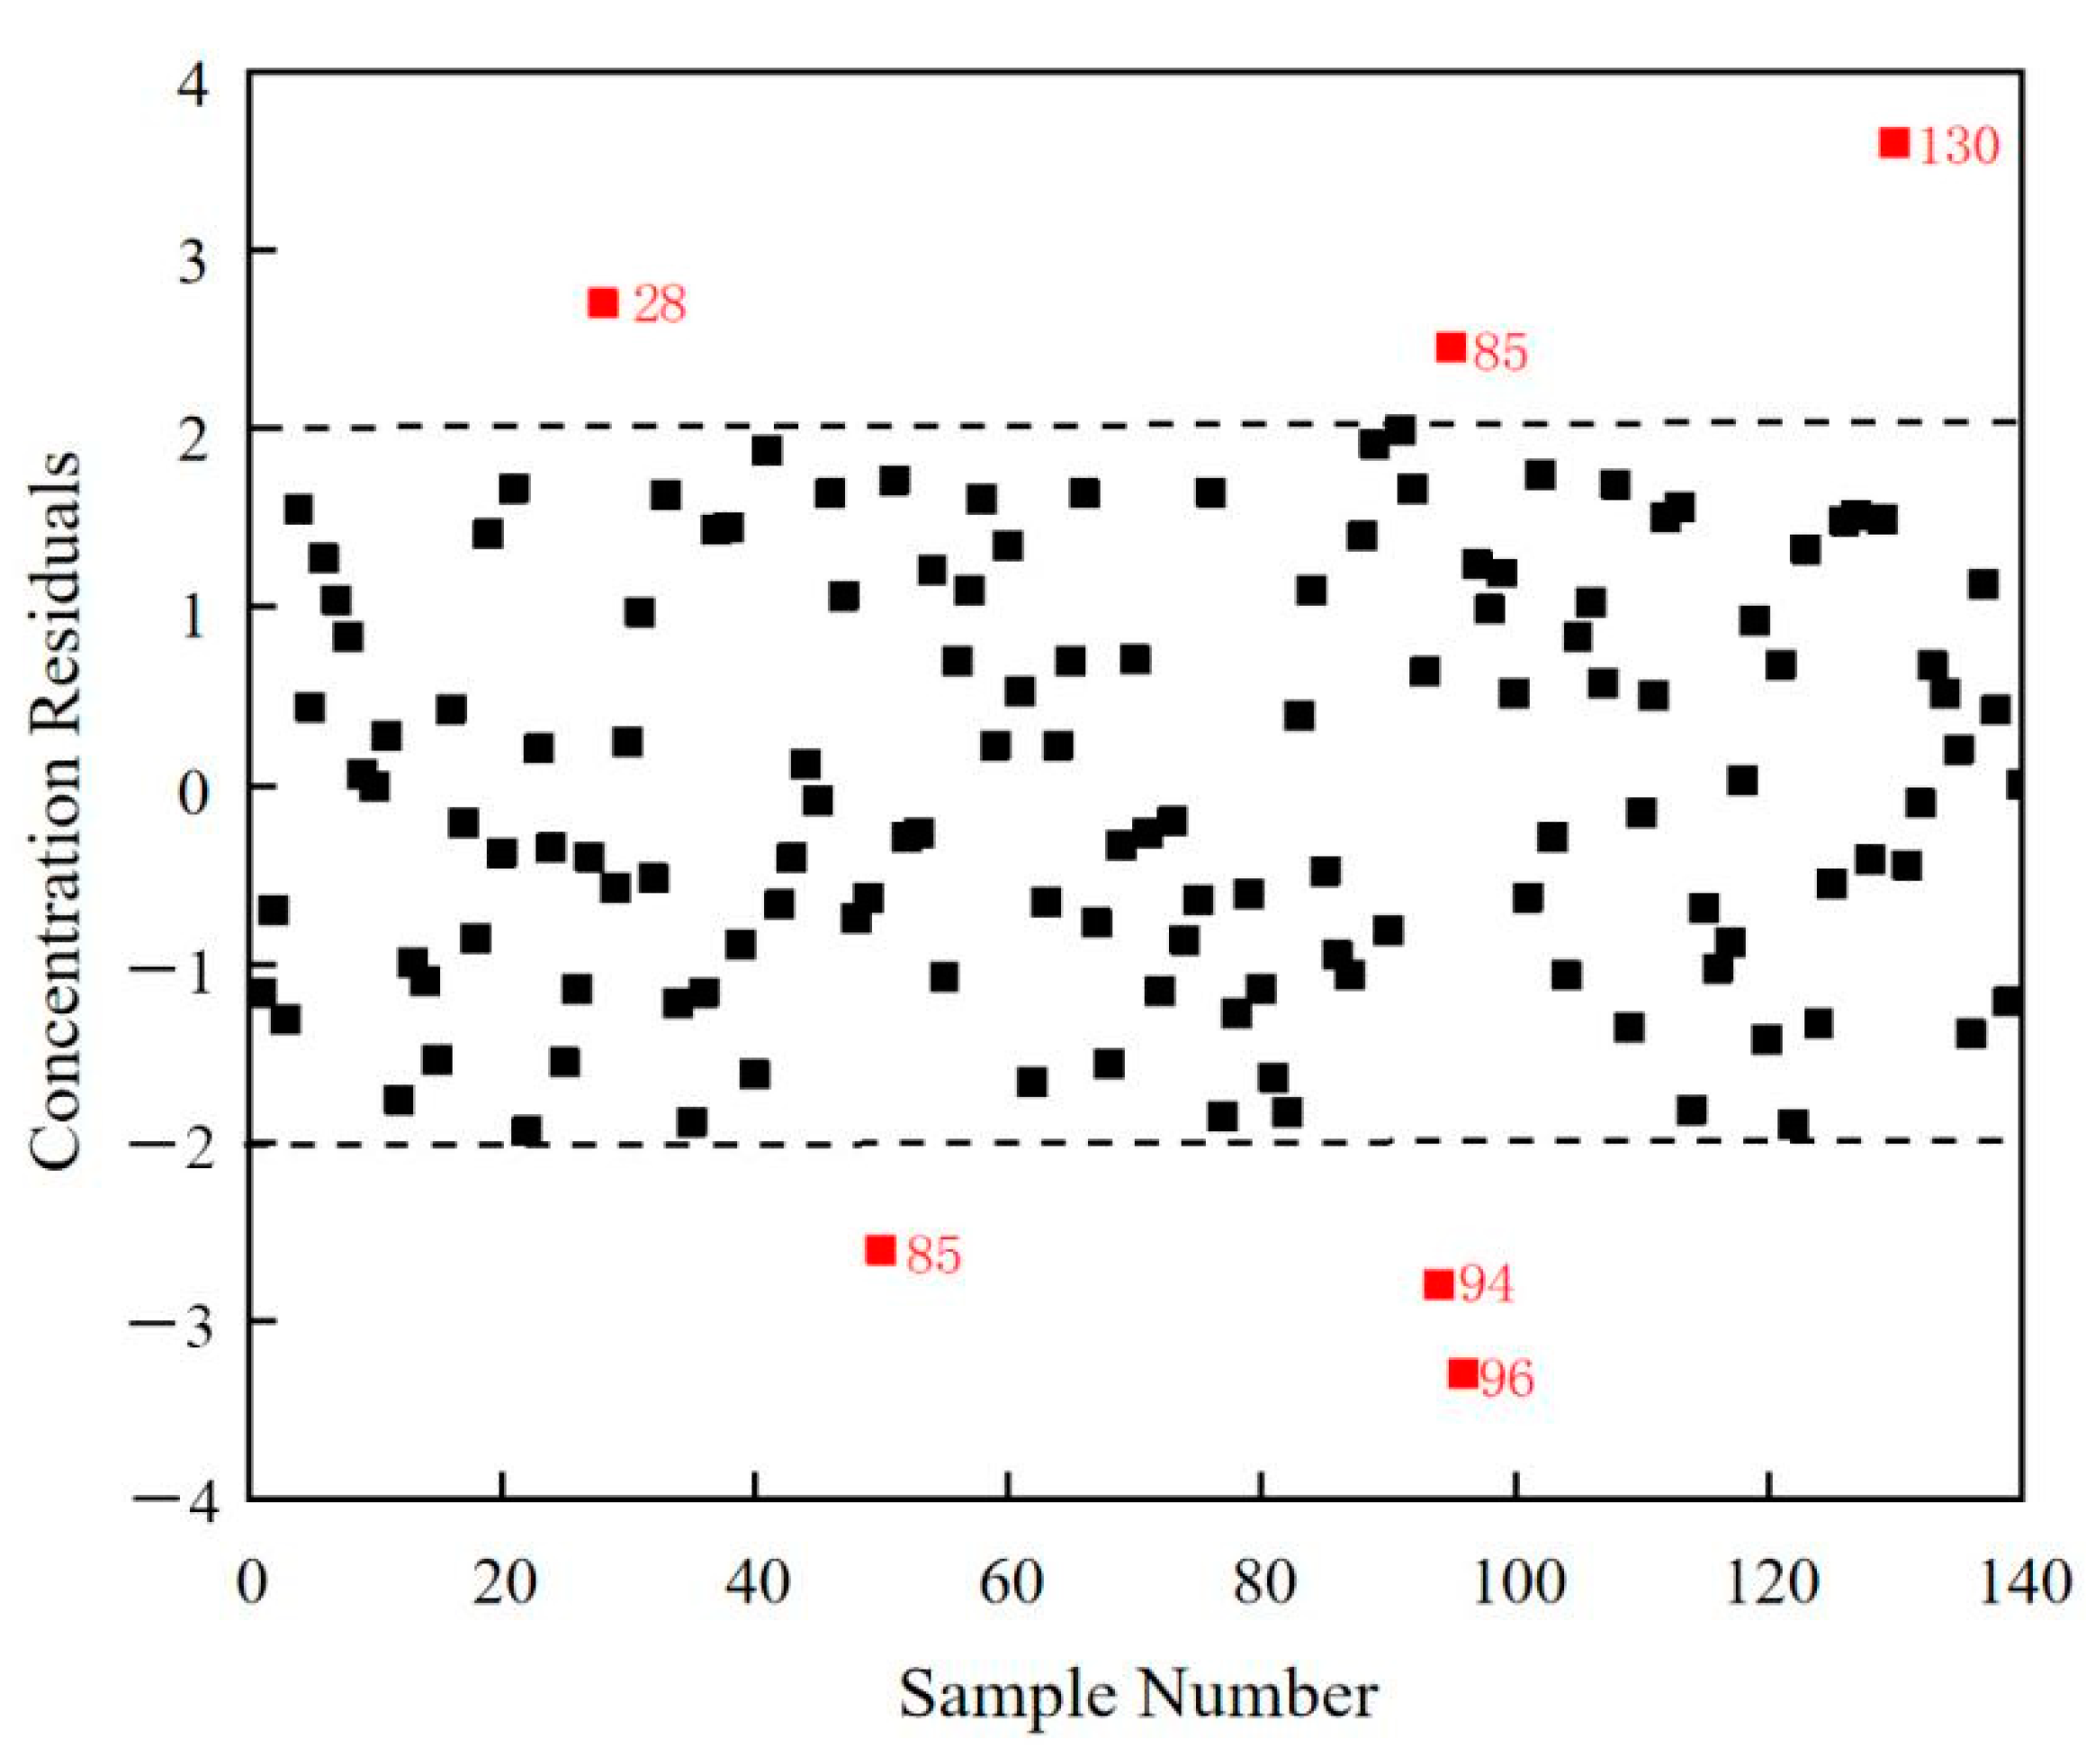
3.3.2. Concentration Residual Method—Removal of the Chemical Outlier Samples

Figure 4 shows the residual concentration distribution of the 140 T. grandis kernel samples after four spectral outlier samples were removed. The concentration difference was set at ±2. It was evident from Figure 4 that the residuals of 134 samples fell into the range of −2 to 2, which indicated that the chemical values of these samples were consistent with the experimental results. However, six samples, including samples numbered 28, 50, 94, 95, 96, and 130, exhibited an absolute residual greater than two, indicating that they were chemical outlier samples. The results of removing the outlier spectral and chemical samples are shown in Table 2.

3.4. Sample Division

In this study, the SPXY method was used to divide the spectral data after removing the outlier samples. The 137 samples were randomly separated into a calibration set and a validation set with a ratio of 3:1, and the division results are shown in Table 3. It could be seen that the water content distribution range of the validation set of samples (15.82–26.60%) was smaller than those in the calibration set (15.47–28.77%), indicating that the sample division could effectively avoid the problem of model adaptability caused by the validation set samples exceeding the range of the calibration set.

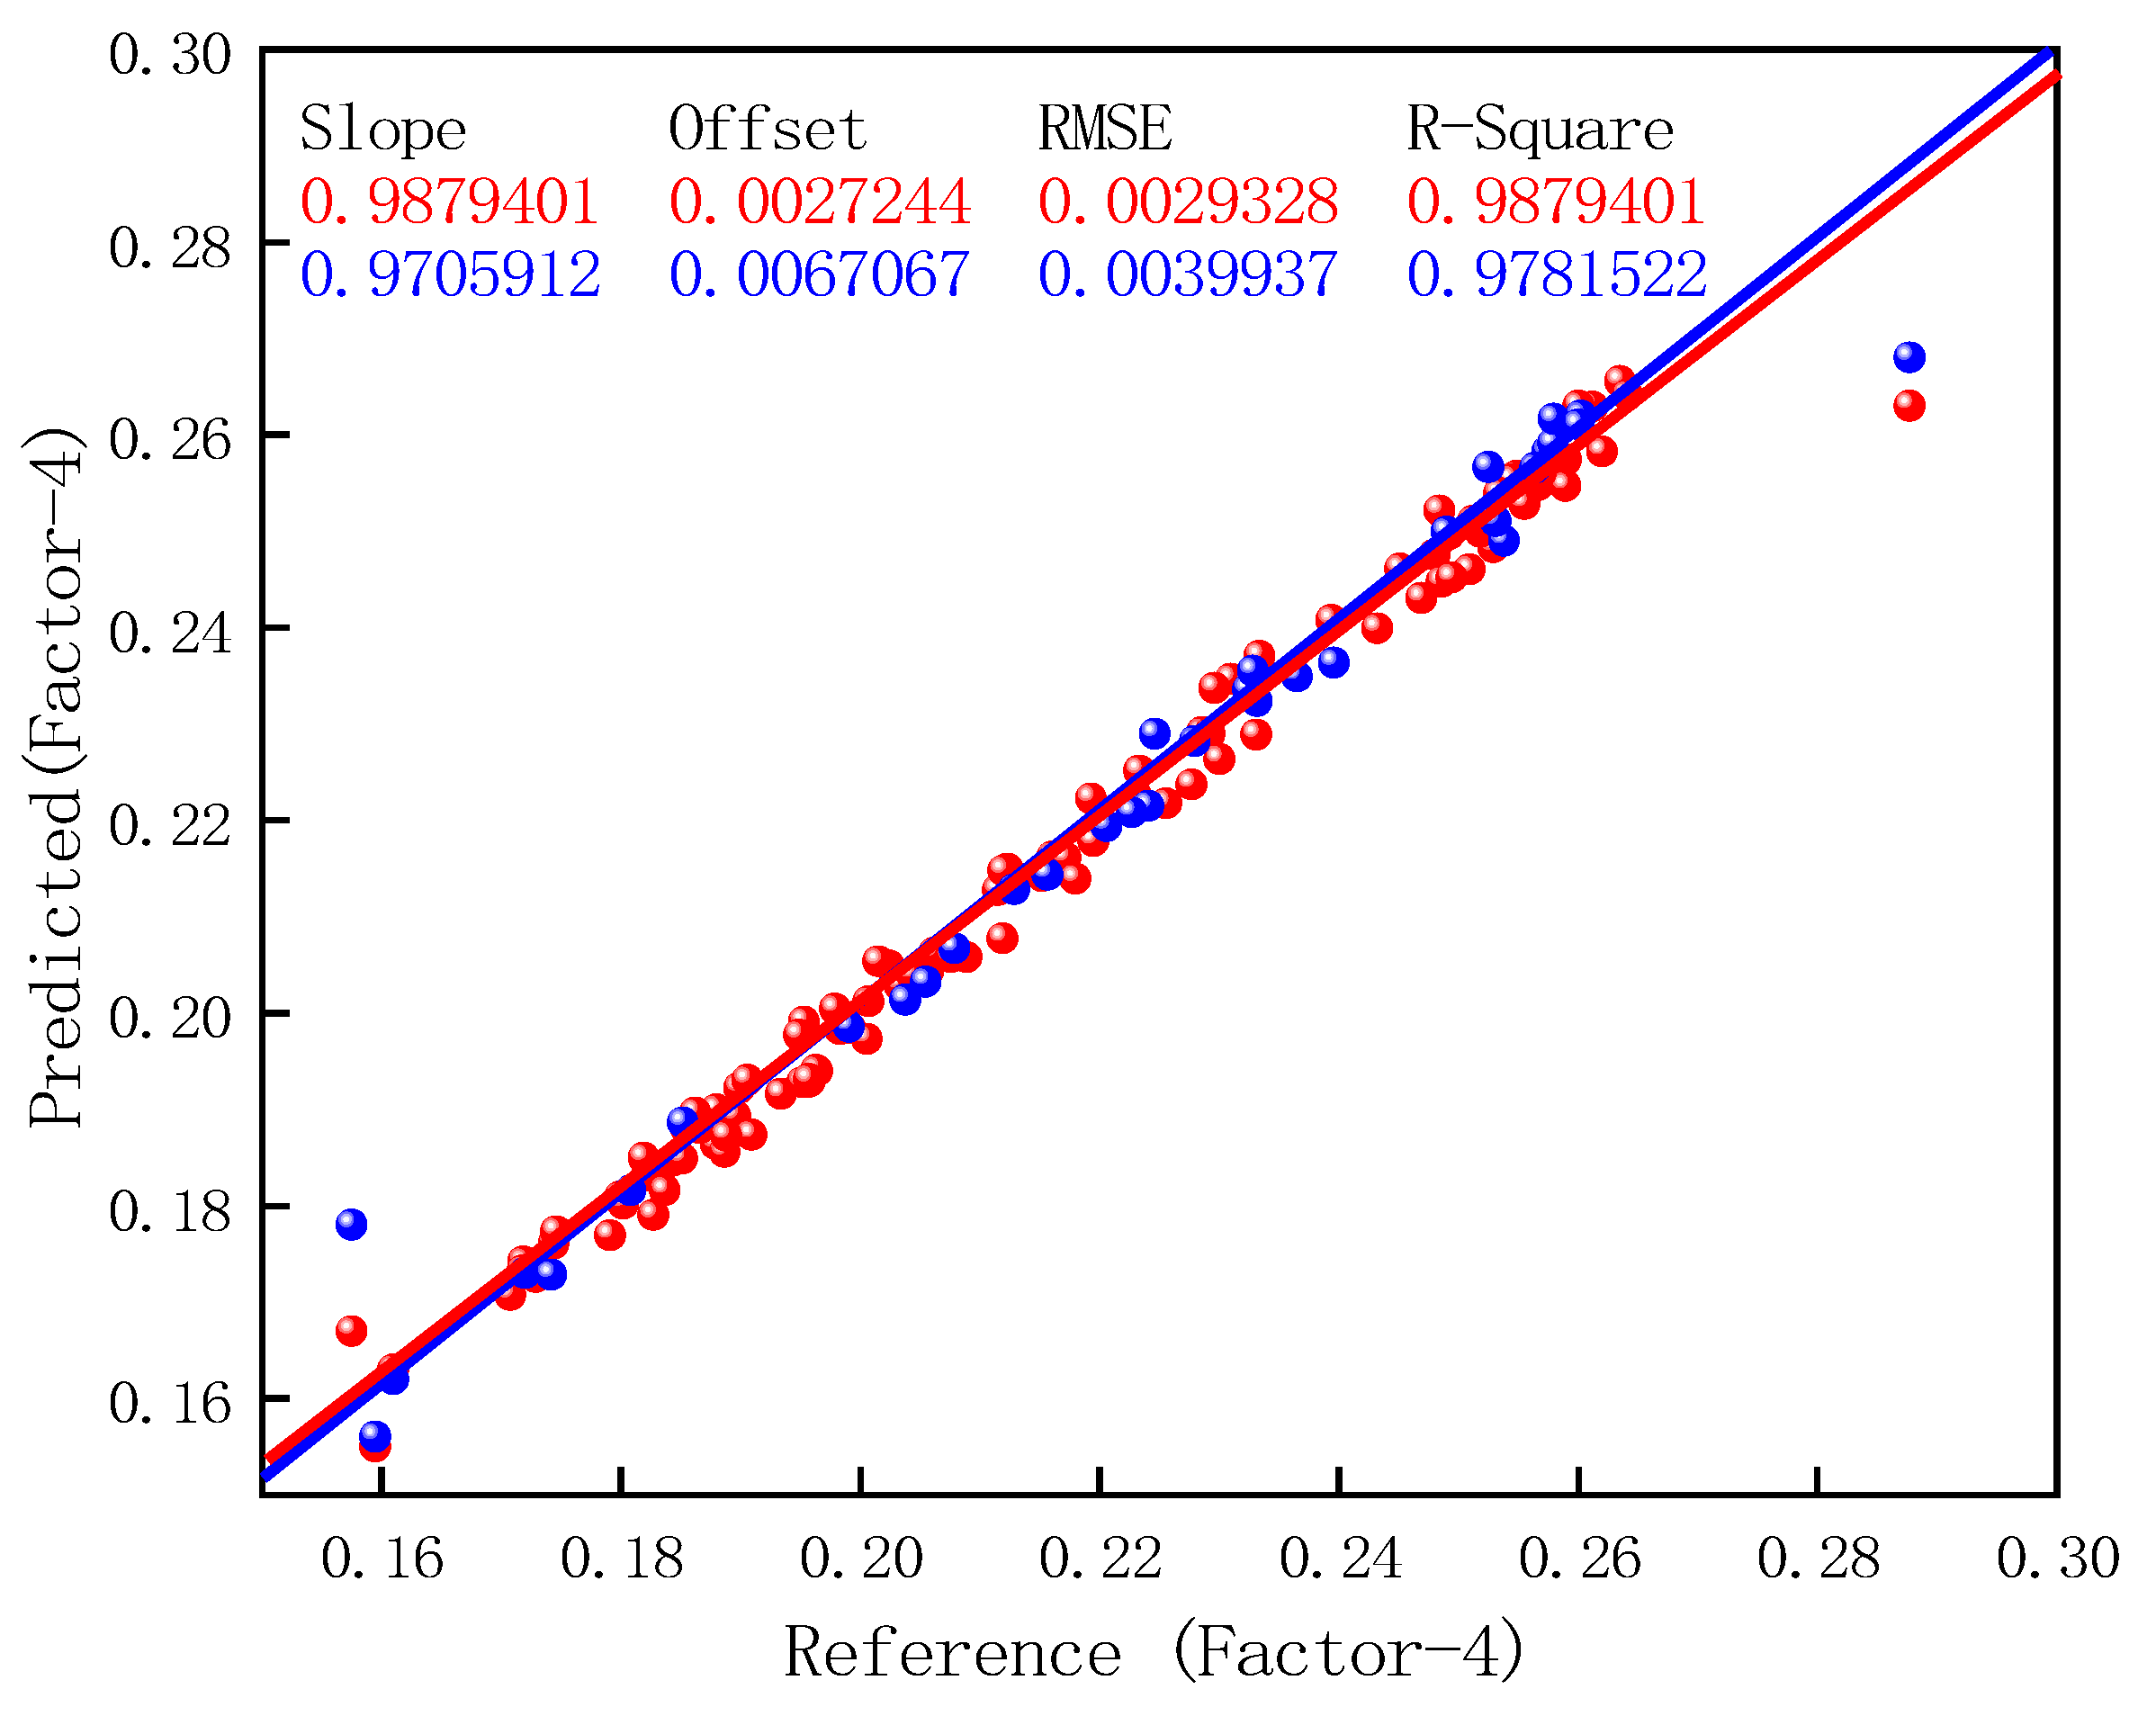
3.5. Establishment and Optimization of the Near-Infrared Calibration Model for the Water Content of T. grandis Kernels

The modeling results for the water content of T. grandis kernels are shown in Table 4. According to the data in Table 4, the PLS model established by the original spectrum of T. grandis kernels had a correlation coefficient of the calibration set at R2c = 0.8963, and the RMSEC was 0.0128; the corresponding correlation coefficient of the cross validation was R2cv = 0.8773, and the RMSECV was 0.0147. This concluded that the model established by the original spectrum had a certain accuracy, and that further improvement was possible. Some preprocessing methods decreased the accuracy of the PLS model for the water content of T. grandis kernels according to Table 4. Taking the PLS model of water content of the T. grandis kernels after 1-Der preprocessing as an example, the R2c, RMSEC, R2cv, and RMSECV were 0.8326, 0.0196, 0.7948 and 0.0245, respectively. Compared with those of the PLS model established by the original spectrum, the accuracy (R2c and R2cv) of the model established after the 1-Der preprocessing decreased, while the error (RMSEC and RMSECV) increased. The accuracy of the model decreased to different degrees after 1-Der, 2-Der, and SG pre-processing. This may be due to the loss of spectral data for the corresponding band of the water content while reducing the noise caused by preprocessing.
However, the R2c and R2cv of the PLS model established after preprocessing by the baseline, SNV, MSC, 1-Der+SNV, and 2-Der+SNV increased slightly. This indicated that a proper preprocessing method could improve the accuracy of the model. The optimal calibration model for the water content of T. grandis kernels was established after SNV pre-processing. The R2c, RMSEC, R2cv, and RMSECV of this model were 0.9879, 0.0029, 0.9706 and 0.0040, respectively. The optimal calibration model for the water content of T. grandis kernels is shown in Figure 5. The blue dots represent the calibration set data, and the red dots represent the validation set data. The scatter plots of the calibration set and the validation set were basically linear, indicating that the PLS model had high accuracy and reliability in predicting the water content of T. grandis kernels.
An external prediction set with 36 samples was performed to examine the accuracy of the calibration model. The prediction results are shown in Figure 6. It could be seen that the scatter plot was basically distributed on both sides of the fitting line without obvious deviation points, and the data prediction results were basically consistent with the measured results. The prediction correlation coefficient R2p of the T. grandis kernel water content was 0.9625, and the root mean square error of the prediction set (RMSEP) was 0.0052. The prediction correlation coefficient of the model was greater than 0.95, indicating that its prediction performance was excellent and could achieve accurate prediction.

3.6. Comparison of the Near-Infrared Spectroscopy Models for Water Content in Different Foods

Table 5 lists different near-infrared spectral models for the water content in different foods. The optimal processing method for chestnuts was obtained by successive preprocessing of 1-Der plus SG (5-point smoothing). The correlation coefficient (R2) and RMSEC of the water calibration model for chestnuts were 0.9650 and 0.0119, respectively [22]. A study reported that the optimal PLS model for water content prediction in walnut was obtained by successive preprocessing of SNV plus 1-Der. The correlation coefficient (R2) and RPD of the water calibration model for walnut were 0.965 and 4.14, respectively [23]. In general, near-infrared spectroscopy is widely used for water content modeling in agriculture and food fields. In addition to peanuts, near-infrared spectral models for water content have been established in soybean, barley, and raw coffee bean [24,25,26]. In terms of optimal preprocessing methods, SNV and derivatives have been important preprocessing methods for spectral data in establishing water content prediction models [22,24]. All the optimal processing methods include one or both of them. In this study, the SNV was the best preprocessing method. SNV processing could eliminate the baseline shift in spectroscopy data caused by the differences in sample size and shape. In terms of the research objects, the T. grandis kernels and chestnuts were similar in shape and shell. The correlation coefficient (R2) and RMSEC of the water calibration model for T. grandis kernels were 0.988 and 0.0029, respectively. Among all NIR moisture models, the RPD of the water prediction model for T. grandis kernels was the highest, which indicated that the accuracy of the T. grandis kernels near-infrared spectroscopy model for water content was slightly improved.

4. Conclusions

(1)
This study measured the water content of T. grandis kernels samples and obtained their corresponding near-infrared spectral information. The water content of the T. grandis kernels samples ranged from 15.47% to 28.77%. Two obvious absorption peaks of water-content-related groups were located at 1200 nm and 1470 nm, which laid the foundation for the calibration of the near-infrared quantitative model of the water content.
(2)
A quantitative water content model of T. grandis kernels was established using the full spectrum after 10 outlier samples were removed by the Mahalanobis distance method and concentration residual analysis. The optimal calibration model for the water content of T. grandis kernels was the PLS model based on SNV preprocessing. The R2c, RMSEC, R2cv, and RMSECV of this model were 0.9879, 0.0029, 0.9706, and 0.0040, respectively.
(3)
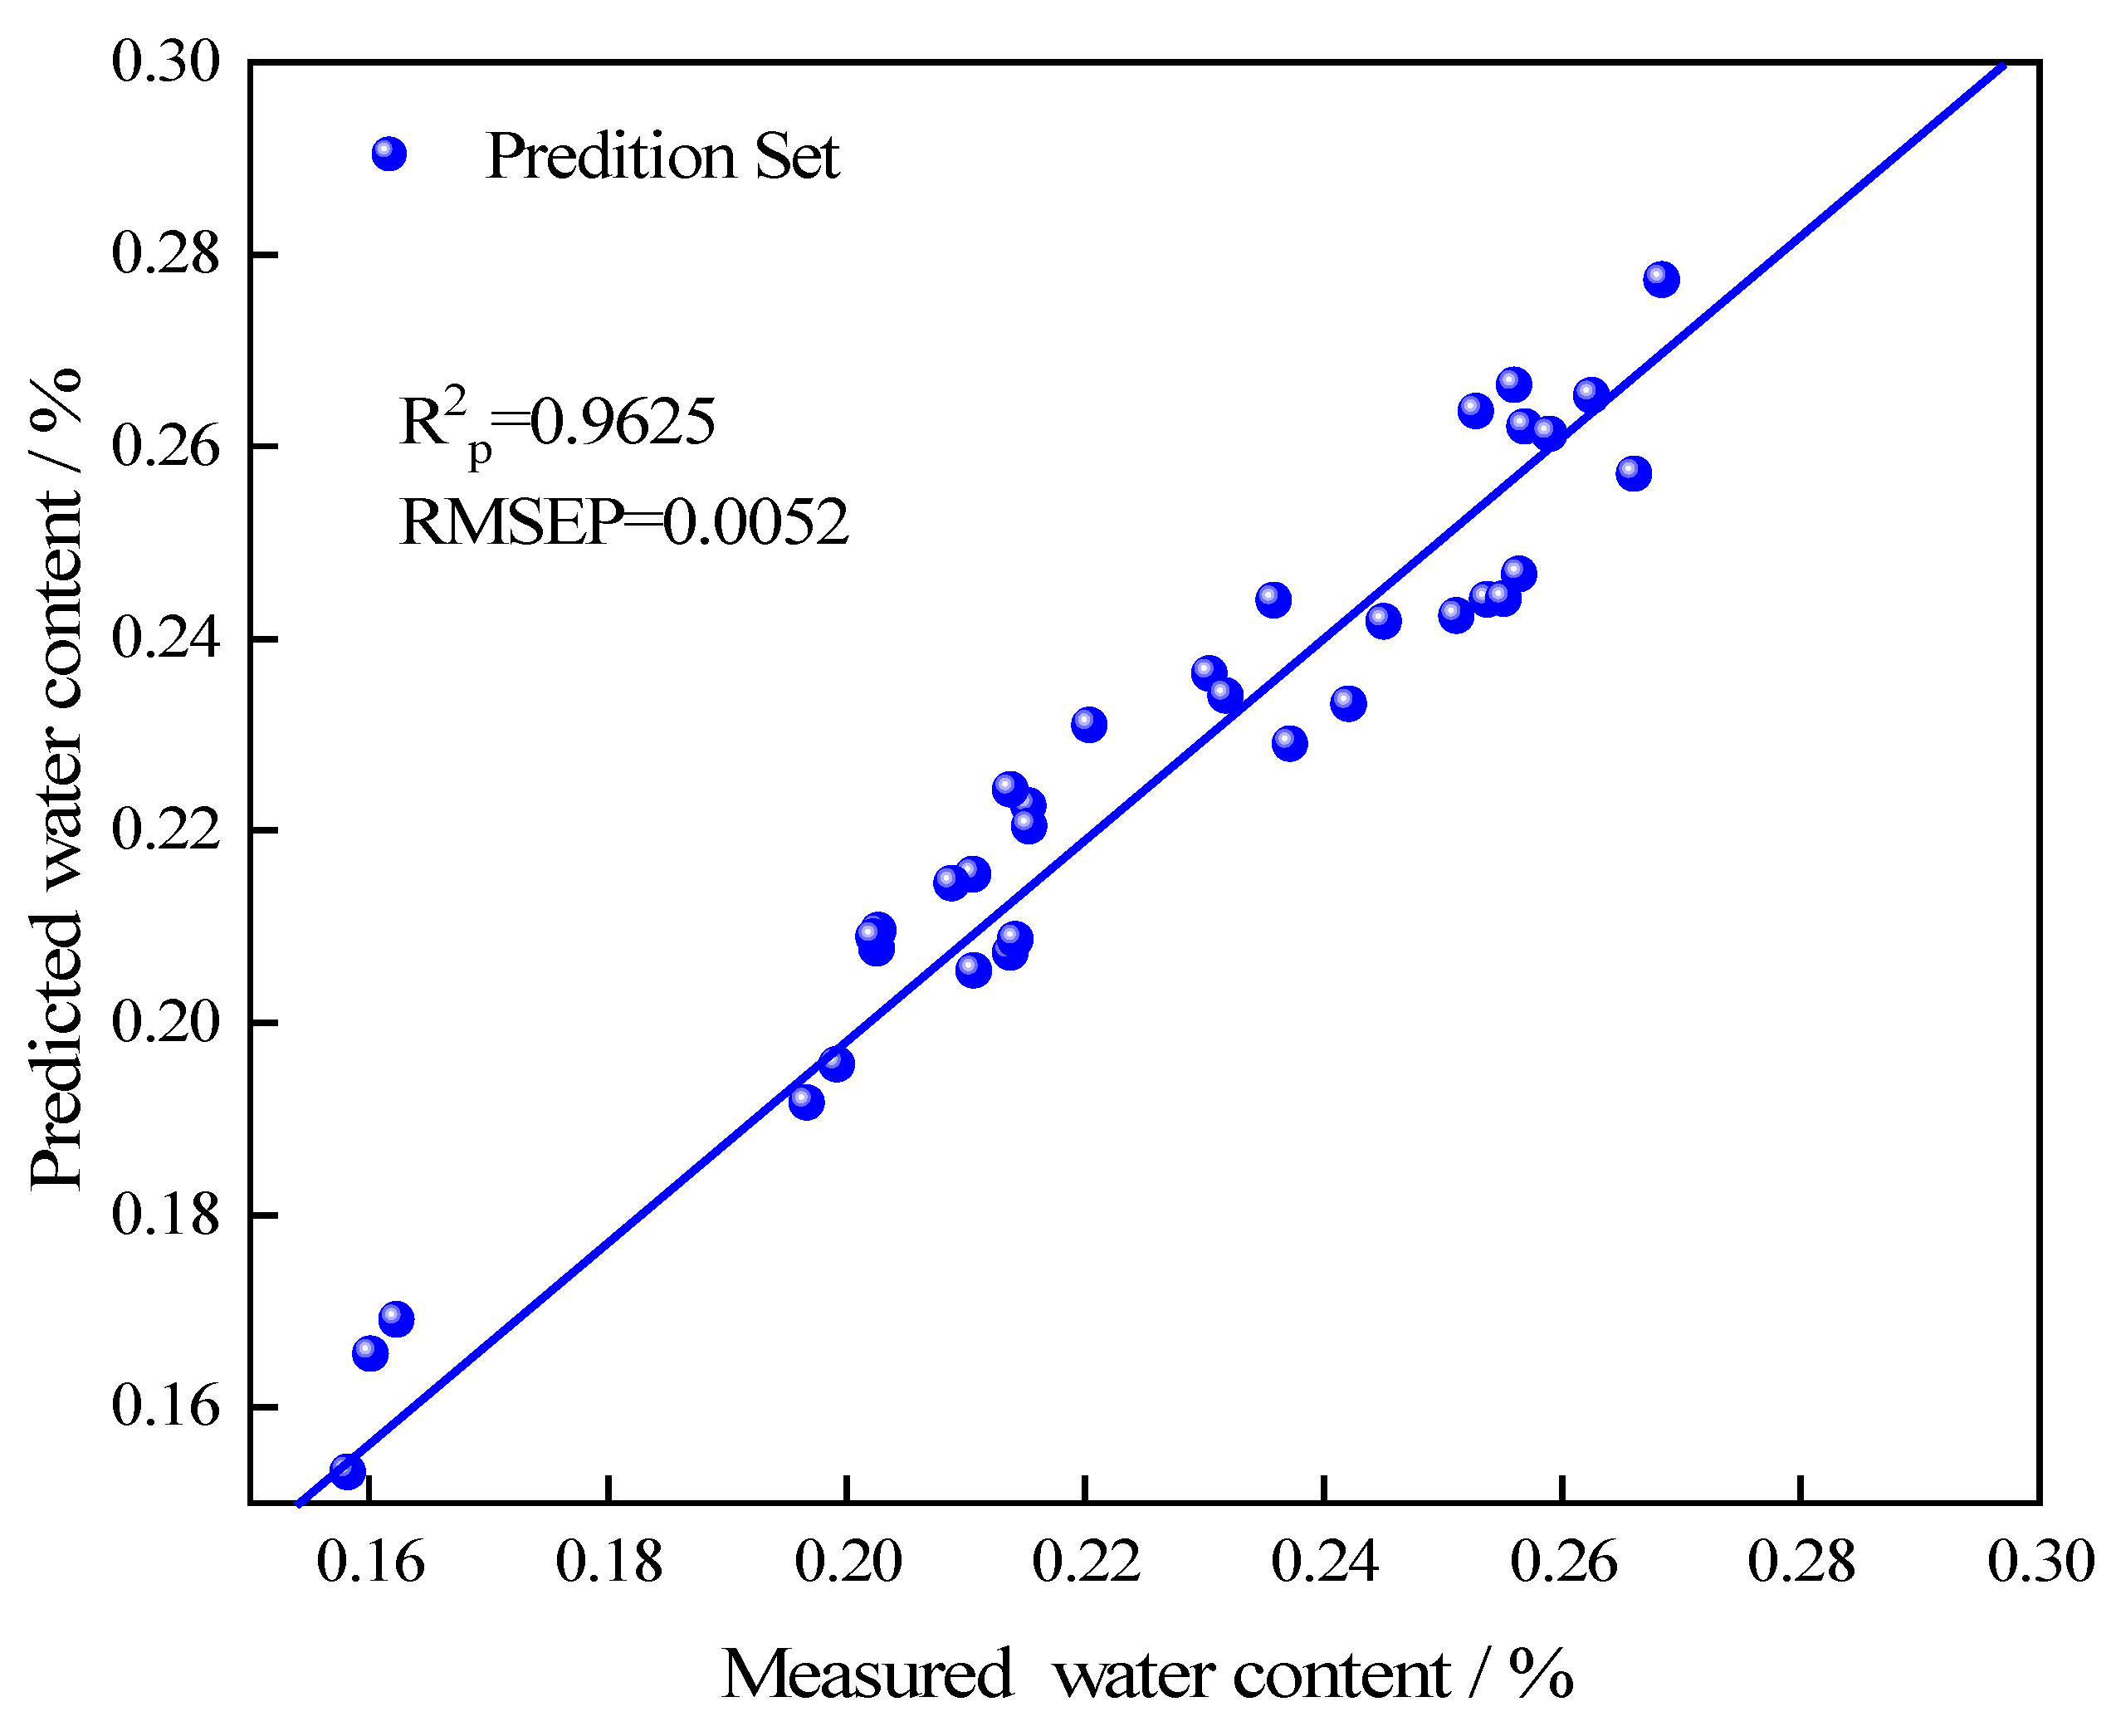
The samples from the prediction set were used to test the model. The results showed that the prediction correlation coefficient (R2p) of the water content was 0.9625, which indicated that the model had the ability to achieve accurate water content prediction for T. grandis kernels. Near-infrared spectroscopy can be used for rapid nondestructive water determination of nuts. In the future, quantitative determination of other nutrients (such as protein and fat) in T. grandis kernels based on near-infrared spectroscopy could be established, so as to develop a more comprehensive product index evaluation system for T. grandis kernels.

Author Contributions

J.X. and Y.H. Experiments, Writing—original draft, Funding acquisition; S.G., Y.S. and L.B. Data curation, Writing—original draft; X.Y. and M.H. Validation, Writing—review &and editing; L.X. and C.Z. Supervision, Conceptualization, Data curation, Funding acquisition, Validation, Visualization, Writing—original draft, review and editing. All authors have read and agreed to the published version of the manuscript.

Funding

National Undergraduate Training Program for Innovation and Entrepreneurship, China (No: 202210341043).

Institutional Review Board Statement

Not applicable.

Informed Consent Statement

Not applicable.

Data Availability Statement

Data available on request.

Acknowledgments

The authors acknowledge the use of laboratories and equipment from the College of Optimal, Mechanical and Electrical Engineering of Zhejiang A&F University and the National Wood Research Center.

Conflicts of Interest

The authors declare no conflict of interest.

References

  1. He, Z.; Zhu, H.; Li, W.; Zeng, M.; Wu, S.; Chen, S.; Qin, F.; Chen, J. Chemical components of cold pressed kernel oils from different Torreya grandis cultivars. Food Chem. 2016, 209, 7. [Google Scholar] [CrossRef] [PubMed]
  2. Cao, W.; Xiao, Q.; Ye, X.; Zhang, S.; Ye, W.; Tu, C.; Zhu, X.; Yu, W.; Li, J. Presentation on Pretreatment Techniques and Moisture Content of Torreya grandis Merrillii Seed. J. Zhejiang For. Sci. Technol. 2022, 42, 81–86. [Google Scholar]
  3. Guan, S.; Shang, Y.; Zhao, C. Storage Time Detection of Torreya grandis Kernels Using Near Infrared Spectroscopy. Sustainability 2023, 15, 7757. [Google Scholar] [CrossRef]
  4. Rabanera, J.D.; Guzman, J.D.; Yaptenco, K.F. Rapid and Non-destructive measurement of moisture content of peanut (Arachis hypogaea L.) kernel using a near-infrared hyperspectral imaging technique. J. Food Meas. Charact. 2021, 15, 3069–3078. [Google Scholar] [CrossRef]
  5. Chala, A.T.; Matula, S.; Batkova, K.; Dolezal, F. Evaluation of methods for water and non-volatile LNAPL contentmeasurement in porous media. Soil Water Res. 2019, 14, 10. [Google Scholar] [CrossRef]
  6. Gutierrez-Cano, J.D.; Hamilton, I.E.; Catala-Civera, J.M.; Bows, J.; Penaranda-Foix, F.L. Effect of water content on the dynamic measurement of dielectric properties of food snack pellets during microwave. J. Food Eng. 2018, 232, 8. [Google Scholar] [CrossRef]
  7. Zhang, M.; Zhao, C.; Shao, Q.; Yang, Z.; Zhang, X.; Xu, X.; Hassan, M. Determination of water content in corn stover silage using near-infrared spectroscopy. Int. J. Agr. Biol. Eng. 2019, 12, 143–148. [Google Scholar] [CrossRef]
  8. Hao, Z.; Peng, Y.; Zhang, H.; Zhang, R.; Zhang, R. Nondestructive Testing Research of Wen 185 Walnut Water in South Xinjiang by NIRS. J. Anhui Agric. Sci. 2014, 42, 7191–7193. [Google Scholar]
  9. Jin, H.; Bian, K. Determinaton of Moisture of Wheat Flour Using near Infrared Spectroscopy. J. Chin. Cereals Oils Assoc. 2010, 25, 109–112. [Google Scholar]
  10. Ozdemir, I.S.; Orturk, B.; Celik, B.; Santepe, Y.; Aksoy, H. Rapid, simultaneous and non-destructive assessment of the moisture, water activity, firmness and SO2 content ofthe intact sulphured-dried apricot susing FT-NIRS and chemometrics. Talanta 2018, 186, 6. [Google Scholar] [CrossRef]
  11. Yang, C.; Yu, H.; Guan, S.; Wang, C.; Zhang, J.; Tang, Y.; Wang, X.; Wu, Q. Prediction of Moisture Content in Single Peanut Seed by near Infrared Reflectance Spectroscopy. J. Peanut Sci. 2012, 41, 6–9. [Google Scholar]
  12. Liu, C.; Hu, Y.; Wu, S.; Sun, X.; Du, S.; Miao, Y.; Du, Y. Outlier sample eliminating methods for building calibration model of near infrared spectroscopy analysis. J. Food Sci. Technol. 2014, 32, 74–79. [Google Scholar]
  13. Min, S.; Li, N.; Zhang, M. Outlier Diagnosis and Calibration Model Optimization for Near Infrared Spectroscopy Analysis. Spectrosc. Spect. Anal. 2004, 24, 1205–1209. [Google Scholar]
  14. Chen, B.; Zou, X.; Zhu, W. Eliminating outlier samples in near-infrared model by method of PCA-mahalanobis distance. J. Jiangsu Univ. Nat. Sci. Ed. 2008, 29, 277–292. [Google Scholar]
  15. Yin, B.; Shi, Y.; Sun, R.; Wang, W. Outlier Samples Detection Method for NIR Multicomponent Analysis. Trans. Chin. Soc. Agric. Mach. 2015, 46, 122–128. [Google Scholar]
  16. Shi, L.; Zhang, J.; Wang, Y.; Mingdeng, S. Research for eliminating outerlier samples in near-infraredspectroscopy by method of mahalanob distance-concentration residual. J. Chin. Agric. Mech. 2016, 37, 99–103. [Google Scholar]
  17. Zhu, R.; Duan, H.; Wang, L.; Yao, X.; Xu, C. Comparative research on hyperspectral detection model of beef tenderness with different sample set partitioning methods. Food Ferment. Ind. 2016, 42, 189–192. [Google Scholar]
  18. Galvão, R.K.H.; Araujo, M.C.U.; José, G.E.; Pontes, M.J.C.; Silva, E.C.; Saldanha, T.C.B. A method for calibration and validation subset partitioning. Talanta 2005, 67, 736–740. [Google Scholar] [CrossRef]
  19. Peng, D.; Yang, J.; Shi, C.; Chen, M. Determination of oil and moisture content in sunflower seeds based on near infrared diffuse reflectance spectroscopy. Cereals Oils 2022, 35, 142–146. [Google Scholar]
  20. Bobelyn, E.; Serban, A.; Nicu, M.; Lammertyn, J.; Nicolai, B.M.; Saeys, W. Postharvest quality of apple predicted by NIR-spectroscopy: Study of the effect of biological variability on spectra and model performance. Postharvest Biol. Technol. 2010, 55, 133–143. [Google Scholar] [CrossRef]
  21. Magwaza, L.S.; Opara, U.L.; Nieuwoudt, H.; Cronje, P.J.R.; Saeys, W.; Nicolai, B. NIR Spectroscopy Applications for Internal and External Quality Analysis of Citrus Fruit—A Review. Food Bioprocess Technol. 2012, 5, 20. [Google Scholar] [CrossRef]
  22. Hu, J.; Ma, X.; Liu, L.; Wu, Y.; Ouyang, J. Rapid evaluation of the quality of chestnuts using near-infrared reflectance spectroscopy. Food Chem. 2017, 231, 7. [Google Scholar] [CrossRef] [PubMed]
  23. Yi, J.; Sun, Y.; Zhu, Z.; Liu, N.; Lu, J. Near-infrared reflectance spectroscopy for the prediction of chemical composition in walnut kernel. Int. J. Food Prop. 2017, 20, 10. [Google Scholar] [CrossRef]
  24. Zhu, Z.; Chen, S.; Wu, X.; Xing, C.; Yuan, J. Determination of soybean routine quality parameters using near-infrared spectroscopy. Food Sci. Nutr. 2018, 6, 10. [Google Scholar] [CrossRef]
  25. Macedo, L.L.; Araujo, C.D.S.; Vimercati, W.C.; Hein, P.R.G.; Pimenta, C.J.; Saraiva, S.H. Evaluation of chemical properties of intact green coffee beans usingnear-infrared spectroscopy. J. Sci. Food Agr. 2021, 101, 8. [Google Scholar] [CrossRef] [PubMed]
  26. Cozzolino, D.; Roumeliotis, S.; Eglinton, J. Monitoring water uptake in whole barley (Hordeumvulgare L.) grain during steeping using near infrared reflectance spectroscopy. J. Food Eng. 2013, 114, 5. [Google Scholar] [CrossRef]
Figure 1. Near-infrared spectra of the T. grandis kernels. A total of 144 lines appears in the figure, each line represents the absorption value of single sample under the NIRS.
Sustainability 15 12423 g001
Figure 2. Cumulative contribution rate of the first six principal components of different preprocessed spectra.
Sustainability 15 12423 g002
Figure 3. Mahalanobis distance distribution of the samples. The red squares represent abnormal samples after filtering by the Mahalanobis method while the black squares represent normal samples.
Sustainability 15 12423 g003
Figure 4. Concentration residual distribution of the samples after four spectral outlier samples were removed. The red squares represent abnormal samples after filtering by the Concertration Residual method while the black squares represent normal samples.
Sustainability 15 12423 g004
Figure 5. The optimal model of water content for the T. grandis kernels.
Sustainability 15 12423 g005
Figure 6. Correlations between the measured and predicted water content of the T. grandis kernels. R2p is the prediction correlation coefficient, and RMSEP is the root mean square error of the prediction set. R2p and RMSEP represent the accuracy of the model prediction performance.
Sustainability 15 12423 g006
Table 1. Measurement results of the water content in T. grandis kernels.
ComponentNumber of SamplesMaximum/%Minimum/%Average/%Standard Deviation
Water content18028.7715.4722.580.26
Table 2. T. grandis kernels outlier samples’ removal results.
ComponentMethodOutlier TypeOutlier Sample Number
Water contentMahalanobis distanceSpectral outlier29, 36, 106, 137
Concentration residualChemical outlier28, 50, 94, 95, 96, 130
Table 3. Calibration set and validation set parameters for water content from the T. grandis kernels.
ComponentCalibration Set (n = 100)Validation Set (n = 34)
Range/%Average/%Standard DeviationRange/%Average/%Standard Deviation
water content15.47–28.7722.100.3615.82–26.6022.790.23
Table 4. The results of the PLS models for the water content based on the spectra of the T. grandis kernels.
Preprocessing
Methods
R2cRMSECR2cvRMSECV
Origin0.89630.01280.87730.0147
1-Der0.83260.01960.79480.0245
2-Der0.84930.01750.80340.024
SG0.88260.0140.8290.0203
Normalize0.90210.01210.83390.0199
Baseline0.91130.01090.88410.0138
SNV0.98790.00290.97060.004
MSC0.97670.00410.95170.0065
1-Der+SNV0.95730.00630.9330.0075
2-Der+SNV0.95820.00620.92130.0083
Note: 1-Der: the first-order derivation; 2-Der: the second-order derivation; SG: Savitzky–Golay smoothing; SNV: standard normal variate; MSC: multiplicative scatter correction.
Table 5. Comparison of the different near-infrared spectroscopy models of water content.
NumberWater Range/%SamplePreprocessing MethodCalibration SetValidation SetPrediction SetReference
RMSECR2cRMSECVR2cvRMSEPR2pRPD
19.82~71.09Corn stover silageMSC+1-Der4.2490.9744.2560.9494.0370.9734.217[7]
237.13~56.83Chestnut1-Der+SG0.01190.96500.5470.904N/AN/AN/A[22]
33.08~4.08WalnutSNV+1-Der0.0520.965N/AN/A0.0580.9524.14[23]
46.92~13.71Soybean1-Der+SNV0.4510.9830.0180.965N/A0.9662.00[24]
559.0~82.1PeanutN/A0.01680.9350.01830.9130.01950.9445N/A[11]
628.5~97.9Barley2-DerN/AN/A6.360.945.360.94.1[26]
7104.6~134.7Raw coffee bean2-DerN/AN/A2.4040.8582.9460.812.24[25]
815.47~28.77T. grandis kernelsSNV0.00290.9880.00390.9780.00520.9634.42This study
Note: 1-Der: the first-order derivation; 2-Der: the second-order derivation; SG Savitzky–Golay smoothing; SNV: standard normal variate; MSC: multiplicative scatter correction. RMSEC: the root mean square error of the calibration set; RMSECV: the root mean square error of the cross-validation set; RMSEP: the root mean square error of the prediction set. R2c: the correlation coefficient of the calibration set; R2cv: the correlation coefficient of the cross-validation set; R2p: the prediction correlation coefficient; RPD: relative percent difference; N/A, not applicable.
Disclaimer/Publisher’s Note: The statements, opinions and data contained in all publications are solely those of the individual author(s) and contributor(s) and not of MDPI and/or the editor(s). MDPI and/or the editor(s) disclaim responsibility for any injury to people or property resulting from any ideas, methods, instructions or products referred to in the content.

