Article

Study on the Effects of Exhaust Gas Recirculation and Fuel Injection Strategy on Transient Process Performance of Diesel Engines

State Key Laboratory of Engines, Tianjin University, Tianjin 300072, China
*
Author to whom correspondence should be addressed.
Sustainability 2023, 15(16), 12403; https://doi.org/10.3390/su151612403
Submission received: 22 July 2023 / Revised: 12 August 2023 / Accepted: 14 August 2023 / Published: 15 August 2023

Abstract

:
To meet increasingly stringent emission regulations, this study investigates the transient process of a heavy-duty diesel engine equipped with a two-stage turbocharger. The study focuses on analyzing the impact of the EGR system and fuel injection strategy during a transient process of a load increase (20% to 100% in 1 s) at a constant speed (1300 rpm). The research results showed that delaying the opening time of the high-pressure EGR valve from 0.1 s to 0.5 s reduces peak carbon soot emissions by 51.3%, with only a 3.13% increase in NOx emissions. By extending the high-pressure exhaust gas recirculation mixing length, the issue of an excessively high fuel–oxygen equivalence ratio caused by uneven exhaust gas mixing in individual cylinders can be avoided, resulting in a maximum reduction of 47.0% in peak soot emissions. Building on exhaust gas recirculation optimization, further modifications to the main and post-injection strategies led to a 28.1% reduction in soot emissions, a 4.73% decrease in peak NOx emissions, and a minor increase of 1.87% in the indicated fuel specific consumption compared to the single-injection strategy. The significant reduction in soot emissions will provide benefits for public health and environmental sustainability.

1. Introduction

Despite the challenges presented by stringent emission regulations and the rise of electric vehicles, diesel engines maintain their prominent position in new heavy-duty commercial vehicles globally. During typical operation, the majority of automotive diesel engines, excluding in highway conditions, engage in transient processes distinguished by frequent shifts in operational parameters [1]. Emissions produced by diesel engines during transient processes are generally significantly higher than emissions during steady-state conditions [2]. Consequently, optimizing the performance of diesel engines during transient processes holds heightened significance.
Extensive studies on transient processes have revealed that the primary factor contributing to performance degradation is insufficient intake airflow resulting from turbocharger lag [3]. And increased variations in operating conditions lead to higher emissions [4,5]. The mismatch between fuel and air results in high levels of soot emissions, which is a significant concern during transient processes. Consequently, many research efforts concentrate on managing soot emissions by reducing fuel quantity variations [6,7]. The emerging blended fuels or fuel additives have provided a new direction for improving diesel engine performance. The latest research [8] indicates that hydrogen, as a clean fuel, can enhance thermal efficiency, reduce fuel consumption, and simultaneously decrease emissions of particulate matter, hydrocarbons, and carbon monoxide when mixed with diesel. However, this leads to a significant increase in emissions of nitrogen oxides (NOx) [9]. P. Dinesha et al. [10] conducted research on a single-cylinder engine and found that adding CeO2 to diesel–biodiesel blended fuel can effectively reduce both particulate matter and NOx emissions. Nevertheless, the sizes of CeO2 nanoparticles have a notable impact on engine performance, which presents several challenges to the practical application of this method.
According to Euro VII emission regulations, the thermal emission limits under Euro VII are reduced by 20% for particulate matter (PM) and approximately 80% for NOx compared to the transient emission limits of Euro VI. Despite the presence of aftertreatment systems in diesel vehicles, NOx emissions during transient processes cannot be ignored. Additional measures are required to further reduce NOx emissions. An exhaust gas recirculation (EGR) system can effectively reduce NOx emissions by lowering the oxygen concentration and increasing heat capacity in the cylinder [11,12,13,14]. And the high-pressure EGR system has a faster response and assists in cold-start and warm-up processes [15,16,17,18]. As a result, it is widely utilized in new diesel engines.
However, employing EGR during transients exacerbates particulate matter emissions due to insufficient intake airflow and reduced intake oxygen concentration. While diesel particulate filters (DPFs) can effectively filter out particulate matter, frequent regeneration of the DPF can deteriorate fuel economy [19]. To solve this problem, researchers have explored the control strategy of EGR systems during transient conditions. Galindo et al. [20] discovered that without additional measures, EGR prolonged torque response time by over 2 s during transient processes. They improved response speed by installing a compressed air tank and an electric-assisted turbocharger. Pennington et al. [21] studied the torque increase transient process lasting from 2 to 10 s. By reducing the variable geometry turbocharger (VGT) opening and EGR valve opening, they minimized turbocharger lag, resulting in reduced fuel consumption and particulate matter emissions. Zhang et al. [22] studied a 5 s transient process on a two-stage turbocharged diesel engine. They found that closing the EGR valve at 1.5 s and reopening it at 4 s through open-loop control achieved optimal compromise emissions. However, using exhaust oxygen concentration feedback for closed-loop control introduced delays and worsened emissions.
Hariganesh et al. [23] aimed to achieve more uniform mixing in EGR and tested the mixing effects by modifying the EGR injection and bluff body. The results indicated that using EGR injection with a larger area and implementing the bluff body concept resulted in better mixing of exhaust gas and air. Samir Anant Dhatkar et al. [24] conducted simulations to test the mixing enhancement of five different EGR mixers. The simulations demonstrated that a basic cylindrical mixer with a 30° tapered cut provided relatively uniform mixing at the lowest cost, conferring superior cost performance.
While EGR lowers NOx, it can increase soot emissions, especially during transients. To mitigate soot emissions, post-injection is a widely adopted strategy [25,26]. Post-injection induces extra perturbations in the late combustion phase, enhancing the in-cylinder mixture formation. Additionally, the post-injected fuel raises late combustion temperatures, providing favorable conditions for oxidizing soot produced by the main injection [27,28]. However, whether the post-injection strategy can effectively reduce emissions or improve after-treatment performance is directly related to post-injection timing and post-injection quantity [29]. Pan W et al. [30] investigated the post-injection timing changed from a 20° crank angle after top dead center (CA ATDC) to a 120° CA ATDC, and the post-injection mass was set to either 5 mg, 10 mg, or 15 mg. The results showed that post-injection could decrease NOx up to 14%, but too early timings considerably increased soot emissions.
In summary, most current research on EGR gas distribution uniformity focuses on mixer design and pipeline layout and uses simulation methods to optimize relevant engine structures but rarely studies transient processes. The existing research on transient EGR systems mainly concentrates on EGR valve control strategies. Therefore, this paper analyzes and optimizes the impact of EGR gas uniformity on diesel engine transient performance by adjusting the EGR valve opening timing and changing EGR circuit length. On this basis, this paper optimizes in-cylinder combustion during a transient process by adjusting the main injection timing, post-injection timing, and post-injection ratio. This will ultimately realize co-optimization from the external EGR to internal combustion for the transient process.

2. Method and Materials

2.1. Experimental System

Specifications for the test engine are given in Table 1. As shown in Figure 1, the intake air system consists of a two-stage turbocharger system, an intake valve closing actuation (IVCA) system [31], and an EGR system. The high-pressure stage turbine is a VGT, and the low-pressure stage turbine is a constant geometry turbine.
In order to study the transient characteristics of heavy-duty diesel engines, a large number of high-responsivity sensors and test equipment were used on the test bench. The test equipment is shown in Table 2.
In this study, the short EGR mixing circuit is illustrated in Figure 2a, while the layout of the long EGR mixing circuit is depicted in Figure 2b. The EGR mixing circuit is extended by relocating the EGR cylindrical mixer outlet upstream of the intercooler, which effectively avoids any cost increase issues.

2.2. Experiment Scheme

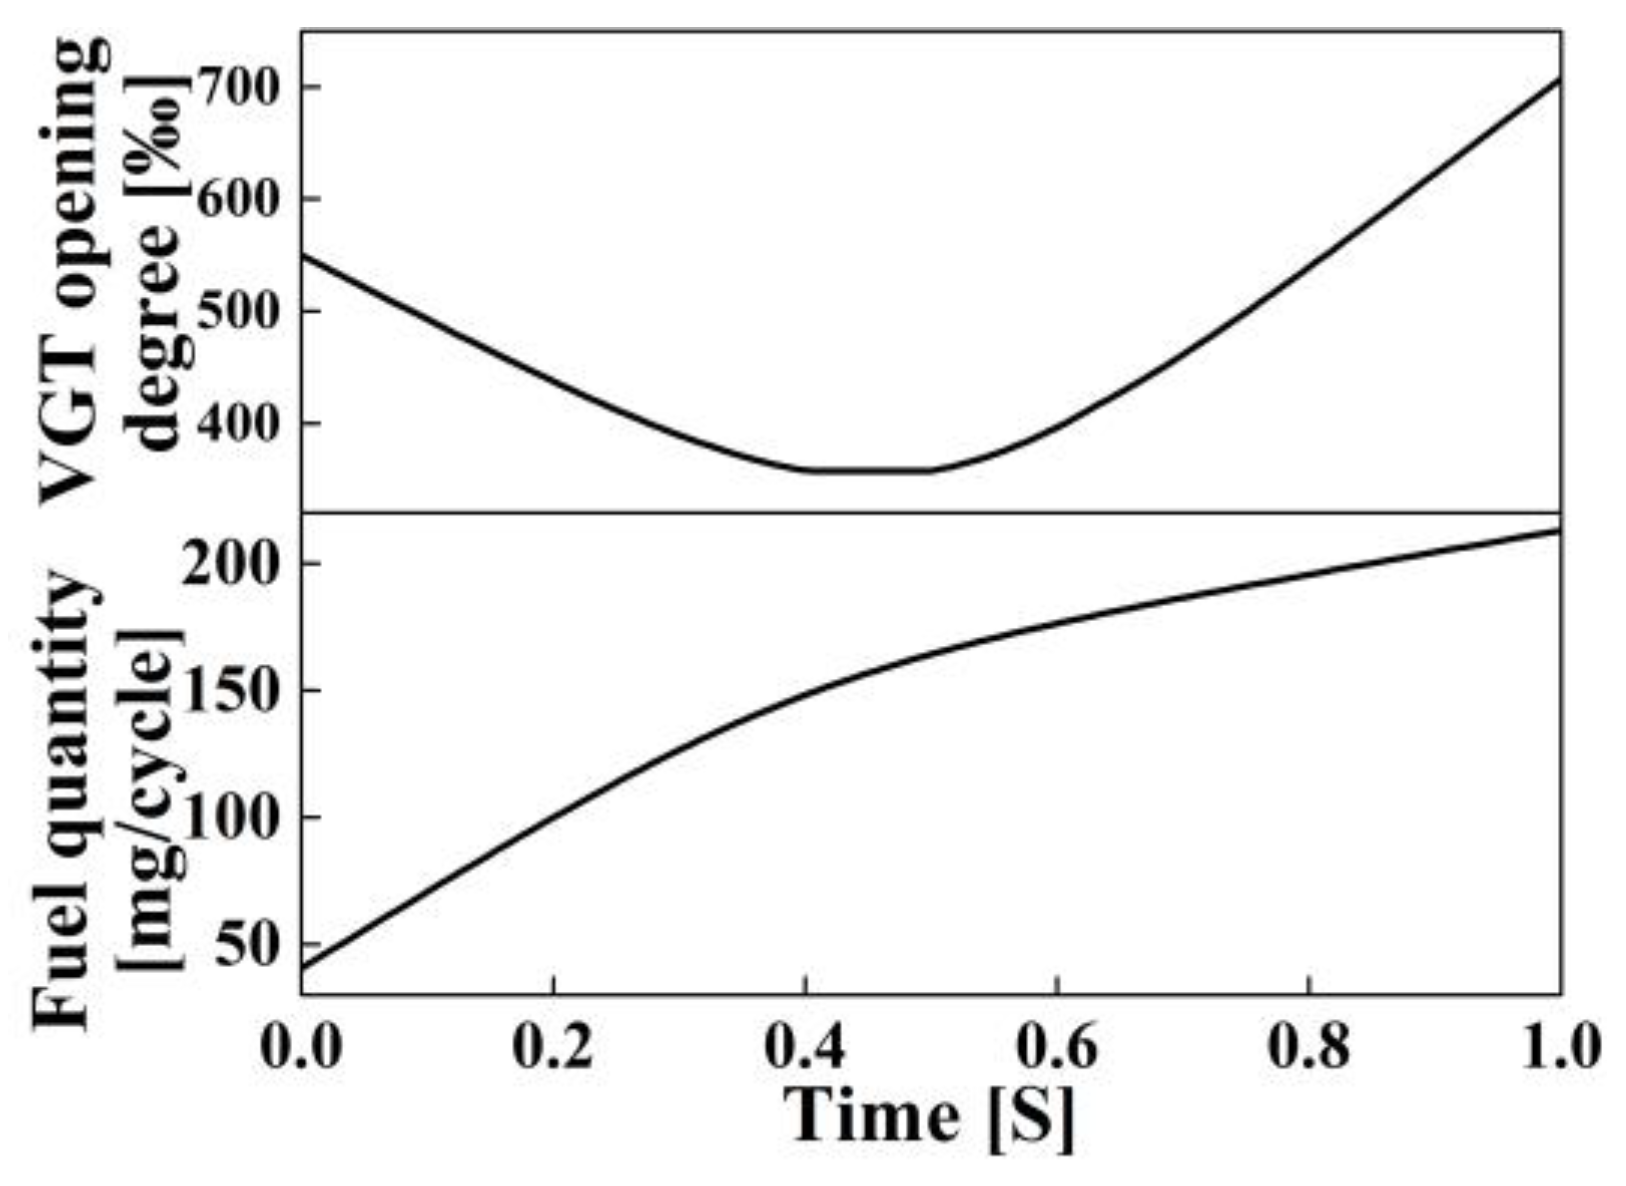
To systematically examine the effects of EGR system configuration, EGR valve opening timing, injection mode, injection timing, and main-to-post-injection fuel ratio, this study implemented a 20% to 100% load increase transient process in 1 s at a constant speed of 1300 rpm. The EGR valve remained closed initially, subsequently opening at a defined point to 15% maximum lift. Figure 3 depicts the fueling rate and VGT opening control curves, while Figure 4 illustrates main injection timing. Table 3 enumerates the experimental test conditions.
The EGR rate was measured by Cambustion NIDR500, which has two probes. One probe was situated in the exhaust pipe, while the other was installed in the intake manifold, which has measurement holes for each of the six cylinders. During testing, the EGR rate was first measured for the first cylinder intake manifold, followed by sequential measurements for each individual manifold.
For single-injection events, the timing is expressed as “initial main injection timing to final main injection timing.” For example, in Table 3, 1° CA ATDC to −2° CA ATDC represents a change in the main injection timing from 1° CA ATDC to −2° CA ATDC, as shown in Figure 4. When employing two injections, the injection timing is represented as (main injection timing, post-injection interval), such as (1, 6)~(−2, 6)° CA ATDC, which indicates a change in the main injection timing from −1° CA ATDC to 2° CA ATDC followed by a post-injection that starts 6° CA after the main injection finished. The post-injection fuel ratio represents the proportion of post-injection fuel to the total cycle fuel volume. For example, 16% indicates that the post-injection fuel accounts for 16% of the total fuel injection quantity, while the main injection fuel accounts for 84%.

2.3. Data Processing

The experimental uncertainty was estimated based on data obtained from three to five repetitions of the experiment. And error bars representing the variation range of the parameters when the experiment is repeated has been added to the relevant figures.
The average indicated specific fuel consumption rate of the transient process is calculated using Equation (1) [34].
I S F C = m e c u Δ t P Δ t
where I S F C indicates the specific fuel consumption rate [g/kWh], m e c u is fuel consumption measured by ECU [g/h], and P is the engine power [kW], calculated using Equation (2) [35].
P = S × T 9550
where S is engine speed [rpm], T is indicated engine torque [N∙m], and T is calculated using Equation (3) [36].
T = 318.3 × I M E P × V s × n τ
where I M E P is the mean effective pressure [MPa], V s is engine cylinder displacement [dm3], n is the number of cylinders, and τ is the number of engine strokes.
In this paper, the fuel–oxygen equivalent ratio ( Φ o ), which reflects the correlation between in-cylinder oxygen and fuel, is chosen as an index due to using the EGR system. The calculation method is presented in Equation (4) [37]:
  Φ o = m f u e l m o F O 2 s t o i c
where m f u e l is the mass of in-cylinder fuel [g], m o is the mass of in-cylinder oxygen [g], and F O 2 s t o i c is the theoretical fuel–oxygen ratio.
The EGR rate in the study is calculated by measuring the volumetric fraction of CO2 in the intake and exhaust gases using the Cambustion NDIR500. The calculation method is presented in Equation (5) [22]:
R E G R = C O 2 , i n t a k e C O 2 , a i r C O 2 , e x h a u s t C O 2 , a i r × 100 %
where C O 2 , i n t a k e is CO2 concentration in the intake air [%], C O 2 , e x h a u s t is CO2 concentration in exhaust [%], and C O 2 , a i r is CO2 concentration in the fresh air [%].
The specific emission of NOx ( m N O x ) is calculated with Equation (6) [34]:
m N O x = u N O x × i = 1 n c N O x , i × q m e w , i × k h , D ÷ i = 1 n P i
where u N O x is the exhaust gas constant for NOx, c N O x , i is the instantaneous concentration of NOx in the exhaust gas [ppm], q m e w , i is the instantaneous exhaust mass flow [kg/h], k h , D is the humidity correction factor for NOx, and P i is the instantaneous engine power [kW].
The specific emission of soot ( m s o o t ) is calculated with Equation (7) [38]:
m s o o t = i = 1 n r d 1000 ρ 0 × c s o o t , i × q m e w , i ÷ i = 1 n P i
where r d is the dilution ratio, ρ 0 is the density of the exhaust gas under standard conditions [kg/m3], and c s o o t , i is the instantaneous concentration of soot in the exhaust gas [mg/m3].
The mean temperature in the cylinder ( T m e a n ) is determined from the ideal gas law, and the calculation method is referenced from Equation (8) [39]:
  T m e a n = p V μ M R
where p is the in-cylinder pressure [Pa], V is the instantaneous cylinder volume [m3], μ is the molar mass of the gas [g/mol], M is the mass of the in-cylinder charge [g], and R is the ideal gas constant [Pa∙m3∙mol−1∙K−1].

3. Results and Discussion

3.1. The Effect of High-Pressure EGR Systems on Transient Process

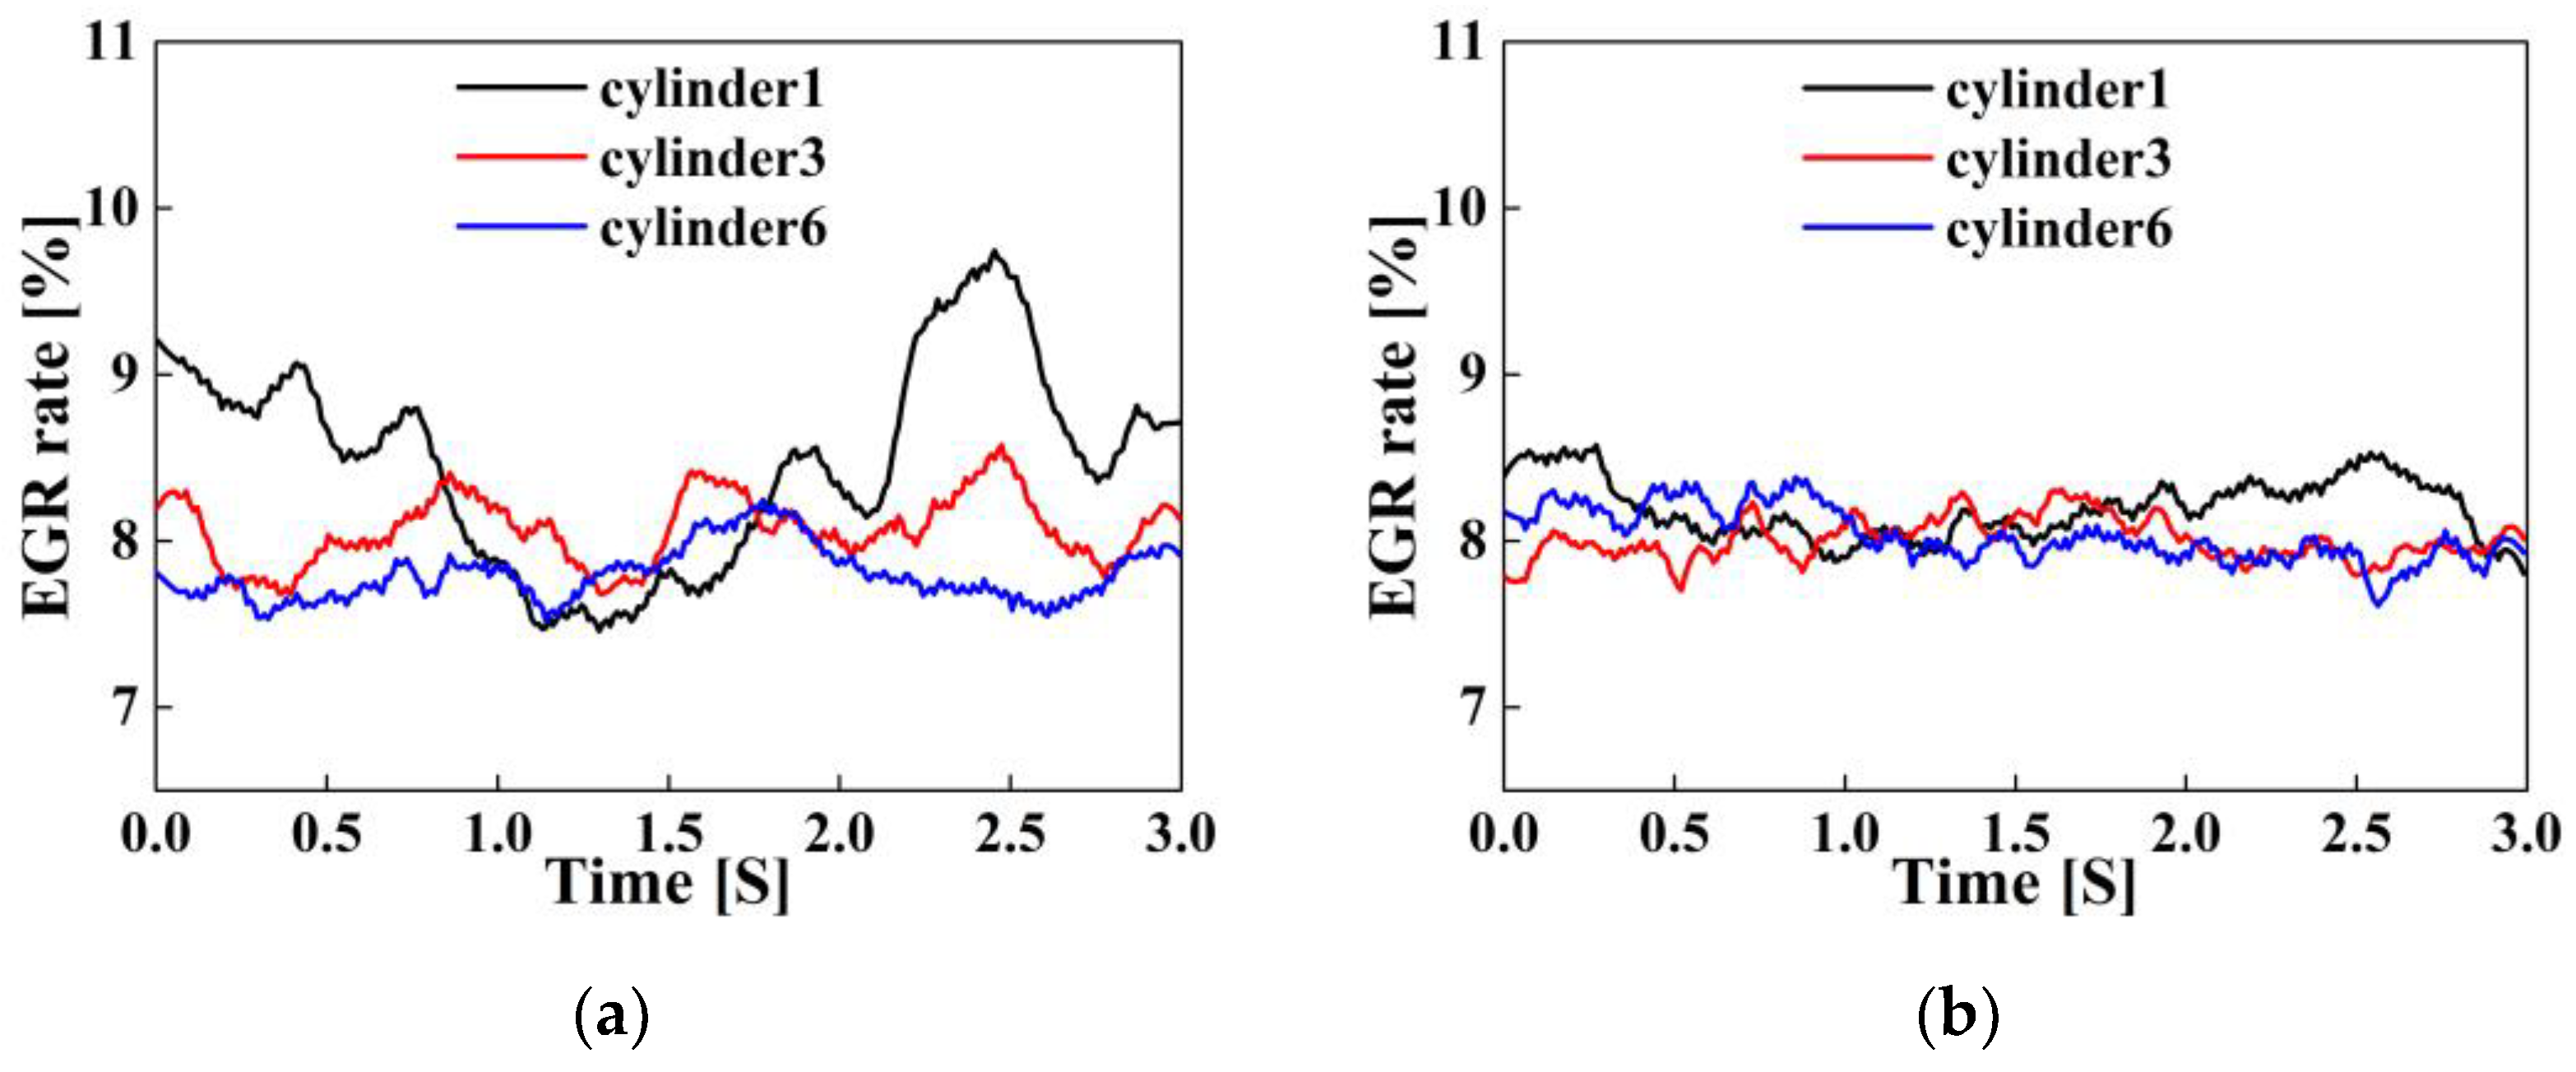
Even when the engine is working under steady-state operation, the short high-pressure EGR circuit induces nonhomogeneous blending of exhaust gas and fresh intake air, leading to substantial EGR rate variances between cylinders, as illustrated in Figure 5a. To mitigate this problem, this study implements a scheme to extend the EGR mixing circuit by relocating the EGR mixer outlet upstream of the intercooler. This simple and effective approach improves exhaust gas and fresh air mixing, thereby ensuring consistent EGR rates across all cylinders, as depicted in Figure 5b.
The EGR rates shown in Figure 6 are when the high-pressure EGR valve opens at 0.1 s. The first cylinder, nearest the EGR mixer outlet, exhibits substantial fluctuations in the short mixing circuit, with a 14.8% higher peak EGR rate of 11.0% vs. 9.58% for the long circuit. Comparing Figure 6a–c reveals decreasing EGR rate oscillation amplitudes as the cylinder distance from the mixer outlet increases. In the short circuit, the sixth cylinder peak EGR rate is 18.6% lower at 8.95% relative to the first cylinder. Conversely, the long circuit produces a peak sixth cylinder EGR rate of 9.61%, just 0.62% higher than the first cylinder. This significant reduction in the EGR rate variances demonstrates the long mixing circuit’s superior distribution uniformity.
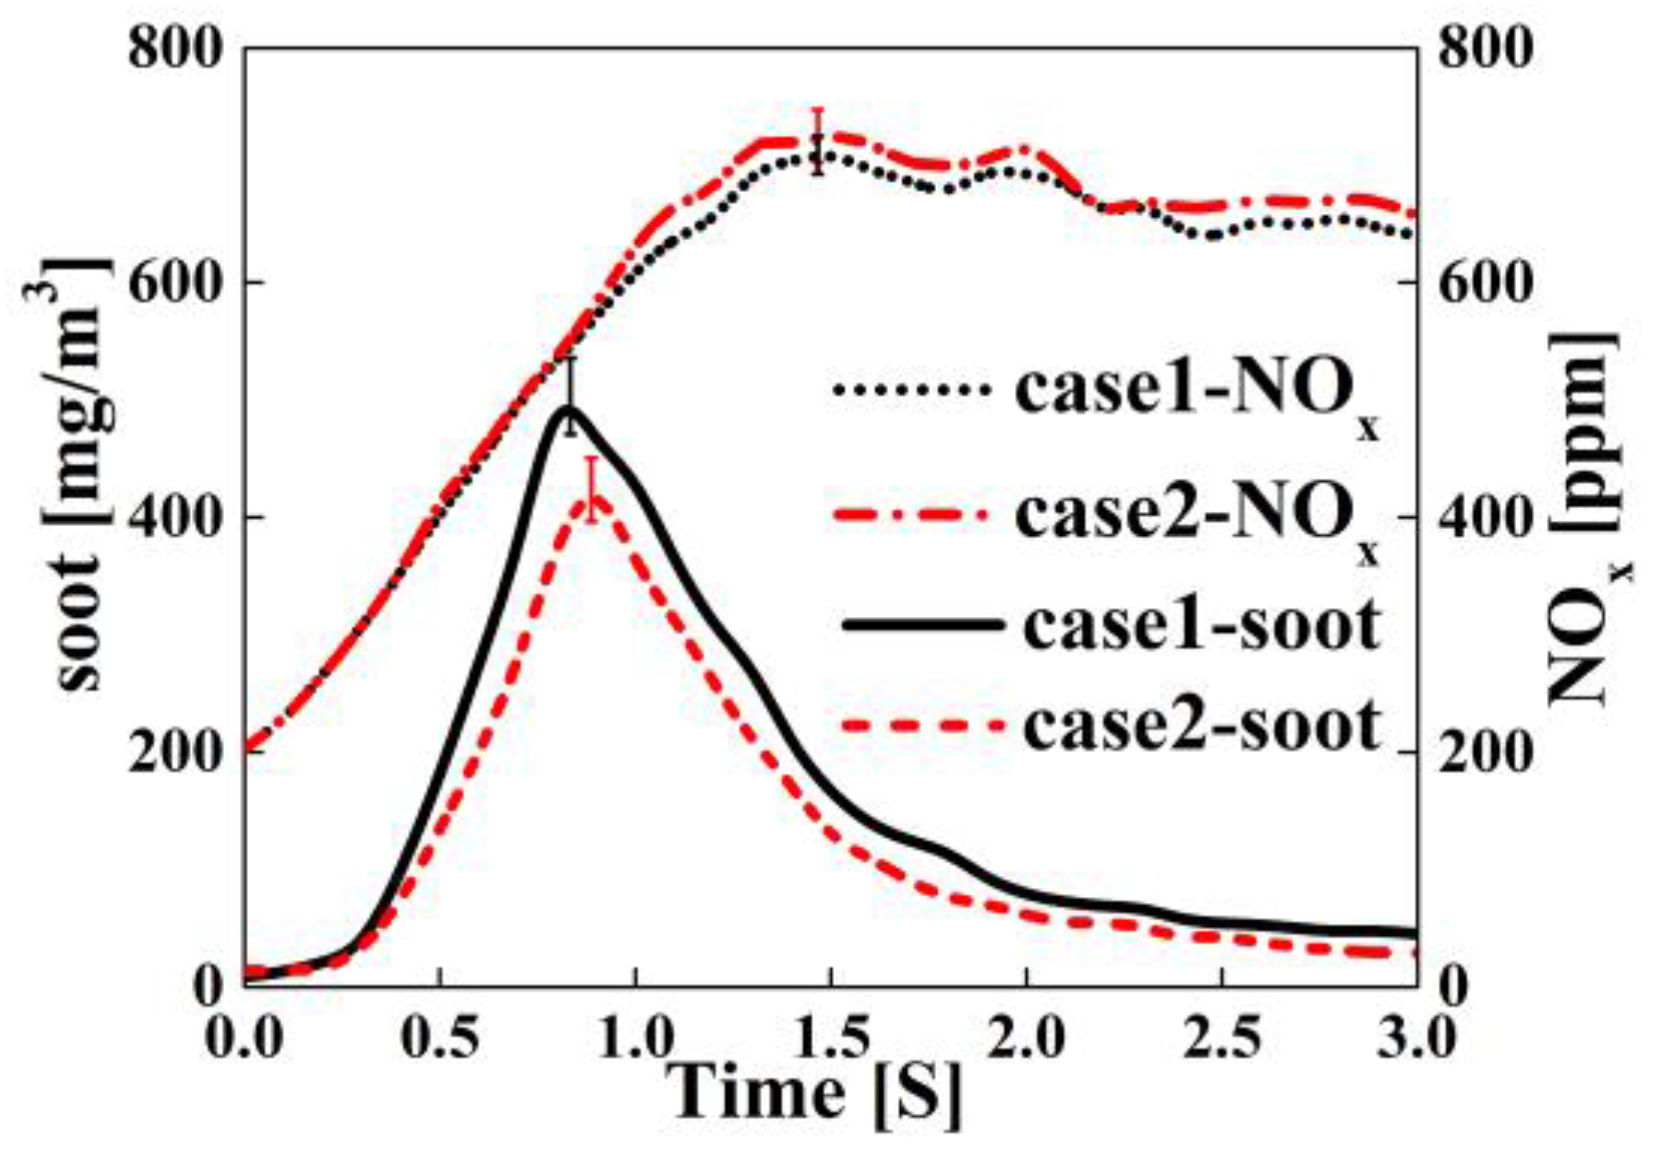
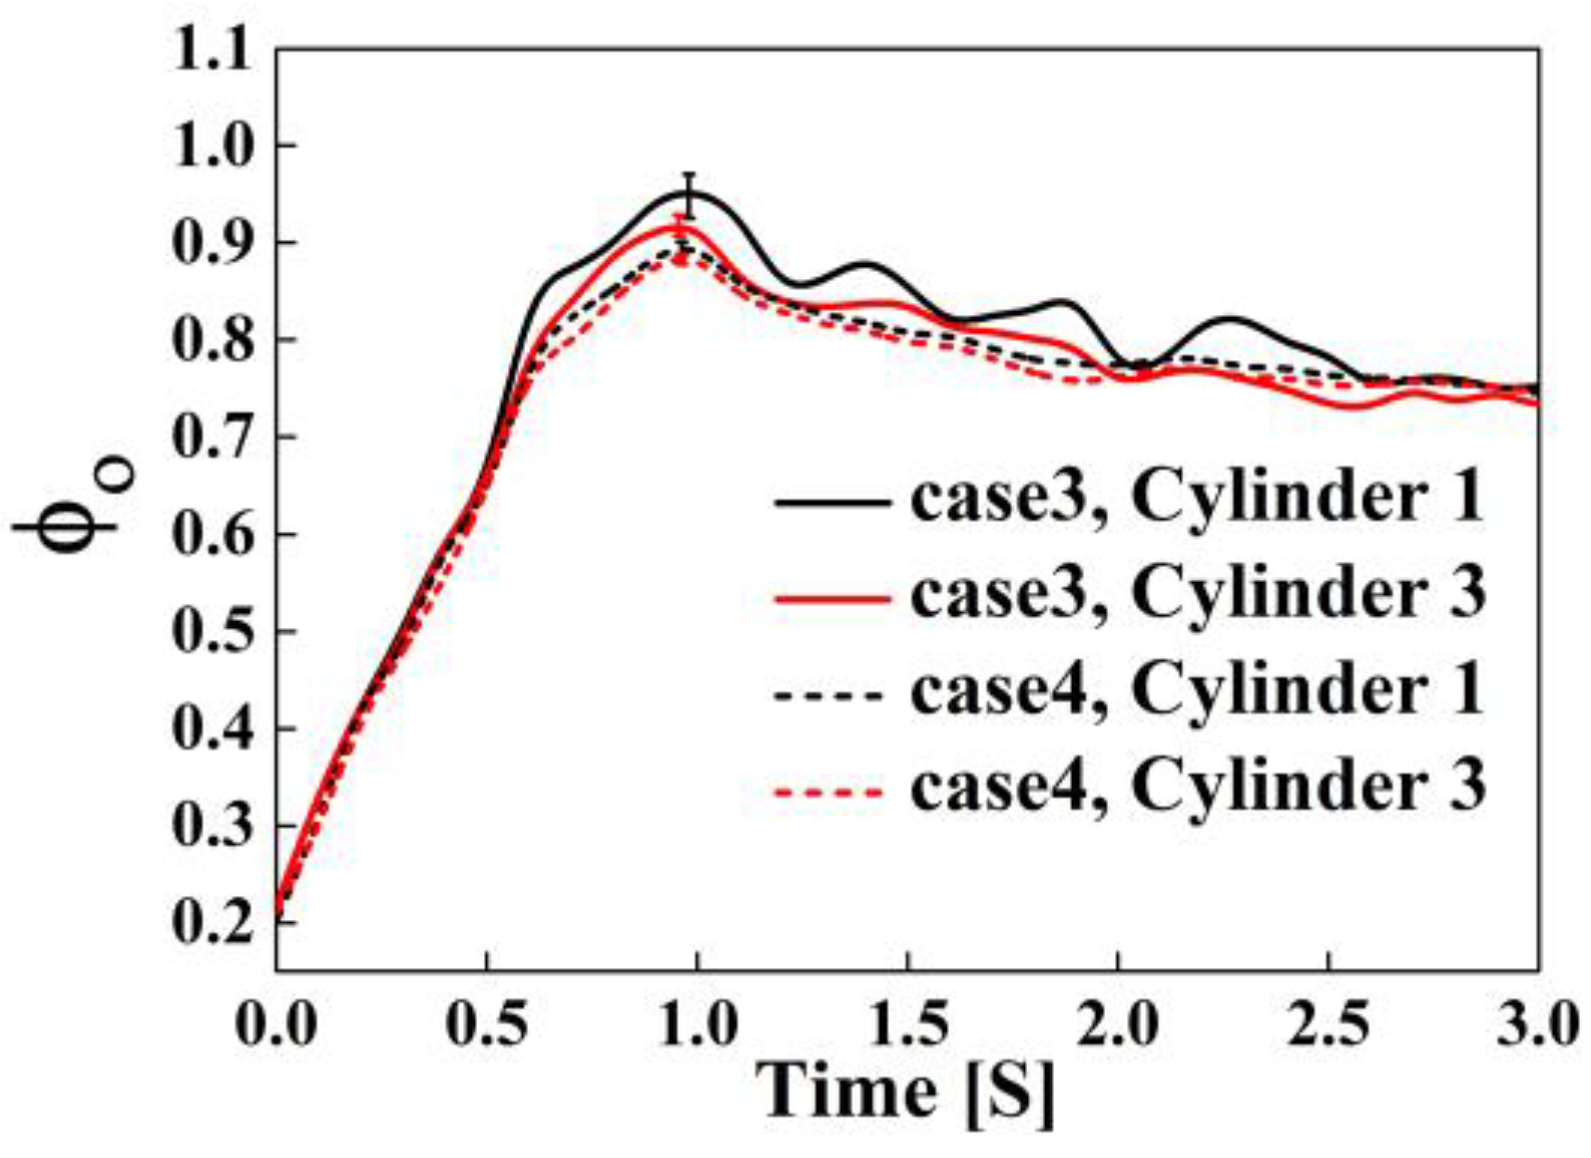
The short mixing circuit’s uneven exhaust gas distribution produces substantial Φ O variations. As shown in Figure 7, with the short circuit, the peak Φ O increases by 4.21% in cylinder 1 versus the long circuit. This Φ O deterioration increases peak soot emissions, which are 17.7% higher for the short versus long layout, as shown in Figure 8. As for NOx emissions, the long mixing circuit slightly reduces the intake temperature by passing through an additional intercooler, resulting in a slight decrease of approximately 2% in peak NOx emissions [40].
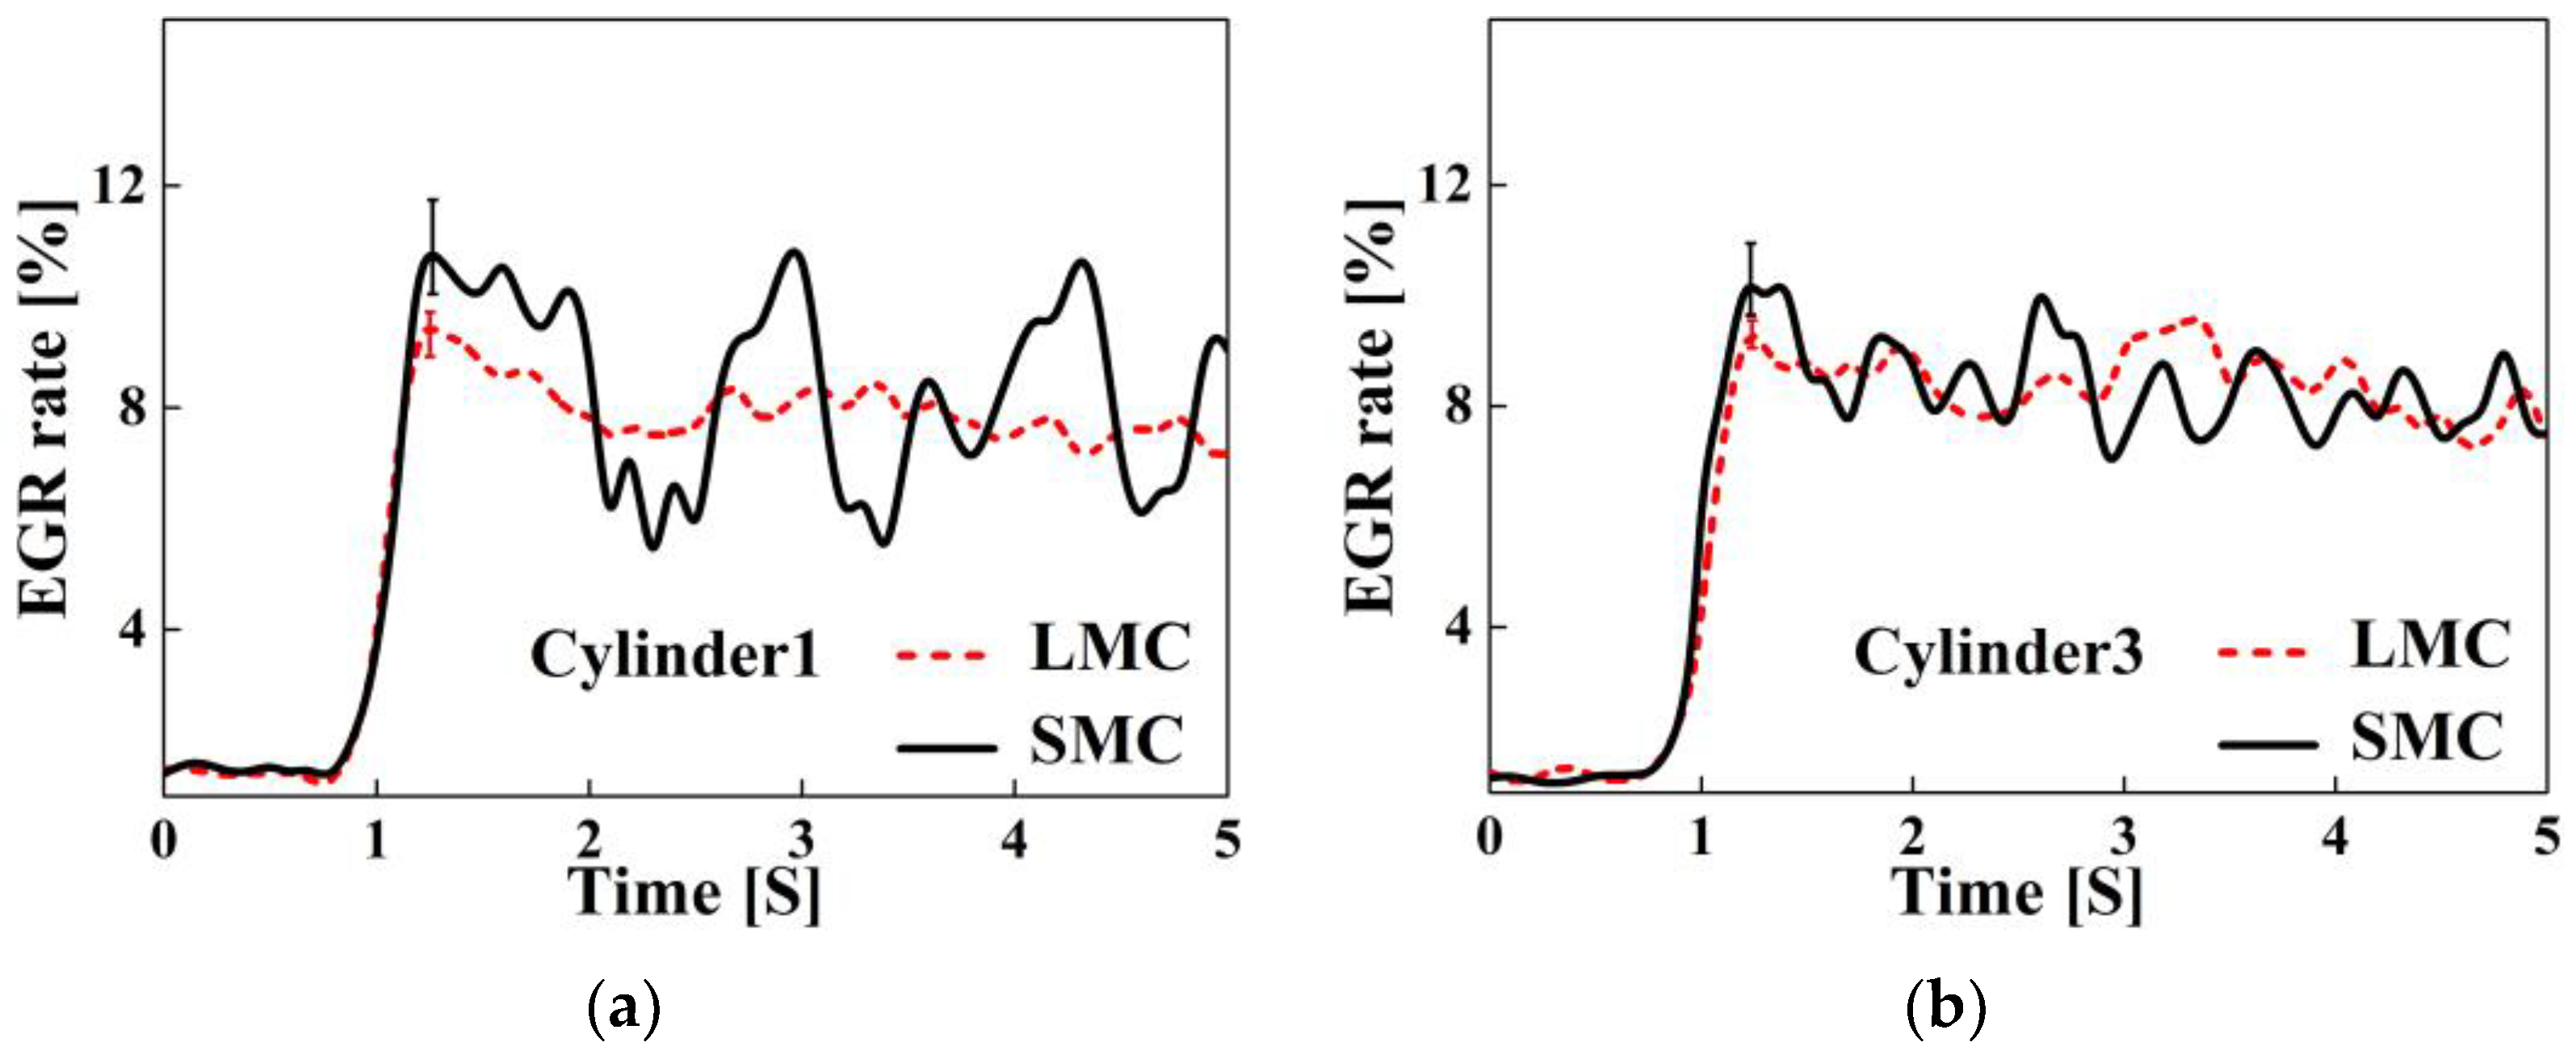
As shown in Figure 9, when the high-pressure EGR valve opens at 0.5 s, the cylinder 1 peak EGR rate within the first second reached 12.2% for case 3 and 9.74% for case 4. Compared to case 1, the delayed opening intensified fluctuations and peaks due to increased exhaust energy to the accelerating turbine, raising intake flow velocity. At this point, the minimum VGT opening also maximizes the intake–exhaust pressure differential, amplifying the exhaust driving force and flow velocity [41]. Together, these factors contribute to higher EGR distribution unevenness with delayed valve opening.
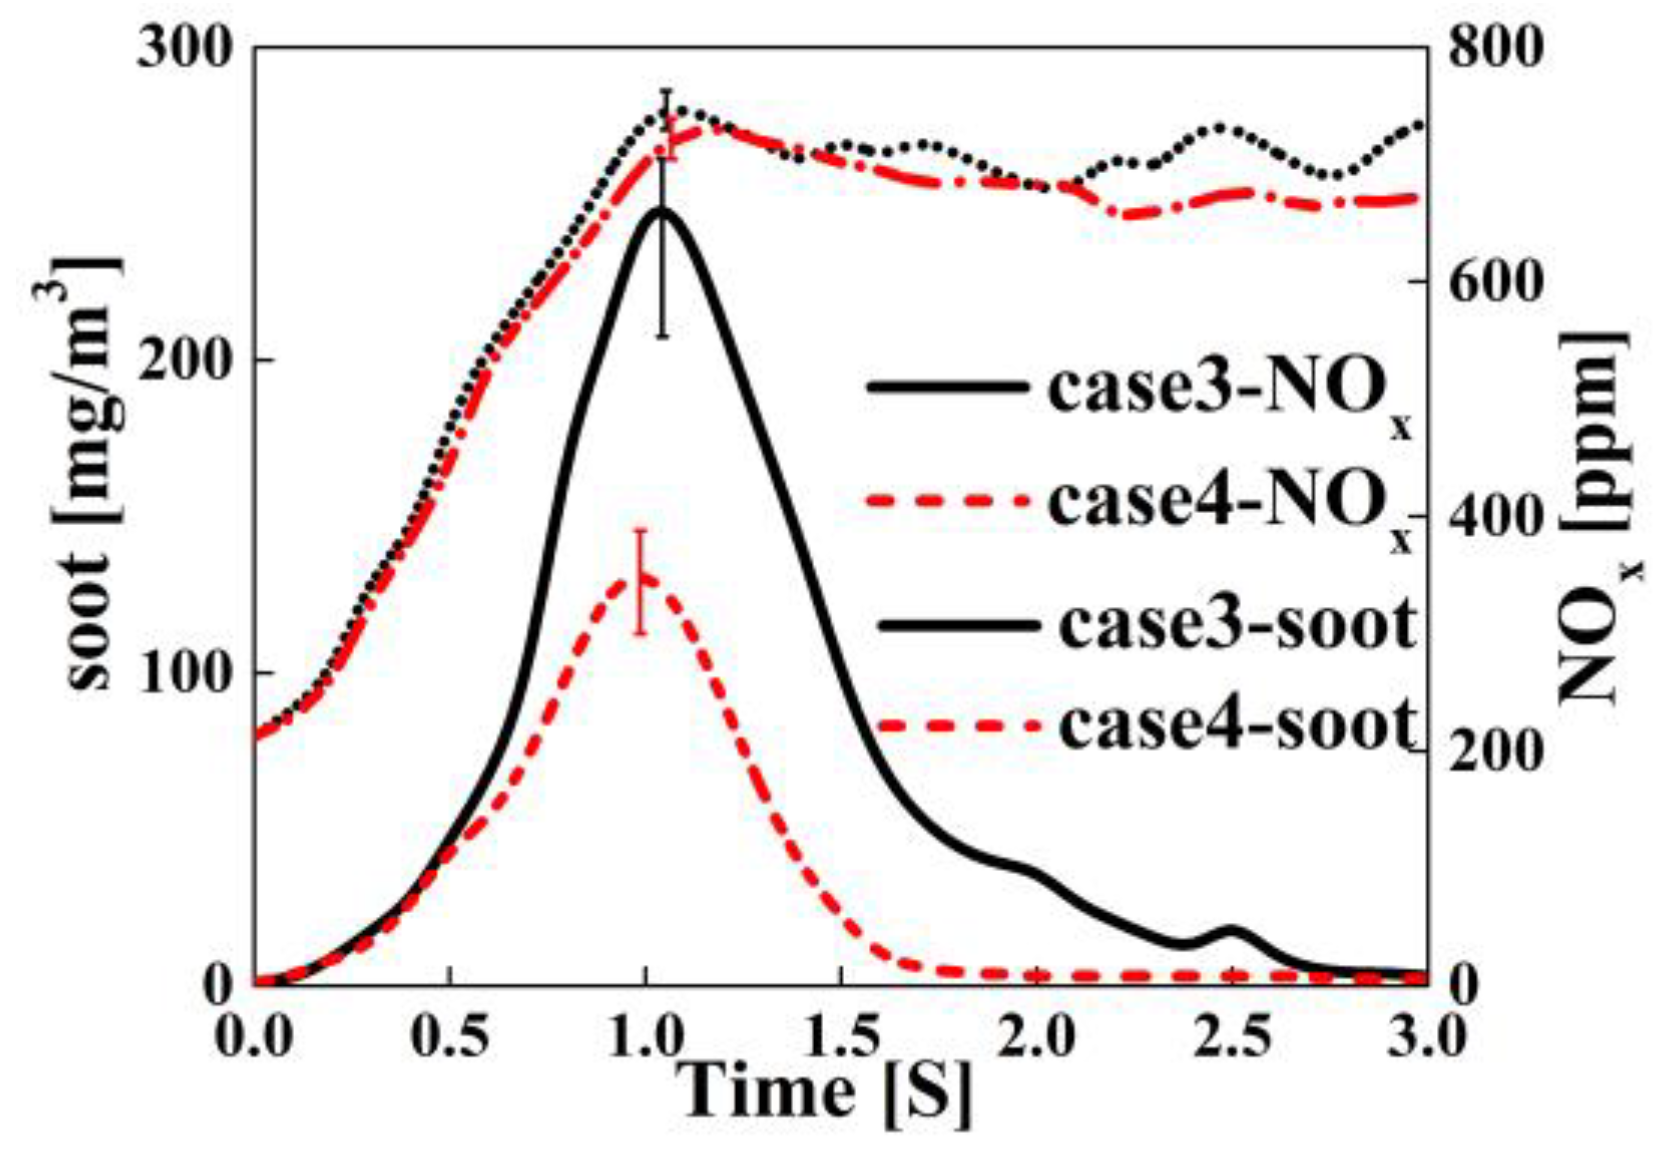
As shown in Figure 10, delaying the opening of the EGR valve to 0.5 s in case 3 reduced the peak Φ O in cylinder 3 by 9.22% and peak soot by 51.3%, compared to case 1. This delayed EGR valve opening timing significantly improved the acceleration performance of the turbocharger. This led to increased intake airflow and a lower Φ O , resulting in reduced soot emissions. Compared to case 3, case 4 exhibits a reduction of 47.0% in the peak value of soot emissions, far exceeding the reduction achieved by case 2 as shown in Figure 11. This phenomenon can be attributed to the multiple influences of the Φ O on soot emissions. An increase in the Φ O leads to both increased soot generation during combustion and reduced soot oxidation in the late combustion stage. Therefore, soot emissions increase exponentially with the Φ O . At a relatively low Φ O , the deterioration of soot emissions is relatively minimal. However, once the Φ O exceeds a certain value, soot emissions start to deteriorate sharply. This principle is also utilized in fuel limiter modules in vehicles [42]. When the EGR valve opens at 0.5 s, the long mixing circuit ensures that the Φ O in each cylinder remains at a lower level, effectively reducing soot emissions. In contrast, in the short mixing circuit, some cylinders, such as the first, introduce too much exhaust gas. This leads to an excessively high Φ O and significantly higher soot emissions compared to other cylinders. Consequently, soot emissions deteriorate significantly in the short mixing circuit. Regarding the transient process with the EGR valve opening at 0.1 s, since the overall Φ O remains at a higher level, even the long mixing circuit cylinders experience a significant deterioration of soot emissions. Therefore, the emission difference between the long and short mixing circuit becomes relatively small.
As shown in Figure 12, delaying the opening of the high-pressure EGR valve to 0.9 s reduced the peak EGR rate within 1 s after opening to 10.9% in the short mixing circuit cylinder 1 and 9.64% in the long mixing circuit. This represents a decrease in the EGR rate fluctuation amplitude. The EGR valve opening timing of 0.9 s coincides with an increased VGT vane opening. This substantially lowered the intake pressure differential, weakening the driving force of the high-pressure EGR gas. As a result, the fluctuation amplitude and peak value of the EGR rate decreased.
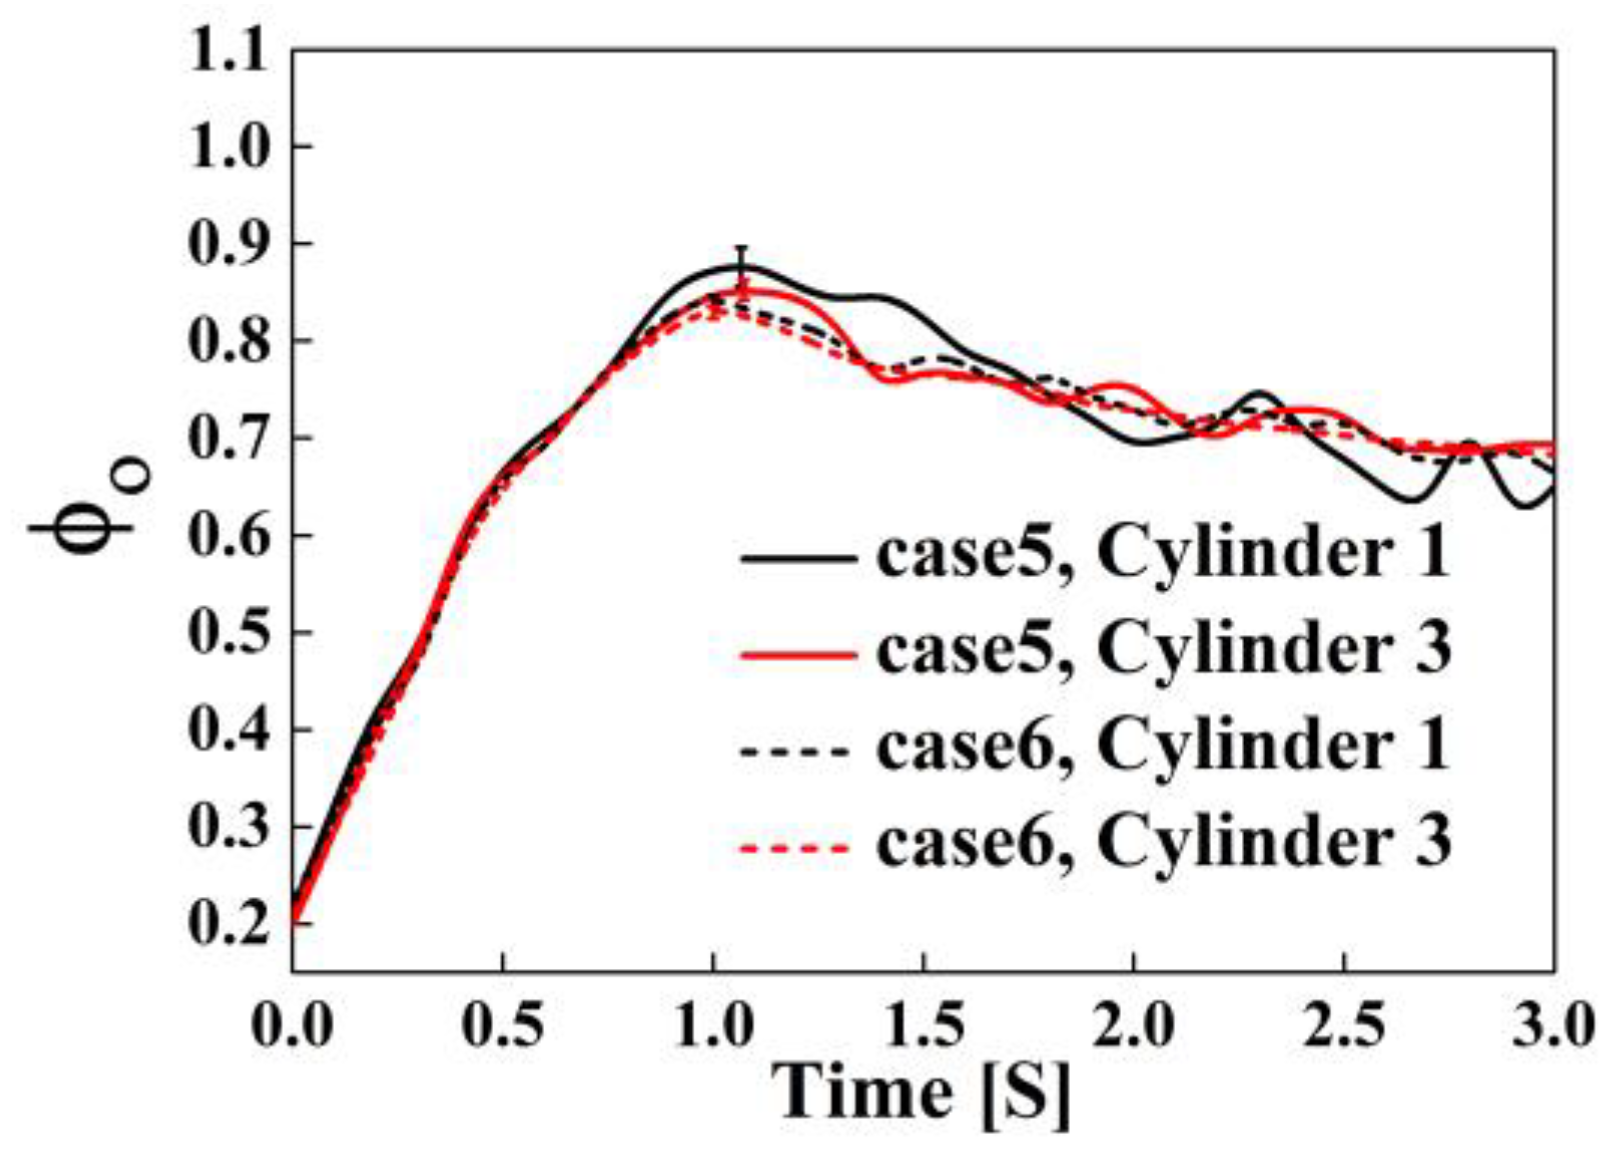
As shown in the Figure 13, compared to case 3, case 5 exhibited a reduction of 53.2% in the peak value of soot emissions. However, compared to case 5, case 6 showed only a 12.5% decrease in the peak value of soot emissions. This trend indicates that further delaying the high-pressure EGR valve opening allows prolonged turbocharger acceleration under high-energy conditions. This results in increased intake airflow and a decreased Φ O as shown in Figure 14. As a result, even for the fluctuating first cylinder in the short mixing circuit, the Φ O is lowered to a level that does not significantly deteriorate soot emissions. Consequently, the difference in soot emissions between the long and short mixing circuits decreases.
However, the late opening of the EGR valve causes a pronounced peak in NOx emissions during the later stages of the transient process, with an increase of over 33%.
Figure 15 shows that case 4 exhibits the lowest compromising emissions. In case 4, the EGR valve opens at 0.5 s and utilizes a long mixing circuit. This suggests that delaying the EGR valve opening enhances turbocharger response and reduces soot emissions. However, further delaying the valve opening beyond 0.5 s only offers a limited additional reduction in soot emissions. Additionally, opening the high-pressure EGR valve at 0.5 s ensures an adequate EGR rate during the later stages of the transient process, effectively suppressing the generation of NOx emissions and resulting in optimal transient emission performance.
Comparing the long and short mixing circuits shows that the long circuit reduces soot emissions by distributing exhaust gas more uniformly among the cylinders. This mitigates excessive soot from the deteriorated Φ O in certain cylinders, providing an effective approach to reducing soot in transients.

3.2. Effect of Injection Strategy on Transient Process

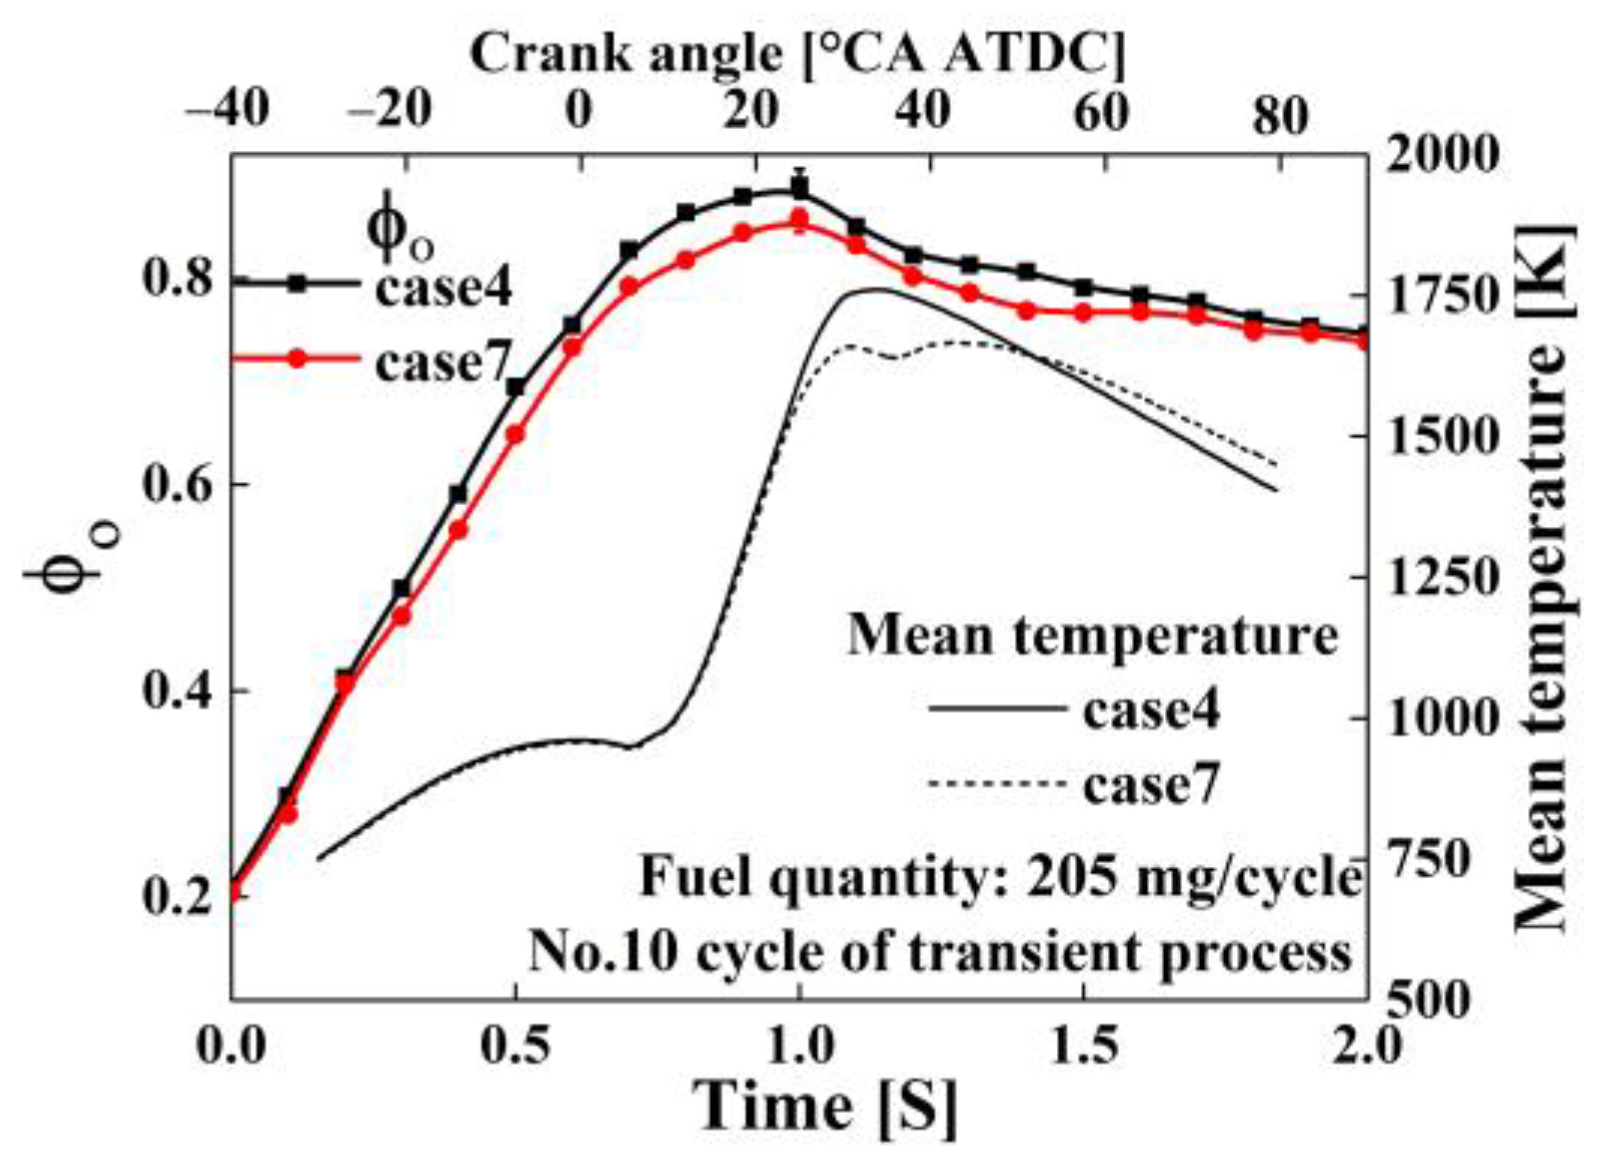
Compared to case 4, case 7 has a post-injection interval timing of 6° CA and a post-injection ratio of 16%, while maintaining the same main injection timing. As shown in Figure 16, the dual injection in case 7 results in a peak Φ O of 0.858, which is 3.59% lower than case 4. Post-injection combusts a portion of fuel away from the top dead center, increasing the late combustion temperature and pressure. This subsequently raises the exhaust temperature and pressure, resulting in an increase in exhaust enthalpy and thereby providing more energy to the turbine [43,44]. The increased turbine energy raises engine intake airflow, decreasing the Φ O in the cylinder.
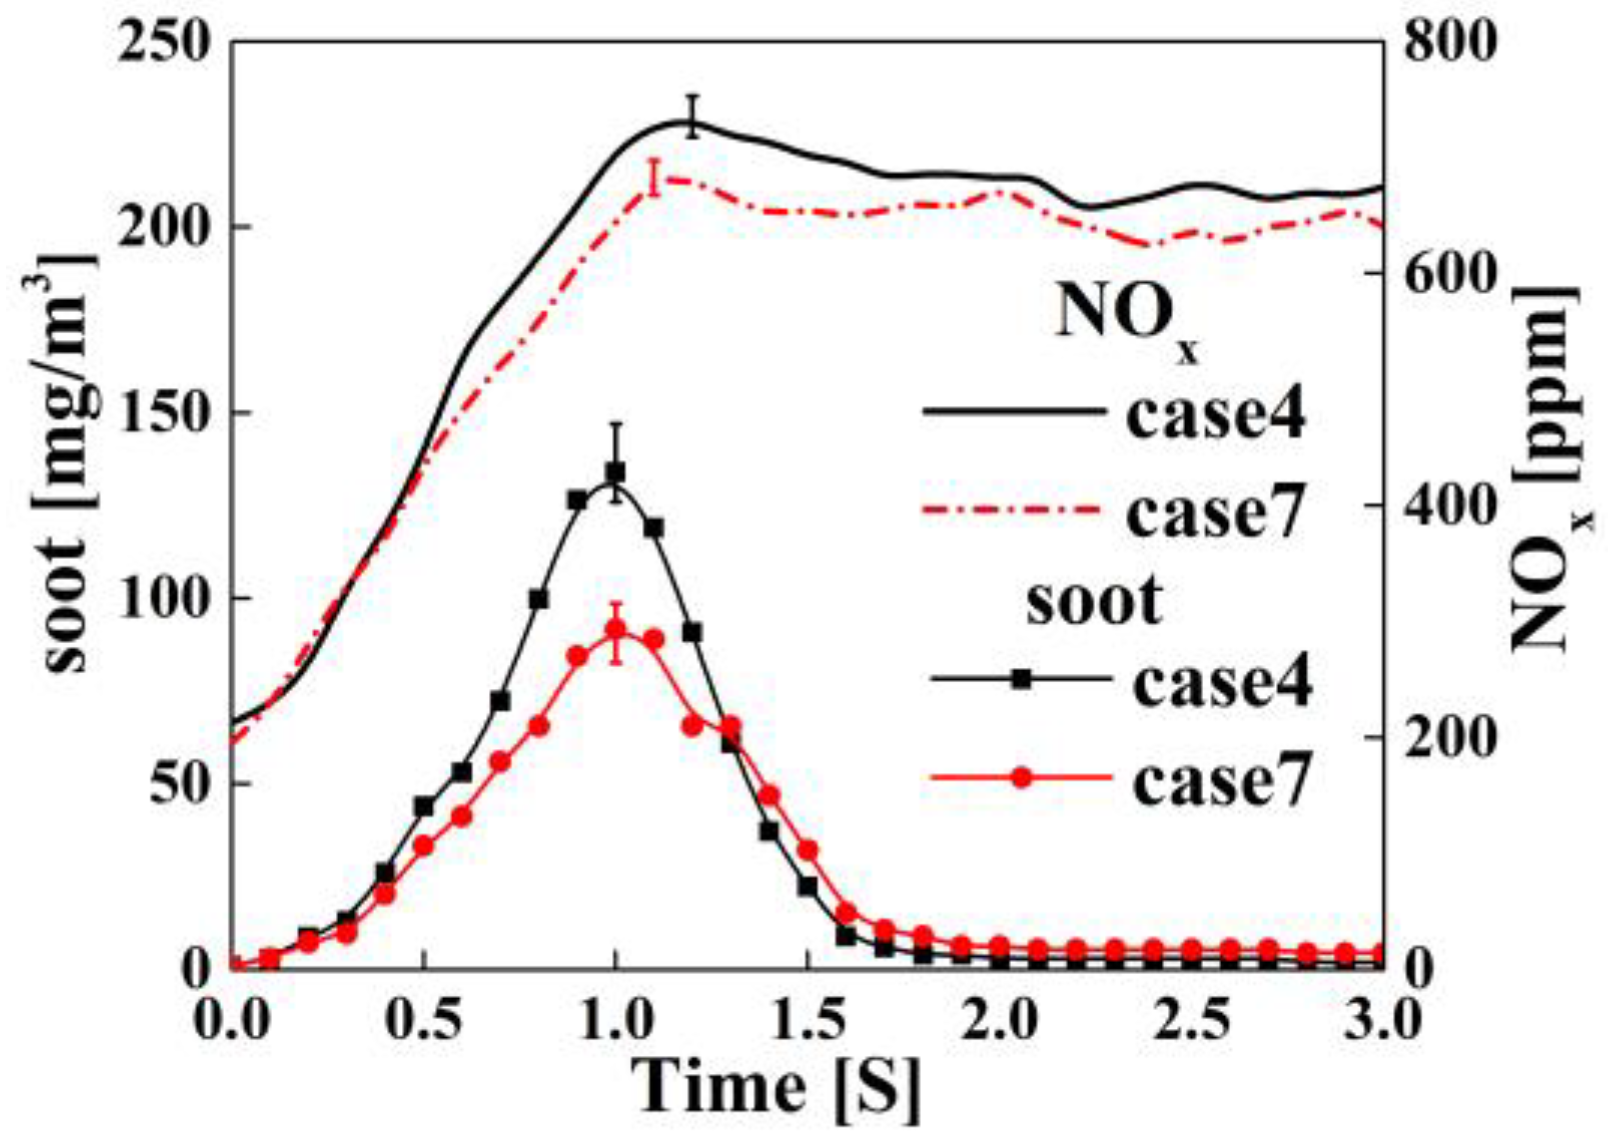
Figure 17 shows that dual injection reduces peak soot emissions by 31.6% and peak NOx by 9.00% compared to single injection. Post-injection reduces the main injection fuel quantity, decreasing the in-cylinder mean temperature. The lower temperature suppresses NOx formation. Despite the higher oxygen concentration from the lower Φ O , the reduced temperature predominates, decreasing NOx emissions. The lower main injection fuel quantity improves fuel–air mixing, reducing soot formation during the main combustion. Concurrently, higher late-stage temperatures from post-injection facilitate soot oxidation [45]. The combined effect of these factors significantly reduces the peak value of soot emissions.
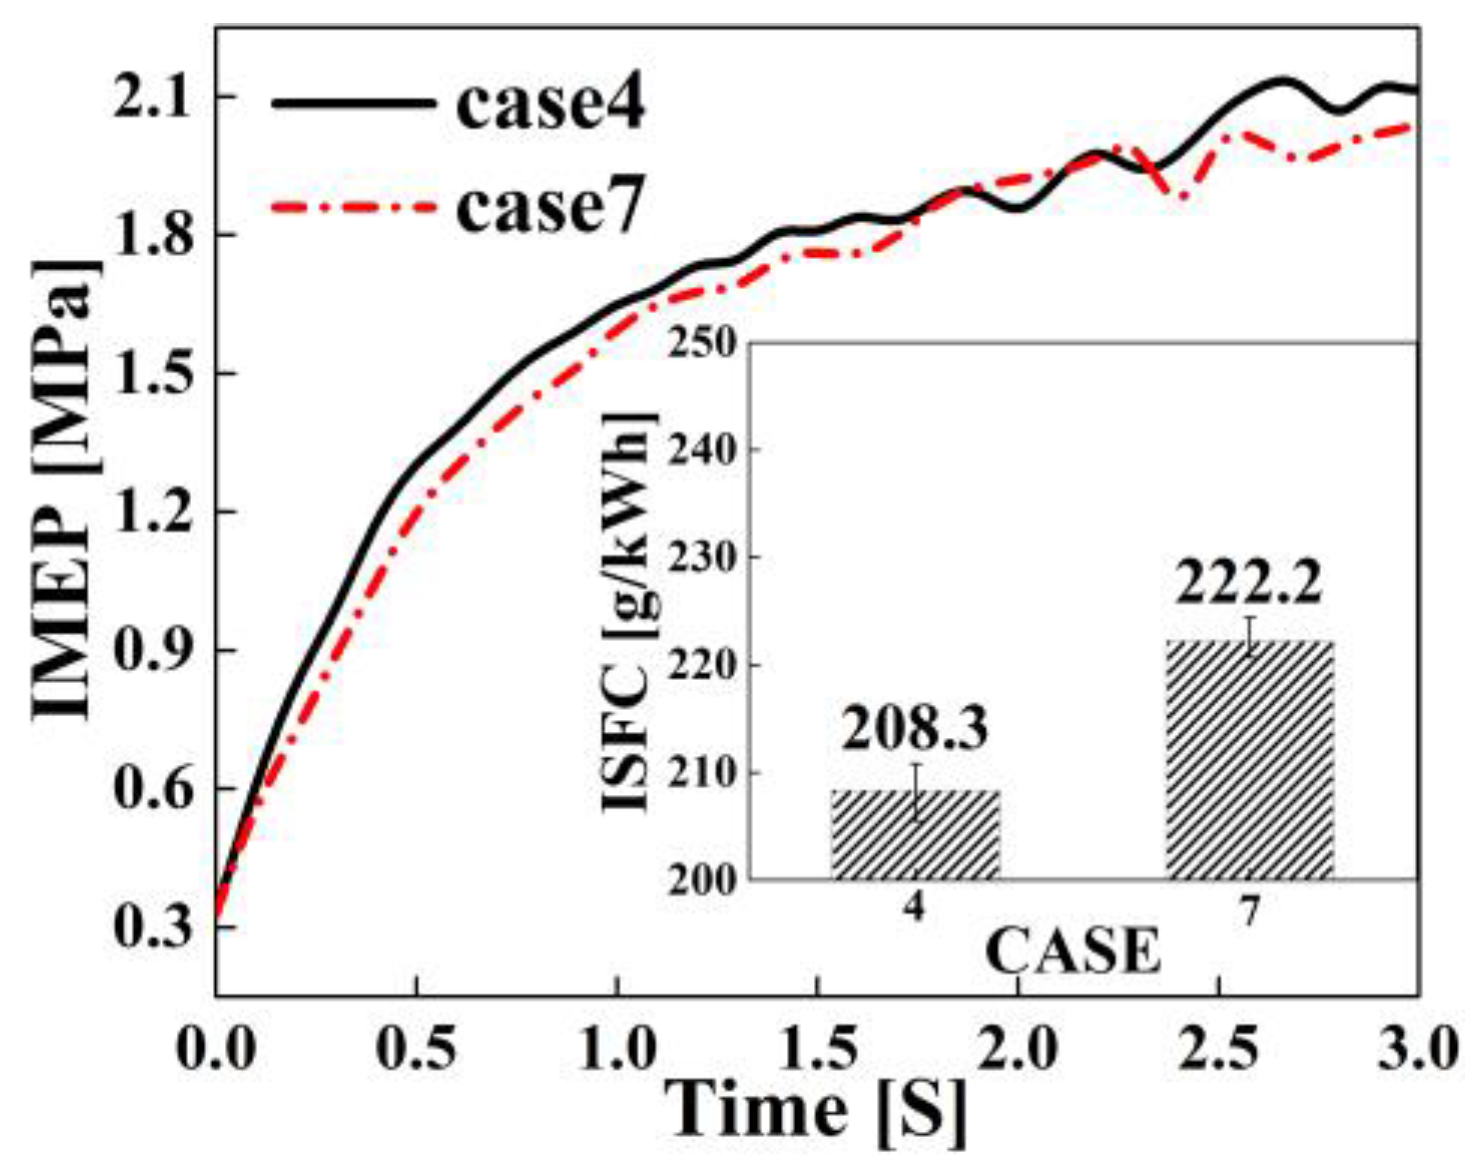
Figure 18 shows that case 7 had a 6.67% higher ISFC and a 3.05% lower maximum IMEP compared to case 4 during the 1 s transient. The dual-injection strategy shifted combustion further from the top dead center, reducing efficiency and slowing IMEP growth. However, dual injection had faster late-stage IMEP growth compared to single injection. Under steady-state conditions, the Φ O generally remains at a lower level, limiting the combustion optimization potential due to the reduction in Φ O from post-injection. However, during late transients with a high Φ O , post-injection can improve combustion [46]. Consequently, post-injection may lead to improved thermal efficiency during the late stage of the transient process.
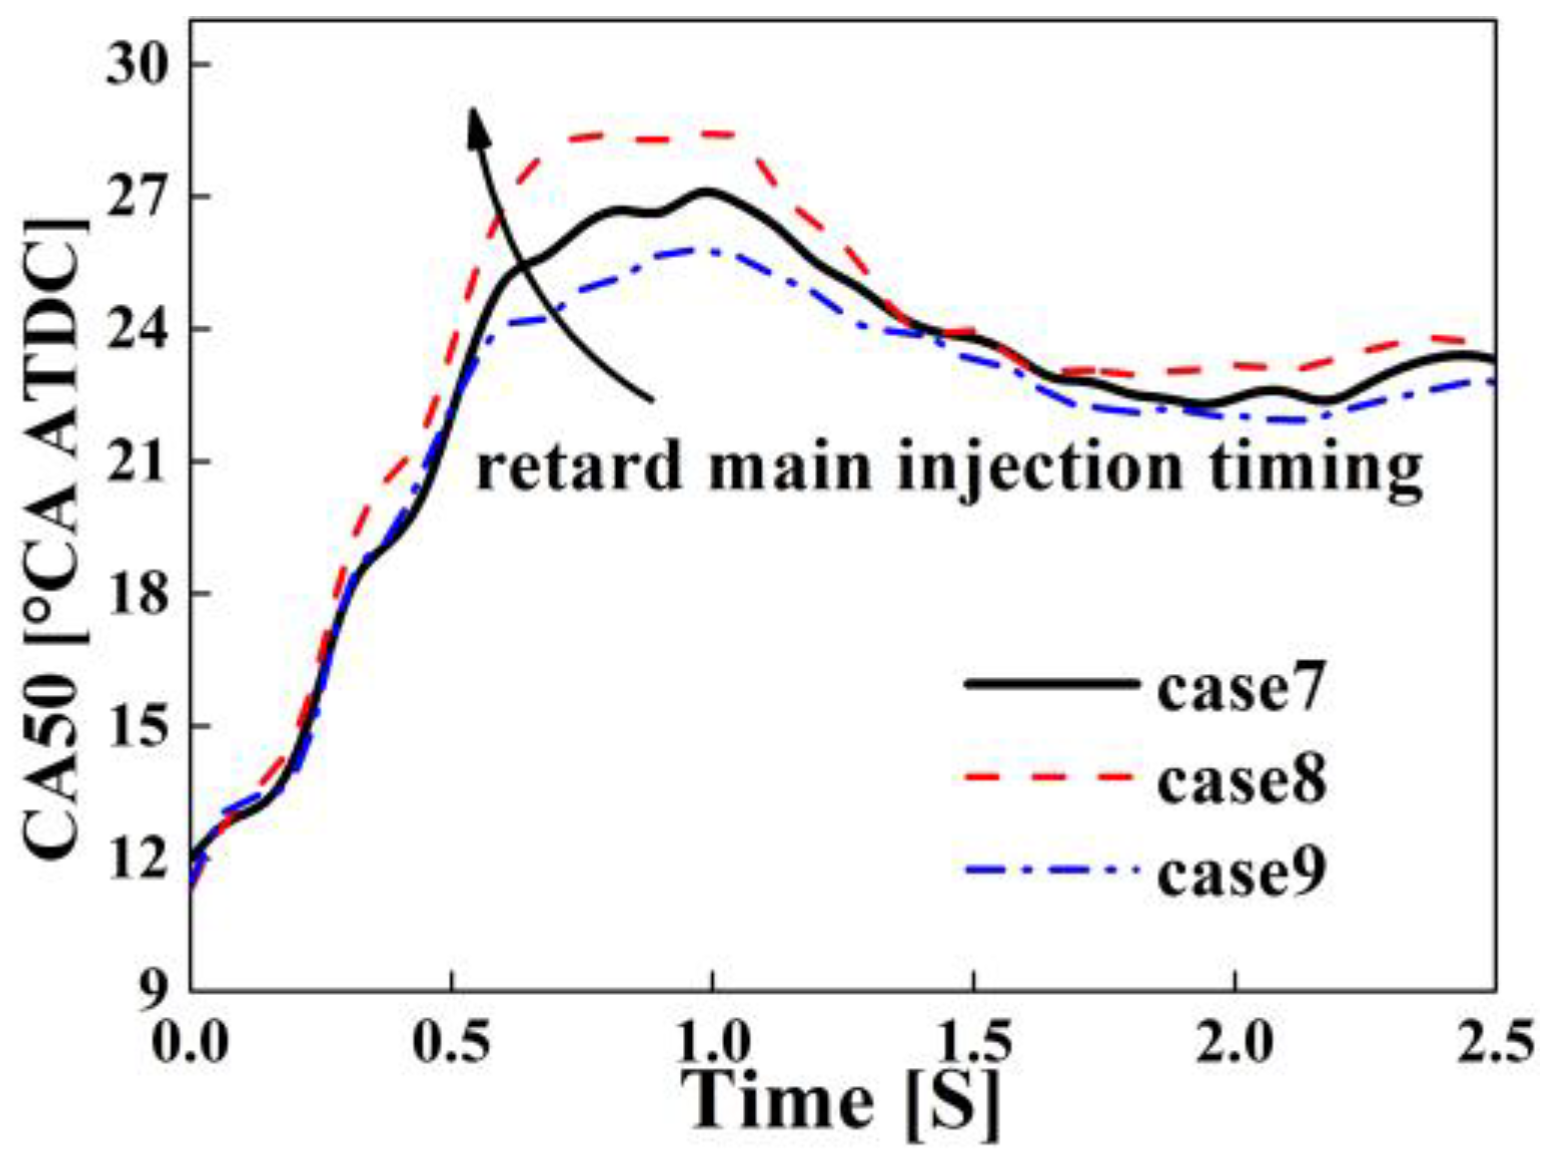
The main injection timing was adjusted according to the pattern shown in Figure 3, and the results are shown in Figure 19. The experimental results demonstrate that delaying the main injection timing leads to a gradual decrease in the peak Φ O . Cases 7 and 8 showed 0.90% and 1.56% lower peak Φ O values compared to case 9, respectively. Delayed main injection can increase exhaust energy, reducing the Φ O . However, the main injection was adjusted gradually, with differences only apparent in the later stages of the transient process. Also, the turbine has a delayed response to changing exhaust energy. Thus, the main injection timing has a minor effect on the peak Φ O .
Figure 20 illustrates that during the early stage of the transient process, the growth rate of the IMEP remains relatively consistent due to the similar main injection timing. But over time, the increasing CA50 difference causes a noticeable IMEP growth divergence as shown in Figure 21. Delayed main injection, as in case 8, shifts combustion further from the top dead center, decreasing efficiency and slowing the IMEP growth [47].
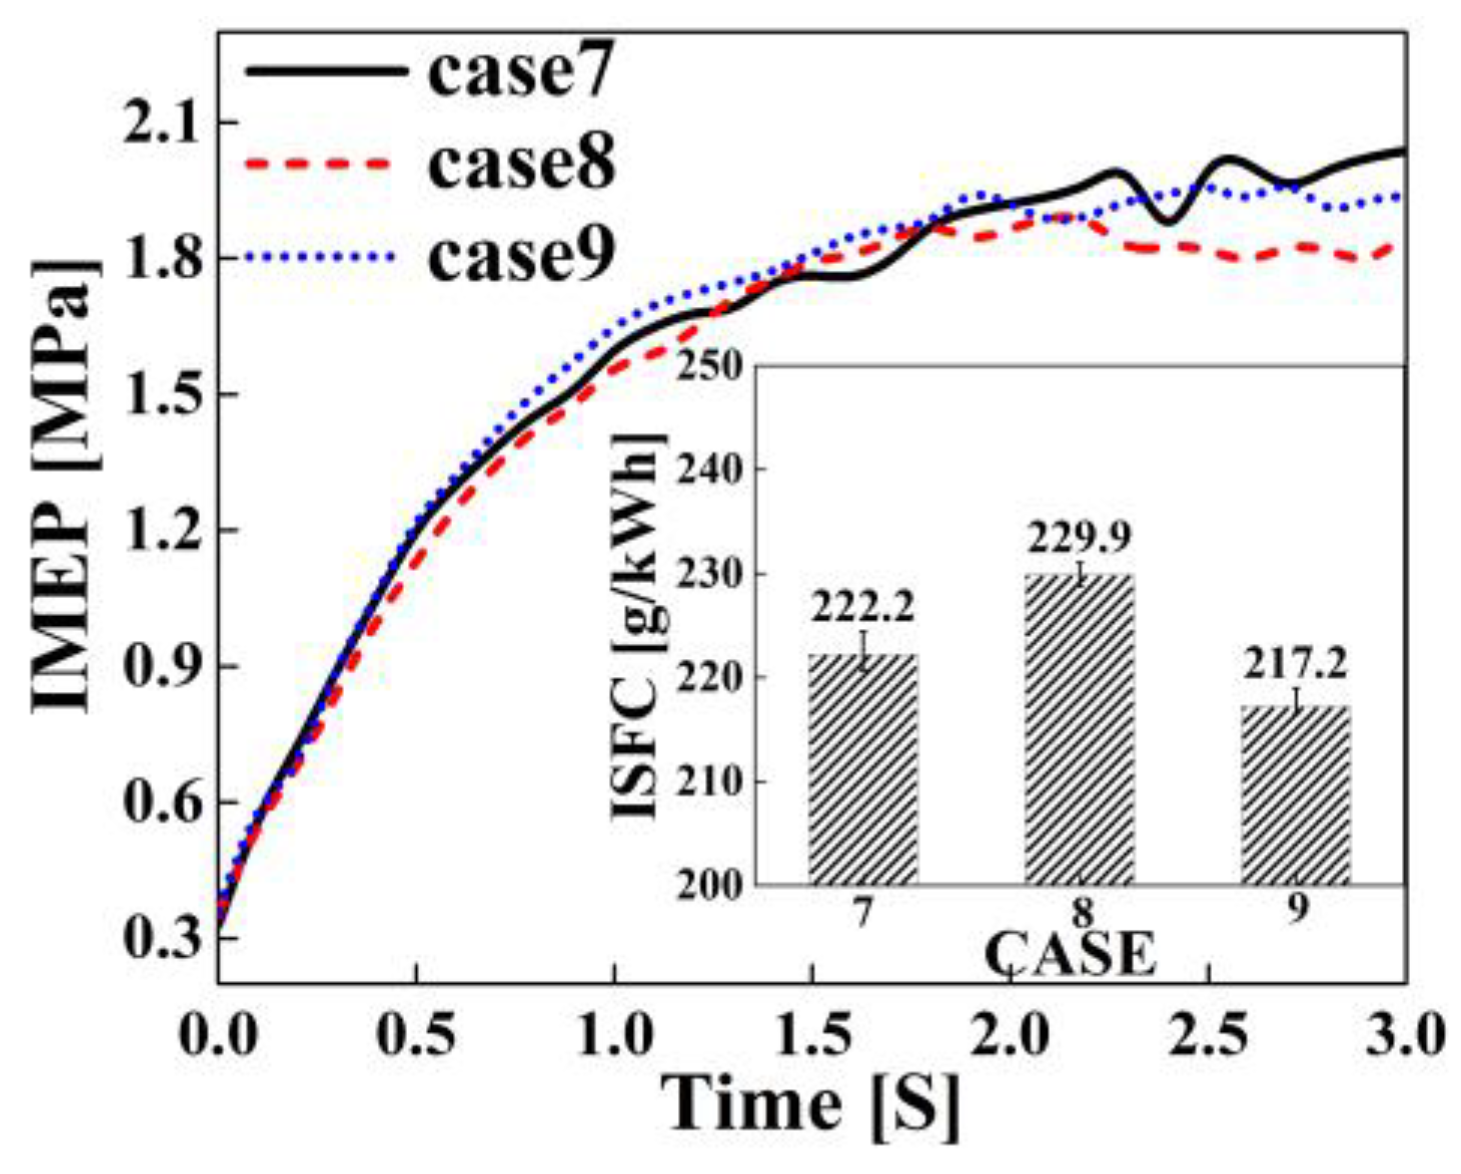
Compared to case 9, the ISFC of case 7 only increases by 2.30%, while that of case 8 increases by 5.85%. The reason is that the main injection timing of case 7 is closer to that of case 9, ensuring the IMEP growth rate in the early and middle stages of the transient process. In the late stage of the transient, the slightly higher air mass flow rate compensates for the IMEP growth rate for case 7, leading to lower ISFC deterioration.
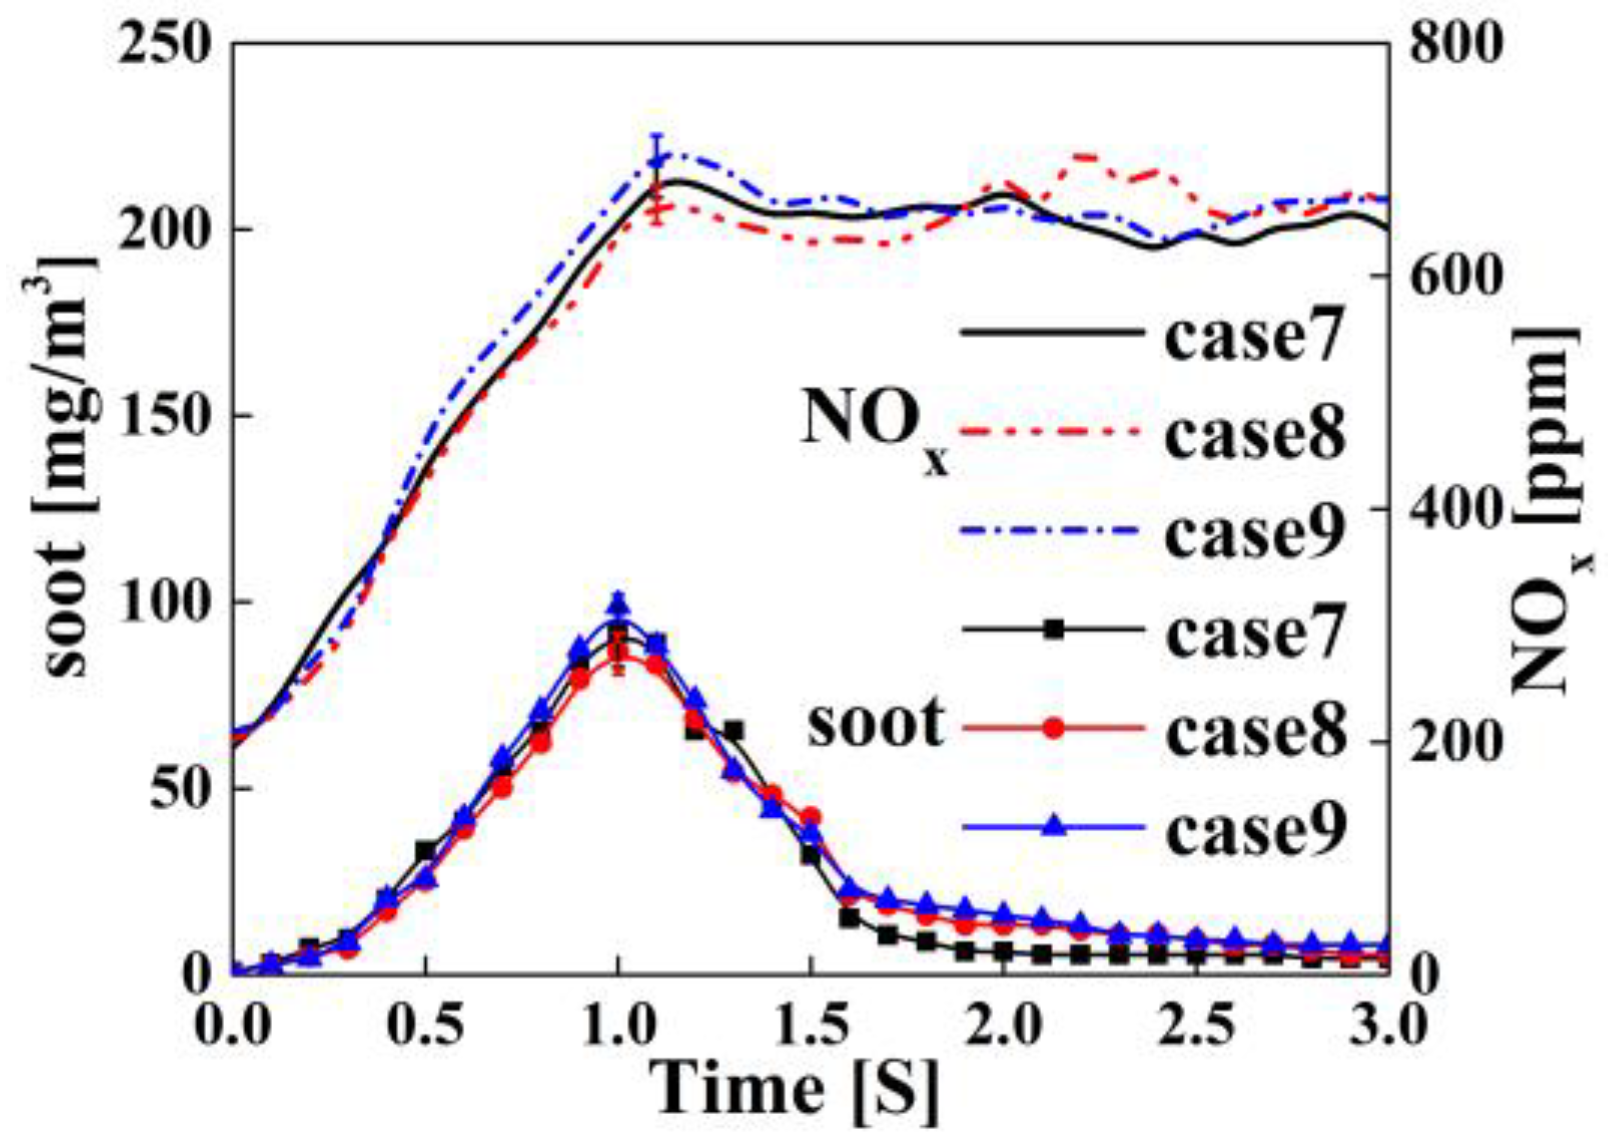
Figure 22 shows comparable soot curves, since the main injection timing has a minor effect on the Φ O . However, with the advancement of the main injection timing, the combustion becomes closer to the top dead center, which promotes NOx formation.
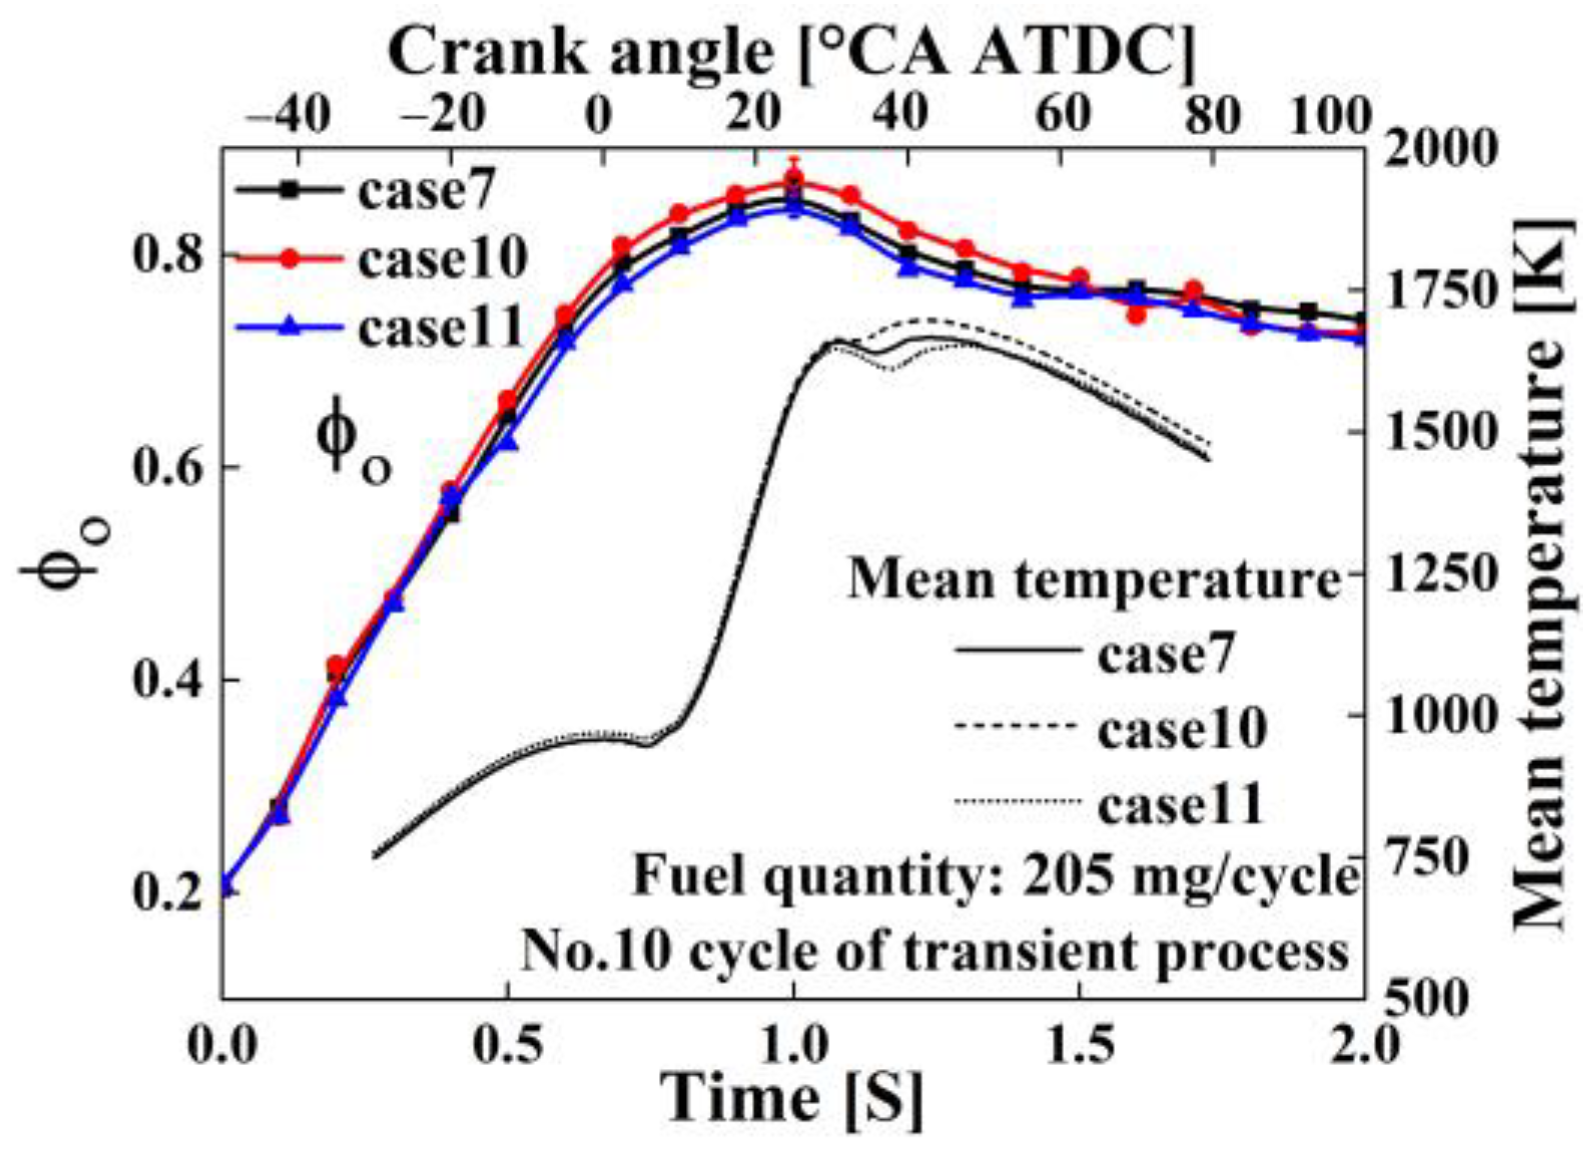
Figure 23 shows the results for the post-injection intervals of 3° (case 10), 6° (case 7), and 9° (case 11). Increasing the post-injection interval reduced the peak Φ O by 1.67% for case 7 and 2.86% for case 11 compared to case 10. Delaying post-injection timing reduces the Φ O during transients, but this optimization diminishes as the interval increases. The delay in post-injection timing leads to an increase in exhaust energy. However, an excessive delay results in lower temperature and pressure, hindering post-injection combustion and increasing incomplete combustion. This counteracts part of the exhaust energy gains from the delayed CA50. Consequently, case 11 shows less Φ O optimization.
Figure 24 shows that the post-injection interval has a minor effect on IMEP response. This is because delayed post-injection suppresses the Φ O growth, benefiting combustion during the later stage of the transient process. But delayed post-injection also reduces thermal efficiency. The combined effect of these factors results in a small difference in the IMEP and ISFC.
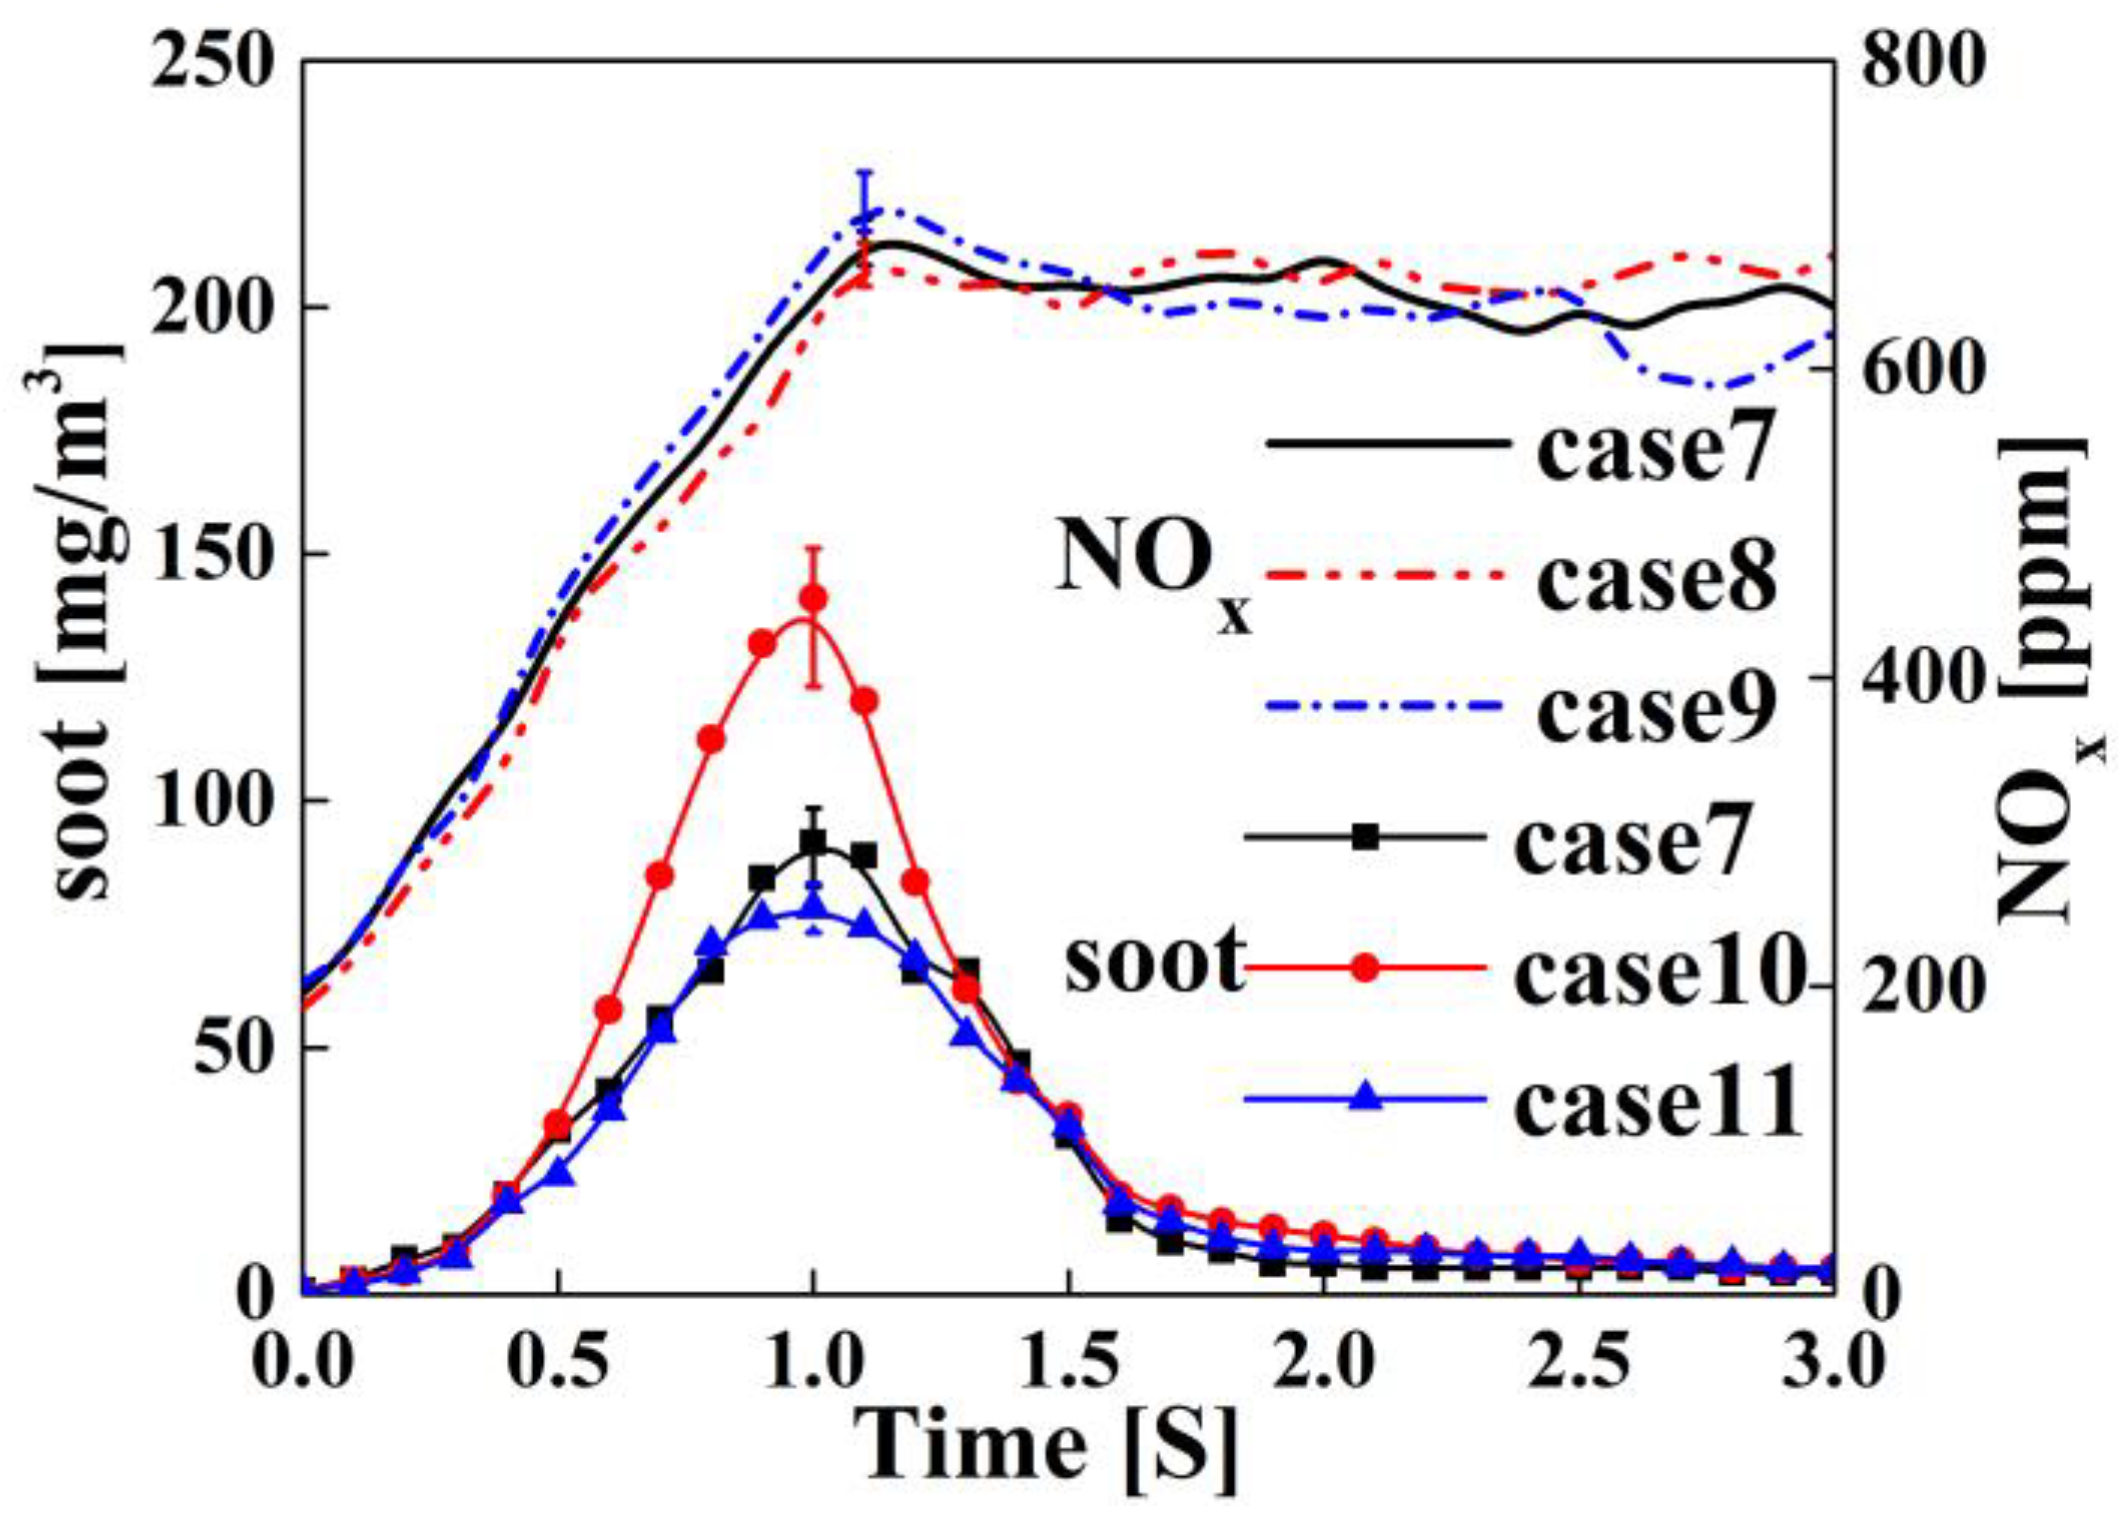
Figure 25 shows a 54.1% increase in peak soot emissions for case 10 compared to case 7. There are two reasons for this phenomenon. First, the decrease in exhaust energy leads to an increase in the Φ O . Second, due to the excessively advanced post-injection timing, part of the post-injected fuel may enter the combustion products of the main injection [48,49]. The combustion of this part of the post-injected fuel significantly deteriorates, resulting in an increase in soot emissions.
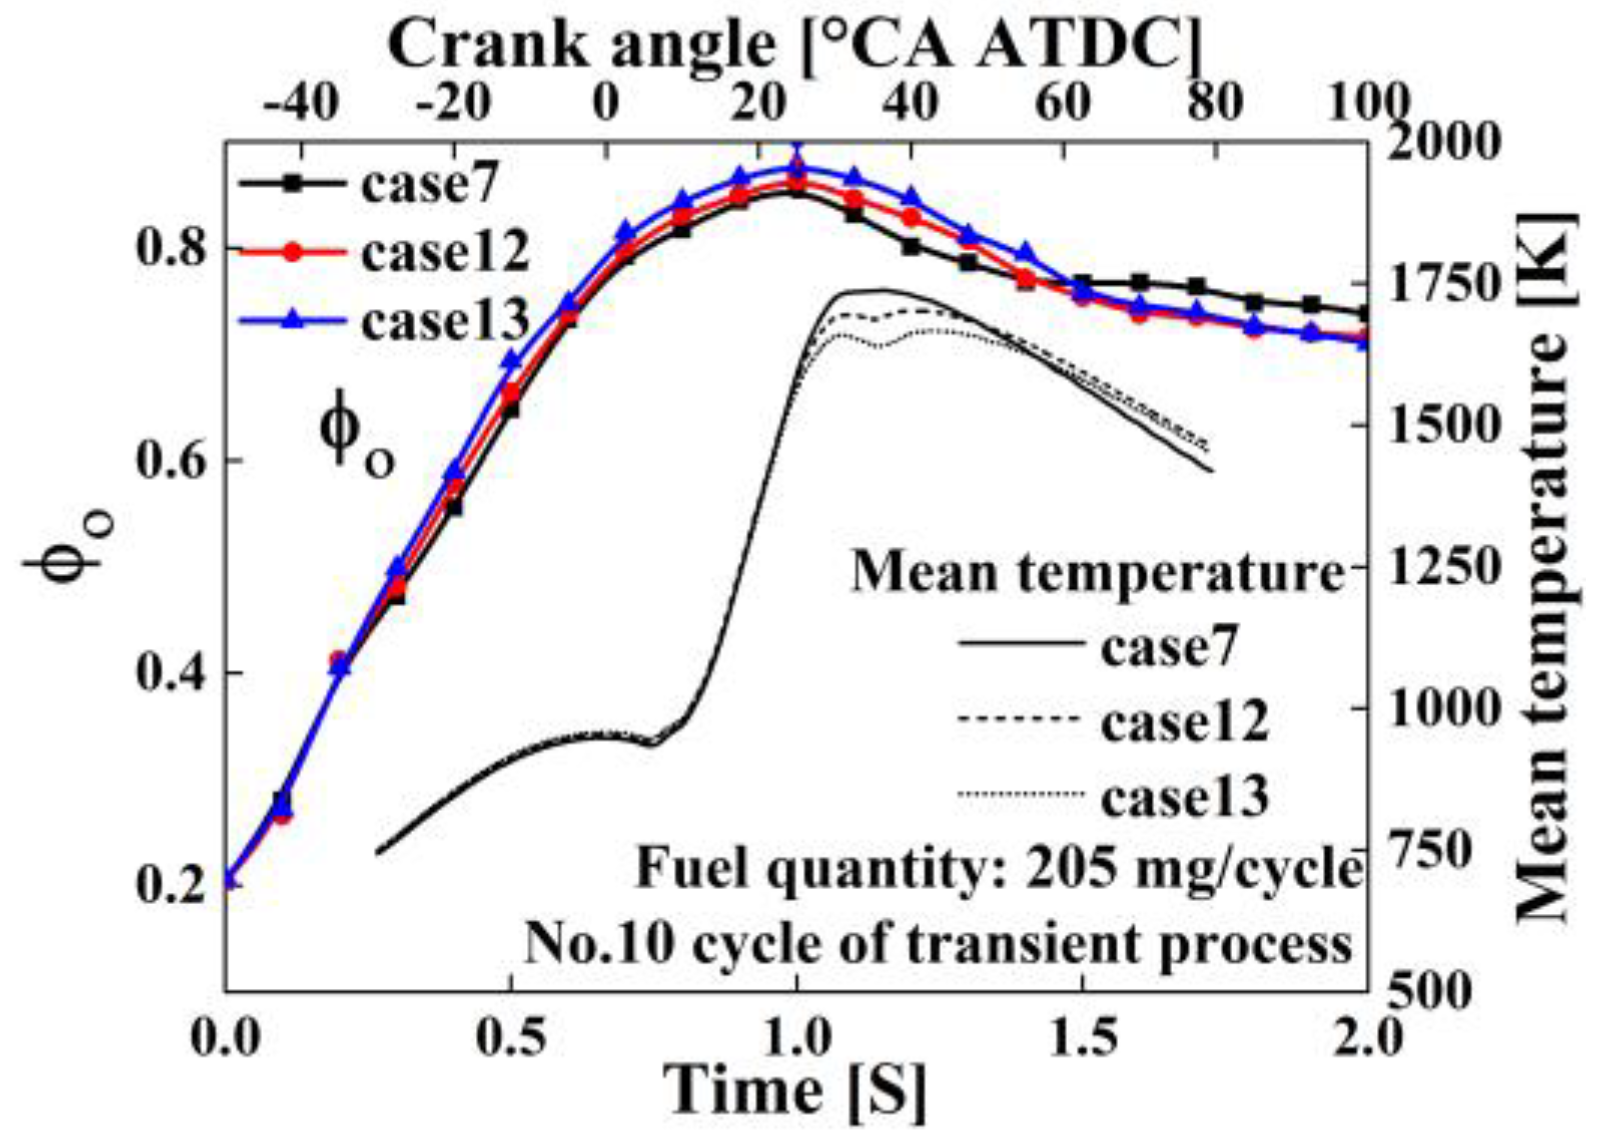
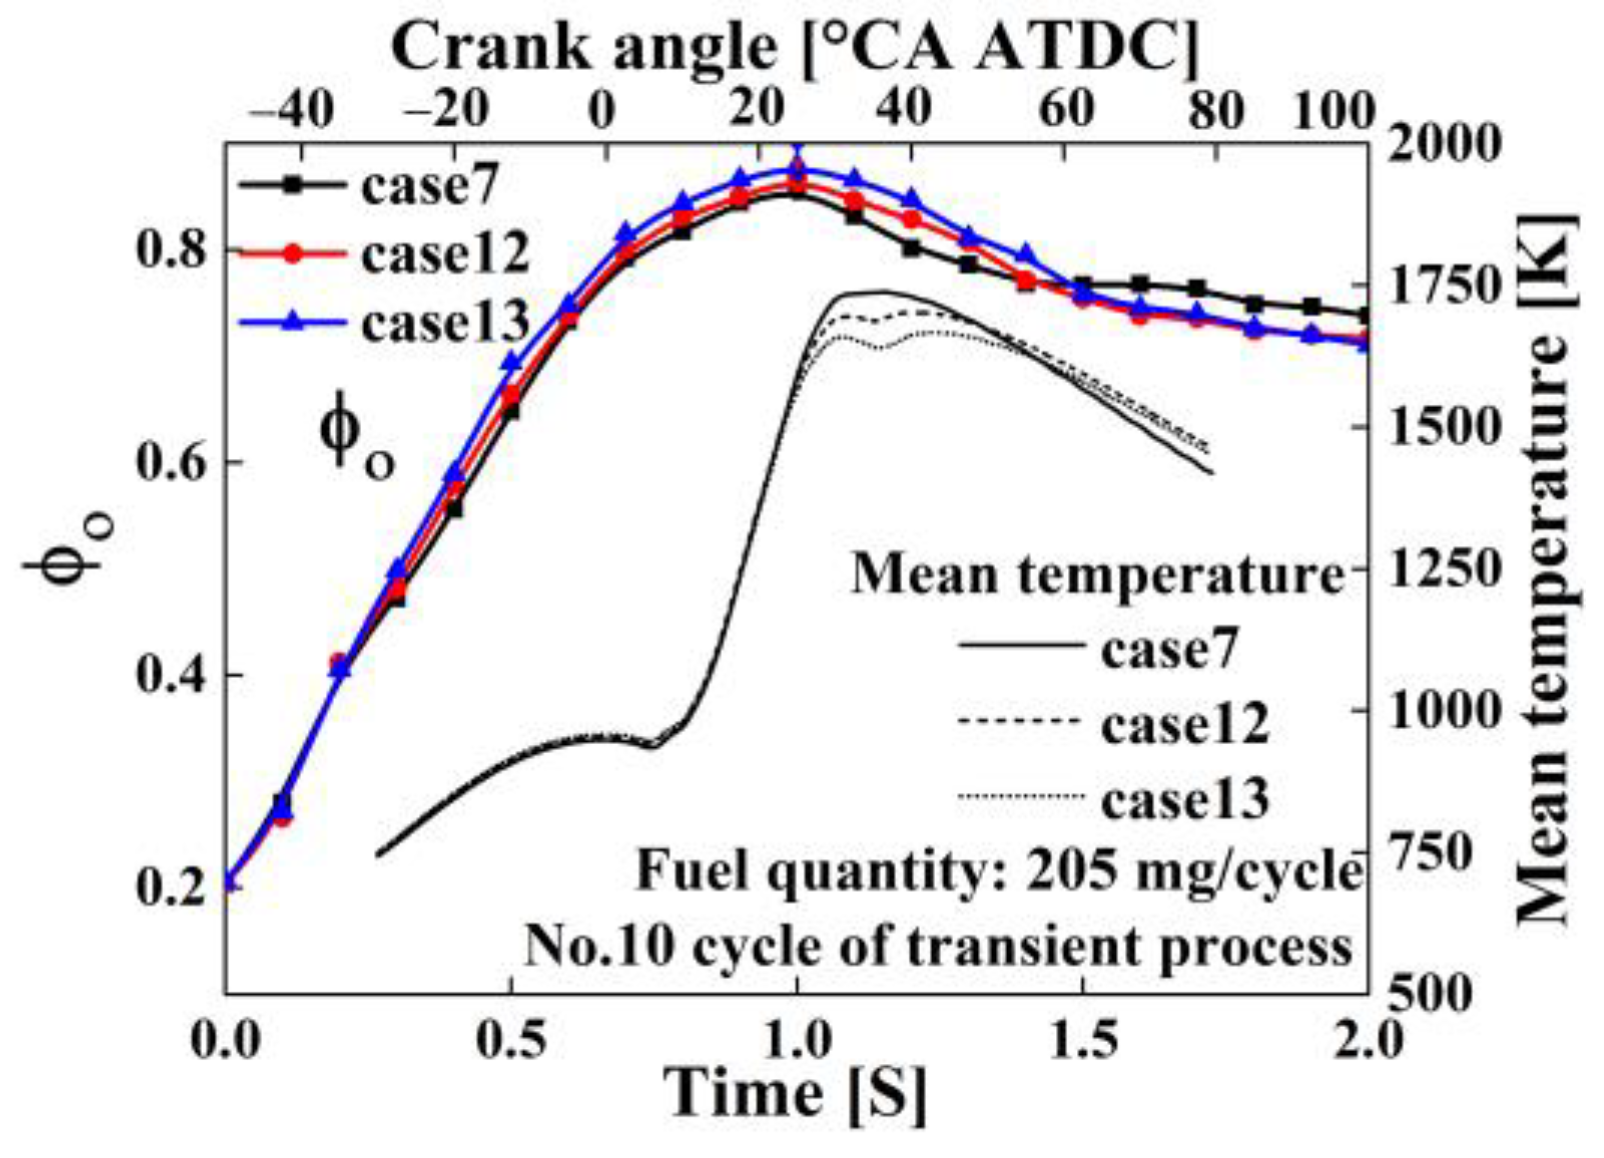
Figure 26 shows that cases 12 and 13 had 1.21% and 2.98% higher peak values of the Φ O compared to case 7, respectively. This indicates that increasing the post-injection fuel quantity can effectively enhance exhaust energy, which has a favorable impact on increasing the boost level of the turbocharger and reducing the peak value of Φ O .
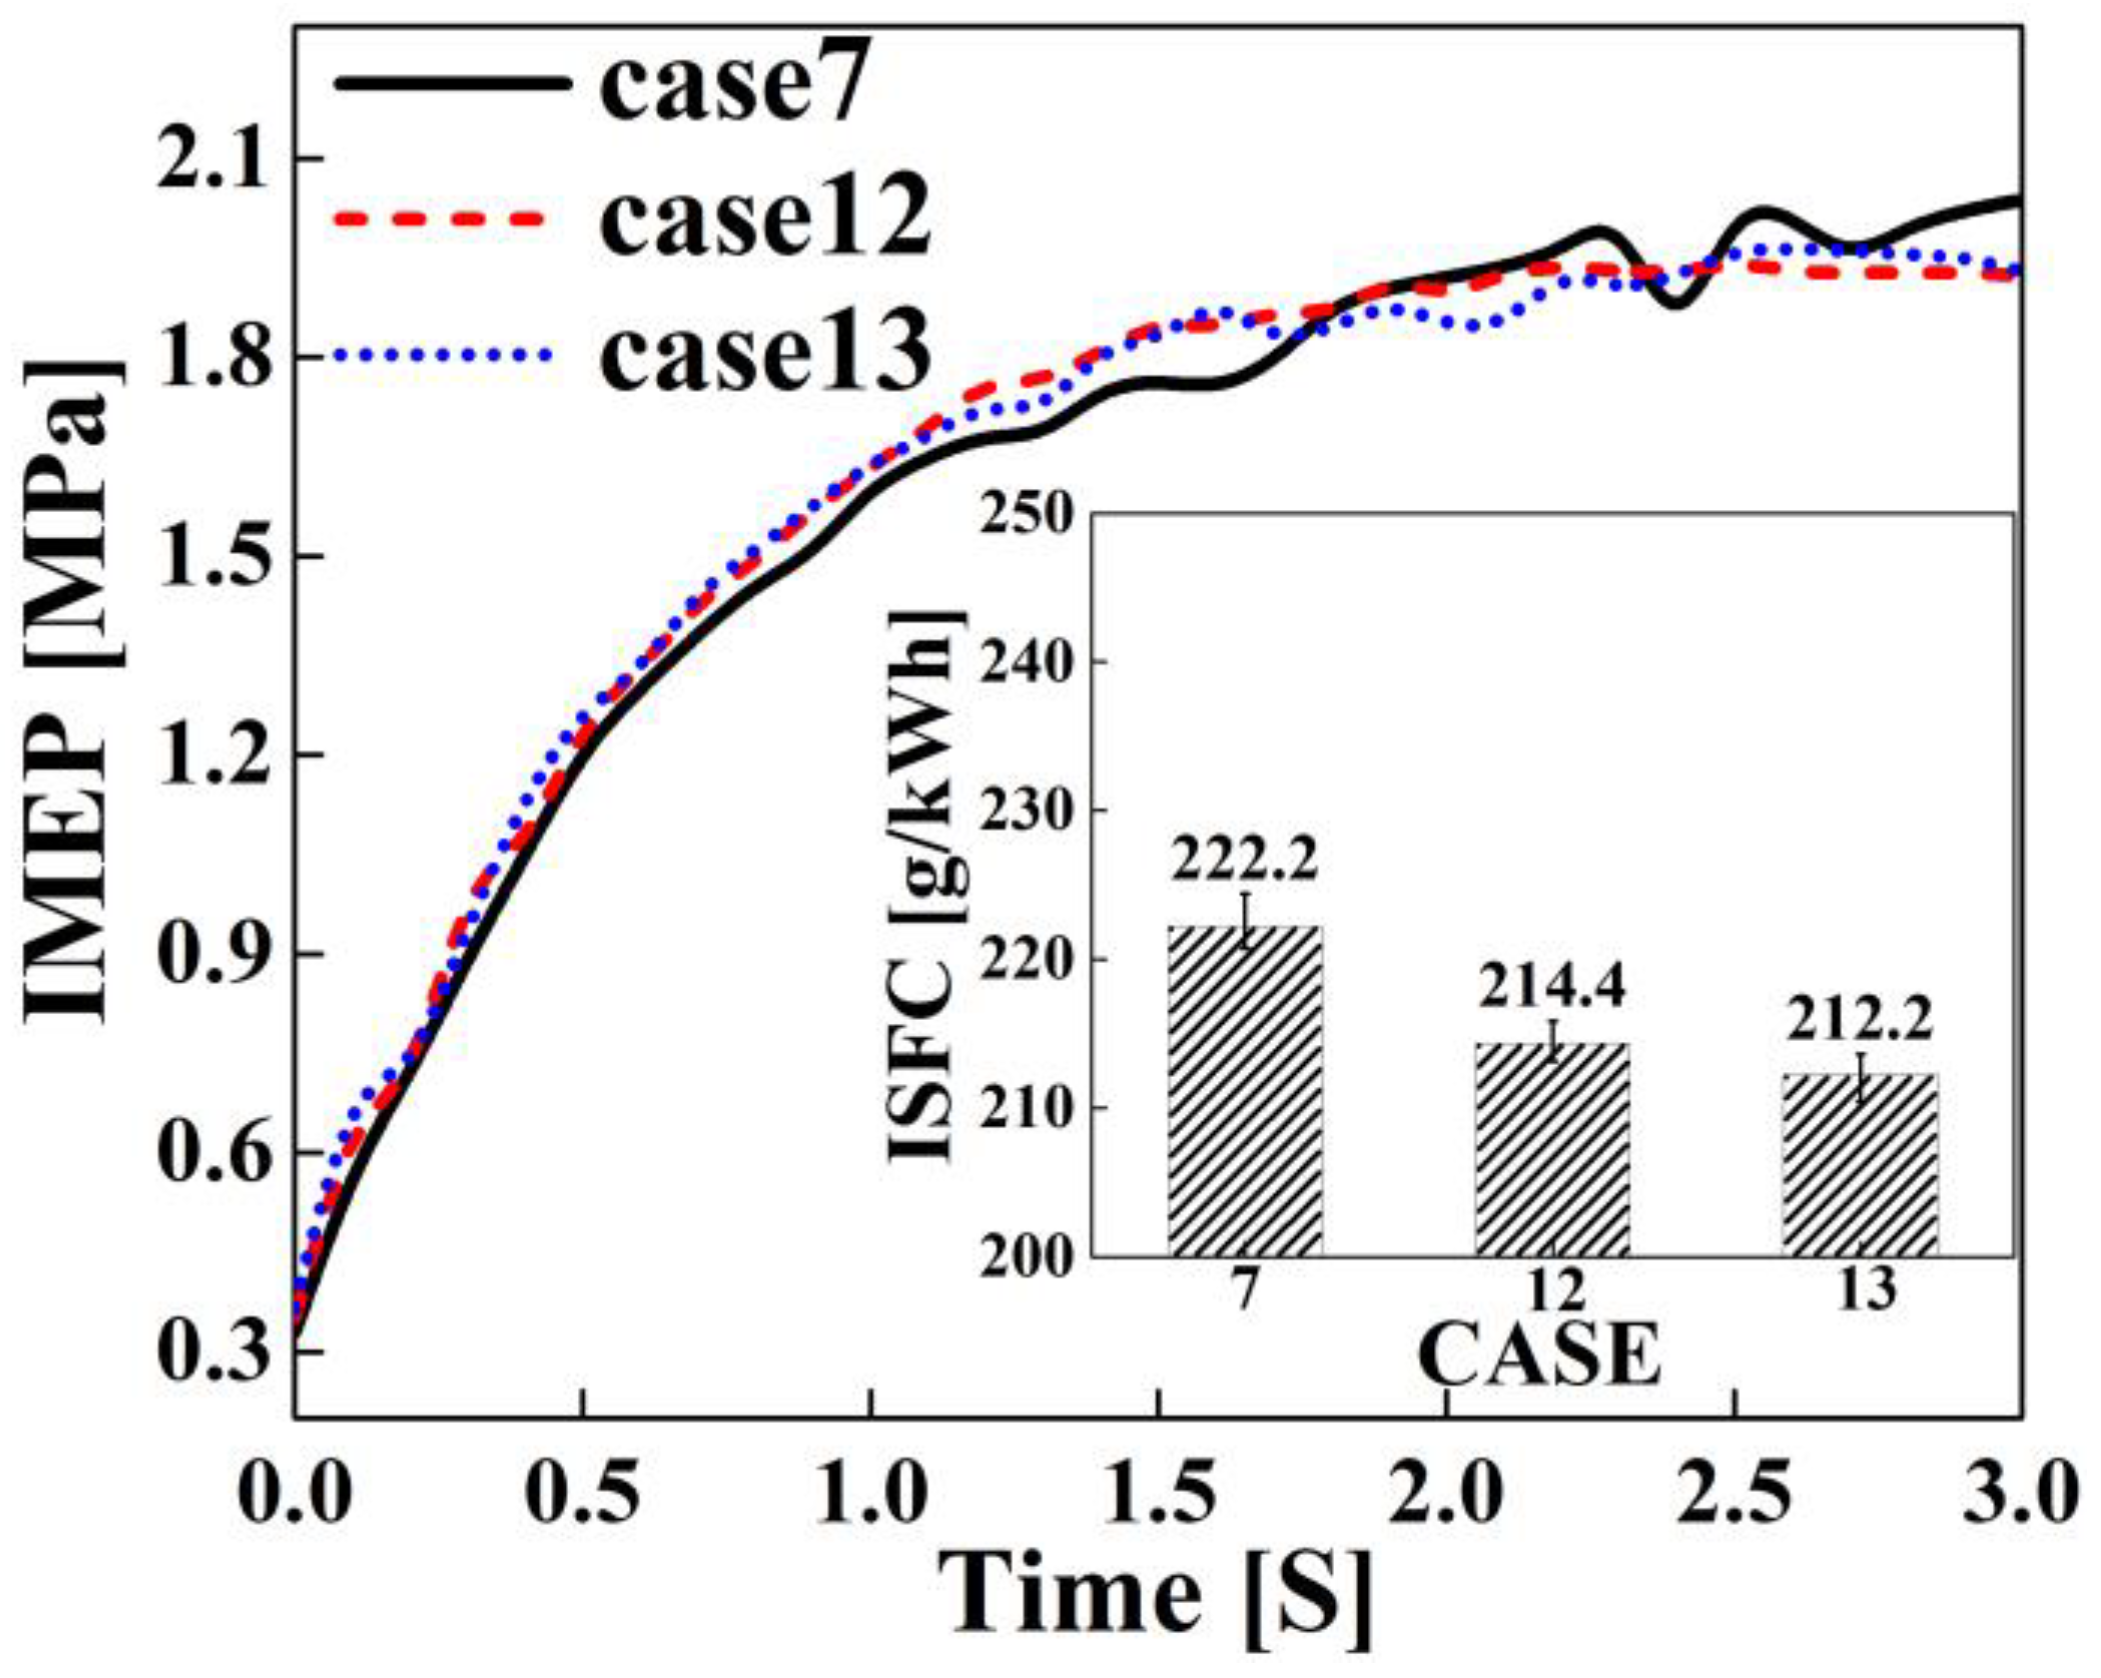
As Figure 27 shows, varying the post-injection ratio had a minor impact on the IMEP growth rate. A higher post-injection ratio decreases the Φ O , while lower main injection fuel enhances fuel–air mixing, both improving thermal efficiency. However, as the amount of post-injection fuel increases, the delayed CA50 leads to a decrease in thermal efficiency. With these counterbalancing effects, cases 12 and 13 exhibit similar IMEP response and fuel consumption.
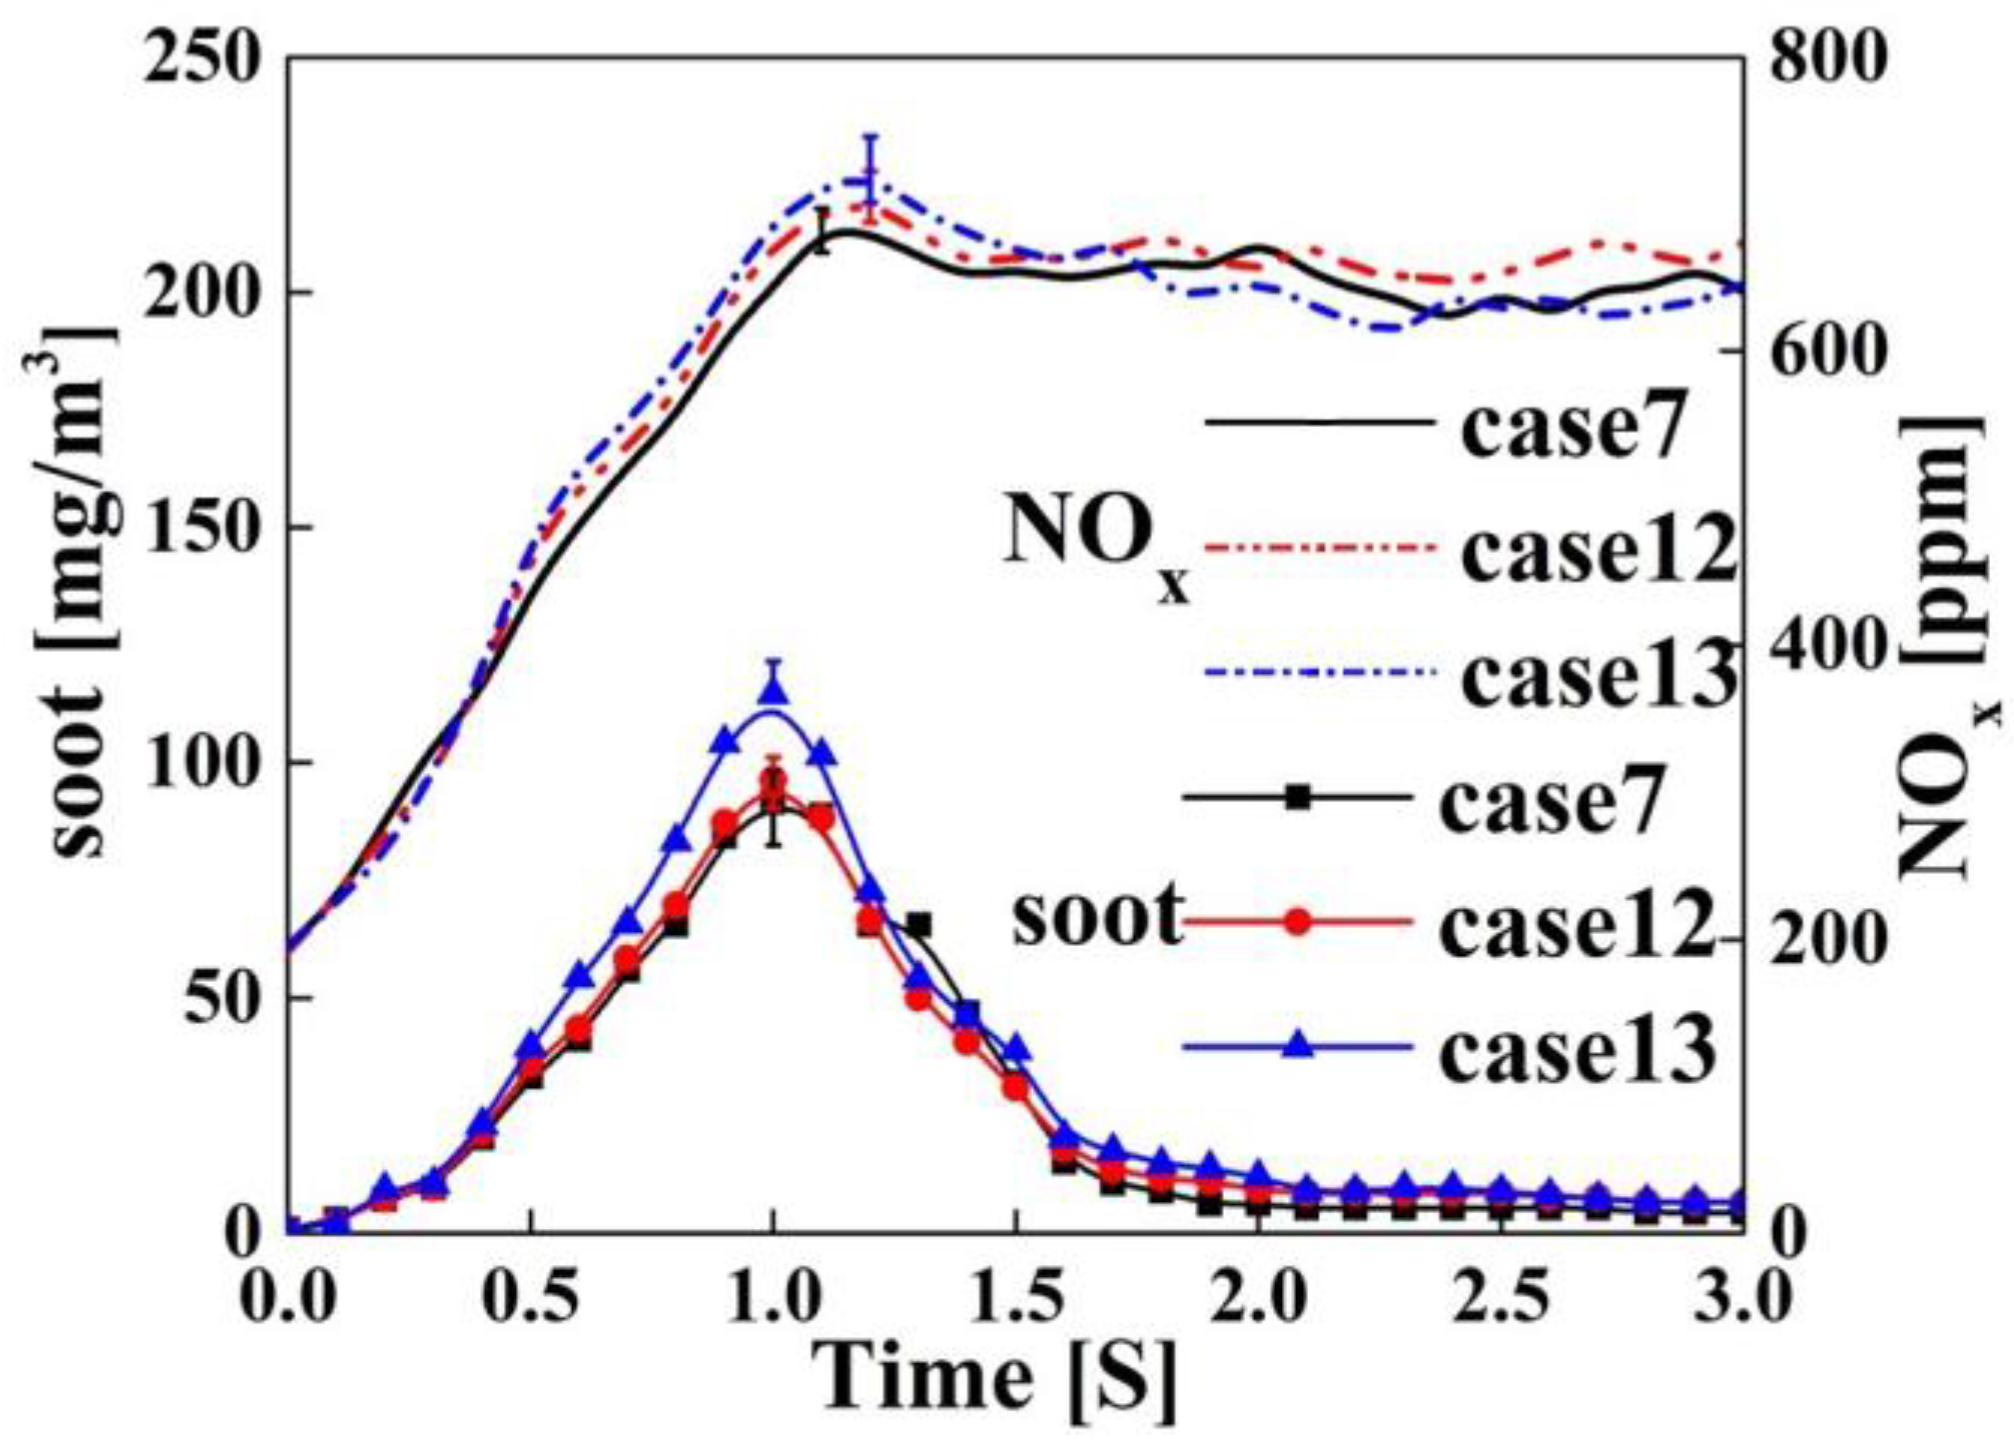
Figure 28 shows that peak soot decreased by 16.0% when the post-injection ratio increased from 8% (case 13) to 12% (case 12). Further increasing the post-injection ratio from 12% to 16% (case 7) lowered the peak soot only 4.90%. A higher post-injection ratio reduces the main injection fuel mixing difficulty, decreasing soot formation. Higher late-stage combustion temperatures also improve soot oxidation. However, an excessively high post-injection ratio deteriorates the mixing and combustion of the post-injected fuel, under the condition of a high transient air–fuel equivalence ratio. From the temperature curves in Figure 25, it can be observed that the late combustion stage temperature of case 7 is lower than that of case 13, due to the combined effects of decreased temperature during the main injection combustion and the deterioration of post-injection fuel combustion. The lower temperature reduces soot oxidation and exhaust energy, decreasing the soot reduction.

4. Conclusions and Prospects

During the transient process, EGR can effectively reduce NOx emissions. However, since the high-pressure EGR system simultaneously affects the intake oxygen concentration and the turbocharger response, it has a significant impact on soot emissions. On the other hand, adjusting the fuel injection strategy can effectively reduce soot emissions by modifying the in-cylinder combustion. EGR and the fuel injection strategy can synergistically improve transient process performance. The study results show the following:
1. Extending the high-pressure EGR mixing circuit enhances exhaust gas homogeneity, mitigating the deterioration of soot emissions from excessive EGR rates in certain cylinders. This effect is particularly noticeable during transient processes that operate near high Φ O levels. Compared with the short mixing circuit, the long mixing circuit can achieve a maximum reduction of 47.0% in the peak value of soot emissions during transient processes.
2. Delayed EGR valve opening can improve turbine response and intake airflow but also increases the EGR rate fluctuation for the short circuit, due to a higher flow velocity and intake–exhaust pressure differential. Excessively early opening timing hinders turbine acceleration, causing a high Φ O and substantial soot deterioration. Conversely, opening the EGR valve too late significantly increases NOx emissions during the later stages of the transient process, producing prominent spikes. The research results indicate that the optimal opening time for the high-pressure EGR valve should be set at 0.5 s. Compared to case 1, case 4 achieved a 72.1% reduction in the peak value of soot emissions, while only experiencing a 2.99% increase in peak NOx emissions.
3. When using dual injection with main injection and post-injection, the increased exhaust energy brought by the post-injection can alleviate the problem of an excessive Φ O during transient processes and improve in-cylinder combustion. The research results indicate that excessively advanced timing of the post-injection can lead to increased soot emissions, while significantly delaying the post-injection timing and increasing the post-injection ratio have a limited impact on optimizing soot emissions and result in a significant deterioration of the indicated thermal efficiency and IMEP response speed. In this study, the optimal transient performance can be achieved with a fuel injection timing of (1, 6)~(−2, 6) and a post-injection fuel ratio of 12% (case 12). Compared to case 4, there is a 28.1% reduction in soot emissions, a 4.73% reduction in peak NOx emissions, a 1.87% increase in the ISFC, and a 1.34% decrease in the IMEP.
In previous research from Wu et al. [50], they mainly analyzed the impact of the EGR mixing time on diesel engine cyclic variation and experimentally compared the impacts of EGR systems with different mixing times on emissions during 1–3 s transient processes. However, since they did not optimize the EGR valve control, the maximum soot emission reduction was only 37.5%. This study achieves a 72.1% soot emission reduction through co-optimizing the EGR system layout and control parameters. On this basis, soot is further reduced by 28.1% with injection control optimization while decreasing NOx emissions. These two measures make the final soot emission reduction reach 79.9%. The emission optimization effect is quite significant. Soot emission, as the main component of PM emissions, is extremely harmful to human health and the environment. The significant reduction in soot emissions will provide benefits for public health and environmental sustainability.
From the perspective of practical engineering applications, when engines are upgraded with EGR systems, this study can provide very valuable references for their system design and layout, which can effectively avoid engine performance deterioration caused by improper EGR design and layout and thus significantly reduce development costs.
Due to the limitations of experimental research, it is challenging to conduct in-depth studies on the airflow dynamics of the transient process EGR system and to optimize and analyze components such as the engine intake manifold. Further work is necessary in this area. This includes, but is not limited to, establishing three-dimensional engine models suitable for transient process studies and conducting simulation research on the detailed airflow dynamics of the EGR system during transient processes.
Moreover, a sustainability analysis of engine transient process fuel consumption and emissions using advanced sustainability assessment tools such as life cycle assessment, exergy, and their combinations should be considered. For instance, establishing computational models to calculate the exergy required for the dilution of NOx and soot to safe concentrations would serve as significant indicators for evaluating optimization effects in the future.

Author Contributions

Conceptualization, W.G.; methodology, W.G.; validation, W.G. and W.S.; formal analysis, W.G.; investigation, W.G.; resources, W.S.; data curation, W.G.; writing—original draft preparation, W.G.; writing—review and editing, W.S.; supervision, W.S.; project administration, W.S.; funding acquisition, W.S. All authors have read and agreed to the published version of the manuscript.

Funding

This work has been funded by National Key Research and Development Program of China (NO. 2022YFE0100100).

Conflicts of Interest

The authors declare no potential conflicts of interest with respect to the research, authorship, and publication of this article.

Nomenclature

ItemDefinition
IVCAIntake valve closing actuator
EGRExhaust gas recirculation
SMCShort mixing circuit
LMCLong mixing circuit
ISFCIndicated fuel specific consumption (g/kWh)
IMEPIndicated mean effective pressure (MPa)
Φ o Fuel–oxygen equivalent ratio
CA50Crank angle at 50% accumulated heat release
PMParticulate matter
DPFDiesel particulate filters
VGTVariable geometry turbocharger
NOxNitrogen oxide
IVOIntake valve opening
EVOExhaust valve opening
IVCIntake valve closing
EVCExhaust valve closing
ATDCAfter top dead center
BTDCBefore top dead center
CACrank angle
FSOFull scale output
m e c u Fuel consumption measured by ECU
P Indicated engine power (kW)
S Engine speed (rpm)
T Indicated engine torque (N∙m)
V s Engine cylinder displacement (dm3)
n Number of cylinders
τ Number of engine strokes
m f u e l Mass of in-cylinder fuel (g)
m o Mass of in-cylinder oxygen (g)
F O 2 s t o i c Theoretical fuel–oxygen ratio
C O 2 , i n t a k e CO2 concentration in the intake air (%)
C O 2 , e x h a u s t CO2 concentration in exhaust (%)
C O 2 , a i r CO2 concentration in the fresh air (%)
R E G R EGR rate (%)
m N O x Specific emission of NOx (g/kWh)
u N O x Exhaust gas constant for NOx
c N O x , i Instantaneous concentration of NOx in the exhaust gas (ppm)
q m e w , i Instantaneous exhaust mass flow (kg/h)
k h , D Humidity correction factor for NOx
P i Instantaneous engine power (kW)
m s o o t Specific emission of soot [g/kWh]
r d Dilution ratio
ρ 0 Density of the exhaust gas under standard conditions (kg/m3)
c s o o t , i Instantaneous concentration of soot in the exhaust gas (mg/m3)
T m e a n Mean temperature in cylinder (K)
p In-cylinder pressure (Pa)
V Instantaneous cylinder volume (m3)
μ Molar mass of the gas (g/mol)
M Mass of the in-cylinder charge (g)
R Ideal gas constant (Pa∙m3∙mol−1∙K−1)

References

  1. Giakoumis, E.G.; Rakopoulos, C.D.; Dimaratos, A.M.; Rakopoulos, D.C. Exhaust emissions of diesel engines operating under transient conditions with biodiesel fuel blends. Prog. Energy Combust. Sci. 2012, 38, 691–715. [Google Scholar] [CrossRef]
  2. Rakopoulos, C.D.; Giakoumis, E.G. Diesel Engine Transient Operation: Principles of Operation and Simulation Analysis; Springer Science & Business Media: London, UK, 2009. [Google Scholar]
  3. Nilsson, T.; Froberg, A.; Aslund, J. Optimal Operation of a Turbocharged Diesel Engine during Transients. SAE Int. J. Engines 2012, 5, 571–578. [Google Scholar] [CrossRef]
  4. Rakopoulos, C.; Dimaratos, A.; Giakoumis, E.; Peckham, M. Experimental Assessment of Turbocharged Diesel Engine Transient Emissions during Acceleration, Load Change and Starting; SAE Technical Paper 2010-01-1287; SAE International: Troy, MI, USA, 2010. [Google Scholar]
  5. Hagena, J.R.; Filipi, Z.; Assanis, D.N. Transient Diesel Emissions: Analysis of Engine Operation during a Tip-In; SAE Technical Paper 2006-01-1151; SAE International: Troy, MI, USA, 2006. [Google Scholar] [CrossRef]
  6. Zhang, H.; Tang, X.; Qian, Y.; Shi, L.; Deng, K. Study on optimal control strategy for regulated two-stage turbocharged diesel engine during transient process. J. Mech. Sci. Technol. 2021, 35, 5699–5712. [Google Scholar] [CrossRef]
  7. Liu, Z.; Yuan, X.; Tian, J.; Han, Y.; Li, R.; Gao, G. Investigation of Sectional-Stage Loading Strategies on a Two-Stage Turbocharged Heavy-Duty Diesel Engine under Transient Operation with EGR. Energies 2018, 11, 69. [Google Scholar] [CrossRef] [Green Version]
  8. Hosseini, S.H.; Tsolakis, A.; Alagumalai, A.; Mahian, O.; Lam, S.S.; Pan, J.; Peng, W.; Tabatabaei, M.; Aghbashlo, M. Use of hydrogen in dual-fuel diesel engines. Prog. Energy Combust. Sci. 2023, 98, 101100. [Google Scholar] [CrossRef]
  9. Onorati, A.; Payri, R.; Vaglieco, B.; Agarwal, A.; Bae, C.; Bruneaux, G.; Canakci, M.; Gavaises, M.; Günthner, M.; Hasse, C.; et al. The role of hydrogen for future internal combustion engines. Int. J. Engine Res. 2022, 23, 529–540. [Google Scholar] [CrossRef]
  10. Dinesha, P.; Kumar, S.; Rosen, M.A. Effects of particle size of cerium oxide nanoparticles on the combustion behavior and exhaust emissions of a diesel engine powered by biodiesel/diesel blend. Biofuel Res. J. 2021, 8, 1374–1383. [Google Scholar] [CrossRef]
  11. Zhang, W.; Song, C.; Lv, G.; Bi, F.; Qiao, Y.; Wang, L.; Zhang, X. Properties and oxidation of in-cylinder soot associated with exhaust gas recirculation (EGR) in diesel engines. Proc. Combust. Inst. 2021, 38, 1319–1326. [Google Scholar] [CrossRef]
  12. Pan, M.; Qian, W.; Wei, H.; Feng, D.; Pan, J. Effects on performance and emissions of gasoline compression ignition engine over a wide range of internal exhaust gas recirculation rates under lean conditions. Fuel 2020, 265, 116881. [Google Scholar] [CrossRef]
  13. Zhang, Q.; Chen, G.; Zheng, Z.; Liu, H.; Xu, J.; Yao, M. Combustion and emissions of 2,5-dimethylfuran addition on a diesel engine with low temperature combustion. Fuel 2013, 103, 730–735. [Google Scholar] [CrossRef]
  14. Park, Y.; Bae, C. Experimental study on the effects of high/low pressure EGR proportion in a passenger car diesel engine. Appl. Energy 2014, 133, 308–316. [Google Scholar] [CrossRef]
  15. Dimitriou, P.; Turner, J.; Burke, R.; Copeland, C. The benefits of a mid-route exhaust gas recirculation system for two-stage boosted engines. Int. J. Engine Res. 2018, 19, 553–569. [Google Scholar] [CrossRef] [Green Version]
  16. Cornolti, L.; Onorati, A.; Cerri, T.; Montenegro, G.; Piscaglia, F. 1D simulation of a turbocharged Diesel engine with comparison of short and long EGR route solutions. Appl. Energy 2013, 111, 1–15. [Google Scholar] [CrossRef]
  17. Van Aken, M.; Willems, F.; de Jong, D.-J. Appliance of High EGR Rates with a Short and Long Route EGR System on a Heavy Duty Diesel Engine; SAE Technical Paper 2007-01-0906; SAE International: Troy, MI, USA, 2007. [Google Scholar] [CrossRef]
  18. Luján, J.M.; Guardiola, C.; Pla, B.; Reig, A. Switching strategy between HP (high pressure)- and LPEGR (low pressure exhaust gas recirculation) systems for reduced fuel consumption and emissions. Energy 2015, 90, 1790–1798. [Google Scholar] [CrossRef] [Green Version]
  19. Huang, Y.; Ng, E.C.; Surawski, N.C.; Zhou, J.L.; Wang, X.; Gao, J.; Lin, W.; Brown, R.J. Effect of diesel particulate filter regeneration on fuel consumption and emissions performance under real-driving conditions. Fuel 2022, 320, 123937. [Google Scholar] [CrossRef]
  20. Galindo, J.; Climent, H.; de la Morena, J.; González-Domínguez, D.; Guilain, S. Assessment of air management strategies to improve the transient response of advanced gasoline engines operating under high EGR conditions. Energy 2022, 262, 125586. [Google Scholar] [CrossRef]
  21. Pennington, J.; Puzinauskas, P.V.; Cook, J. Simultaneous Control Optimization of Variable-Geometry Turbocharger and High Pressure EGR on a Medium Duty Diesel Engine; SAE Technical Paper 2021-01-1178; SAE International: Troy, MI, USA, 2021. [Google Scholar] [CrossRef]
  22. Zhang, F.; Wang, Z.; Tian, J.; Li, L.; Yu, K.; He, K. Effect of EGR and Fuel Injection Strategies on the Heavy-Duty Diesel Engine Emission Performance under Transient Operation. Energies 2020, 13, 566. [Google Scholar] [CrossRef] [Green Version]
  23. Hariganesh, S.K.R.; Sathyanadan, M.; Krishnan, S.; Vadivel, P.; Vamsidhar, D. Computational analysis of EGR mixing inside the intake system & experimental investigation on diesel engine for LCV. Int. J. Eng. Sci. Technol. 2011, 3, 2350–2358. [Google Scholar]
  24. Dhatkar, S.A.; Rajesh, S.K.; Garg, S.; Emran, A.; Sharma, V. EGR Mixer Optimization for Achieving Uniform Cylinder EGR Distribution Using 1D-3D CFD Coupled Simulation Approach to Meet Future Stage V Emission Legislation in India; SAE Technical Paper 2020-28-0390; SAE International: Troy, MI, USA, 2020. [Google Scholar] [CrossRef]
  25. Benajes, J.; Martín, J.; García, A.; Villalta, D.; Warey, A. Swirl ratio and post injection strategies to improve late cycle diffusion combustion in a light-duty diesel engine. Appl. Therm. Eng. 2017, 123, 365–376. [Google Scholar] [CrossRef] [Green Version]
  26. O’Connor, J.; Musculus, M.P.; Pickett, L.M. Effect of post injections on mixture preparation and unburned hydrocarbon emissions in a heavy-duty diesel engine. Combust. Flame 2016, 170, 111–123. [Google Scholar] [CrossRef] [Green Version]
  27. Mancaruso, E.; Merola, S.S.; Vaglieco, B.M. Study of the multi-injection combustion process in a transparent direct injection common rail diesel engine by means of optical techniques. Int. J. Engine Res. 2008, 9, 483–498. [Google Scholar] [CrossRef]
  28. Bobba, M.; Musculus, M.; Neel, W. Effect of Post Injections on In-Cylinder and Exhaust Soot for Low-Temperature Combustion in a Heavy-Duty Diesel Engine. SAE Int. J. Eng. 2010, 3, 496–516. [Google Scholar] [CrossRef]
  29. Nimodia, S.; Senthilkumar, K.; Halbe, V.; Ghodke, P.R.; Velusamy, R. Simultaneous Reduction of NOx and Soot Using Early Post Injection; SAE Technical Paper 2013-26-0055; SAE International: Troy, MI, USA, 2013. [Google Scholar] [CrossRef]
  30. Pan, W.; Wu, Y.; Jing, Y.; Zizeng, H. Impact of Post-Injection Parameters on Soot and Hydrocarbon Emissions in a Common-Rail Heavy-Duty Diesel Engine; SAE Technical Paper 2020-01-0374; SAE International: Troy, MI, USA, 2020. [Google Scholar] [CrossRef]
  31. Su, W.; Zhan, Q.; Pei, Y.; Liu, E.; Wu, S. Self-Adaptive Hydraulic Variable Valve Timing System for Diesel Engine and Control Method. U.S. Patent 9,163,531, 20 October 2015. [Google Scholar]
  32. GB 19147-2016; National Technical Committee on Petroleum Products and Lubricants of Standardization Administration of China. Automobile Diesel Fuels. Standards Press of China: Beijing, China, 2016.
  33. Su, W.; Lin, T.; Pei, Y. A Compound Technology for HCCI Combustion in a DI Diesel Engine Based on the Multi-Pulse Injection and the BUMP Combustion Chamber; SAE Technical Paper 2003-01-0741; SAE International: Troy, MI, USA, 2003. [Google Scholar] [CrossRef]
  34. UNECE. Uniform Provisions Concerning the Measures to Be Taken against the Emission of Gaseous and Particulate Pollutants from Compression Ignition Engines and Positive Ignition Engines for Use in Vehicles; Regulation No. 49. Revision 6; United Nations Economic Commission for Europe: Geneva, Switzerland, 2013. [Google Scholar]
  35. Kemp, A.W. Industrial Mechanics, 1st ed.; American Technical Publishers: Orland Park, IL, USA, 1998; p. 154. [Google Scholar]
  36. Heywood, J.B. “MEAN EFFECTIVE PRESSURE.” Chap. 2.7 in Internal Combustion Engine Fundamentals, 2nd ed.; McGraw-Hill Education: New York, NY, USA, 2018. [Google Scholar]
  37. Yu, X.; Wu, B.; Su, W. Experimental study on the approach for improved brake thermal efficiency on a two-stage turbocharged heavy-duty diesel engine. Fuel 2021, 305, 121523. [Google Scholar] [CrossRef]
  38. AVL List GmbH. AVL Micro Soot Sensor Avl Exhaust Conditioning Unit Operating Manual; Rev. 13; AVL List GmbH: Graz, Austria, 2013; pp. 130–132. [Google Scholar]
  39. Kautz, C.H.; Heron, P.R.L.; Loverude, M.E.; McDermott, L.C. Student understanding of the ideal gas law, Part I: A macroscopic perspective. Am. J. Phys. 2005, 73, 1055–1063. [Google Scholar] [CrossRef]
  40. Zhang, C.; Pan, J.; Tong, J.; Li, J. Effects of Intake Temperature and Excessive Air Coefficient on Combustion Characteristics and Emissions of HCCI Combustion. Procedia Environ. Sci. 2011, 11, 1119–1127. [Google Scholar] [CrossRef] [Green Version]
  41. Feneley, A.J.; Pesiridis, A.; Andwari, A.M. Variable Geometry Turbocharger Technologies for Exhaust Energy Recovery and Boosting—A Review. Renew. Sustain. Energy Rev. 2017, 71, 959–975. [Google Scholar] [CrossRef]
  42. Rakopoulos, C.D.; Giakoumis, E.G. Thermodynamic Aspects of Transient Operation. In Diesel Engine Transient Operation: Principles of Operation and Simulation Analysis; Springer: London, UK, 2009; pp. 23–74. [Google Scholar] [CrossRef]
  43. Wu, Y.; Wang, P.; Farhan, S.M.; Yi, J.; Lei, L. Effect of post-injection on combustion and exhaust emissions in DI diesel engine. Fuel 2019, 258, 116131. [Google Scholar] [CrossRef]
  44. Wang, Z.; Shen, L.; Lei, J.; Yao, G.; Wang, G. Impact characteristics of post injection on exhaust temperature and hydrocarbon emissions of a diesel engine. Energy Rep. 2022, 8, 4332–4343. [Google Scholar] [CrossRef]
  45. Mohan, B.; Yang, W.; Chou, S.K. Fuel injection strategies for performance improvement and emissions reduction in compression ignition engines—A review. Renew. Sustain. Energy Rev. 2013, 28, 664–676. [Google Scholar] [CrossRef]
  46. Feng, S.; Hong, W.; Yao, Y.; You, T. Research of Post Injection Strategy of an EGR Diesel Engine to Improve Combustion and Particulate Emissions Performance: Application on the Transient Operation. Symmetry 2020, 12, 2002. [Google Scholar] [CrossRef]
  47. Poorghasemi, K.; Saray, R.K.; Ansari, E.; Irdmousa, B.K.; Shahbakhti, M.; Naber, J.D. Effect of diesel injection strategies on natural gas/diesel RCCI combustion characteristics in a light duty diesel engine. Appl. Energy 2017, 199, 430–446. [Google Scholar] [CrossRef]
  48. Liu, W.; Song, C. Effect of post injection strategy on regulated exhaust emissions and particulate matter in a HSDI diesel engine. Fuel 2016, 185, 1–9. [Google Scholar] [CrossRef]
  49. O’Connor, J.; Musculus, M. Post Injections for Soot Reduction in Diesel Engines: A Review of Current Understanding. SAE Int. J. Eng. 2013, 6, 400–421. [Google Scholar] [CrossRef] [Green Version]
  50. Wu, B.; Ma, Y.; Yu, X.; Gu, W.; Li, Y.; Su, W. Effects of exhaust gas recycle loop layout and retarded intake valve closing on variations in combustion in a heavy-duty diesel engine. Int. J. Engine Res. 2015, 16, 340–355. [Google Scholar] [CrossRef]
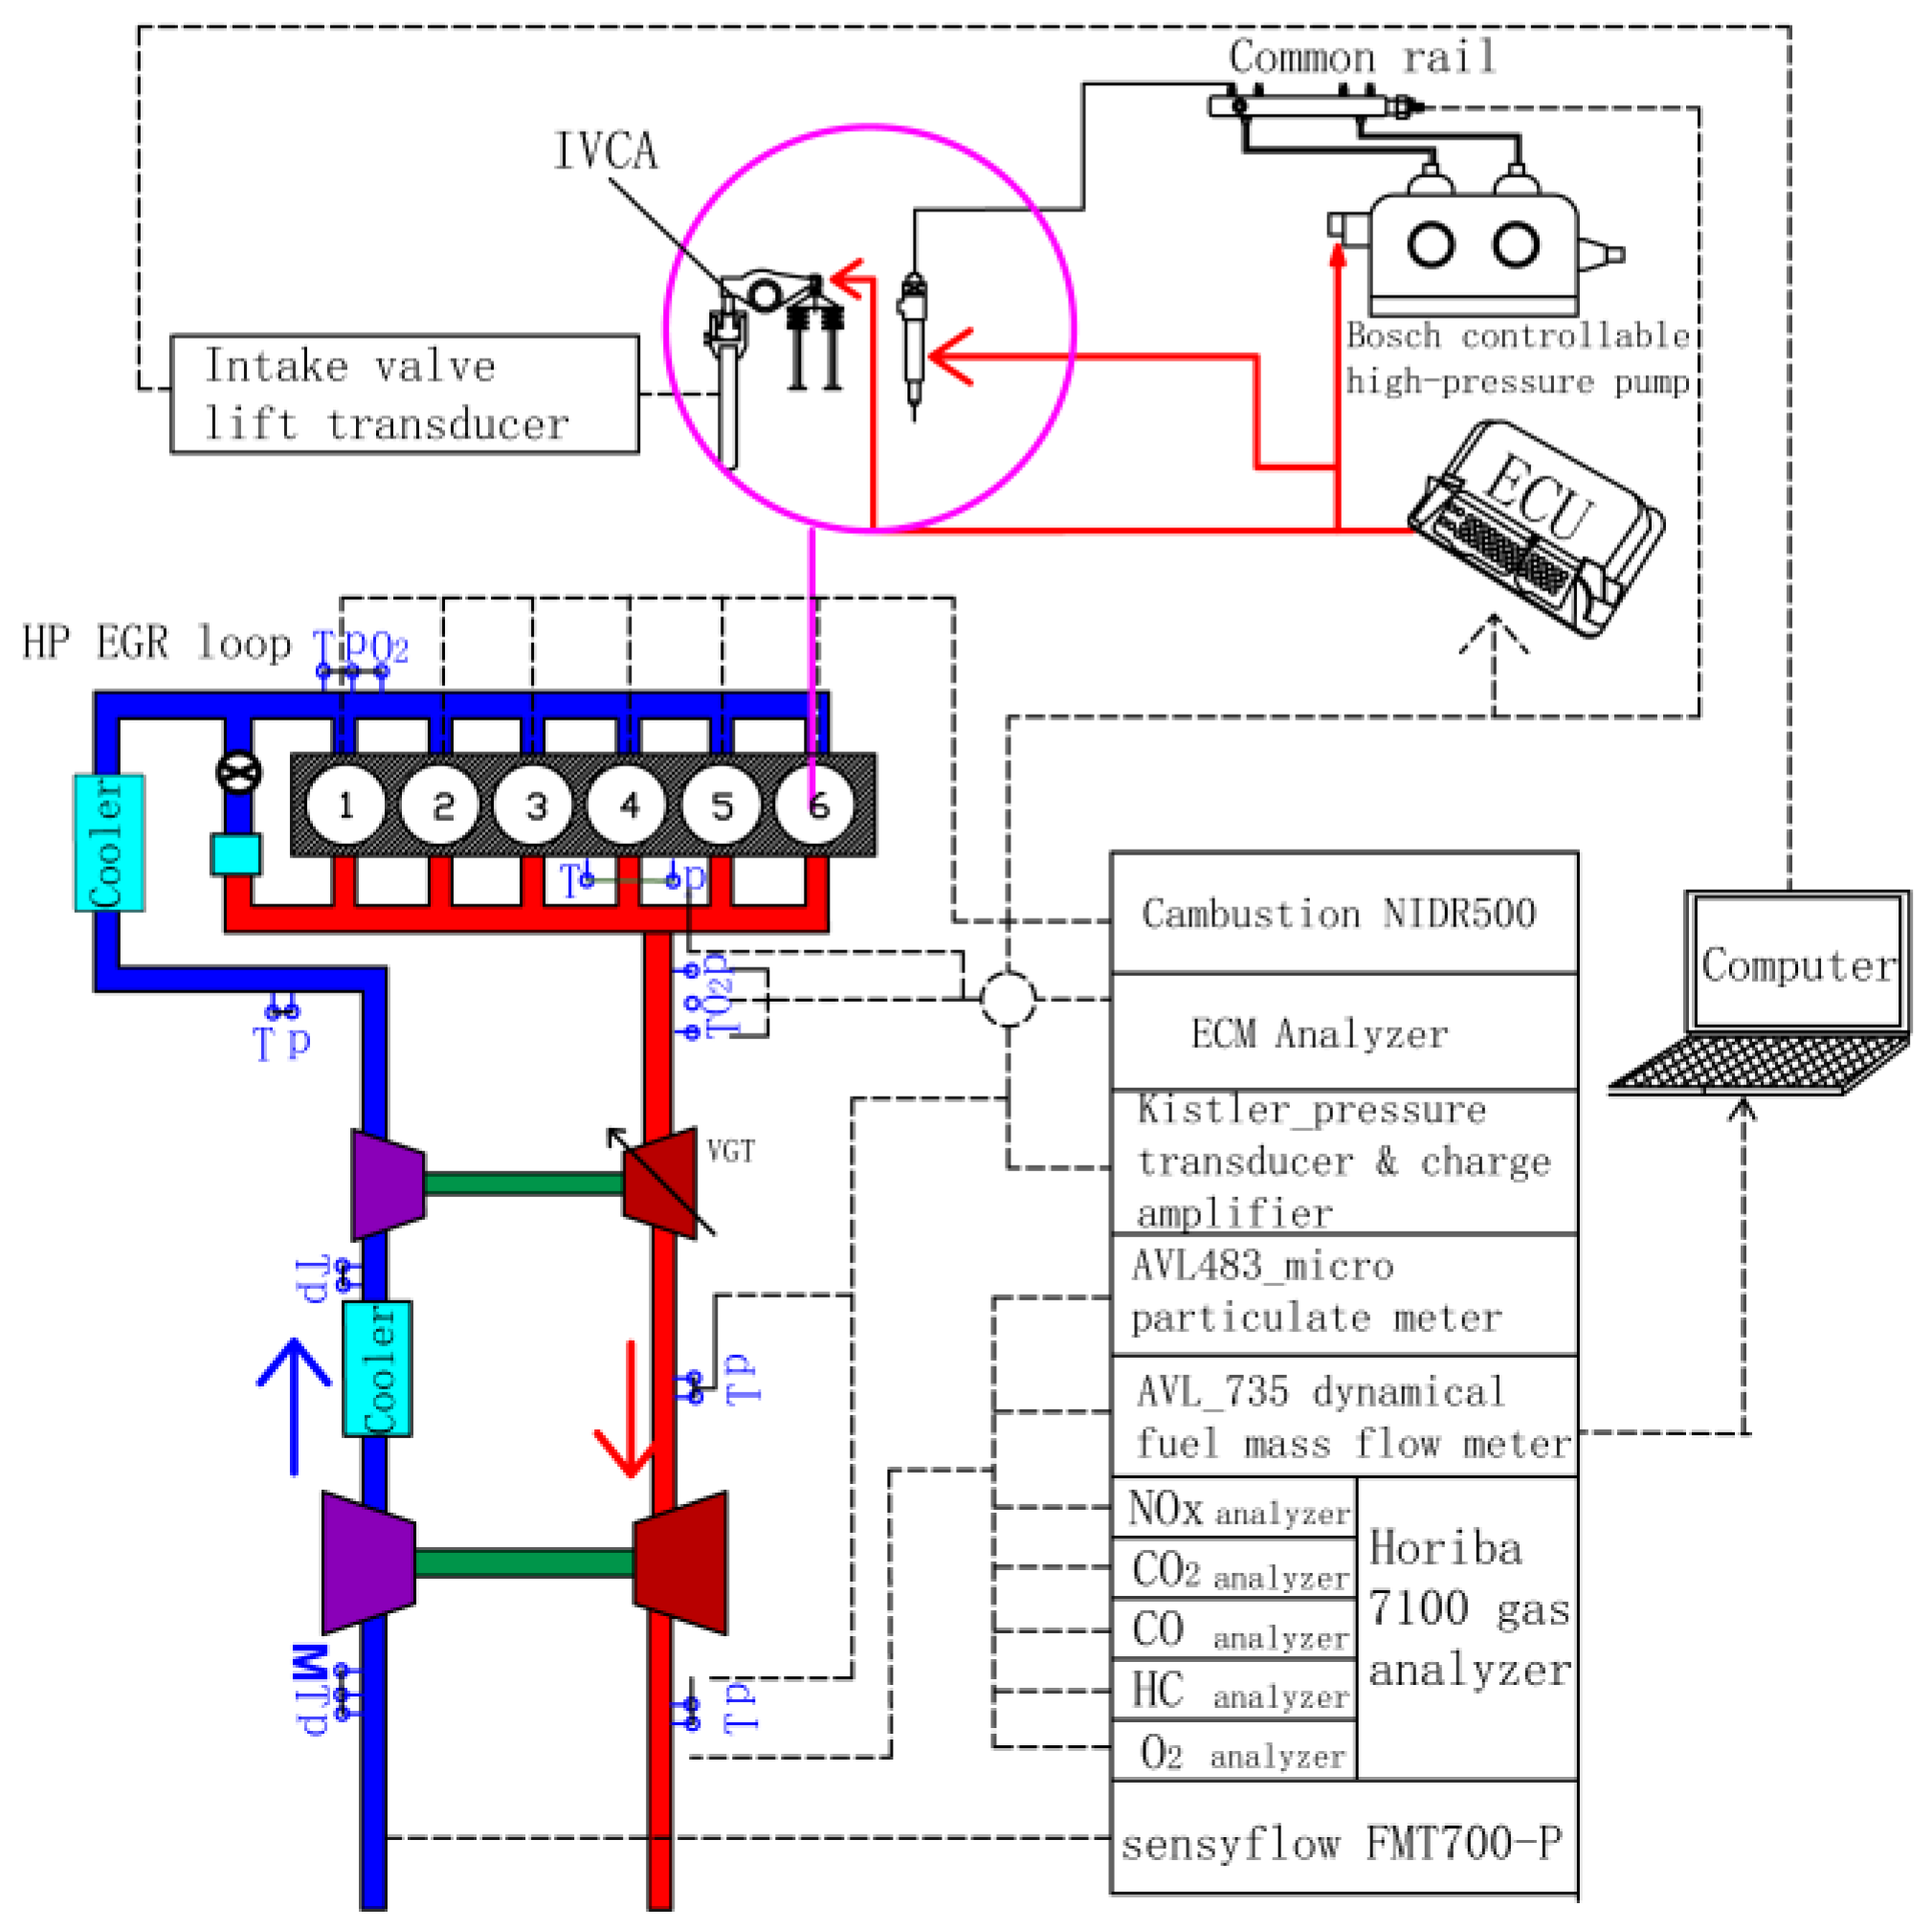
Figure 1. Schematic of the test engine and experimental setup. IVCA: intake valve closing actuation; HP: high-pressure; EGR: exhaust gas recirculation; VGT: variable geometry turbocharger.
Sustainability 15 12403 g001
Figure 2. Layout of EGR mixing circuit: (a) short mixing circuit; (b) long mixing circuit. HP: high-pressure; EGR: exhaust gas recirculation.
Sustainability 15 12403 g002
Figure 3. The fuel quantity and VGT opening degree control curve. VGT: variable geometry turbocharger.
Sustainability 15 12403 g003
Figure 4. Main injection timing changing curve. CA: crank angle; ATDC: after top dead center.
Sustainability 15 12403 g004
Figure 5. Variations in EGR rate under a steady-state operation: (a) short mixing circuit; (b) long mixing circuit. EGR: exhaust gas recirculation.
Sustainability 15 12403 g005
Figure 6. EGR rate in each cylinder during a load-change transient process: (a) cylinder 1; (b) cylinder 3; (c) cylinder 6. EGR: exhaust gas recirculation; LMC: long mixing circuit; SMC: short mixing circuit.
Sustainability 15 12403 g006
Figure 7. Effects of mixing circuit on Φ O in cylinder 1 and 3.
Sustainability 15 12403 g007
Figure 8. Effects of mixing circuit on soot and NOx.
Sustainability 15 12403 g008
Figure 9. EGR rate in each cylinder during a load-change transient process: (a) cylinder 1; (b) cylinder 3. EGR: exhaust gas recirculation; LMC: long mixing circuit; SMC: short mixing circuit.
Sustainability 15 12403 g009
Figure 10. Effects of mixing circuit on Φ O in cylinder 1 and 3.
Sustainability 15 12403 g010
Figure 11. Effects of mixing circuit on soot and NOx.
Sustainability 15 12403 g011
Figure 12. EGR rate in each cylinder during a load-change transient process: (a) cylinder 1; (b) cylinder 3. EGR: exhaust gas recirculation; LMC: long mixing circuit; SMC: short mixing circuit.
Sustainability 15 12403 g012
Figure 13. Effects of mixing circuit on soot and NOx.
Sustainability 15 12403 g013
Figure 14. Effects of mixing circuit on Φ O in cylinder 1 and 3.
Sustainability 15 12403 g014
Figure 15. Distribution of emissions in transient process.
Sustainability 15 12403 g015
Figure 16. Effect of injection mode on Φ O and mean temperature in cylinder. CA: crank angle; ATDC: after top dead center; CA: crank angle; ATDC: after top dead center.
Sustainability 15 12403 g016
Figure 17. Effect of injection mode on soot and NOx.
Sustainability 15 12403 g017
Figure 18. Effect of injection mode on IMEP. IMEP: indicated mean effective pressure; ISFC: indicated specific fuel consumption.
Sustainability 15 12403 g018
Figure 19. Effect of main injection timing on Φ O and mean temperature. CA: crank angle; ATDC: after top dead center.
Sustainability 15 12403 g019
Figure 20. Effect of main injection timing on IMEP. IMEP: indicated mean effective pressure; ISFC: indicated specific fuel consumption.
Sustainability 15 12403 g020
Figure 21. Effect of main injection timing on CA50. CA50: crank angle at 50% accumulated heat release; CA: crank angle; ATDC: after top dead center.
Sustainability 15 12403 g021
Figure 22. Effect of main injection timing on NOx and soot emissions.
Sustainability 15 12403 g022
Figure 23. Effect of post-injection timing on Φ O and mean temperature. CA: crank angle; ATDC: after top dead center.
Sustainability 15 12403 g023
Figure 24. Effect of post-injection timing on IMEP. IMEP: indicated mean effective pressure; ISFC: indicated specific fuel consumption.
Sustainability 15 12403 g024
Figure 25. Effect of post-injection timing on NOx and soot emissions.
Sustainability 15 12403 g025
Figure 26. Effect of post-injection ratio on Φ O and mean temperature. CA: crank angle; ATDC: after top dead center.
Sustainability 15 12403 g026
Figure 27. Effect of post-injection ratio change on IMEP. IMEP: indicated mean effective pressure; ISFC: indicated specific fuel consumption.
Sustainability 15 12403 g027
Figure 28. Effect of post-injection ratio change on NOx and soot.
Sustainability 15 12403 g028
Table 1. Engine Specifications.
ItemDefinition
FuelGB 19147-2016 diesel [32]
Bore × stroke126 mm × 155 mm
Swirl ratio1.2
Compression ratio17:1
Combustion chamber“BUMP” [33]
Injection systemCommon rail
Injection pressure180 MPa
Number of injector nozzle holes8 holes
Injector nozzle hole diameter0.217 mm
Injector spray angle (included)143°
Original valve train
(4 valve)
IVO: 340° ATDC
IVC: 146° BTDC
EVO: 131° ATDC
EVC: 339° BTDC
IVO: intake valve opening; EVO: exhaust valve opening; IVC: intake valve closing; EVC: exhaust valve closing; ATDC: after top dead center; BTDC: before top dead center.
Table 2. Equipment of the transient measurement.
EquipmentTypeRangeAccuracy
Air flow meterABB FMT700-P0–5000 kg/h<±0.8% of measured value
Fuel mass flow meterAVL733s + AVL753c0–150 kg/h<±0.12% of measured value
In-cylinder pressure sensorKistler 6125C0–300 Bar≤±0.4% FSO
Intake pressure sensorKistler 4007B0–10 Bar≤±0.2% FSO
Exhaust pressure sensorKistler 4049A0–10 Bar≤±0.3% FSO
Exhaust gas analyzerHoriba MEXA-7100DEG0–5000 ppm (NOx)1 ppm
EGR analyzerCambustion NIDR5000–20% (CO2)0.1%
Soot measurementAVL4830–1000 mg/m30.1 mg/m3
FSO: full-scale output.
Table 3. Experimental operating condition parameters.
CASEEGR LayoutEGR Valve Opening Timing (S)Injection Timing (°CA ATDC)Post-Injection Ratio (%)
1SMC0.11~−2
2LMC0.11~−2
3SMC0.51~−2
4LMC0.51~−2
5SMC0.91~−2
6LMC0.91~−2
7LMC0.5(1, 6)~(−2, 6)16
8LMC0.5(1, 6)~(−1, 6)16
9LMC0.5(1, 6)~(−3, 6)16
10LMC0.5(1, 3)~(−2, 3)16
11LMC0.5(1, 9)~(−2, 9)16
12LMC0.5(1, 6)~(−2, 6)12
13LMC0.5(1, 6)~(−2, 6)8
EGR: exhaust gas recirculation; CA: crank angle; ATDC: after top dead center; SMC: short mixing circuit; LMC: long mixing circuit.
Disclaimer/Publisher’s Note: The statements, opinions and data contained in all publications are solely those of the individual author(s) and contributor(s) and not of MDPI and/or the editor(s). MDPI and/or the editor(s) disclaim responsibility for any injury to people or property resulting from any ideas, methods, instructions or products referred to in the content.