Article

The Study on Solving Large Pore Heat Transfer Simulation in Malan Loess Based on Volume Averaging Method Combined with CT Scan Images

1
School of Water and Environment, Chang’an University, Xi’an 710054, China
2
Key Laboratory of Subsurface Hydrology and Ecological Effect in Arid Region of Ministry of Education, Chang’an University, Xi’an 710054, China
*
Author to whom correspondence should be addressed.
Sustainability 2023, 15(16), 12389; https://doi.org/10.3390/su151612389
Submission received: 21 July 2023 / Revised: 9 August 2023 / Accepted: 13 August 2023 / Published: 15 August 2023
(This article belongs to the Special Issue Geological Environment Monitoring and Early Warning Systems)

Abstract

:
Malan loess is a wind-formed sediment in arid and semi-arid regions and is an important constituent of the Earth’s critical zone. Therefore, the study of the relationship between microstructure and heat transfer in Malan loess is of great significance for the in-depth understanding of the heat transfer mechanism and the accurate prediction of the heat transfer properties of intact loess. In order to quantitatively characterize the heat transfer processes in the two-phase medium of solid particles and gas pores in the intact loess, this study used modern computed tomography to CT scan the Malan loess in Huan County, Gansu Province, the western part of the Loess Plateau, China and used the specific yield of the intact Malan loess as the parameter basis for extracting the threshold segmentation of the large pores in the scanned images for the three-dimensional reconstruction of the connected large pores. An experimental space for heat conduction of intact Malan loess was constructed, and the surface temperature of Malan loess was measured on the surface of the space with a thermal imager. The simulation of the heat conduction process was carried out using the solution program in AVIZO (2019) software using the volume averaging method combined with CT scanning to reconstruct the 3D pores. The experiments of heat conduction in the intact Malan loess showed that for a given external temperature pressure, the temperature decreases along the heat flow direction as a whole. The temperature of the pores in the normal plane along the heat flow direction is higher than the temperature of the solid skeleton. Abnormal temperature points were formed at the junction of the surface and internal pores of Maran loess, and the temperature of the jointed macropores was about 1 °C higher at the surface of the sample than that of the surrounding solid skeleton. Simulation of heat conduction in Malan loess showed that the heat transfer process in Malan loess was preferentially conducted along the large pores and then the heat was transferred to the surrounding Malan loess particle skeleton. The simulation results of heat conduction in Malan loess were in high agreement with the experimental results of heat conduction in Malan loess, which verifies the reliability of the calculated model.

1. Introduction

Malan loess is a typical porous medium. Malan loess is located in the upper layer of the loess plateau in the vertical space, which is a penetrating area [1,2]. The spatial extent of Malan loess starts from the surface and extends through the loess layer to the bottom of groundwater, a critical zone for the survival of terrestrial life on the Loess Plateau, which is essential for sustaining life on the Loess Plateau [3,4]. Malan loess is located in the boundary area of the Earth’s five major circles and is in a dynamic evolutionary process at all times. Water and gas flow in Malan loess, and all this is the result of the synergistic effect of biology, geology, and climate on Malan loess in the geological evolution process [5,6].
Malan loess is one of the most common materials in the Loess Plateau, the core part of the Earth’s critical zone, and one of the most heterogeneous and complex areas in the critical zone [7,8]. Due to its relatively recent deposition, Malan loess is subject to less pressure from the overlying strata and is less dense compared to the loess of other loess layers. During the process of deposition, it was subjected to the action of rainfall, temperature, and plant roots. Therefore, a variety of pore structures have been formed during the evolution of Malan loess. The process of heat transfer in loess affects the hydro-ecological process of the whole loess area. Malan loess is closer to the surface and is greatly affected by climate change, so the process of heat transfer in Malan loess becomes very complicated [9].
Nowadays, in most loess soil physics, the study of heat transfer in loess soil is treated as a homogeneous object, and the temperature of one point in the soil is measured as the temperature of the whole soil body [10,11,12,13]. However, in nature, Malan loess is non-homogeneous and anisotropic, so the heat transfer in Malan loess can be different. Most studies have focused on determining heat transfer processes in soils through soil moisture temperature sensors, a method that involves burying a probe into the measured soil during the process of determining soil heat transfer, which changes the natural deposition state of the soil and uses the measured value of one probe as the change in temperature of the entire soil around that probe [14,15,16,17]. However, the real heat transfer process in nature in Malan loess is along the pore channels of Malan loess and the connection of the particle skeleton. It is a dynamic process rather than a constant value throughout the heat transfer interface of Malan loess. The industrial-grade thermal imager monitors temperature changes across the face in real time and can detect temperatures at various points on a face. This non-contact temperature measurement does not change the original structural characteristics of the Malan loess [18,19].
Heat transfer in porous and particulate media is a widely studied topic mainly in the chemical engineering systems and materials [20]. In general, the effect of solid particles on the thermal conductivity of porous media is not dominant, especially for those non-metallic porous materials [12,21,22,23]. The thermal conductivity in Malan loess porous media is very complex and there are many factors affecting the thermal conductivity process of Malan loess, including the physical properties of the solid particle skeleton of Malan loess, the pore size shape and distribution inside Malan loess, the type of fluid, the component morphology, and properties, etc. Pressure and temperature also have an effect on the thermal conductivity process of Malan loess [10,11,12,24]. In the analysis of thermal conductivity processes in porous media, two methods are usually combined, the first simplifies the physical model and the second introduces the effective thermal conductivity [25,26,27,28].
The pore structure of Malan loess is a hot issue in the study of pore heat transfer in Malan loess. With the application of photoelectric microscopy, image processing, and X-ray diffraction, the morphological characteristics of pores as well as particle skeleton in Malan loess can be extracted [9]. With the development of X-ray computed tomography (CT), it has made new progress in the study of the three-dimensional structure of loess by virtue of nondestructive, quantitative, and repeatable observation [29,30,31,32,33]. The acquisition of three-dimensional fine view pore channels in loess is mainly conducted by industrial CT scanning and then by threshold division to extract the pore channels in loess, but CT scanning is a process by X-ray diffraction, which can only capture the morphology of pore and particle skeleton but cannot capture the process of heat transfer in loess.
The process of studying heat transfer in the porous media of Malan loess requires linking the macroscopic, fine, and microscopic aspects of the multiphase pore media of Malan loess [34,35,36]. Compared with the classical theoretical coupling method and mixture theory, the volume averaging method not only realizes the coupling of heat flow processes in multiphase porous media studied within a unified hydrodynamic framework but also allows the derivation of effective local volume averaging equations with pore-scale information. The volume averaging method simultaneously performs volume averaging of the microscopic equilibrium equation and the microscopic intrinsic structure equation to obtain the macroscopic equilibrium equation and the macroscopic intrinsic structure equation [37,38,39].
With the development of 3D visualization software, the extraction of pore and particle skeletons and their morphological parameters in porous media based on CT scans has become more convenient. Based on the solution of the closure problem, a simulation package for heat transport in porous media is developed using AVIZO software combined with CT scan images using the volume averaging method. Using this solution procedure, the images obtained from CT scans can be analyzed and heat transport simulations of porous media can be performed.
In this study, we used CT scanning technology to scan the intact Malan loess sample in Huan County, western part of the Loess Plateau, China, and constructed a heat transport space for the intact Malan loess sample, and simulated the heat transport of the intact Malan loess sample in a two-phase medium (solid and gas) in the vertical direction by controlling the temperature boundary at the bottom of the Malan loess sample and monitoring the temperature with a thermal imager at the top of the sample. The process of heat transport in the two-phase medium (solid and gas) was simulated in the vertical direction. The volume averaging method combined with the 3D pore space reconstructed by CT scan was used to simulate the heat transport process in the intact Malan loess sample. The study of heat transfer in the microstructure of intact Malan loess can be important in helping to understand the thermodynamic characteristics of soils as well as in modeling and predicting water movement, and soil temperature distribution.

2. Study Area and Dataset

2.1. Collection and Preparation of Malan Loess Samples

According to regional geological data, in Northwestern China, the loess area in the middle of the Loess Plateau, the thickness of Malan loess on West Mountain of Huanxian County, Qingyang City, Gansu Province, is between 0–25 m, and the deposition thickness of Lishi loess is between 5–80 m. In the loess layer, there is a red ancient soil layer interspersed, and below the loess layer is a sandy cobble and gravel layer with a thickness greater than 200 m. The whole area has a complete sequence of loess development. The sampling point was arranged on the West Hill of Huanxian County, with the sampling coordinates of 107.284294° E, 36.562462° N, and 1462 m above sea level, and the intact Malan loess was taken at 1.5 m from the top of the surface in the Malan loess deposition area on the top of the West Hill [40,41,42], as shown in Figure 1. A complete bulk sample of intact Malan loess was first taken to ensure that the original deposition direction was unchanged, and then the bulk sample was cut into a cylinder with a diameter of 10 cm and a height of 10 cm. The normal direction of the cylinder diameter was the same as the deposition direction. The samples were carefully packed with foam and brought to the laboratory, and then dried in an oven at 105 °C for 10 h. The weight of the samples was measured to be 956 g. The dry density of the samples was 1.219 g/cm3. The excess soil samples were cut out during the sample preparation and the basic physical properties of the loess samples were determined by a combined Malvern Mastersizer 2000 laser analyzer and a photoelectric type liquid limit plastic limit meter, the permeability coefficient of soil samples was measured with TST-55 variable head permeameter, and the results are shown in Table 1.

2.2. CT Scan

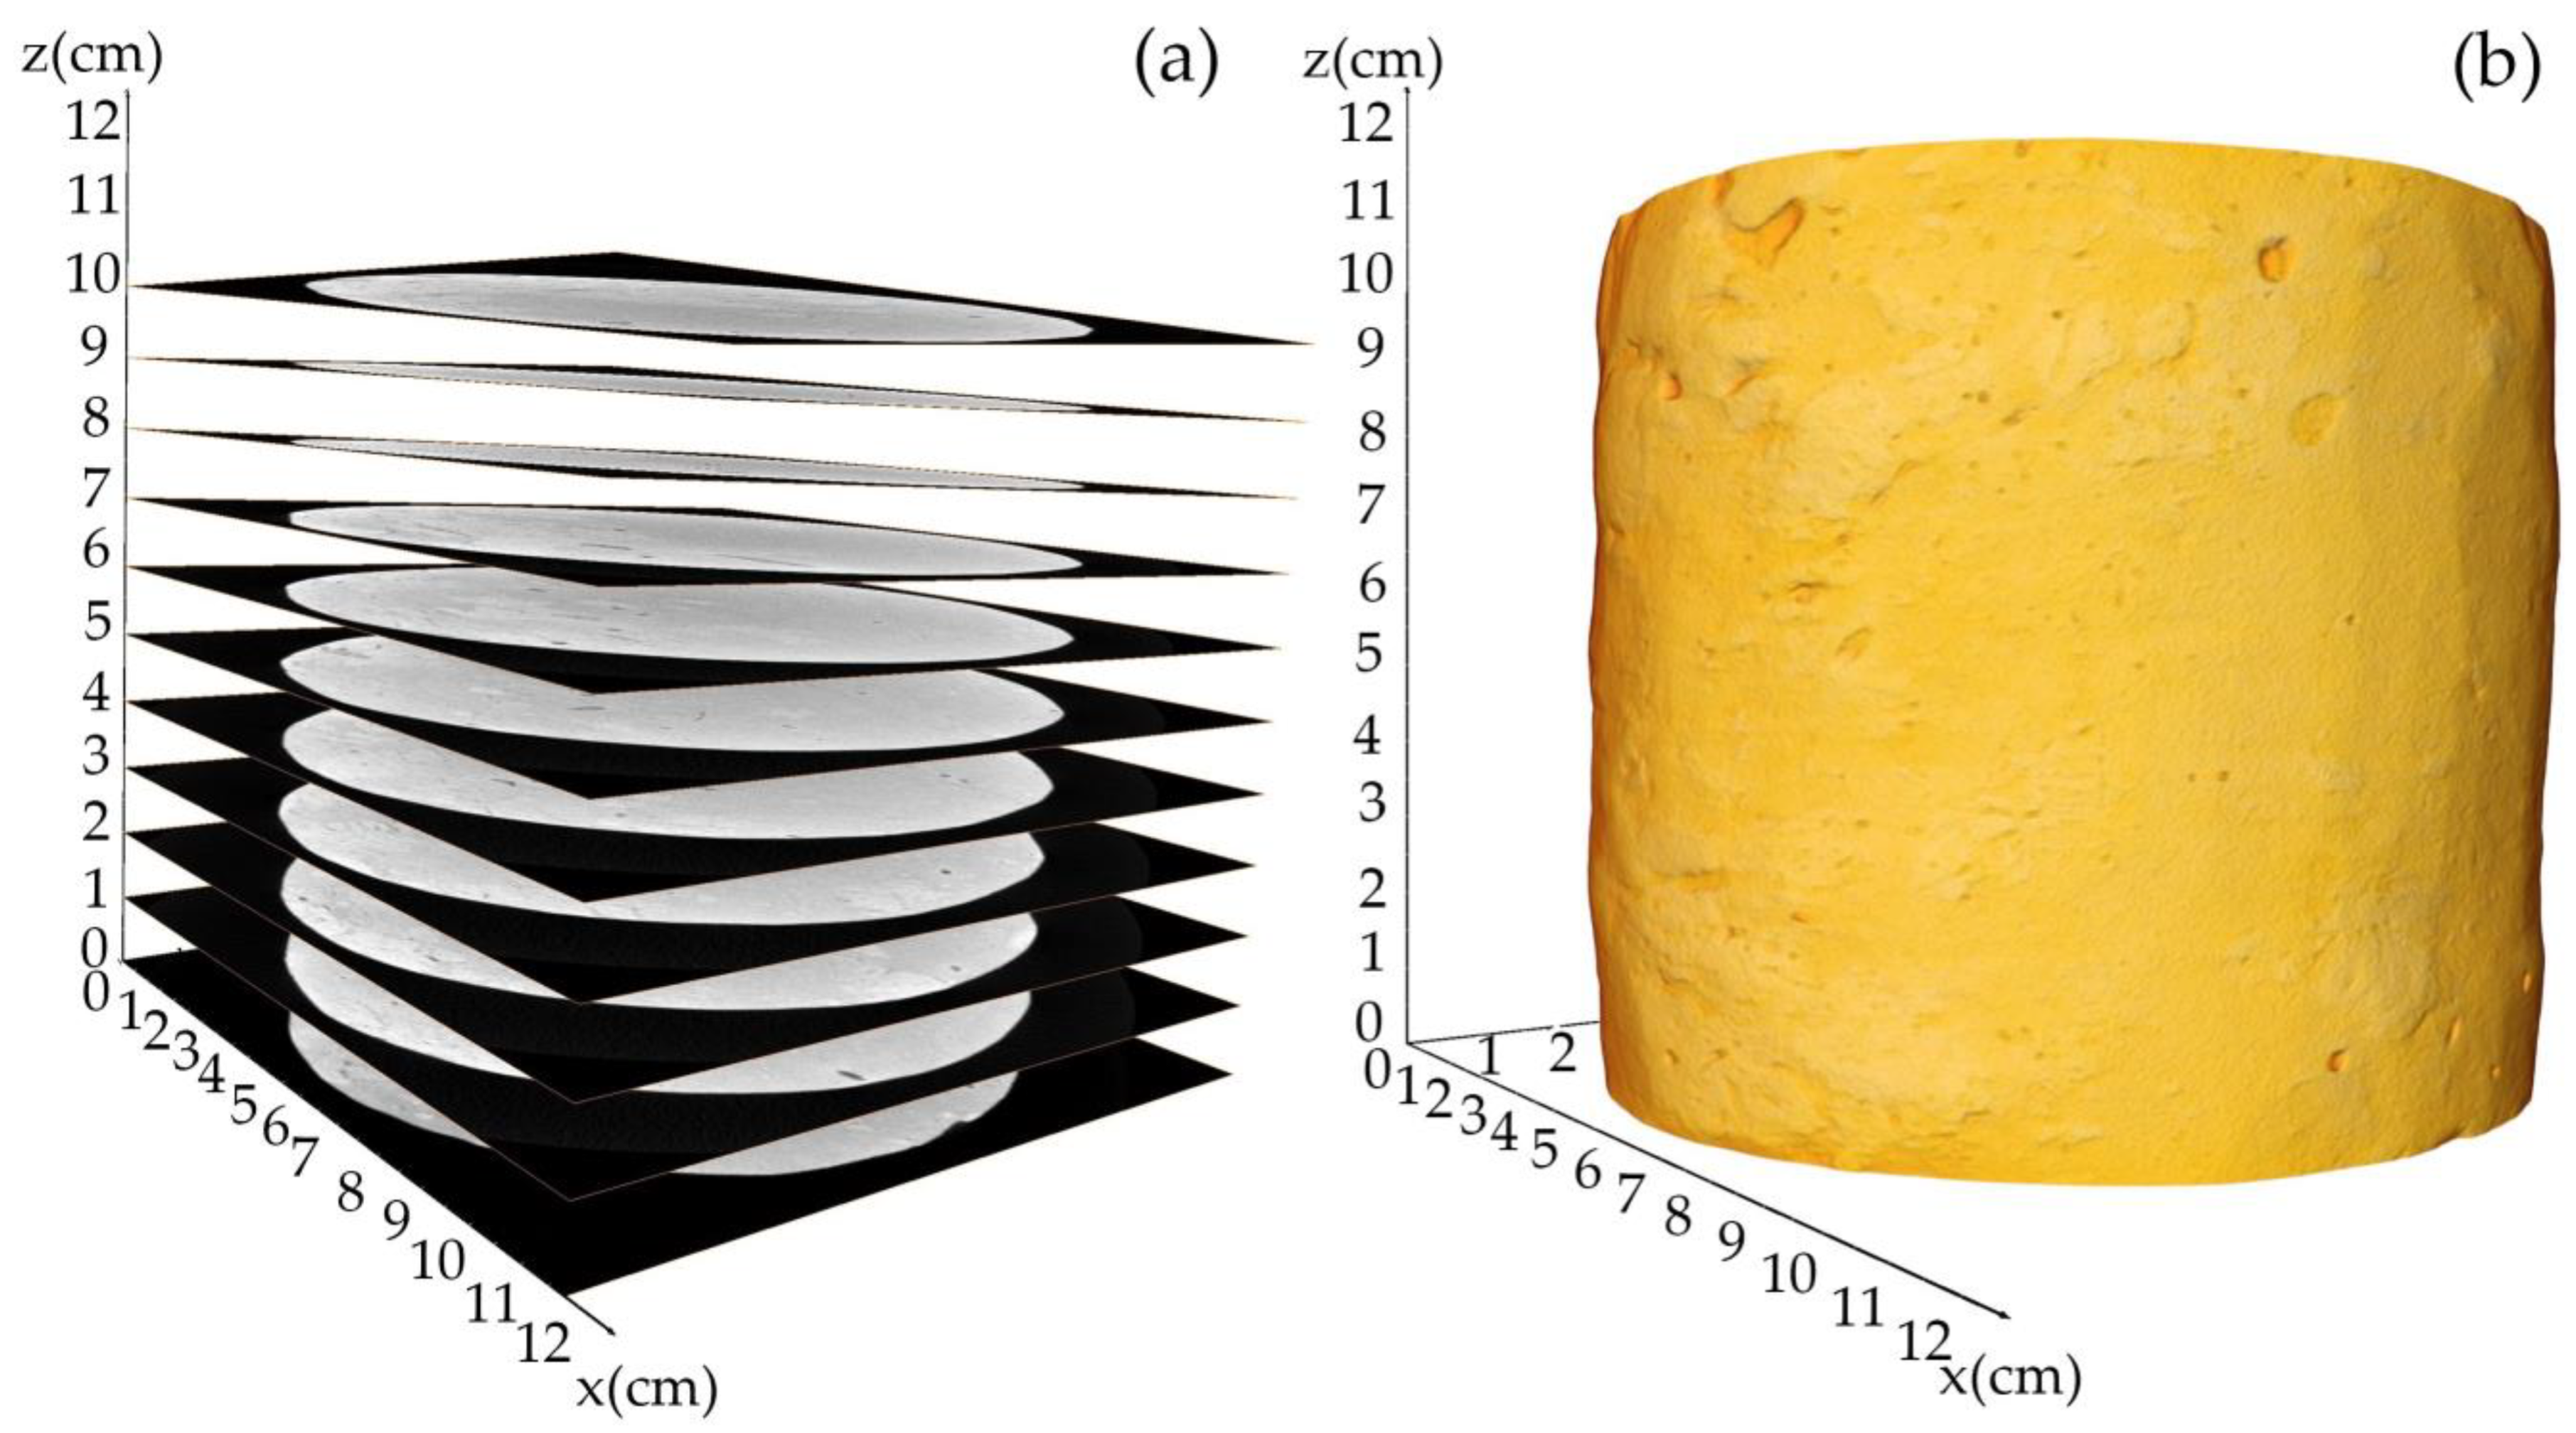
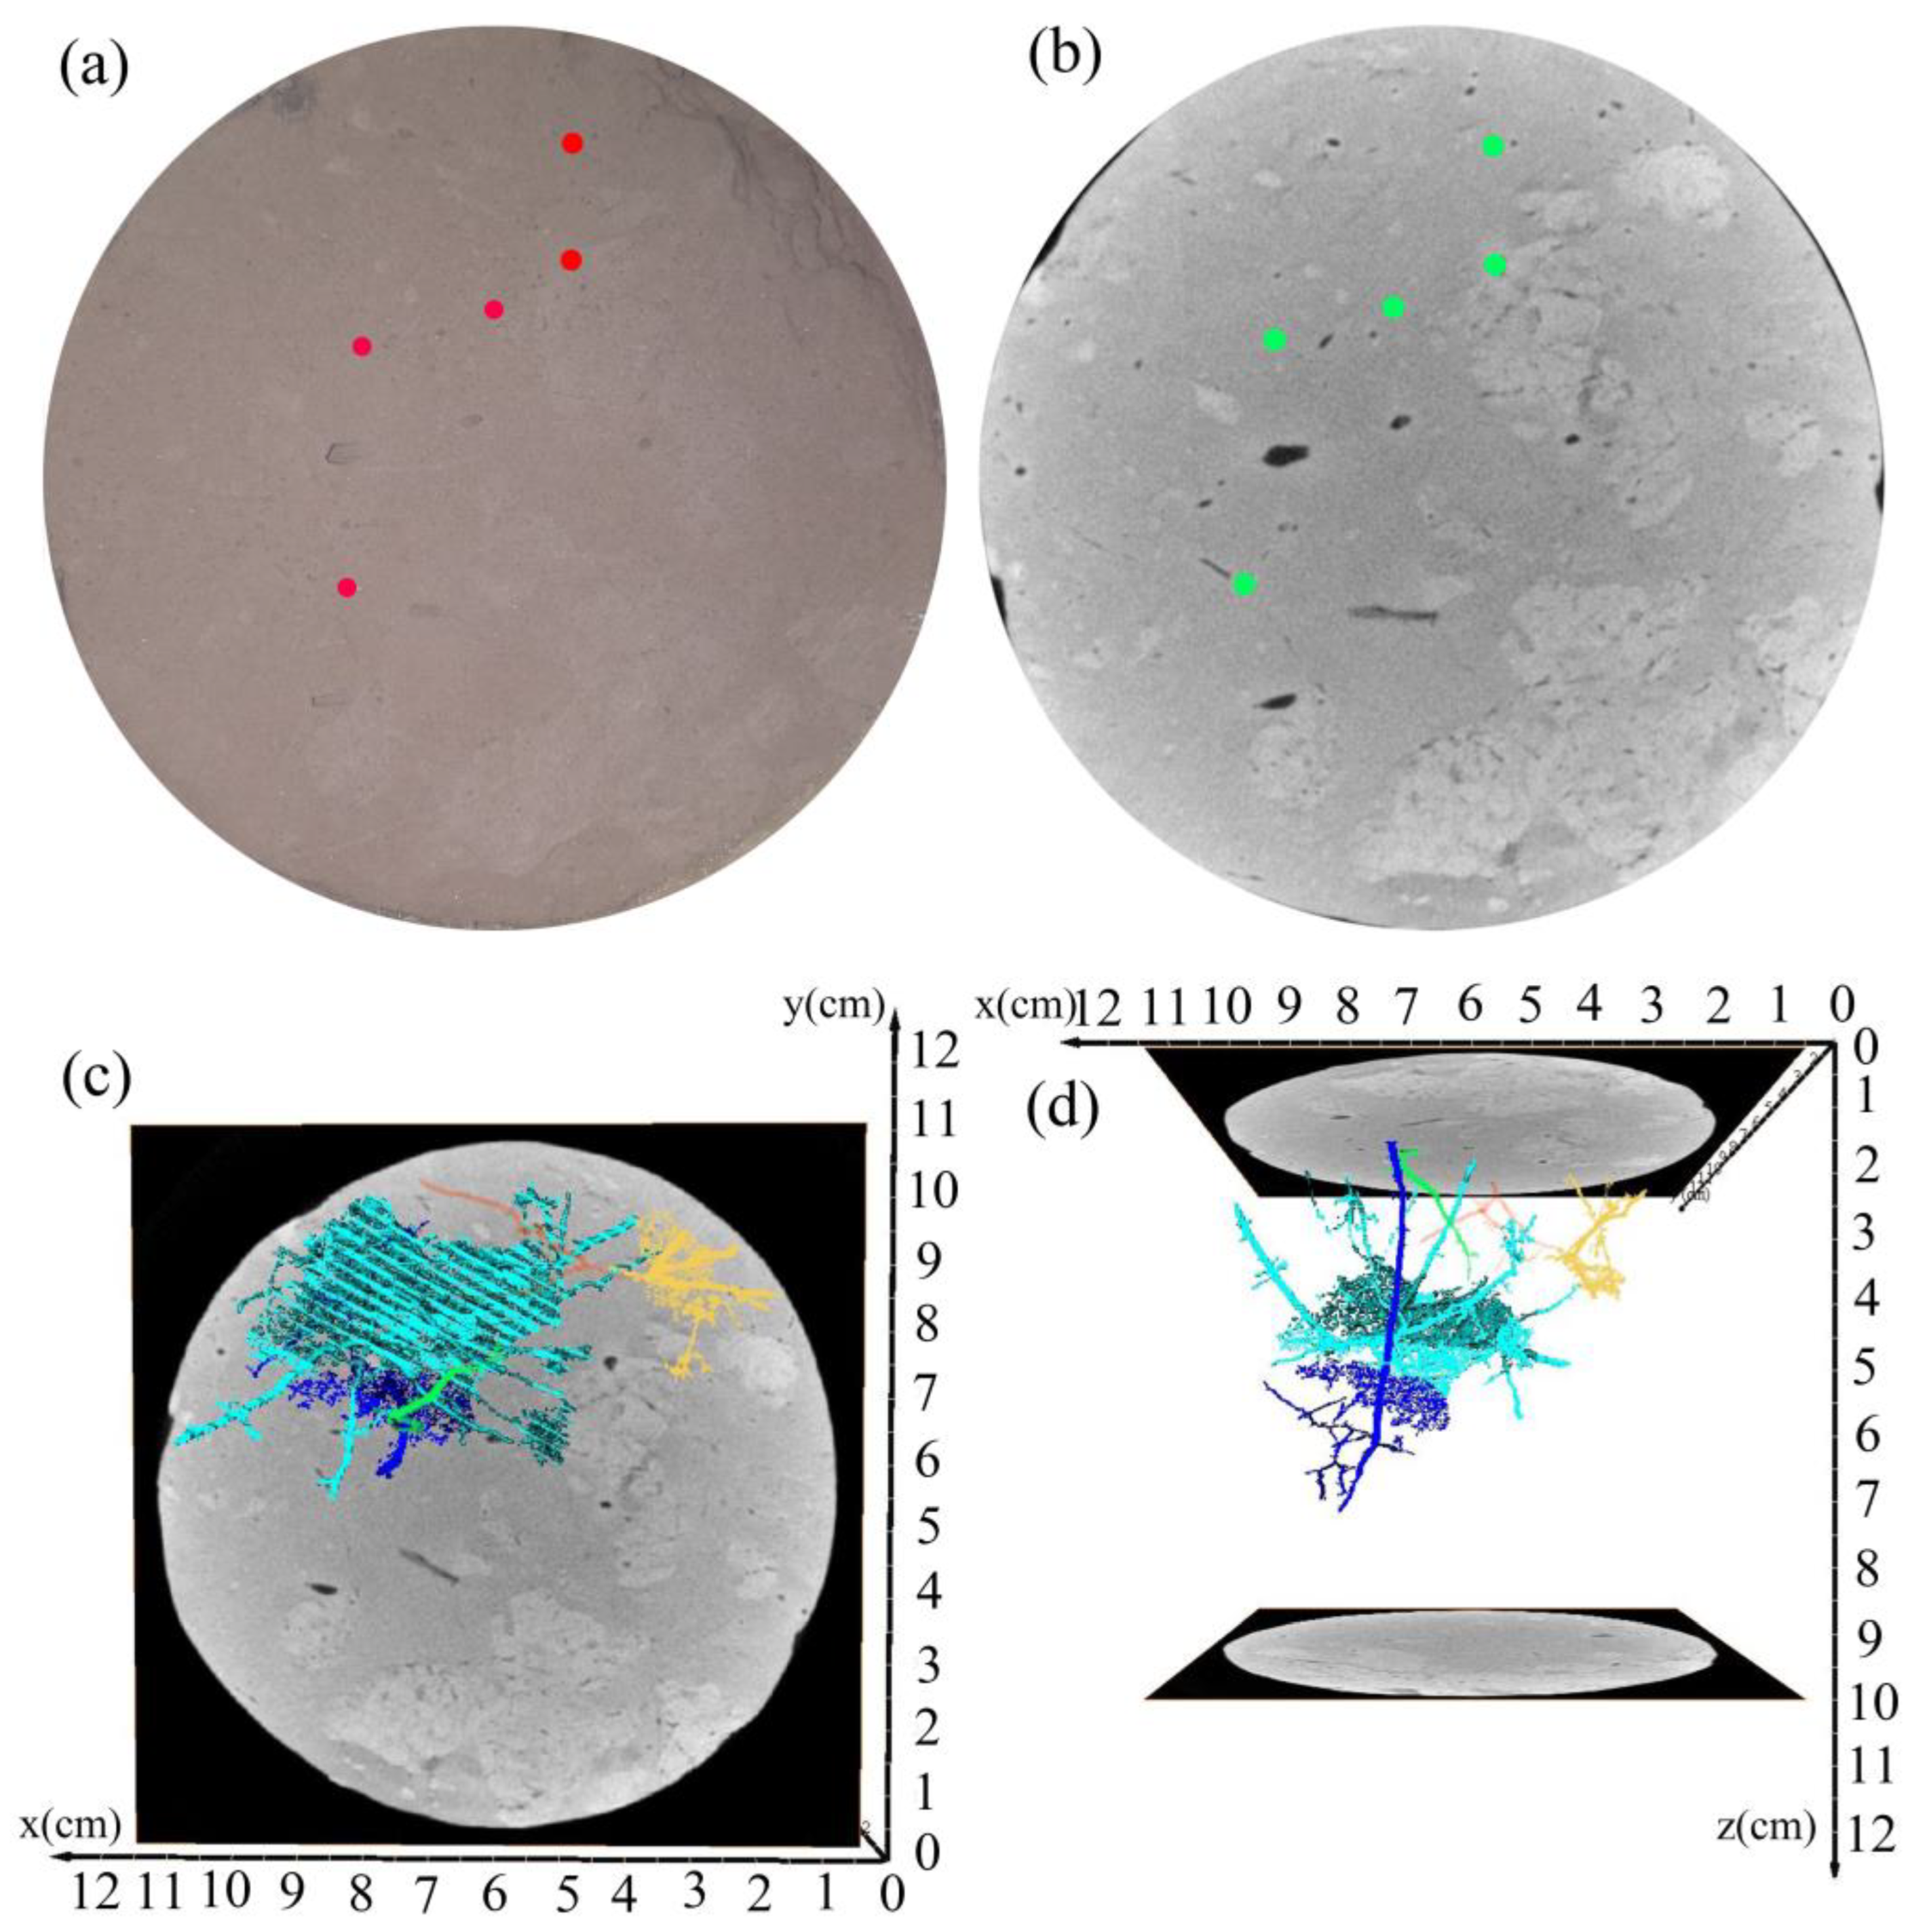
This CT scan experiment was conducted at the Highway Laboratory of Chang’an University, Xi’an, Shaanxi Province. CT scanning is a non-destructive testing technique that can be used to obtain the internal structure of a sample and has a wide range of applications in the study of porous media. In conducting CT scanning experiments on Malan loess, X-rays passing through the intact Malan loess sample were attenuated and the reflected signals were accepted by the ray detector and converted into electrical signals and then into a series of gray-scale image slices. In order to obtain the ideal CT scan slice, the final settings were 180 KV for the scan voltage, 0.35 mA for the current, 300 ms (integration time), 1.40 (magnification), Y.XRD1620 for the detector type, and 204.80 for the detector length. By setting this set of scanning parameters, finally, clear grayscale image slices of this scanned sample were obtained. There were 712 slices in the vertical direction with a resolution of 140.349 μm, a magnification of 1.41, and a pixel size of 1024 × 1024. The scanned image was imported into the software, and the image is first spatially calibrated according to the grayscale image obtained from the scan. The slice overlay image generated after calibration is shown in Figure 2a, and the original 3D model of the Malan loess sample is reconstructed as shown in Figure 2b.

3. Methods

3.1. Intact Loess Heat Conduction Experiment

The process of heat transfer in porous media is very complex, and in order to simplify the computational model, some boundary conditions must be set in conducting experiments on thermal conductivity of intact Malan loess samples. The present experiments on heat conduction of intact Malan loess are conducted physically with a homemade observation device for preferential channeling of heat in large pores of intact loess samples. By using the combination of temperature control knob, silica nanoaerogel mat, silica heating plate, and foam adhesive, a space for heat transfer action is provided for the intact loess so that the loess specimen can be heated uniformly at the bottom and the skeletal structure of the loess can be kept unchanged without loss of heat in the lateral direction. The heat enters from the bottom of the intact loess specimen and is conducted upward. The temperature of the silica gel heating plate can be controlled by the temperature control knob, and the heat conduction experiment with different input temperature changes can be completed. The infrared thermal imager on the surface of the intact loess specimen can monitor the heat distribution on the surface of the intact Malan loess sample and can continuously identify the preferred heat transfer channels of the large pores in the intact loess. The thermal imager can monitor the abnormal temperature points on the surface of the intact Malan loess sample.

3.1.1. Experimental Design and Experimental Setup

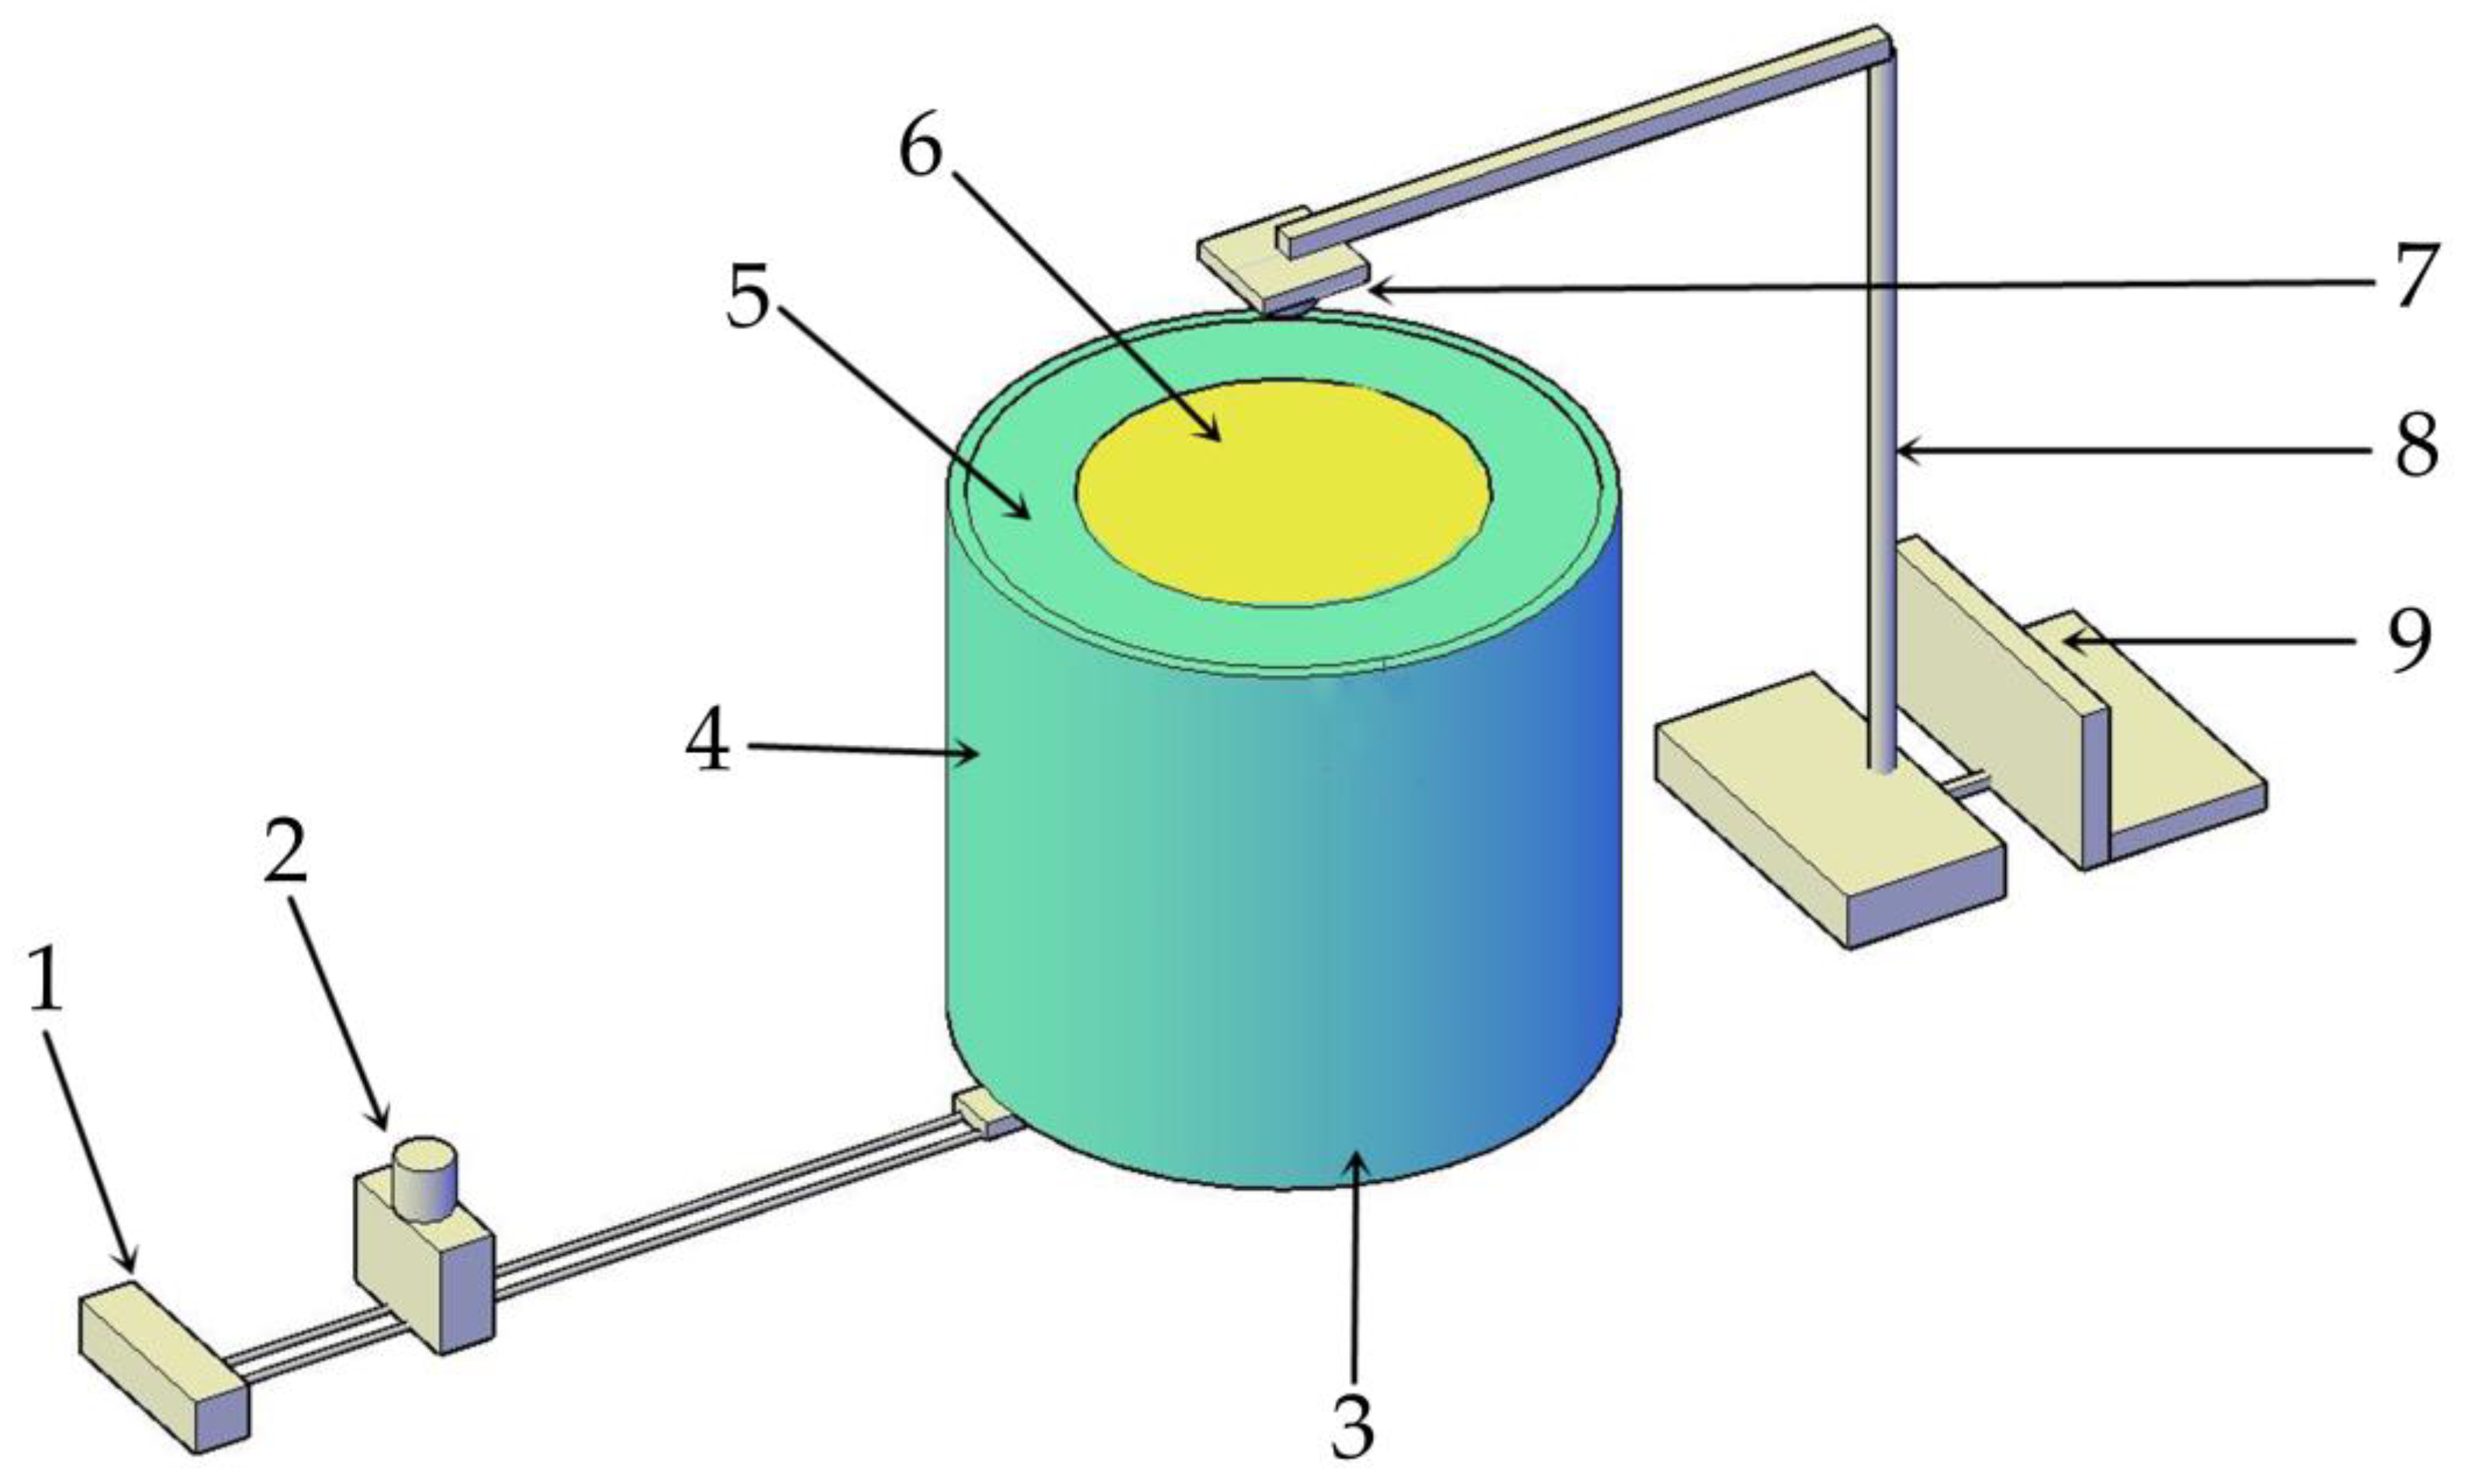
The present two-phase (air, particle skeleton) media thermal conductivity experimental setup for the intact Malan loess sample is shown in Figure 3. Among them, 1 is the power supply, 2 is the temperature control knob, 3 is the silica gel heating plate, 4 is the PVC fixing tube, 5 is the foam adhesive, 6 is the original cylindrical Malan loess, 7 is the infrared thermal imaging camera, 8 is the bracket, and 9 is the computer.
The power supply voltage was 220 V, where the adjustment range of the temperature control knob is from 30 °C to 150 °C, and the adjustment accuracy was ±2 °C. The silicone heating plate connected to the temperature control knob is a round plate with a diameter of 10 cm and a thickness of 0.8 cm. The temperature measurement device uses Hikvision H21PRO high-precision industrial pyrometer for thermal imaging temperature measurement. The resolution of the detector was 256 × 192, the temperature measurement range was −20 °C–350 °C, the temperature measurement accuracy is ±0.2 °C, the minimum temperature measurement distance is 15 cm, and 19,200 temperatures can be detected simultaneously.
In order to disregard the lateral heat loss of the Malan loess sample during heat transfer, a lateral insulation device was required on the side of the Malan loess, as shown in Figure 3 (4, 5, and 6). A PVC pipe with an inner diameter of 16 cm and a wall thickness of 3 mm was used for the outer support wall of the insulation device, which could serve as a lateral support. Since the surface of the Malan loess sample is relatively rough, it is difficult for the general solid insulation material to achieve absolute insulation of the sidewall. This time, we used polyurethane foam, which can grow automatically and has excellent high-temperature resistance, and the temperature can reach 100 °C to 150 °C, which is less than the temperature designed for this experiment. The foam glue has high foaming times, good stability, small foam pore size, uniform and fine, which can effectively fill the pores between the fixed sidewall and the Malan loess sample. The specific operation steps were as follows: In the first step, a layer of 1 mm latex was applied to the side surface of the dry intact Malan loess sample after the CT scan experiment, and the sample was left to rest for 24 h until the glue completely adhered to the surface of the Malan loess. This is used to seal the pores on the side surface of the Malan loess and also to prevent the infiltration of the foam glue into the Malan loess sample. In the second step, put the original cylindrical Malan loess sample into the middle of the PVC support wall, and protect the upper top surface of the Malan loess sample with a 10 cm diameter piece of oil-based paper. Pour the mixed Styrofoam evenly along the glass rod into the space between the sample and the PVC support wall. Then the Styrofoam started to grow upwards along the gap and eventually stopped growing and curing. In the third step, wait until the foam adhesive was completely solidified, remove the oil-based protective paper on the top surface of the cylindrical sample, and then glue the silica gel heating plate on the bottom surface of the cylindrical Malan loess sample, and wrap the outer layer with silica nanoaerogel felt. The silica nanoaerogel felt has good heat insulation and thermal insulation effect, which can effectively isolate heat loss.

3.1.2. Thermal Imaging Experiments

The infrared thermal imager was installed directly above the sample, the temperature measurement distance was adjusted to 15 cm, and the material emissivity was adjusted to 0.92. The material emissivity was regulated according to the soil emissivity. Connect all the test devices as shown in Figure 3, then turn on the power, adjust the temperature control knob to 100 °C, check the temperature change at the connection to see if there is heat loss, check the thermal insulation effect of the device, and rest the sample for 12 h. Continue to adjust the temperature control knob to 80 °C, adjust the emissivity to 0.92 on the infrared thermal imager, and adjust the temperature measurement distance. Next, imaging is performed every minute. In order to capture the process of the occurrence of different temperature points, the imaging frequency was encrypted when the occurrence of different temperature points was detected for the first time.

3.1.3. Thermal Imaging Validation Experiments

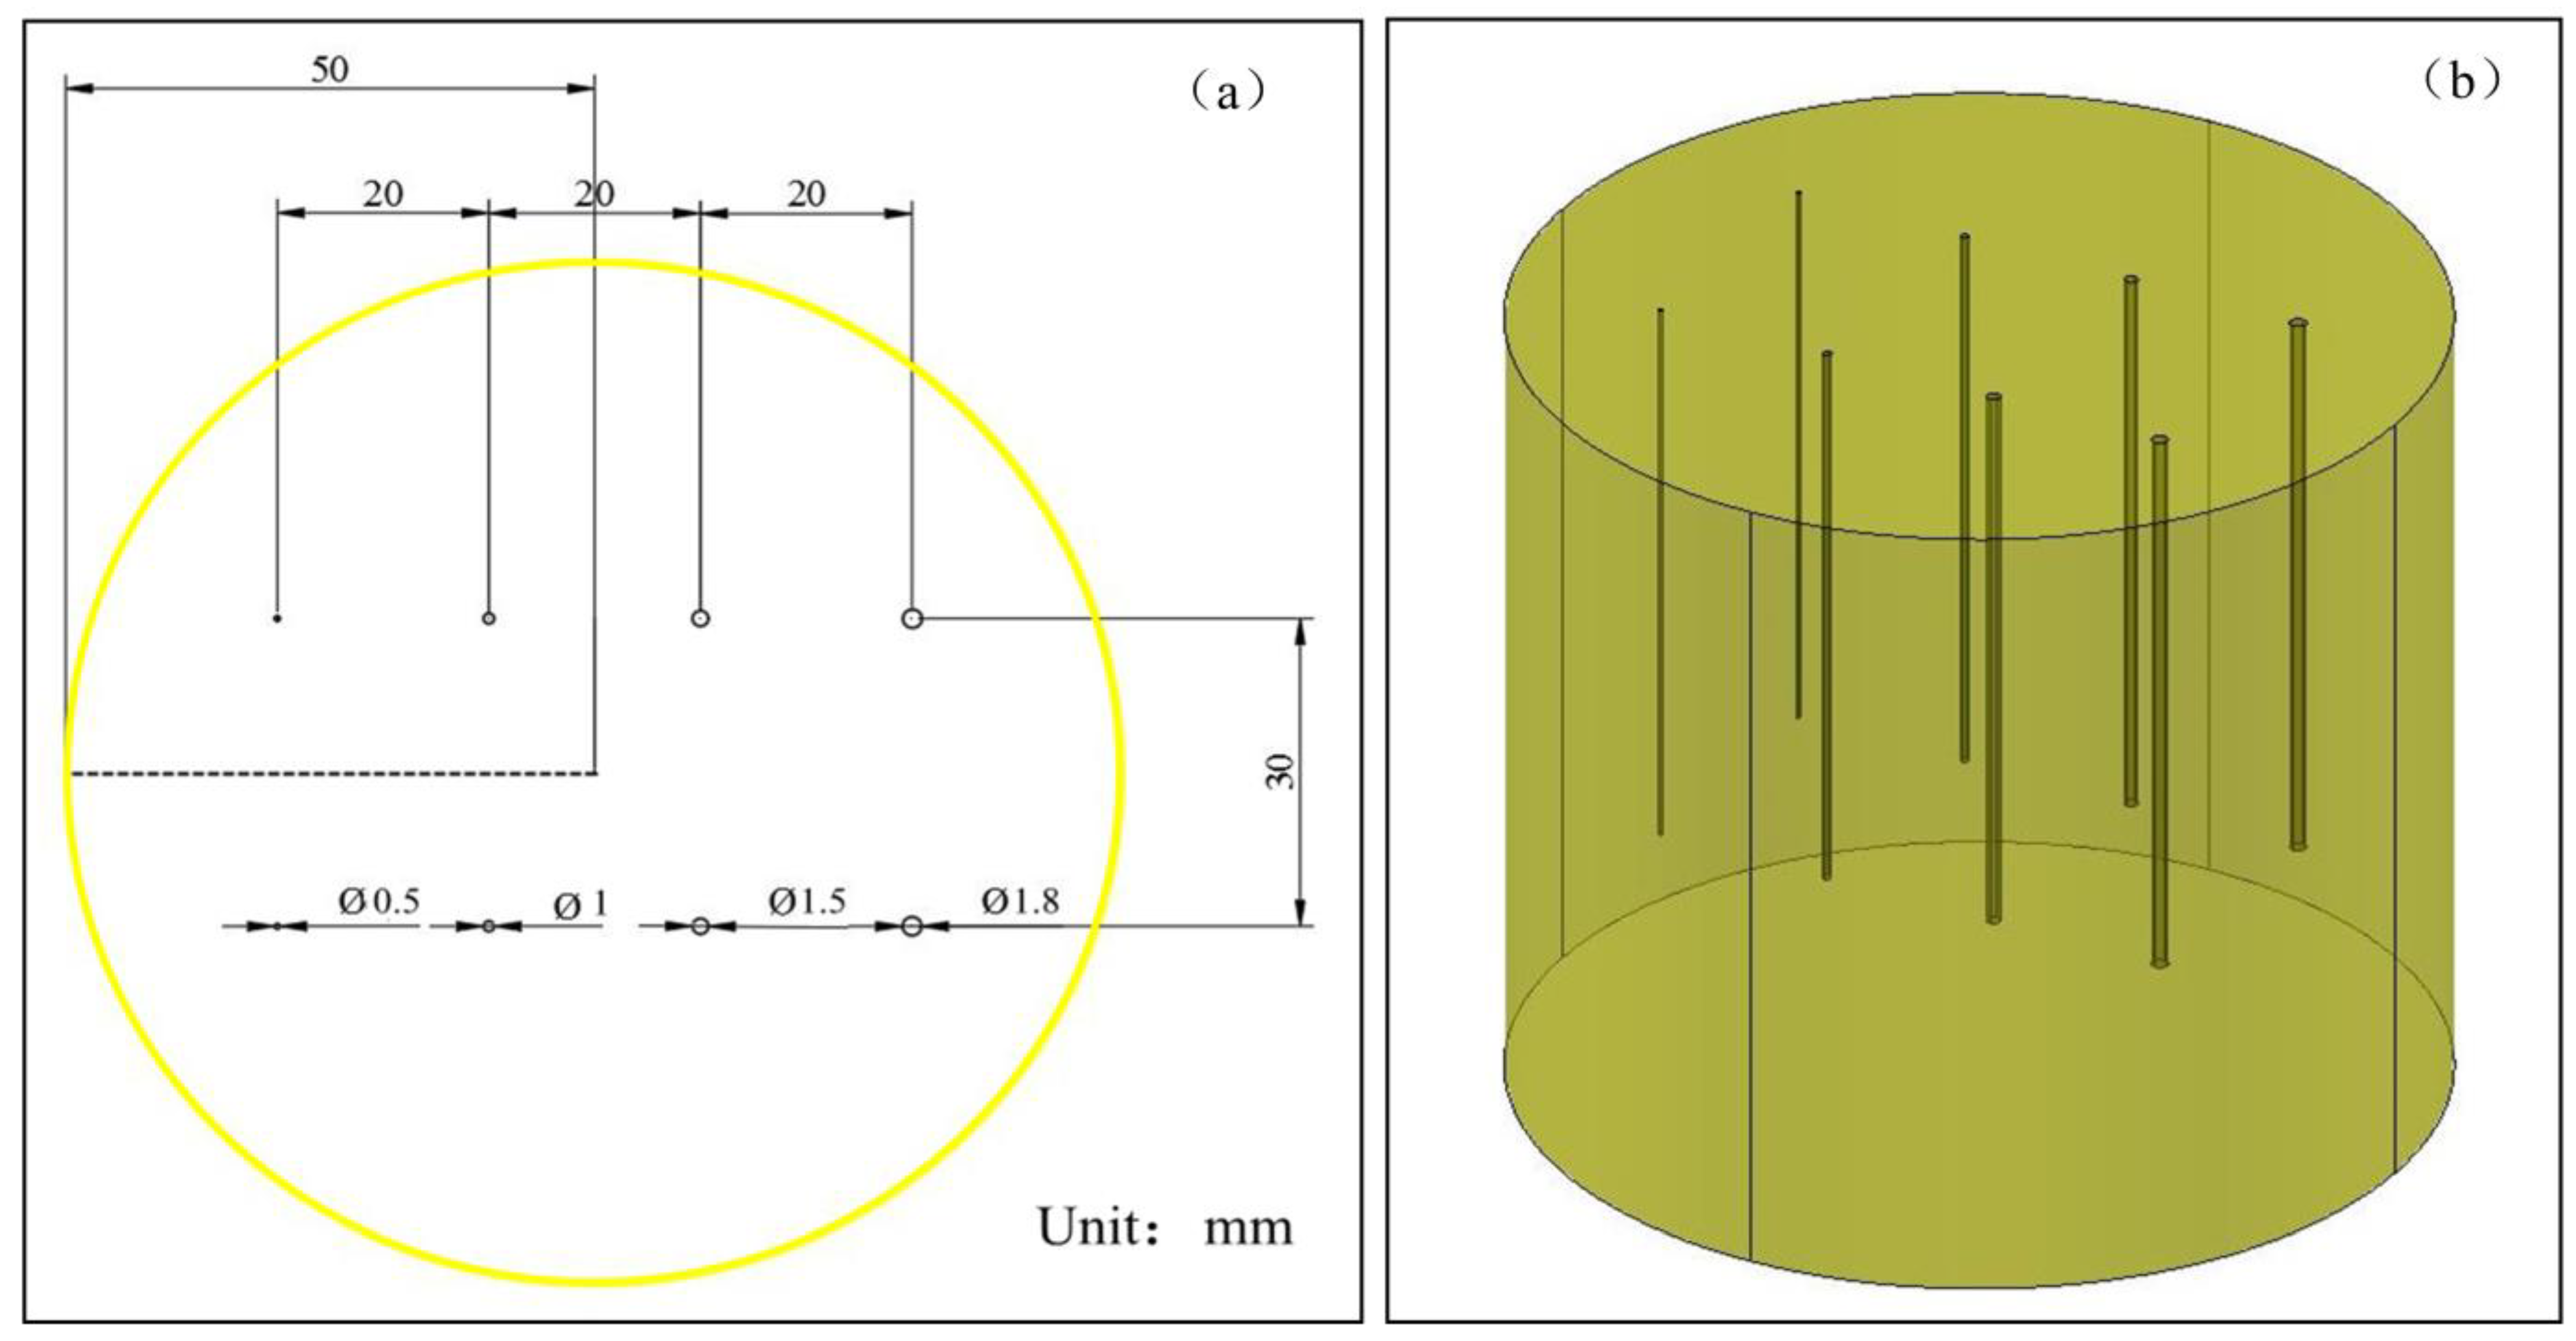
A validation experiment was designed to verify whether this heat conduction process at the surface temperature variability of Malan loess is conducted by the particle-to-particle skeletal connections in Malan loess or due to the pore spaces in Malan loess. A series of straight pore channels were artificially created in the cylindrical primary Malan loess to simulate the pore channels in the Malan soil. The four holes have diameters of 0.5 mm, 1 mm, 1.5 mm, and 1.8 mm, each hole has a depth of 70 mm, the distance between each two holes in the transverse direction was 20 mm, and the distance between two holes of the same diameter in the longitudinal direction was 30 mm. The distribution of the artificial holes in the plane is shown in Figure 4a, and the perspective view of the artificial holes is shown in Figure 4b. The artificial holes did not penetrate the whole cylindrical sample, leaving 30 mm of intact Malan loess structure on the bottom surface, which allowed the heat to be transferred in the Malan loess sample for a distance first, avoiding the thermal imager to detect the temperature on the surface of the heating plate directly.

3.2. Heat Conduction Simulation of Intact Malan Loess

In order to study the process of solid–gas two-phase heat transfer in the porous media Malan loess, this section describes the application of multiscale volume average theory to Fourier’s law for the heat transfer equation.

3.2.1. Fundamentals

Heat transfer is the ability of a material to conduct heat from a high-temperature region to a low-temperature region. In order to solve the process of heat transfer in a solid and gas phase medium of intact Malan loess at a given temperature–pressure condition, the heat conduction equation needs to be introduced. Under steady-state conditions, the heat conduction of a homogeneous material is described by Fourier’s law [14,15,16,17].
φ = λ T
The intact Malan loess is a porous medium material that is non-homogeneous. The thermal conductivity process in drying Malan loess samples contains solid particle skeleton thermal conductivity and pore skeleton thermal conductivity, and the thermal conductivity medium has two phases: solid and gas. The role of gas phase thermal conductivity at a given temperature and pressure cannot be neglected. The transient heat conduction of a given single-phase medium ( α ) phase is described by a partial differential equation [14].
ρ c p α T α t λ α 2 T α = 0
When the heat transfer state reaches stability, the equation to be solved is:
λ α 2 T α = 0
In the physical experiments of thermal conductivity of two-phase media (gas and solid) of intact Malan loess cylindrical intact Malan loess samples a constant heat flow was applied on the bottom surface with a heating plate, on the top surface of the sample and air contact surface is ambient temperature, and the sample was surrounded by thermal insulation foam. In the simulation model, a constant heat flow can be applied on the bottom surface of the sample and the heat was allowed to pass through the pores as well as the particle skeleton of the Malan loess sample extracted by CT scan section. The side surfaces of the sample are ideal thermal insulators. When the final steady state is reached, the input and output heat fluxes are equal [15].
φ t o t a l S i n = λ T i n T o u t L
Based on the previous expression, the apparent thermal conductivity can be calculated as long as we know the other terms. The experimenter controls the temperatures Tin and Tout and it is easy to determine the total heat flux through the input face by locally using Fourier’s law [35,36].
φ t o t a l = S i n λ α T α · d s
The effective thermal conductivity tensor gives global information about the thermal conduction capabilities of the material. The homogenization theory consists of considering the problem in both a macroscopic domain and a microscopic domain. Here, the macroscopic domain is the periodic domain with characteristic length L and the microscopic domain is the representative elementary volume (REV). The local eigenlength is the period length, and the dimensionless eigenspace variables x* and y* are introduced such that y* = x/l and x* = x/L, where x is the physical space variable [43,44,45]. As a result of these two eigenvariables, the spatial derivative becomes the following equation:
x + ε 1 y ε = x * y * ε < < 1
The unknown T is written as an asymptotic expansion with respect to ε. The Fourier partial differential equation is rewritten considering the new spatial derivatives and the asymptotic expansion of T. Finally, the identification of ε with the same power term leads to the solution of the continuum equation, and the following is the standard equation on the characterization body original.
λ α b α + I = 0
In Equation (7): b is considered as a perturbation of the temperature field and b is also verified by Equation (8).
λ e f f = 1 V α V α λ α b α + I d v
Malan loess is not homogeneous and contains more than one phase in the process of heat conduction. The properties of each phase can be completely different and the interfaces between the material components play a major role in the global thermal conductivity. Only two conduction media, solid skeletal solid phase and pore structured gas phase, are considered in the dried Malan loess samples, which can be extended to an arbitrary number of phases. Considering the case of a two-phase Malan loess porous media material consisting of a particle skeleton (solid phase) and a pore skeleton (gas phase), defining boundary conditions for each interface between the two phases, the system to be solved is:
λ ξ 2 T ξ = 0 T α = T β n α β · λ α 2 T α = n α β · λ β 2 T β
In Equation (9): n α β is the unit normal vector at the interface from α phase to β phase, and these boundary conditions specify that the normal components of temperature and heat flow are continuous at the interface between the two phases.

3.2.2. Conditions for the Application of the Equation

In order to simulate the heat transfer in porous media in the intact Malan loess 3D model by using the volumetric average theory and heat transfer equation, five assumptions should be set.
(1)
The solid skeleton is incompressible ( ρ s = c o n s t ) and is fixed and immobile ( ω s = 0 ). In this heat conduction simulation, the pore skeleton structure of the intact Malan loess was extracted using CT scan images, and the 3D model parameters of the pore structure could be extracted quantitatively. In order to ensure the expansion of the soil in the Malan loess during the heat conduction experiments, a heat-insulating Styrofoam was fixed between the Malan loess and the PVC pipe, which on the one hand provided thermal insulation and preservation, and on the other hand overcame the expansion of the soil during the heating process and changed the pore skeleton (although this phenomenon was minimal).
(2)
The thermal conductivity of the solid and gas phases is a constant, that is k i = c o n s t i = s , g . Enthalpy: h T = C p T , where C p = c o n s t . In this study, when doing the heat transfer experiments of the intact Malan loess, the intact sample was dried and a uniform heat source was added at the bottom to provide a stable heat drive, allowing heat to form thermal convection in the pore skeleton of the Malan loess. And the pore skeleton in the intact Malan loess is extracted unions obtained from CT scans, and only the heat convection process is calculated during the heat transfer simulation, with the thermal conductivity of the gas phase as a constant.
(3)
There is no chemical reaction in each phase, and there is no mass source or sink. Ignore the compressibility of gases. The gas phase dissipation is also zero, and T l = T g . T l is liquid temperature and T g is gas temperature.
(4)
The surface energy of the solid–gas two-phase interface is negligible.
(5)
Near the solid wall ω l = 0 , ω g = 0 , there is no slip flow occurs.

3.2.3. Solution Method

There are two methods of estimating thermal conductivity when solving for thermal conductivity. The first method is based on experimental simulations of the resolution of the Fourier equation. The second method uses the theory of homogenization over an infinite periodic domain to solve the standard problem derived from the Fourier equation. The first approach is conducted in experimental simulations of thermal conductivity. In addition to the internal interface conditions between the phases, there are three external boundary conditions: (1) A pixel-wide plane of thermal insulator was added to the outer surface of the image along the main direction of heat flux so that the sample could be isolated from the outside world. (2) The input and output (the face perpendicular to the main direction of heat flux) are designed as a pixel-wide plane where the temperature is applied. (3) Any two inputs from the three cases of input temperature, output temperature, and heat flow density are available to be applied to the input and output surfaces, and the simulation selects two inputs depending on the different heat transfer methods, in this case, the input temperature and heat flux are selected this time.
The second approach is to use the theory of homogenization over an infinite periodic domain to solve the standard problem derived from the Fourier equations. This is performed in the thermal conductivity tensor calculation module. The two boundary conditions are generated by the temperature and heat flow along the normal upward component at the interface of the two phases. A periodic boundary condition is applied to the b α geometry to solve the system of Equation (10).
b α = b β λ α n α β b α + I = λ β n α β b β + I

3.2.4. Discretization of Systems of Equations and System Resolution

The finite volume method is used to solve the system of equations when solving the physical model. The discrete format assumes that the pixels are isotropic. After discretization, the system of equations can be written as A x = b , with A being a sparse symmetric matrix. The system of equations is solved using a fully implicit method (matrix inversion). Iterative solutions are performed using conjugate gradients and ILU pre-conditioners. The convergence criterion used is the relative reduction of the residual l2 parametrization.

4. Results and Analysis

4.1. CT Scan Section Processing

At present, in conducting the 3D pore structure characterization and particle quantification analysis platform of porous media, AVIZO software can perform noise reduction processing of CT images, threshold segmentation of images, 3D reconstruction of pores, pore network model construction, pore connectivity analysis, heat conduction simulation, and calculation of absolute thermal conductivity. AVIZO software has a wide range of applications in biomedical, petrology, soil science, and industrial fields and can meet the needs of this study. AVIZO software has a heat conduction module developed based on the volume averaging method, so AVIZO software was chosen to perform image processing, pore network modeling, and heat conduction simulation in this study.
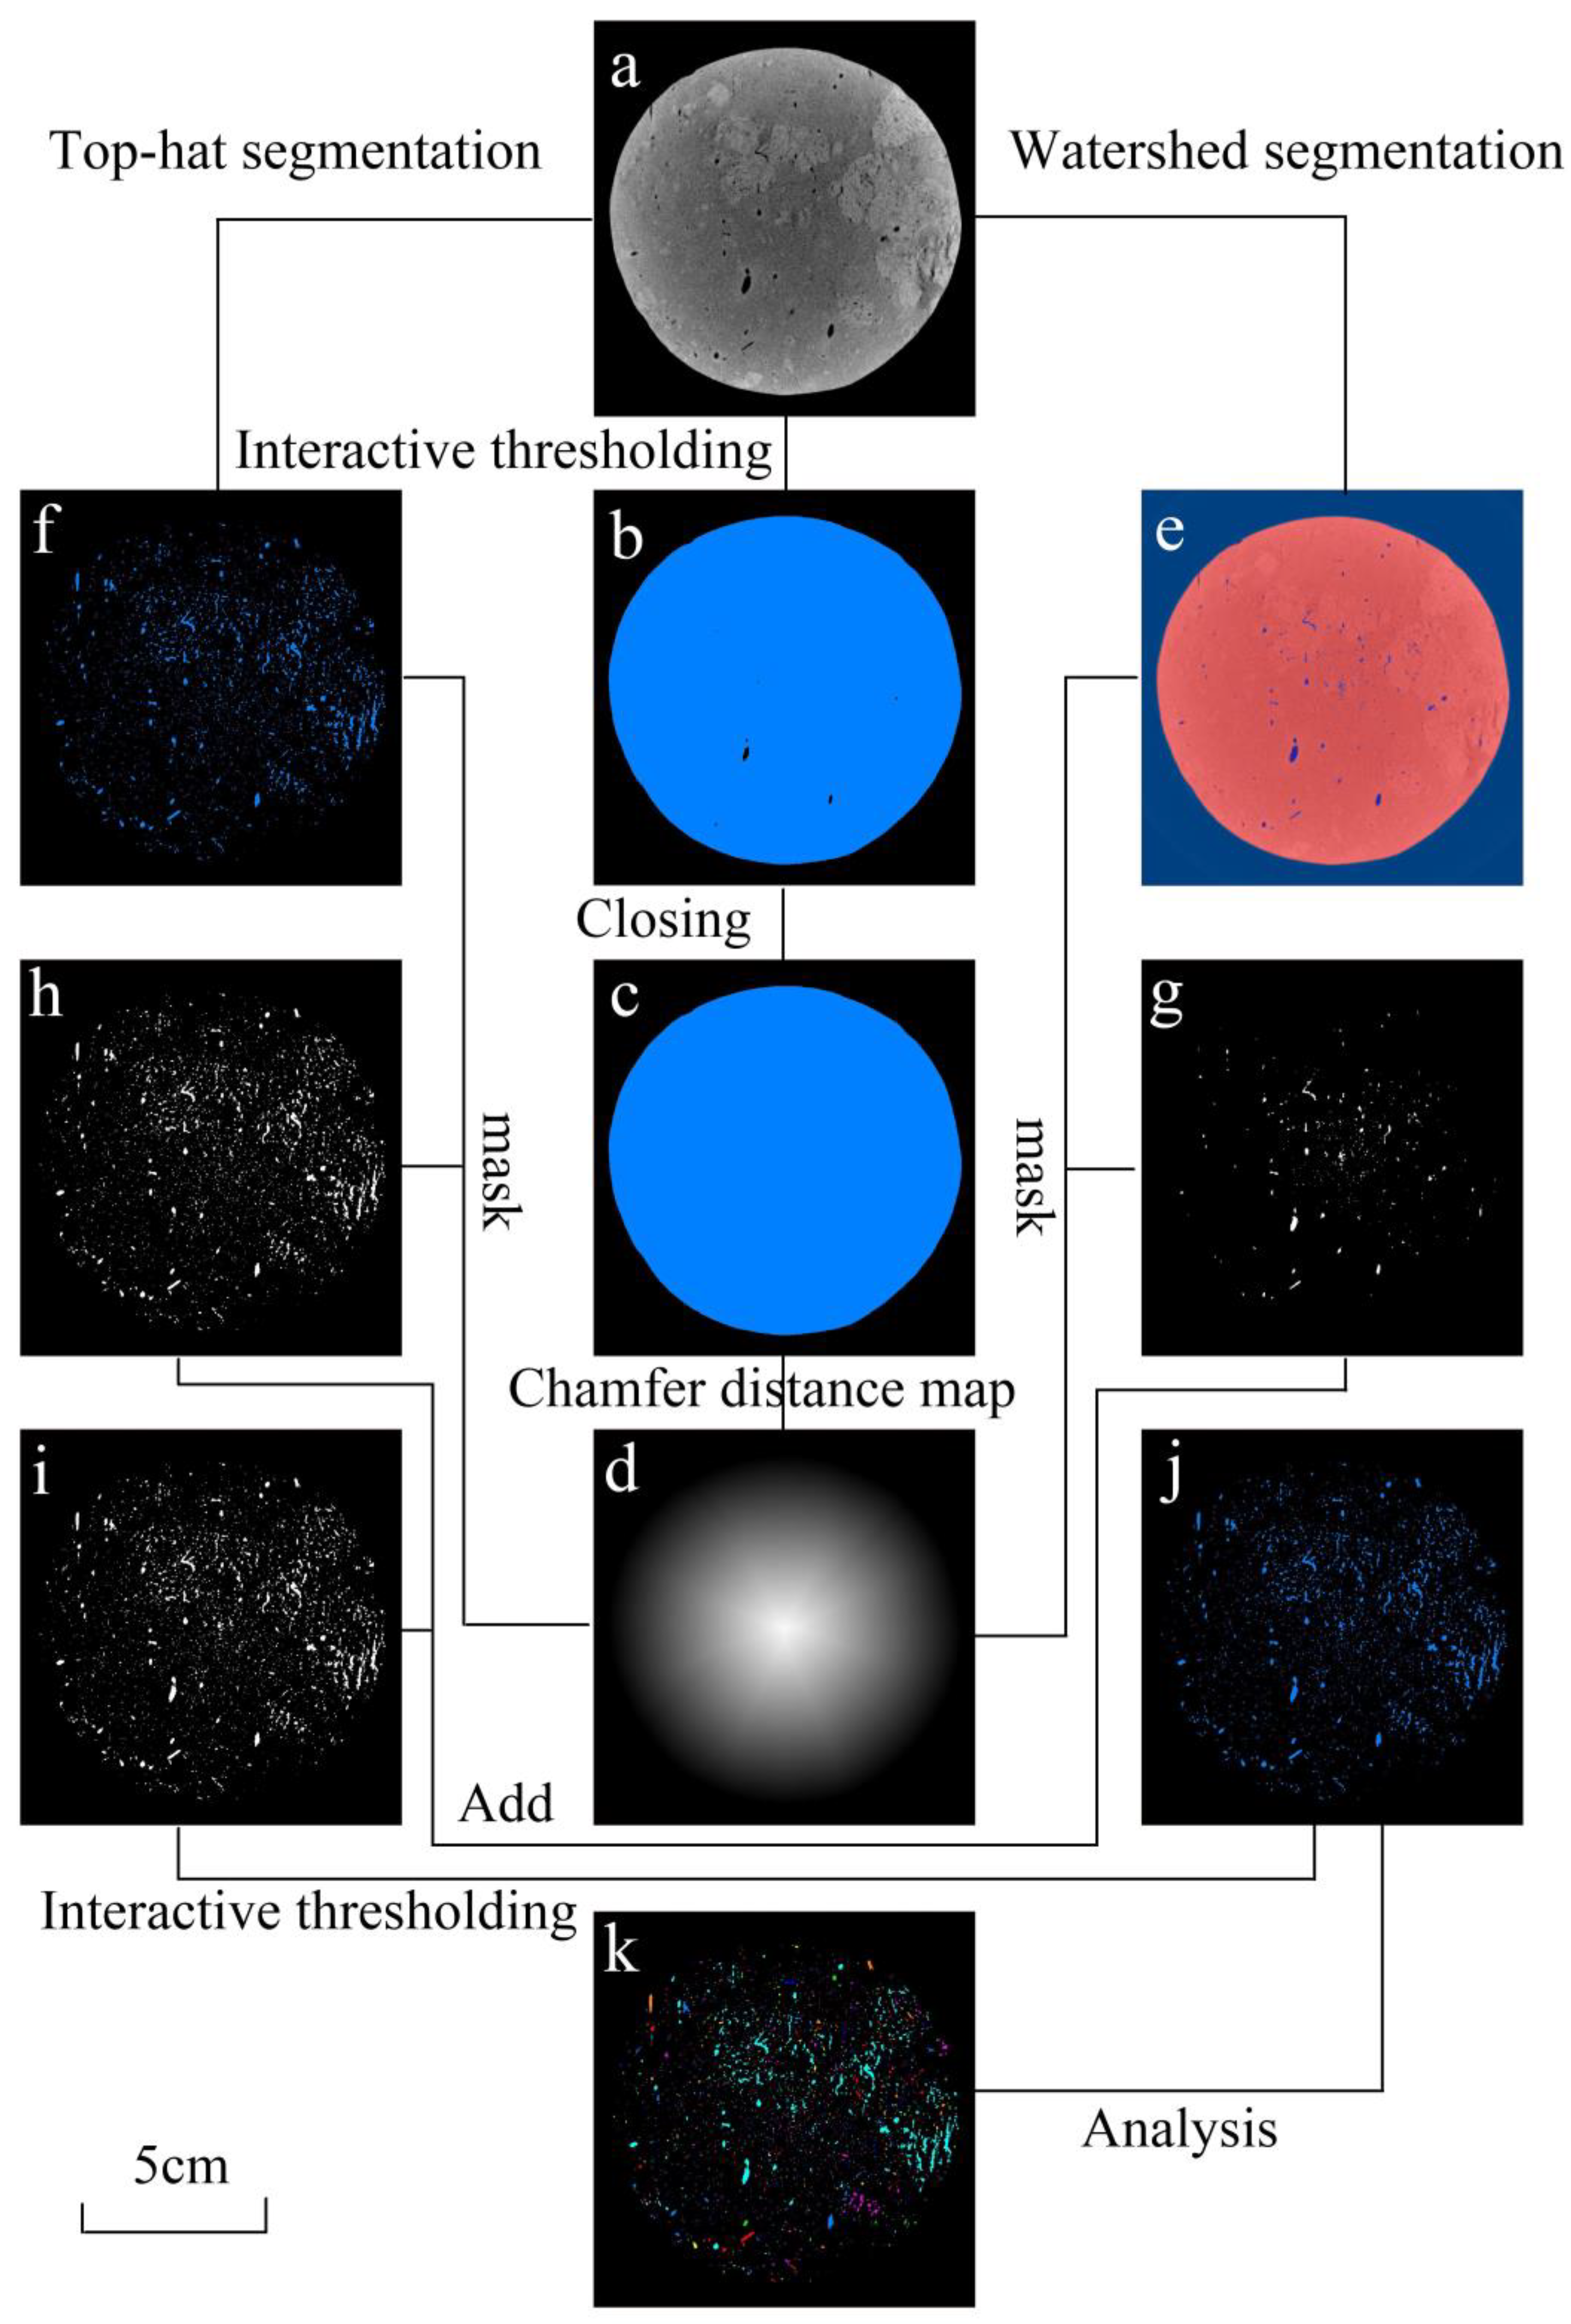
After the calibration of CT sections, the skeleton and pore structure of Malan loess should be extracted, which requires threshold segmentation of CT scan sections of intact Malan loess. The segmentation process is shown in Figure 5. Figure 5a is the original slice. Since the environmental background and internal pores of Malan loess are almost the same in slice imaging, in order to distinguish the internal pores of loess from the external environment, the entire external contour of the Malan loess sample was first segmented by the interactive segmentation method, and the image after segmentation is shown in Figure 5b. The CLOSING module was used to fill the pores inside the entire Malan loess sample so that the pores in Figure 5b can be filled. The slices after filling are shown in Figure 5c, and then a mask layer is generated by the chamfer distance map module as the base for subsequent flood segmentation and top cap segmentation. The mask layer slice is shown in Figure 5d.
Flood segmentation is good for the segmentation of connected macropores in Malan loess samples. Top-cap segmentation can extract the whole internal pores of Malan loess according to the gray value of slice images, but excessive segmentation will occur. The large pores that can be identified by the naked eye were segmented by the flood segmentation method, as shown in Figure 5e. Then, overlay the Figure 5e image and mask layer Figure 5d to obtain a grayscale image, as shown in Figure 5g. The image obtained after the segmentation of the Malan loess sample by top-hat segmentation is shown in Figure 5f. Then, a grayscale image was obtained by superimposing Figure 5f and mask layer Figure 5d, as shown in Figure 5h. The two greyscale images, Figure 5g,h, are superimposed together using the algorithm to obtain the new image, as shown in Figure 5i. Interactive segmentation of the Figure 5i image was performed to obtain the final segmented pore, as shown in Figure 5j. The pores were reconstructed with the segmentation images, and the morphological characteristics of the pores were obtained after statistical analysis, as shown in Figure 5k.
In this study, the porosity of Malan loess was 46% and the specific yield was 9.12%, and the specific yield of intact Malan loess was used as the basis for the division of the threshold value of linked large porosity in the loess. By continuously adjusting the threshold interval of the top hat partition, the final porosity of the model was obtained as 9.116%. The model porosity is smaller than the actual porosity of the Malan loess because pores smaller than 14.089 μm in diameter cannot be identified.

4.2. Pore Network Model

4.2.1. Determination of Representative Volume Units

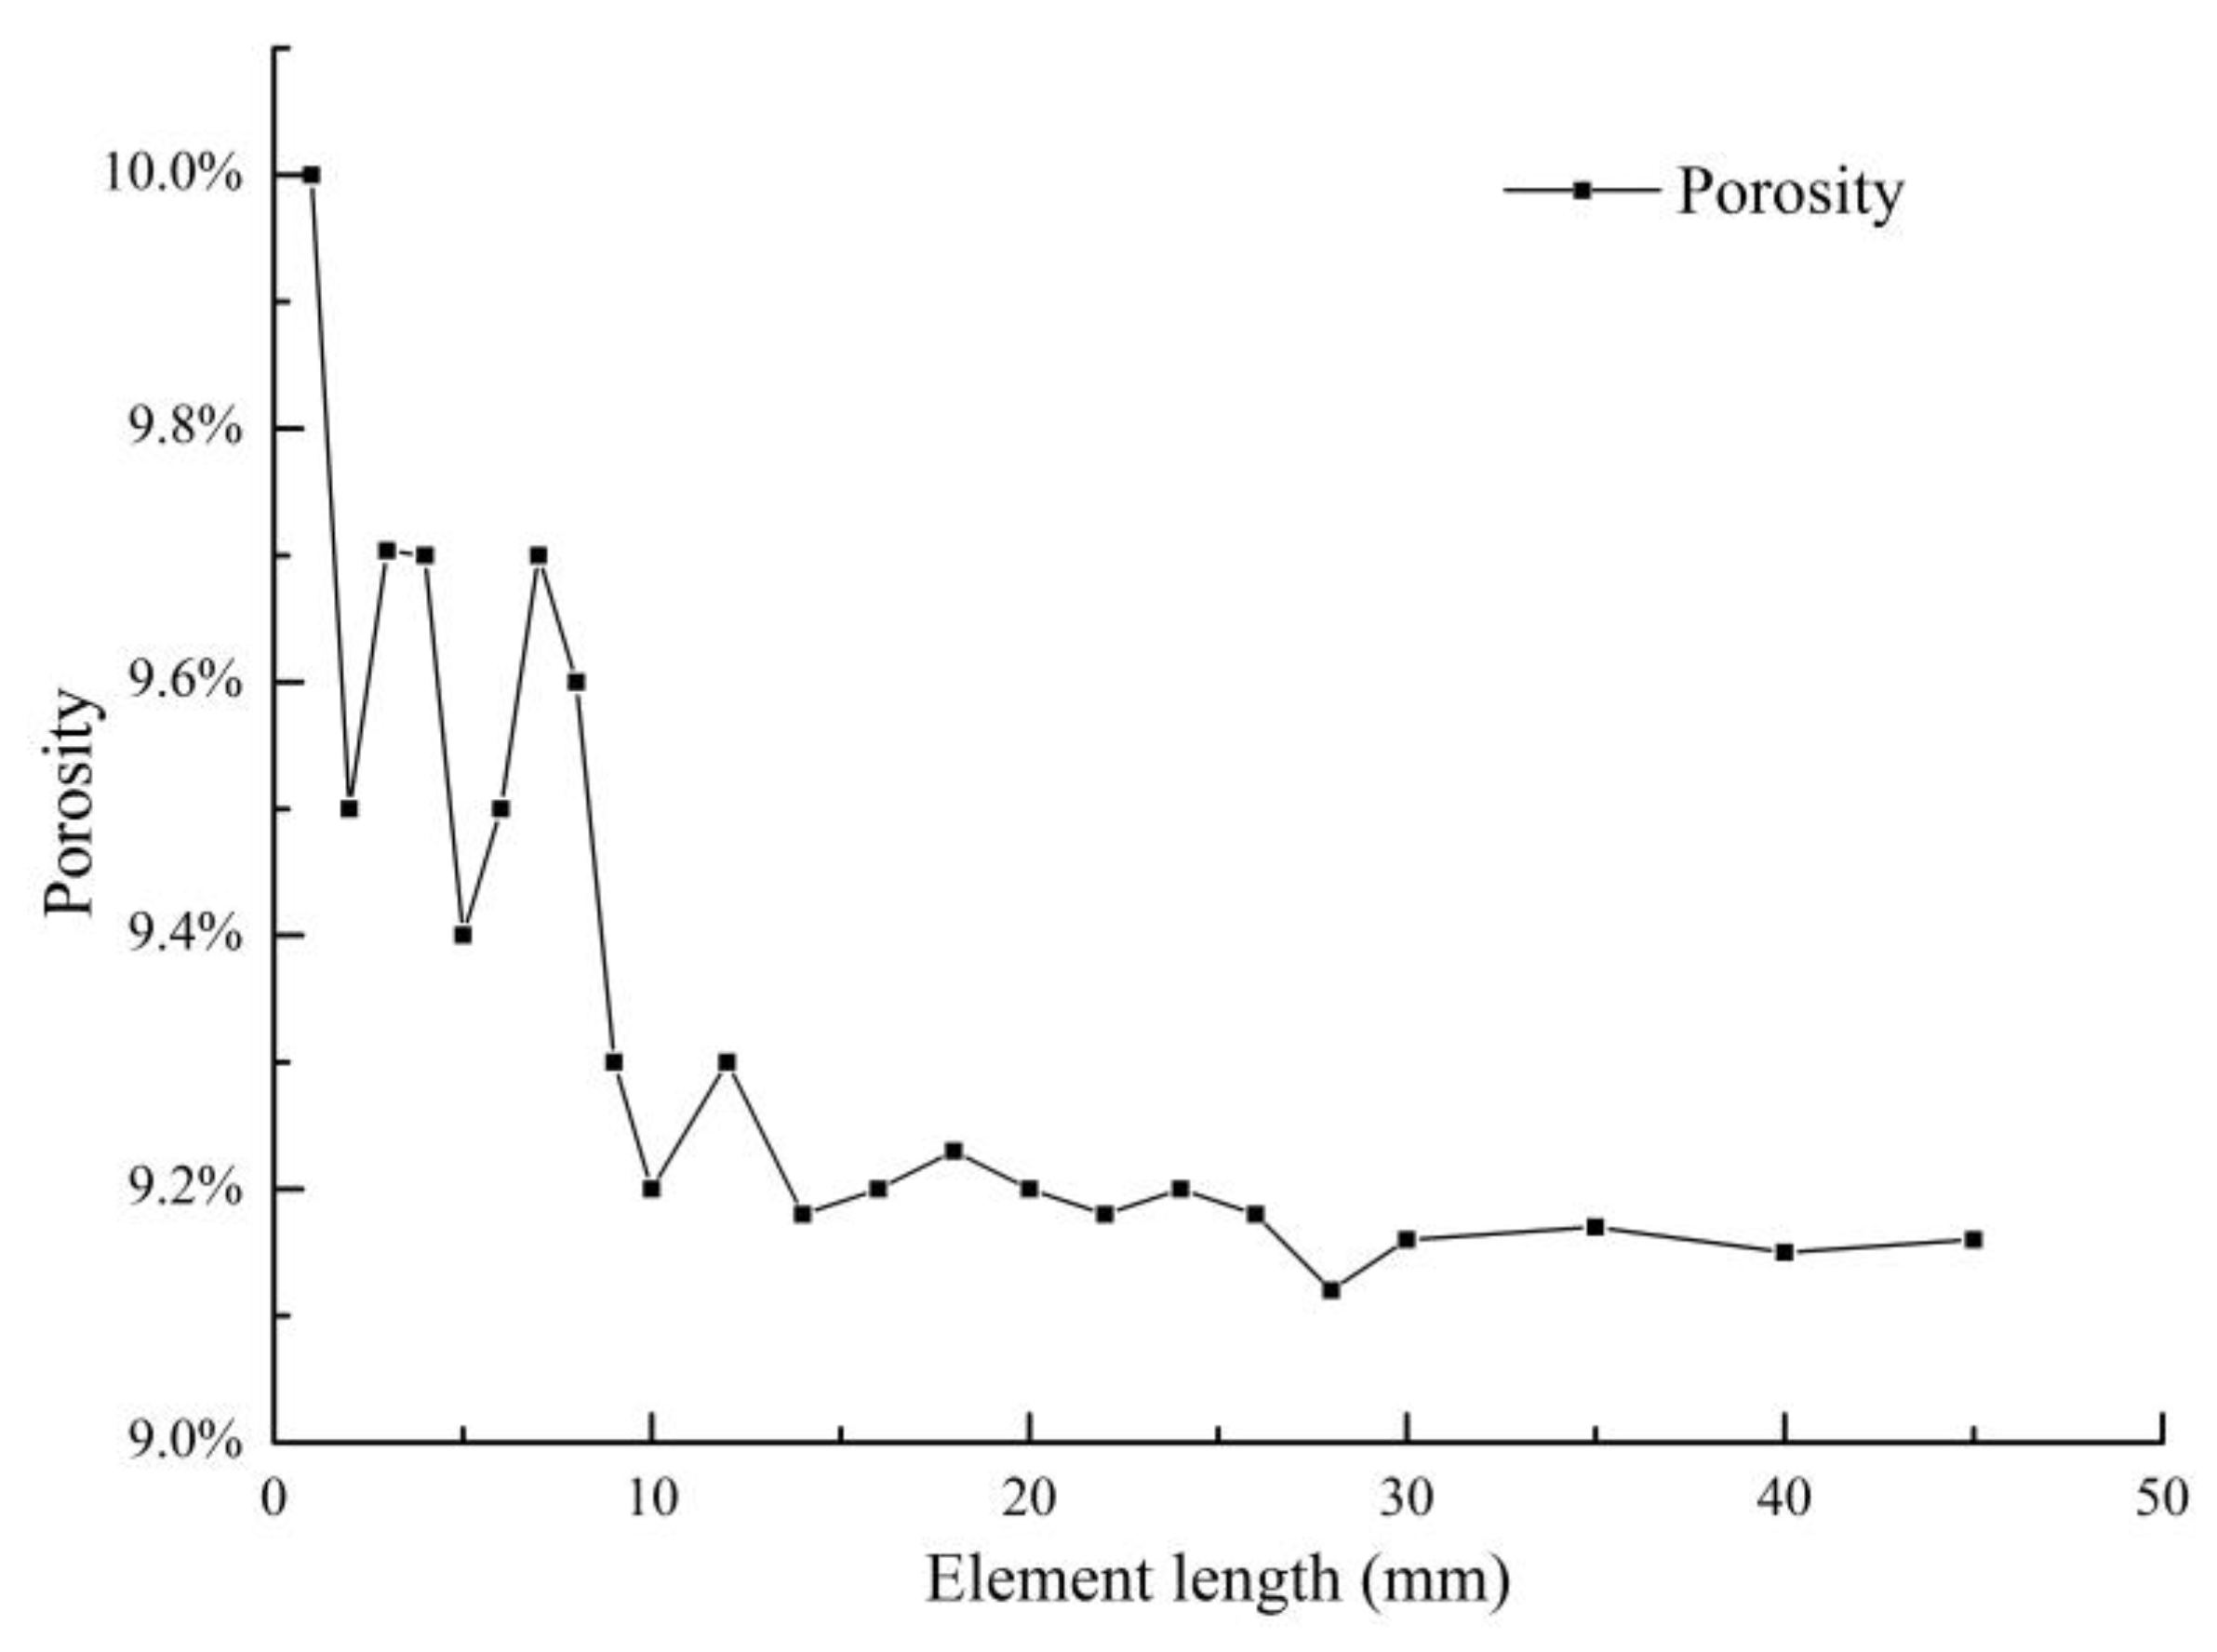
Considering the limitation of computer computing power and the setting of boundary conditions when doing thermal simulation, and in order to make the space selected for calculation representative, a series of cubes with different side lengths were selected as the representative elementary volume (REV) on the CT scan image in this study, as shown in Figure 6. And the porosity was calculated from the segmented CT scan slice, and when the porosity tends to be stable, the cube was considered as the smallest representative volume unit. The porosity of the representative cube reaches a stable value when the side length of the cube reaches 30 mm, as shown in Figure 7, the subvolume is considered representative of the intact Malan loess sample in this study when the side length of the cube reaches 30 mm or more, and the minimum length of the subvolume unit used for thermal simulation is greater than 30 mm.

4.2.2. Construction of Pore Network Model

Because the morphological structure of the interconnected pores in the intact loess is very complex, the pore network model of the interconnected pores in the intact Malan loess can be established by CT scan sections after segmentation. The pore network model assumes that an interconnected pore has multiple pore network models consisting of different pores connected by pore channels, and the pore throat was the location with the smallest equivalent diameter in the pore channel. The established pore network model can be represented by a ball-and-stick model, where the stick represents the pore channel, and the ball represents the pore throat. The pore network model can be used to quantify the pores in the intact Malan loess. Key information such as the length of the pore channel, the area of the pore howl, and the number of allotments are obtained. The pore network model is shown in Figure 8.

4.3. Pore Network Model Analysis

4.3.1. Analysis of the Distribution Characteristics of Pores and Pore Throats

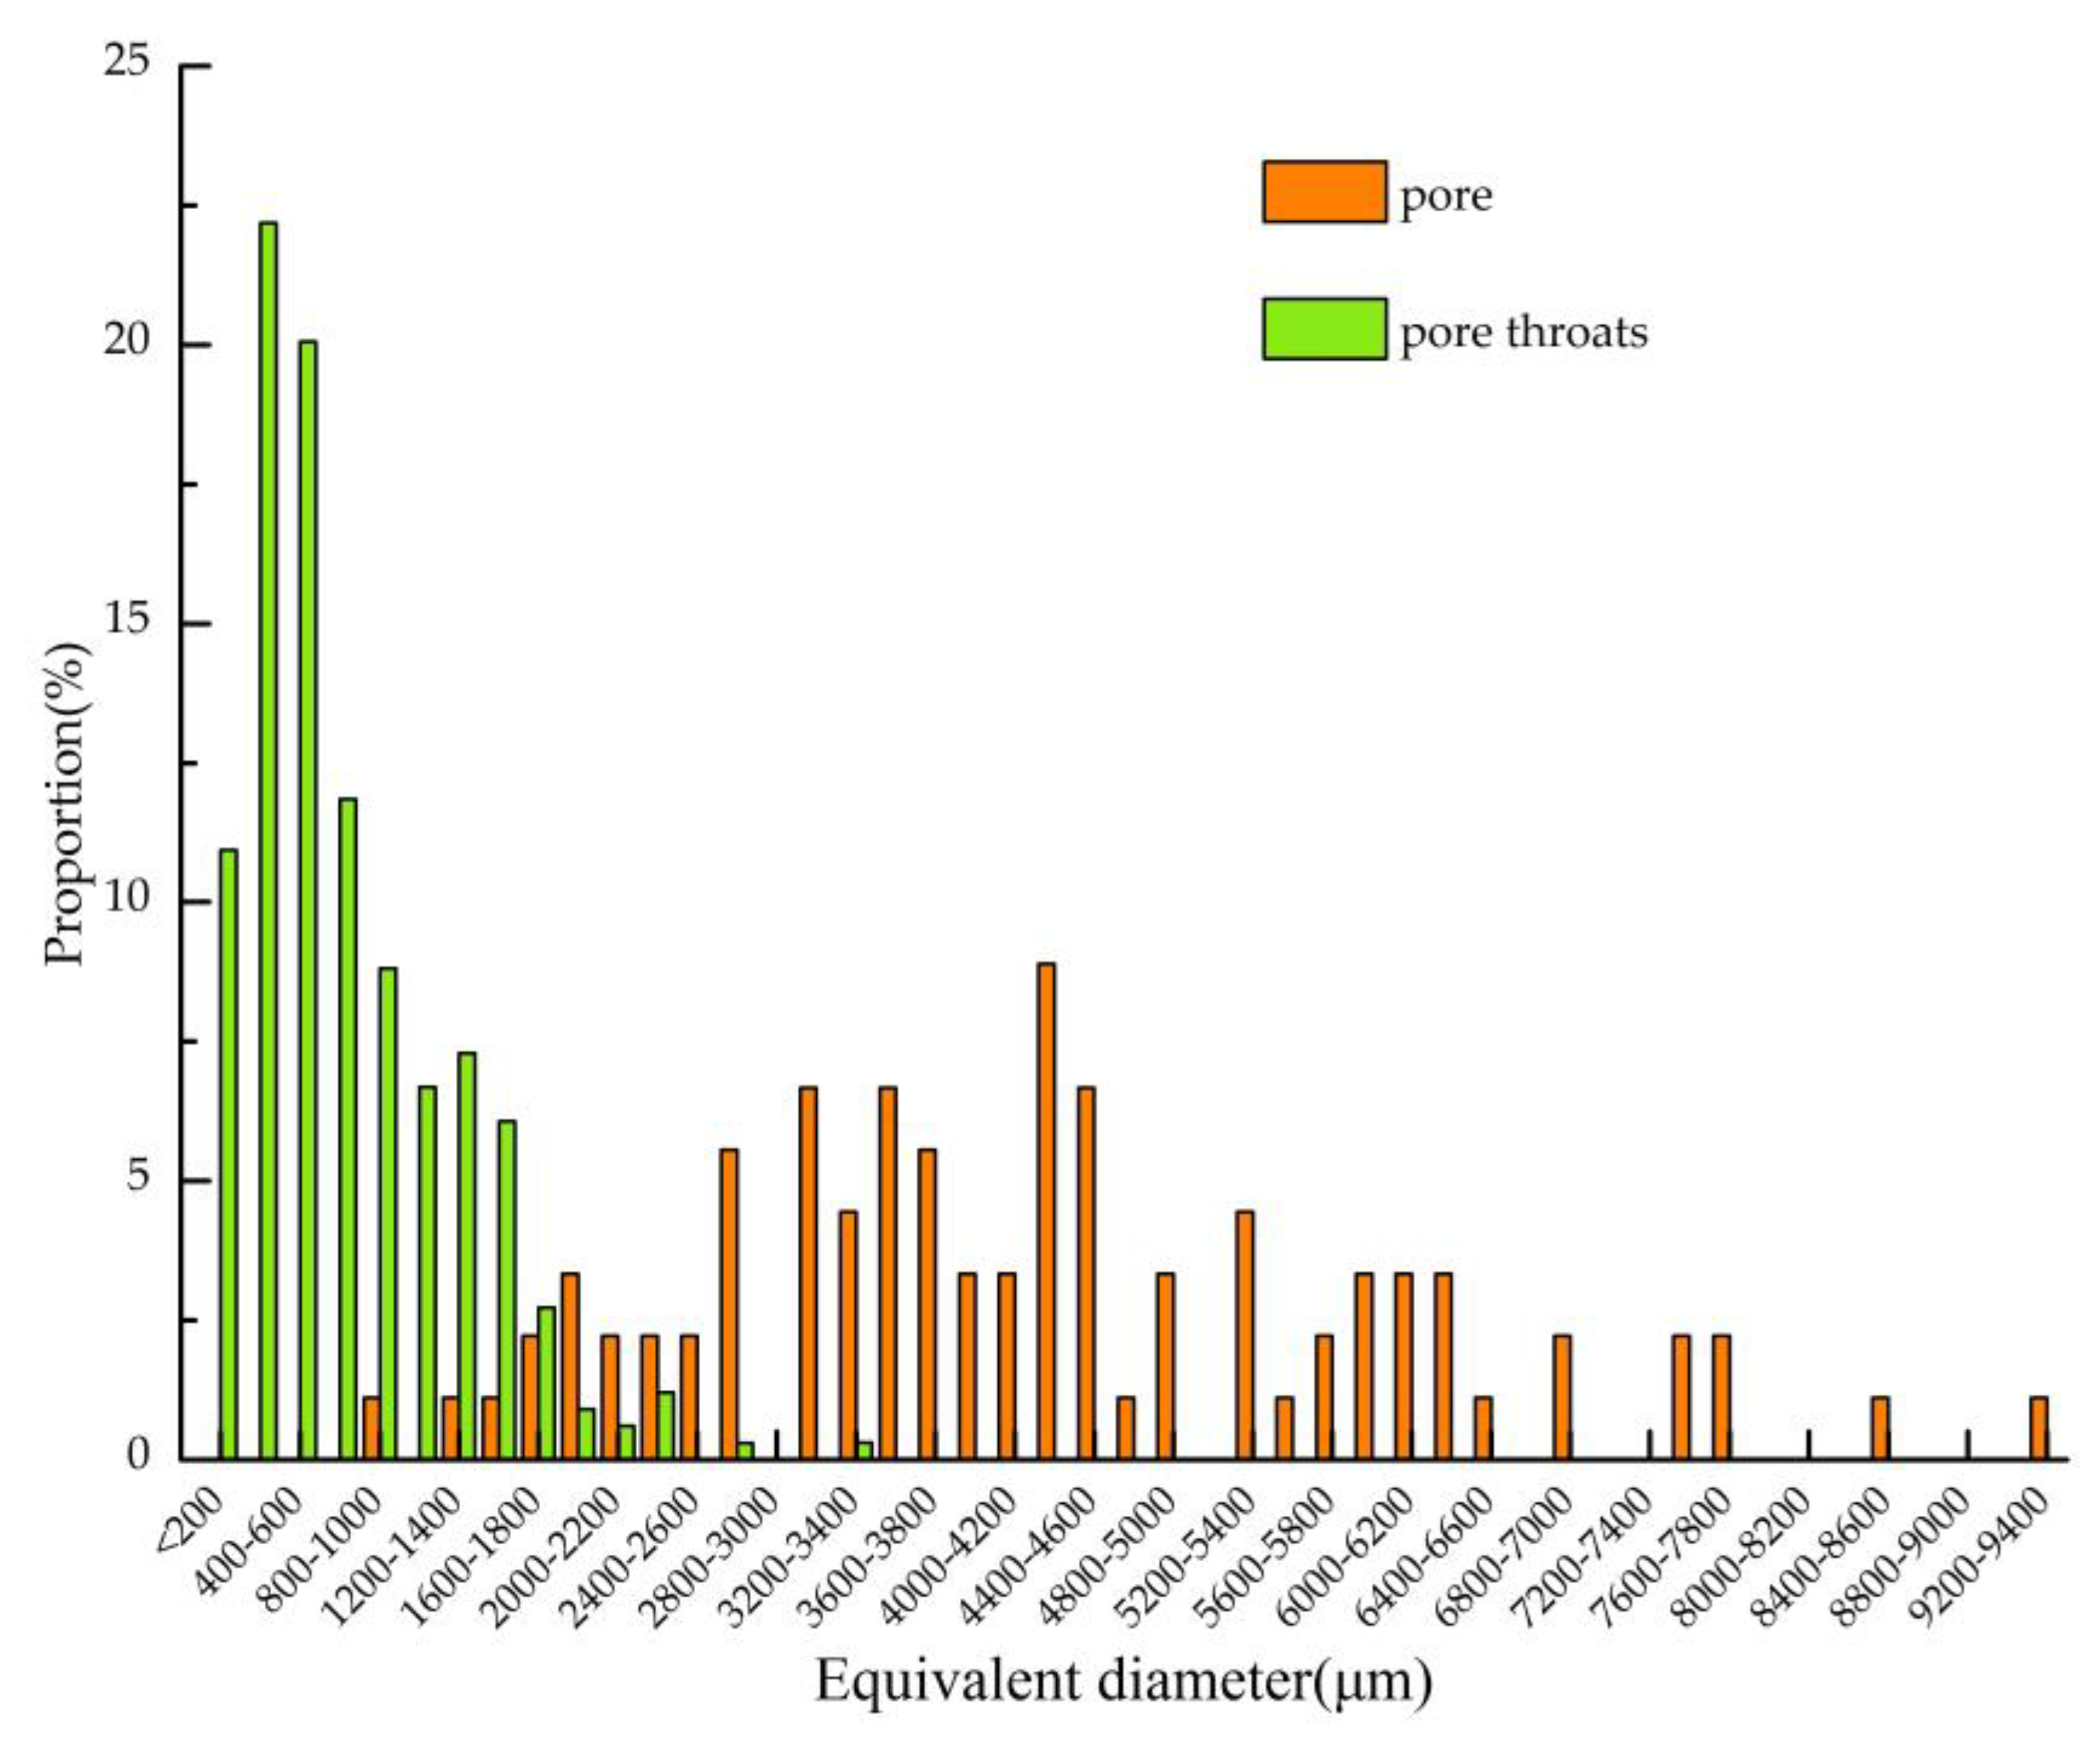
According to the established pore network model, the distribution range of the pore throat and pore channel equivalent diameter was counted, and the distribution range of the pore was wider than that of the pore throat. Histogram statistics of the equivalent diameter of pore and pore throat with 200 μm interval were conducted, and it was found that the distribution percentage of pore and pore roar approximately obeyed the lognormal distribution. According to Figure 9, the pores were mainly distributed in the interval of pore diameter of 800–6600 μm, accounting for 90% of the total. The pore throats were mainly distributed in the interval of pore diameter of 200–1800 μm, accounting for 96.62% of the total.

4.3.2. Pore Connectivity Characteristics Analysis

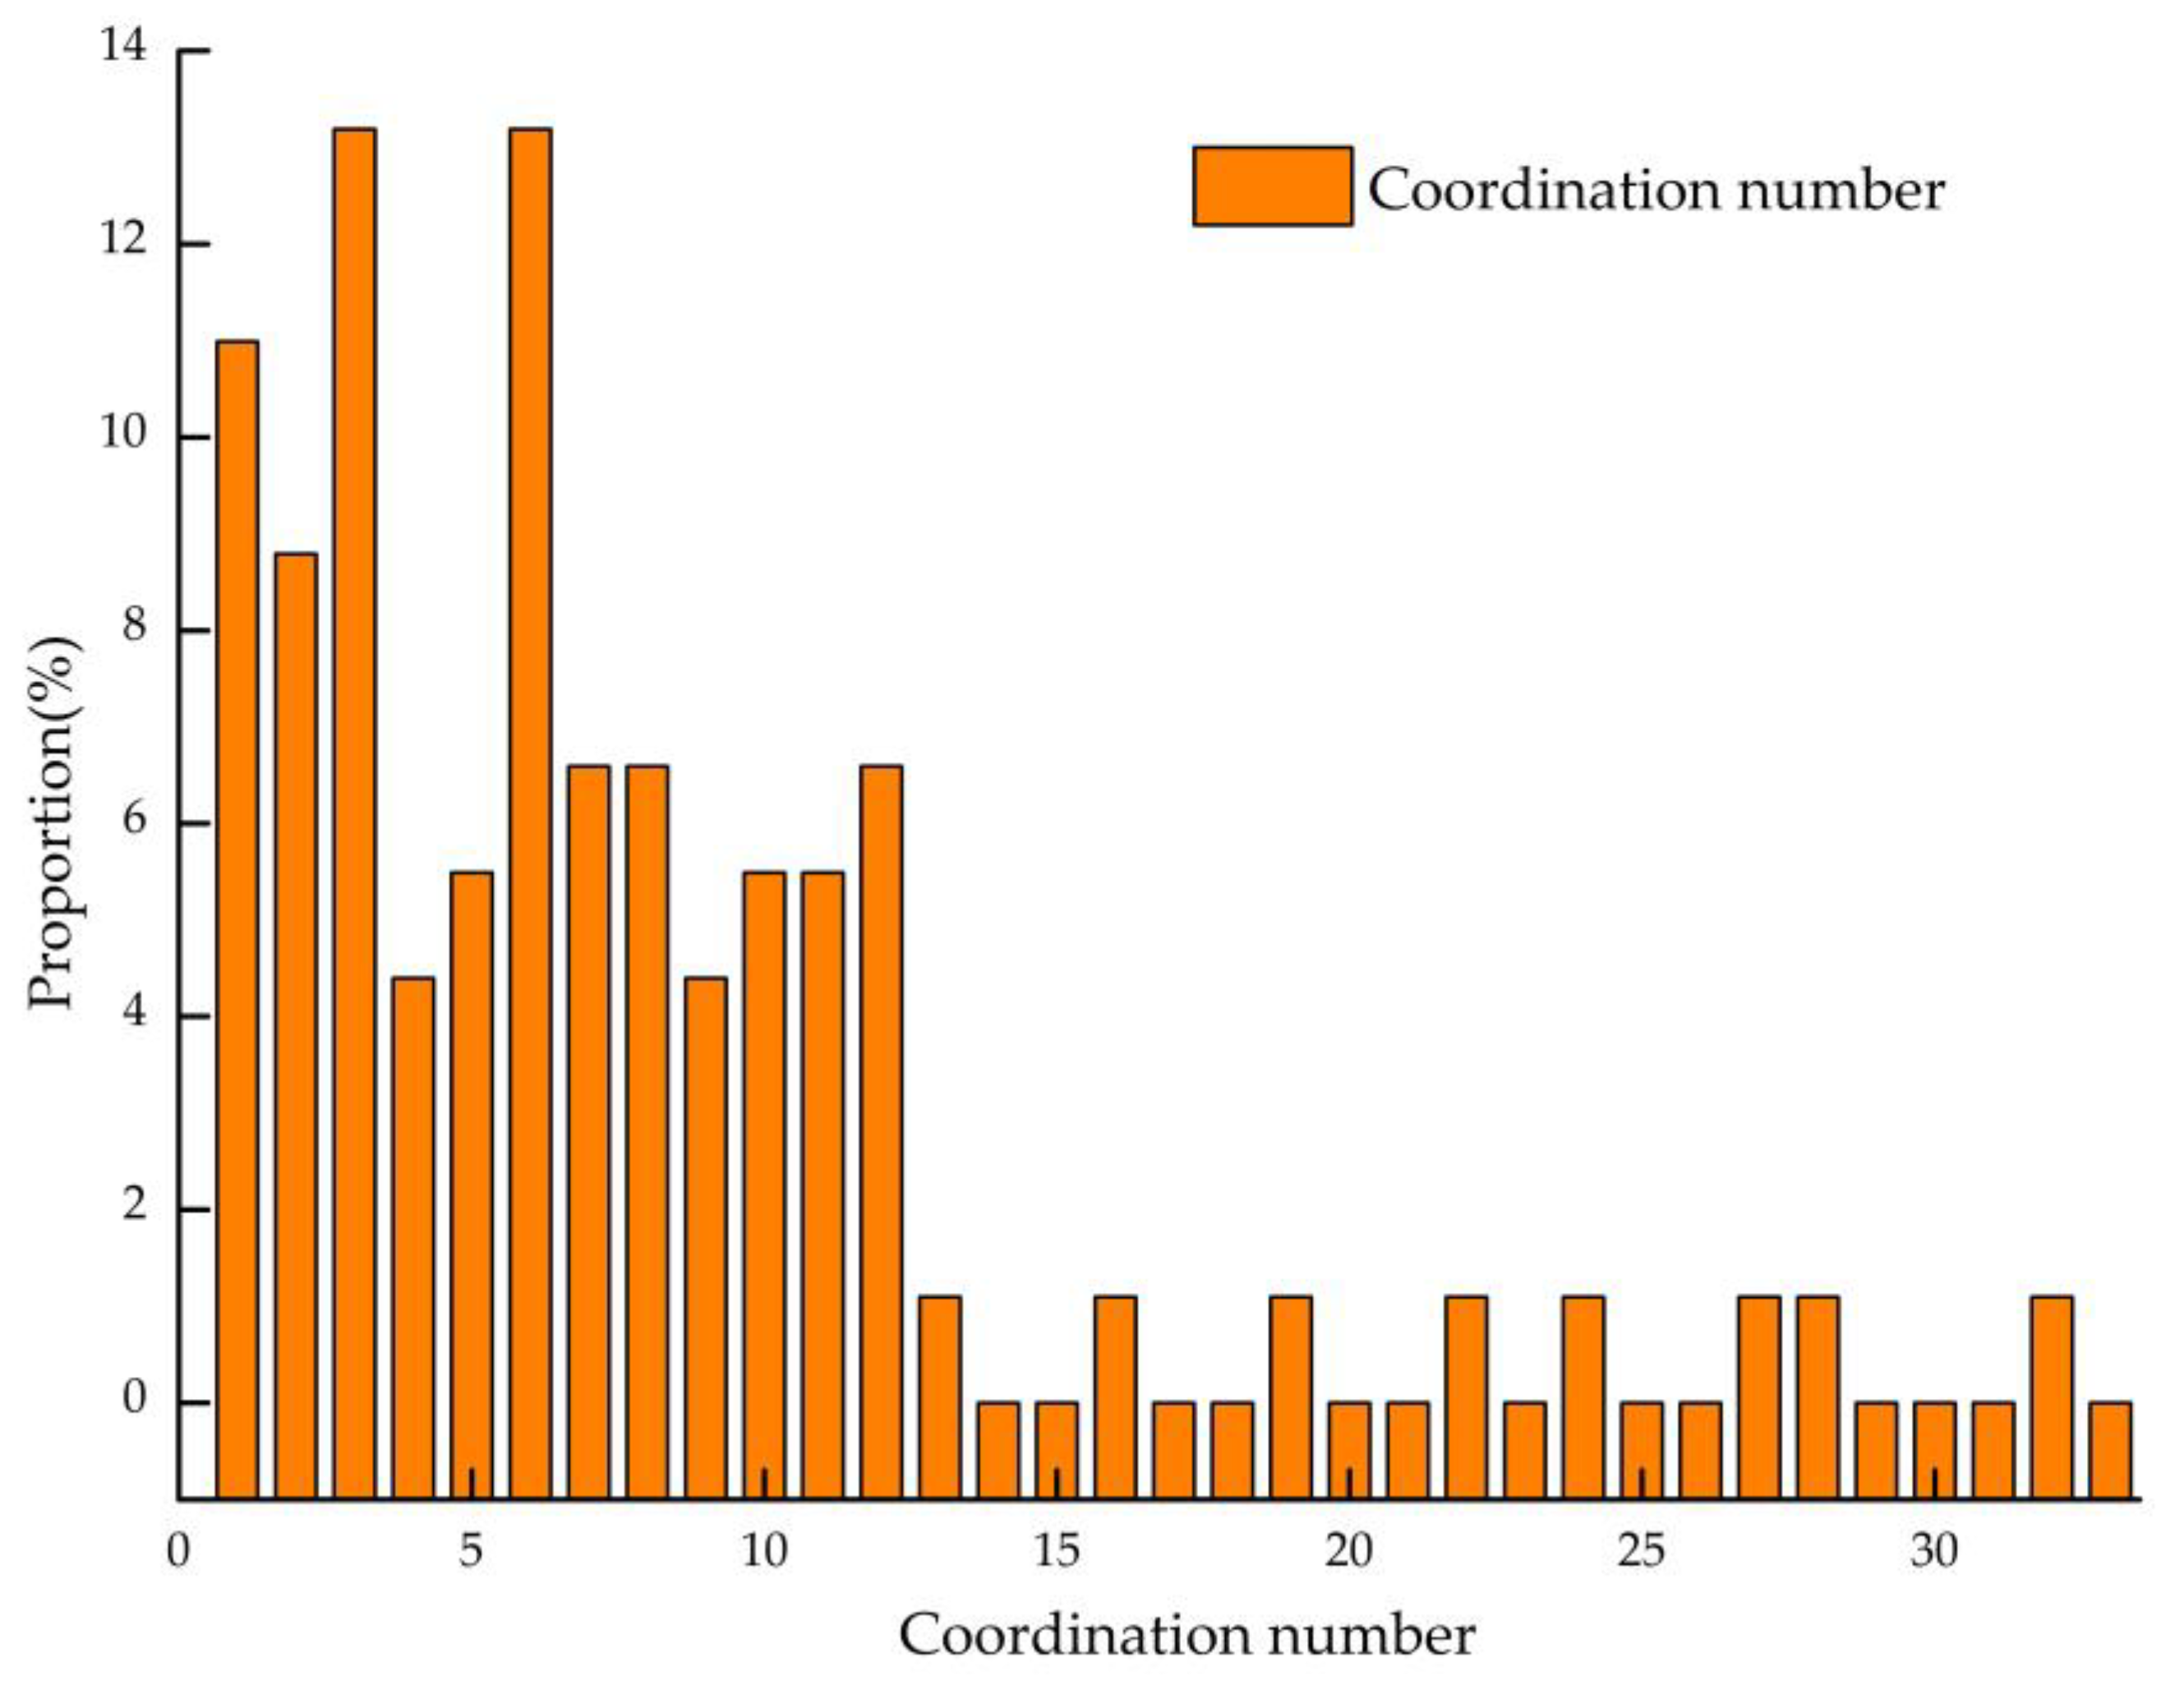
The established pore network model can be used to calculate the coordination of the number of pore throats connected to the pores in the ball-and-stick model. The coordination number can characterize the connectivity of the pores, and a higher coordination number represents better connectivity with the surrounding pores. According to the constructed pore network model, the calculated coordination number was statistically analyzed, as shown in Figure 10. The maximum number of coordination is 32, the plurality of coordination was 3 and 6, and the coordination number was mainly distributed between 1 and 12, which can indicate that the overall connectivity of pores was good.

4.4. Analysis of Heat Conduction Experimental Results

4.4.1. Analysis of Heat Conduction Experimental Verification Results

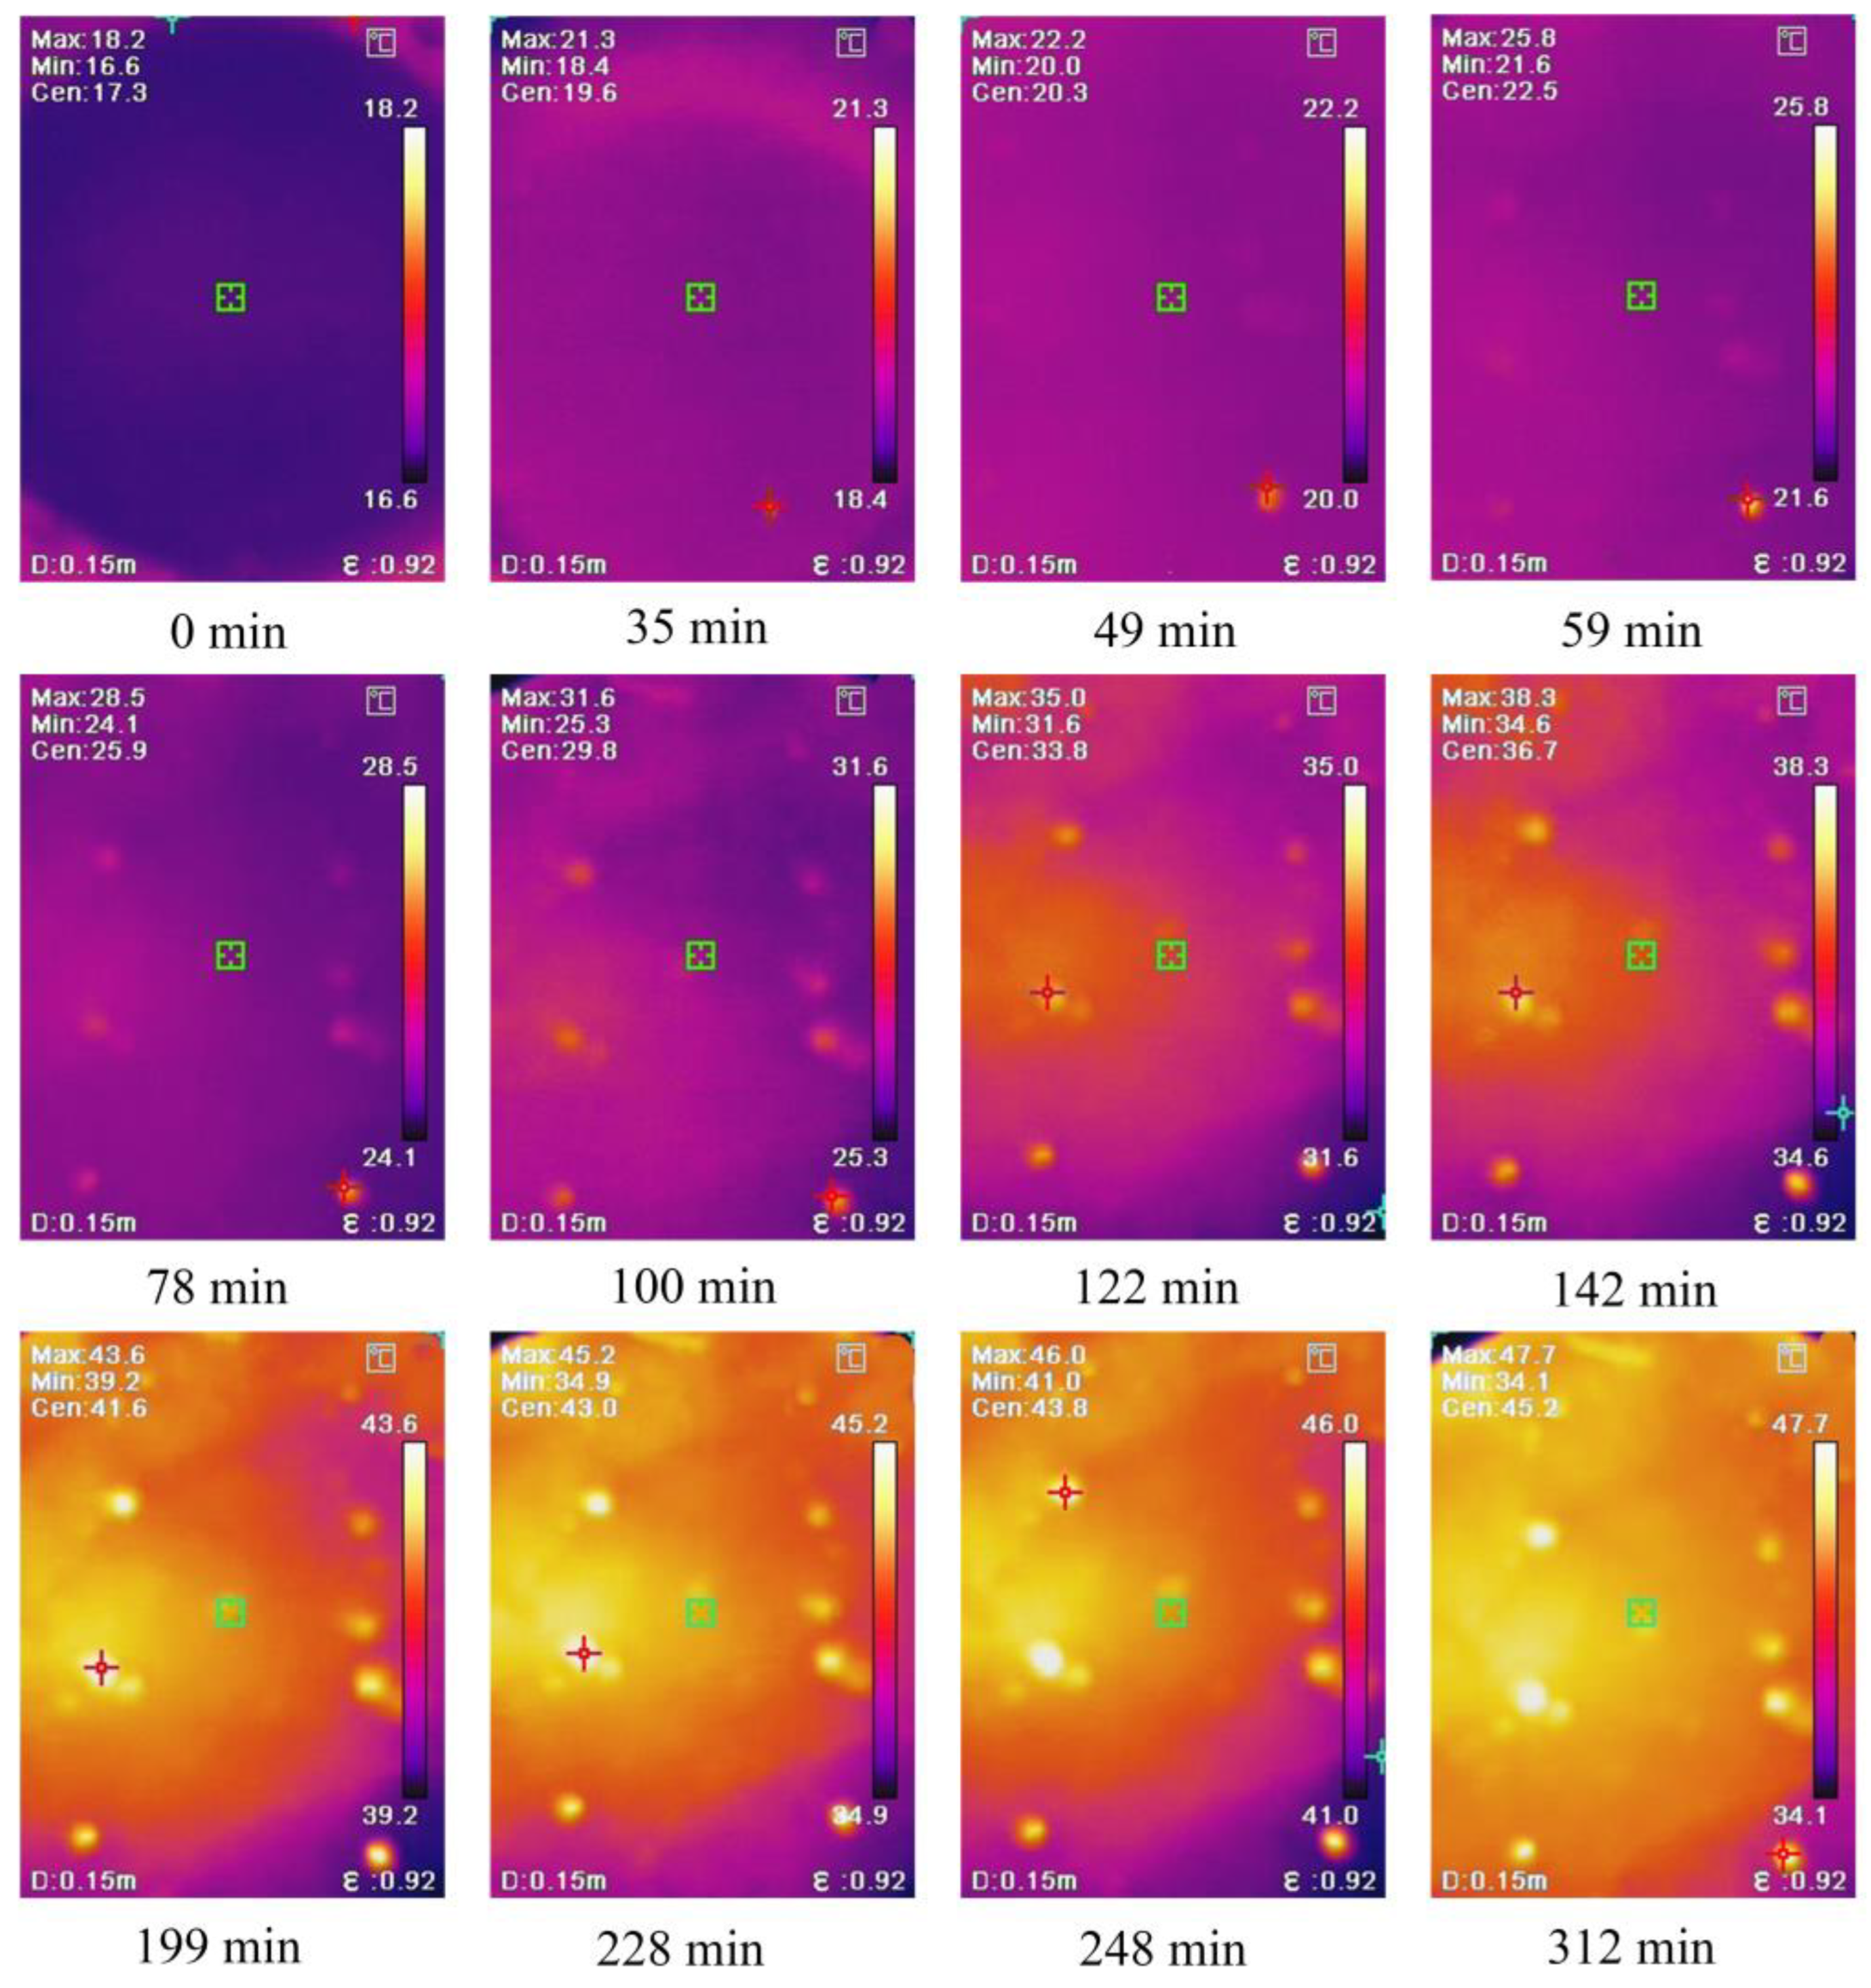
The validation test continued to follow the original heating process on the bottom surface of the Malan loess sample after perforation, and the temperature control knob was adjusted to 100 °C. The temperature change on the surface of the Malan sample was observed by the thermal imager. If the heat conduction in Malan loess is carried out along the pores first, then eight regular abnormal temperature points can be observed at the location of the perforated Malan loess surface, as shown in Figure 11. There was no abnormal temperature point on the surface of the sample at the beginning of the observation, and the temperature of the sample surface is 16.6 °C as the surrounding temperature. The temperature of the abnormal temperature point is 21.3 °C, which is higher than the temperature of other points on the surface of the sample, and the temperature of this abnormal temperature point increases until the end of the heating process. At 49 min of heating, an abnormal temperature point was observed in the borehole with a diameter of 1.5 mm, and at 59 min of heating, an abnormal temperature point was observed in the borehole with a diameter of 1 mm. During the heating process up to 78 min, an ectothermic point can be observed in the borehole with a 0.5 mm diameter. During the heating process, there were also ectothermic spots at the pore exits on the surface of the Malan loess sample itself, and the temperatures of these eight boreholes were higher than those of other spots on the sample surface during the subsequent heating process. Finally, after 300 min, the temperature on the surface of the Malan loess sample hardly changed and the whole heat transfer process stabilized.
This experiment proves that when an external temperature pressure is applied to the Malan loess, the heat transfer in the solid and gas phase media of Malan loess generally decreases in the direction of heat flow, and the heat is transferred in the pores inside the Malan loess first, and then the heat brought by the pores heats up the pore walls, thus increasing the temperature of the solid skeleton and the temperature of the whole sample. It can be found that the larger the borehole diameter is, the earlier the appearance of the abnormal temperature point is, so it can be verified that the heat conduction in the Malan loess sample is conducted along the pore space first and then the heat is transferred from the heated pore wall to the surrounding soil skeleton.

4.4.2. Analysis of Heat Conduction Experimental Results

The thermal imaging observation device of Malan loess was connected, and the surface temperature surface of the Malan loess sample was observed, and the observation results are shown in Figure 12. After measuring, the ambient temperature is 18 °C. The initial imaging process is shown as 0 min in Figure 12, the temperature of the sample surface is about 19 °C, there is no abnormal temperature point on the surface of the Malan loess sample in the initial stage, and the first abnormal temperature point is found after 45 min. Finally, the temperature of the surface of the Maran loess sample hardly changed after 128 min, and no new abnormal temperature points appeared, and the whole heat transfer process was stabilized.

4.4.3. Heat Conduction Experiment Abnormal Temperature Point Extraction

The abnormal temperature points on the surface of the Malan loess sample were extracted from the thermogram, and all the observed abnormal temperature points were projected onto the image of the intact Malan loess surface as shown in Figure 13a, and then these points were projected onto the CT scan section of the Malan loess sample surface for repositioning as shown in Figure 13b. Figure 13a shows the point distribution of the abnormal temperature points on the surface of the Malan loess sample, and Figure 13b shows the projection of the abnormal temperature points on the CT scan image. The 3D pore structure of these abnormal temperature points can be searched by the projected points on the CT scan section and the reconstructed 3D pore model. The extracted three-dimensional pore model is shown in Figure 13c. Figure 13c shows the plan view of the corresponding pore positions of these five abnormal temperature points, and Figure 13d shows the three-dimensional shapes of the five abnormal temperature points. The longest pore was 9.13 cm, the shortest pore was 2.86 cm, and the average length is 5.53 cm. The maximum pore inclination was 84°, the minimum inclination is 52°, and the average inclination was 76°. The actual length of the pore and the coordinates of the beginning and ending points of the pore were extracted from the three-dimensional pore model. The tortuosity of the pore was obtained by dividing the actual pore length by the linear distance between the two ends of the pore. The maximum tortuosity of the pore was 1.0051, the minimum tortuosity was 0.9692, the average tortuosity was 0.9886, the pores were in the form of a dendritic, and the pore was more strongly connected.

4.5. Analysis of Simulation Results

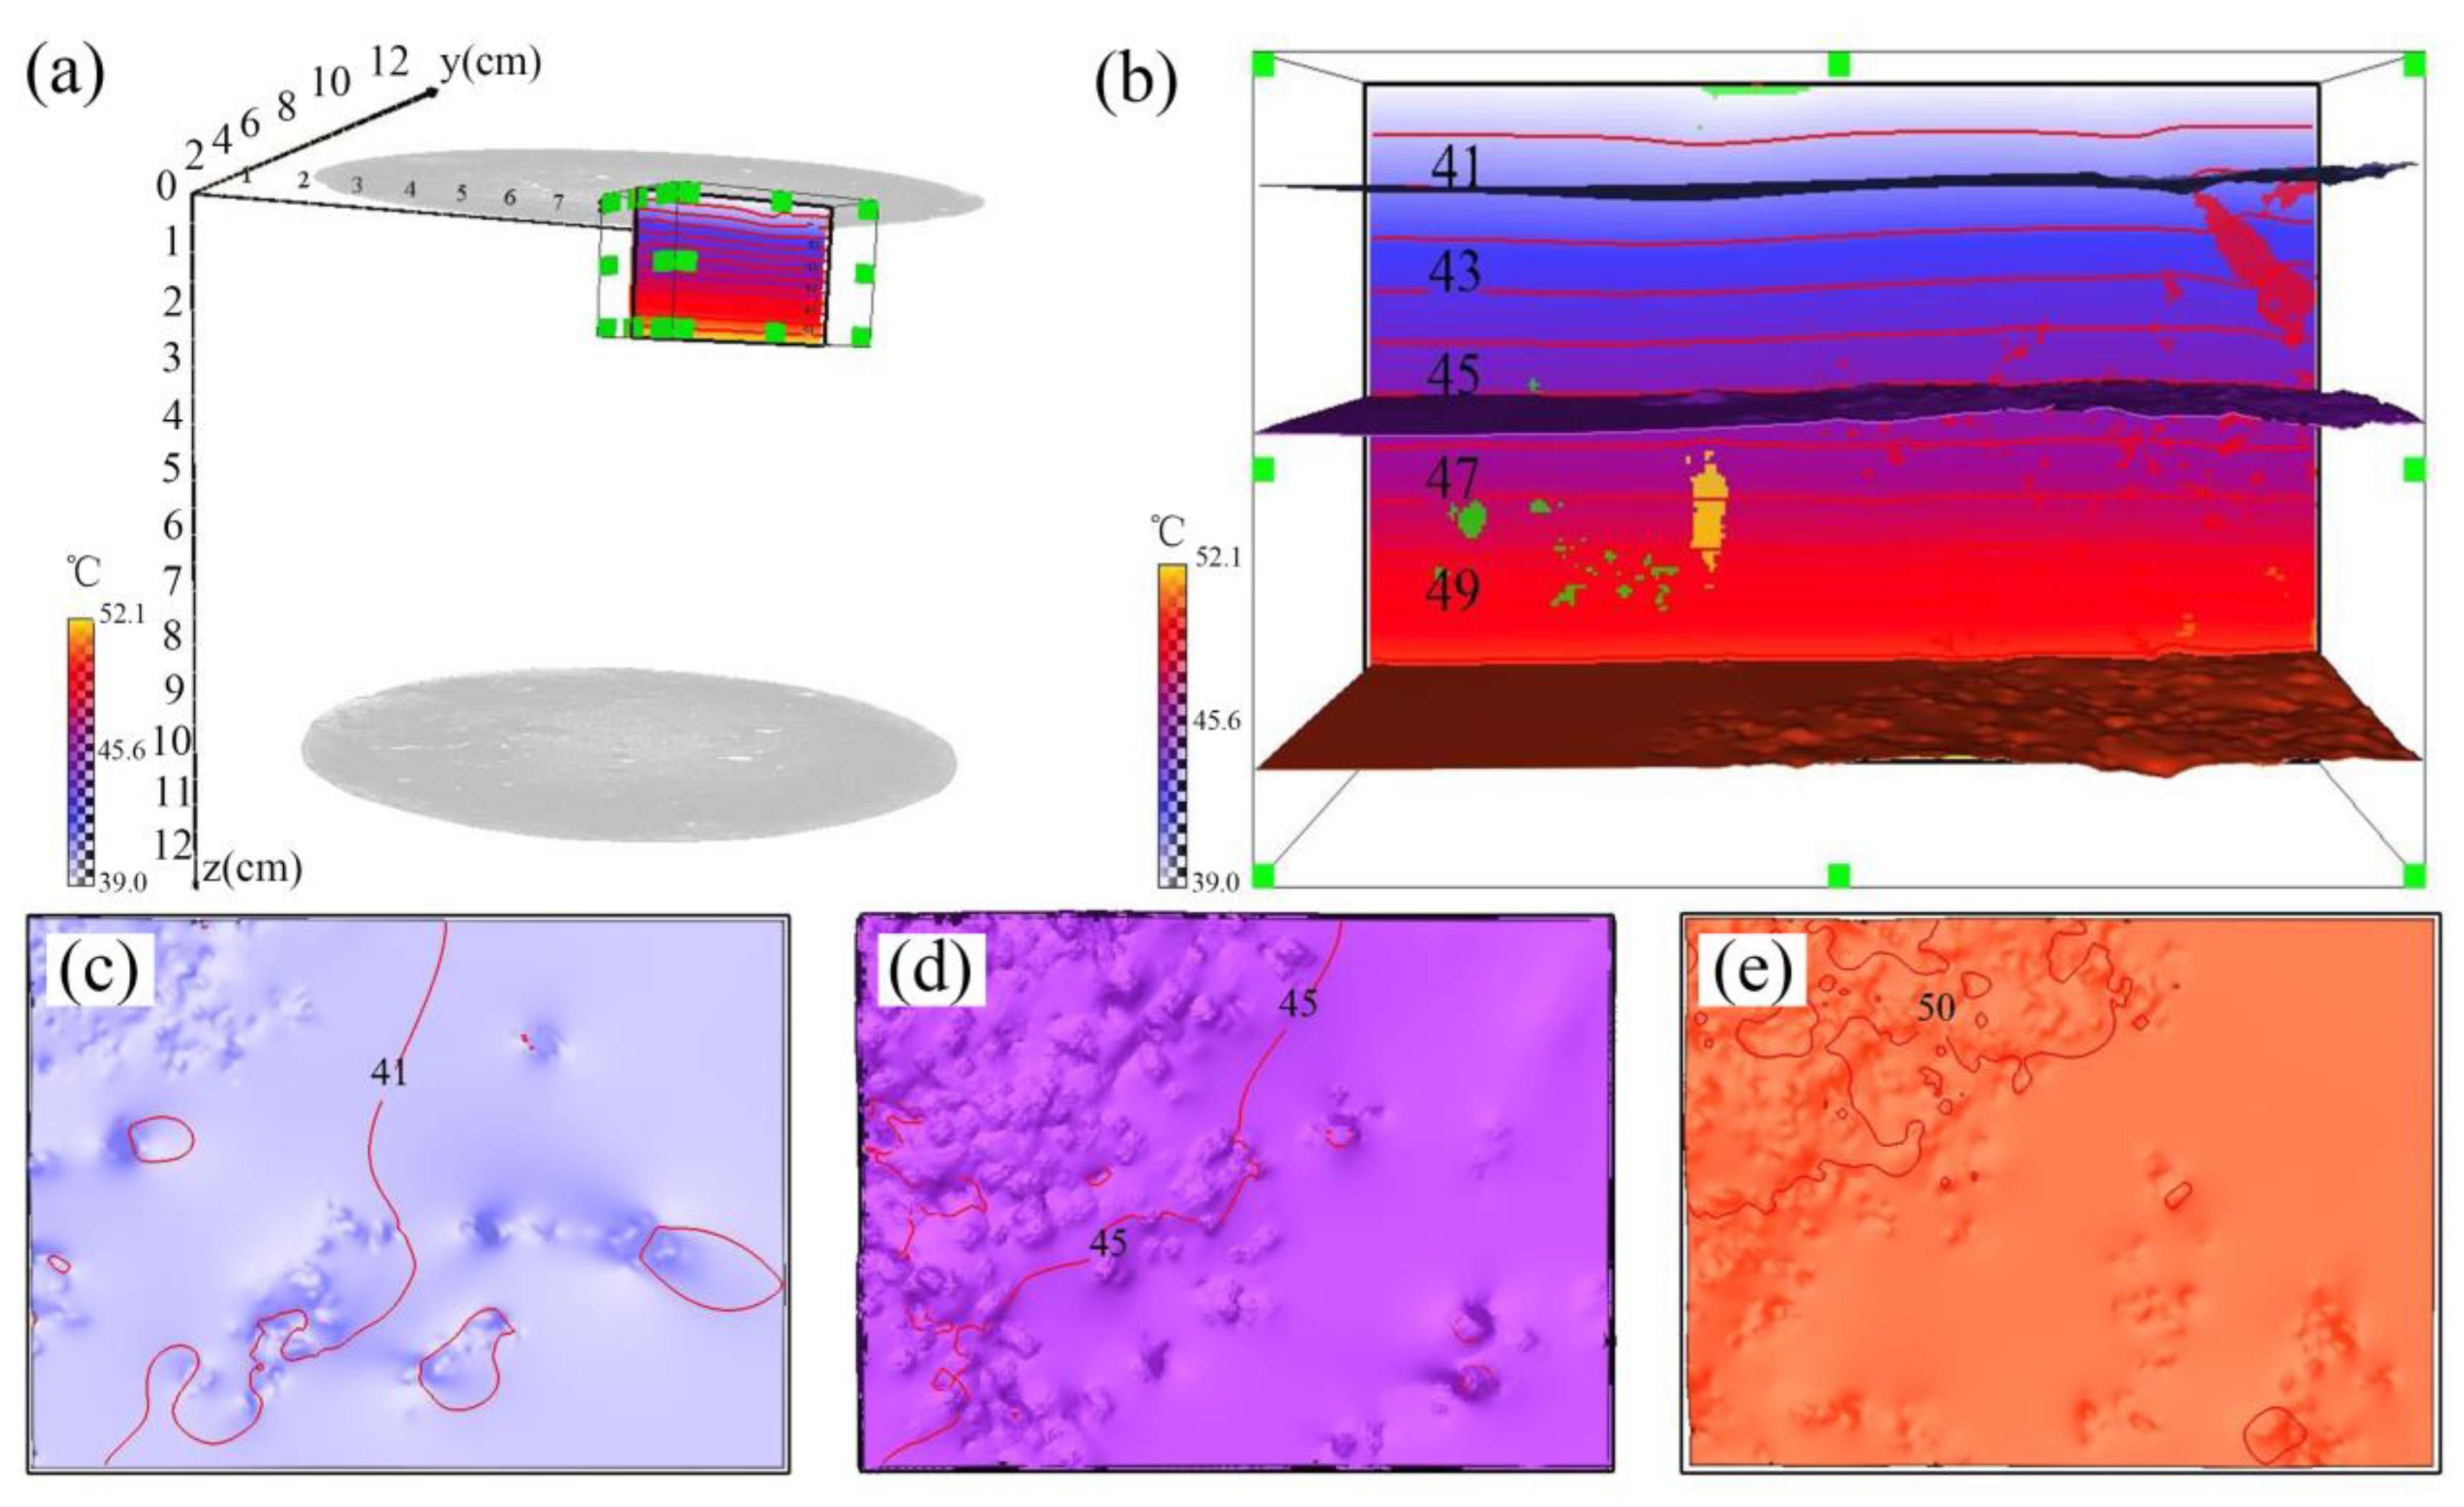
The intact Malan loess sample was a cylinder with a height of 10 cm and a diameter of 10 cm. Due to the influence of computer operation, the simulation was carried out by using the method of characterizing representative elementary volume (REV). Select a cube that can cover the abnormal temperature points, and the height of the selected cube was 3 cm. In the heat transfer experiment, the bottom input temperature was 80 °C, and the surface output temperature was stable when it was 40 °C. Assuming that the overall temperature transfer mode is linearly decreasing, the heat transfer will decrease by 4 °C every 1 cm, the heat transfer will decrease by 3 cm, and the temperature will decrease by 12 °C, as shown in Figure 14a. Therefore, the input temperature of the bottom surface of the simulation cube was set to 52 °C during the simulation. According to the ratio of the input power to the input area, the heat flux was set to 0.0002 W·m−2, and the surrounding was set to the heat insulation boundary. The thermal conductivity of the air was set to 2.59 × 10⁻² W·m−1·K−1, and the thermal conductivity of the skeleton of the intact Malan loess sample was set to 0.32 W·m−1·K−1. The simulation results are shown in Figure 14b, where the heat follows the conduction direction and the temperature decreases continuously, and the temperature varies with the pore morphology at the same level, and the heat is preferentially conducted along the pores, and then the heat is transferred to the solid skeleton particles. Among them, Figure 14c shows the 41 °C isotherm in the heat conduction process, where Figure 14d shows the 45 °C isotherm in the heat conduction process, and where Figure 14e shows the 50 °C isotherm in the heat conduction process. It can be found that the more complex the pore morphology is, the more abnormal temperature points are formed in the vertical plane along the direction of heat flow in the process of heat conduction. The temperature gradient changes less with the growth of the path in the process of vertical heat transfer in Malan loess.
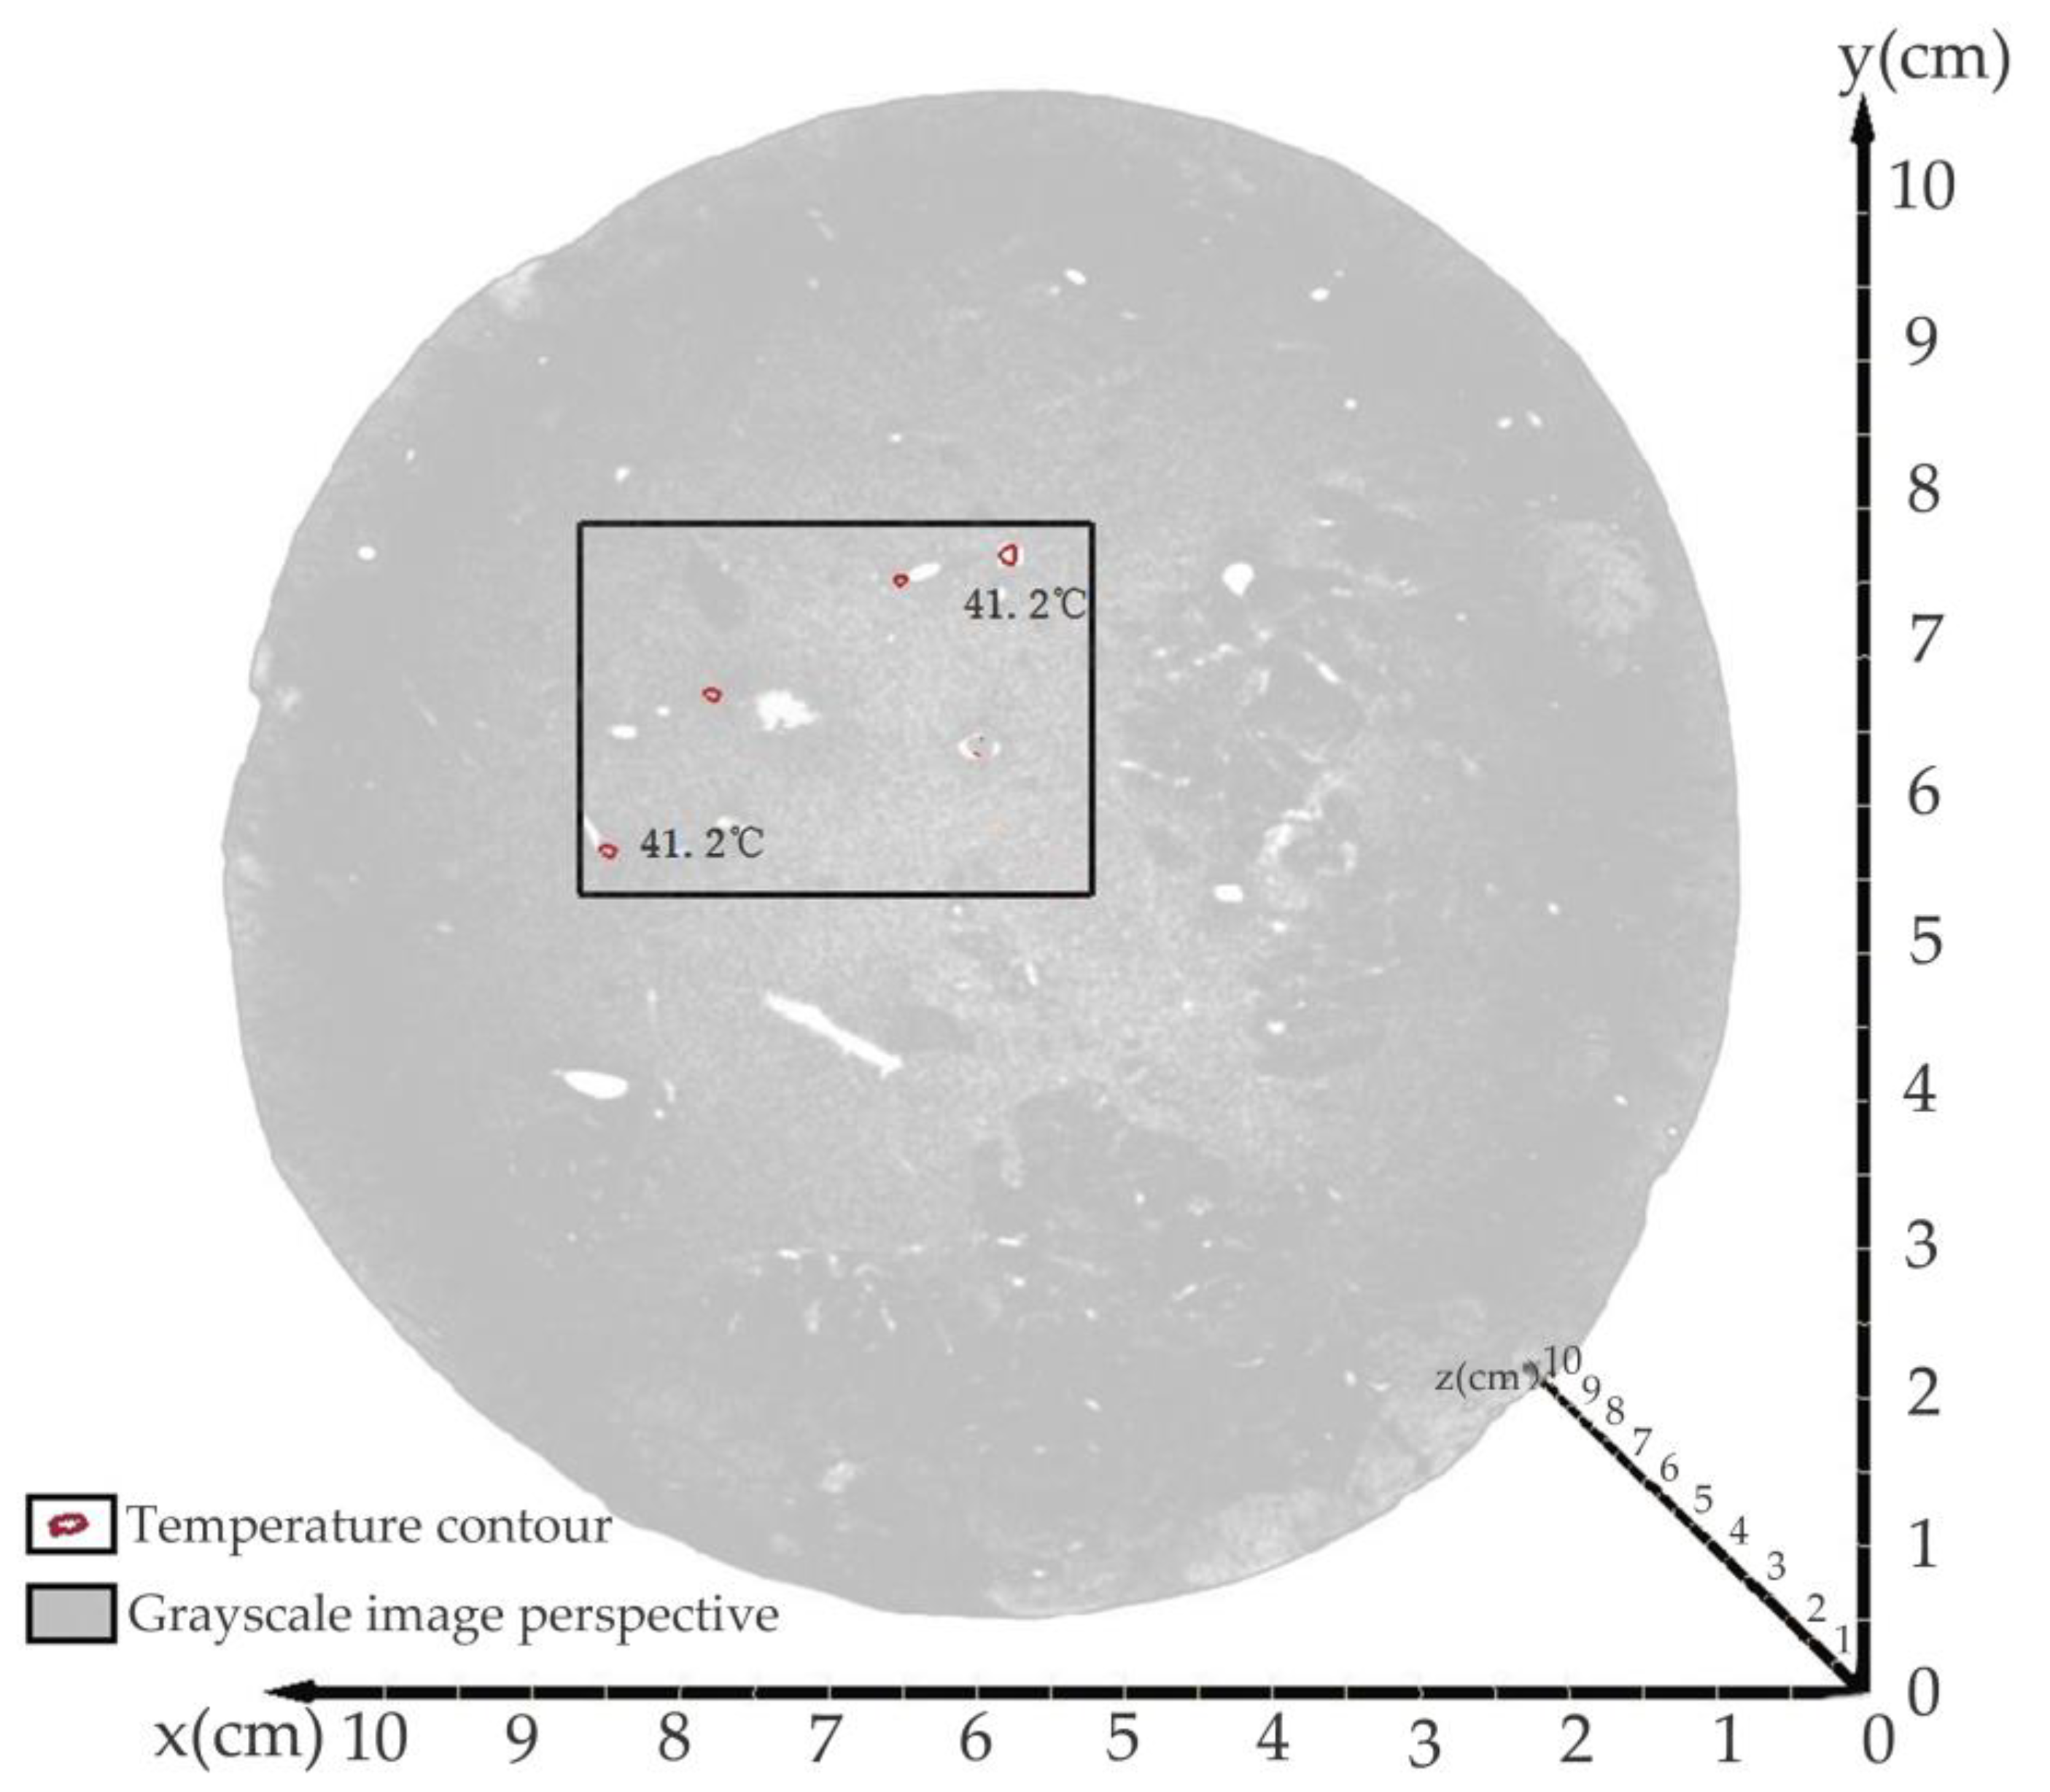
The calculated isotherm plot of 41.2 °C on the surface of the Malan loess sample after the steady state is shown in Figure 15. The red circles in Figure 15 show the distribution of abnormal temperature points on the simulated surface of the heat conduction of the intact Malan loess, which is highly consistent with the actual observed abnormal temperature points in Figure 13, which fully proves that the heat conduction of the native Malan loess starts preferentially along the pores in the process of heat conduction and then is transferred to the solid skeletal particles.

5. Discussion

In order to quantitatively characterize the macropore structure inside the intact Malan loess, a cylindrical intact Malan loess sample with a diameter of 10 cm and a height of 10 cm was scanned using industrial computed tomography, and the CT scan section was segmented using a composite segmentation method. Usually, the segmentation methods such as interactive segmentation, flood segmentation, and top-hat segmentation can segment the pores and the particle skeleton in the samples, but the principles of different segmentation methods are different, and over-segmentation or under-segmentation can occur. Therefore, the overlay of different segmentation methods should be considered to eliminate this situation due to over-segmentation or under-segmentation. In this study, we use the characteristics of flood segmentation to segment large porosity and top-hat segmentation to segment small porosity. By overlaying the mask layer, we use the large porosity segmented by flood segmentation as the base and superimpose the small porosity segmented by top-hat segmentation as the final segmented image, which can better solve the image segmentation problem. The porosity of the segmented sample is 9.116%, and the specific yield is treated as the large porosity, and this segmentation method satisfies the large porosity characteristics found in the heat transfer experiment in this study [1].
Malan loess is a porous medium with strong verticality and spatial anisotropy. In order to study the heat transfer process of Malan loess porous medium, the morphological parameters of the pore skeleton in Malan loess samples need to be extracted, and the morphological parameters of Malan loess samples were extracted by CT grayscale slices of Malan loess samples through computed tomography. The pore morphology of Malan loess samples was found to be complex, with strong pore development in the vertical direction and strong overall connectivity. In this study, only the large pores with pore sizes larger than 200 μm were focused on. A 140.349 μm resolution can meet the study requirements. In the future, more in-depth characterization of the loess structure requires more scales and higher resolution CT scans to accurately characterize the pore structure within the loess [1,2,5].
In order to study the heat transfer process of Malan loess, a non-contact thermal imager was used to observe the surface of the Malan loess sample. This observation method does not damage the pore structure of the soil and can detect the temperature of all points on the surface of the sample at the same time. However, it was found that the change in temperature on the surface of the intact Malan loess samples was not homogeneous, and a series of abnormal temperature points appeared. This phenomenon is consistent with the results of the simulation process of the particle-to-fluid heat transfer process studied by Urrutia et al. [20]. This study aimed to investigate whether the abnormal temperature points detected by the surface thermal imager of Malan loess samples are caused by the heterogeneity of the particle skeleton or by the conductivity of different media in multiphase porous media. In this study, a perforation verification experiment was designed to artificially create a series of regular pores in the Malan loess sample, and observed by a thermal imager, it was found that abnormal temperature points appeared at the contact point between the artificial regular pores and the surface of the Malan loess sample, and the temperature at the pores was higher than the temperature at the solid skeleton by about 1 °C. This verifies from the side that in the heat transfer process of Malan loess, heat is preferentially conducted along the large pores at a given temperature and pressure, and then the heat is transferred to the surrounding solid skeleton particles. This experimental method can be applied to other porous media samples, and the process of heat conduction in different porous media can be studied [12,15,16].
In the study of the heat transfer process in porous media, the conceptual model of porous media is usually generalized, but the morphological parameters of porous media in nature are very complex. In this study, CT scan sections of Malan loess samples were obtained by computerized tomography, and the pore skeleton of the Malan loess sample was reconstructed to extract the pore network model parameters of the linked pores in Malan loess samples, which provided a conceptual model for heat transfer simulation. Through heat conduction simulation, temperature anomalies appear on the surface of the selected area of the simulation, and the results of the heat conduction simulation are found to be in high agreement with the actual experimental observations. The heat conduction simulation allows the calculation of heat transfer processes in porous media with very small scales, and the soil temperature variation parameters can be calculated in the form of computer simulations for soils where soil moisture temperature sensors are not well placed [18,19].

6. Conclusions

The following conclusions can be drawn from the heat conduction simulation based on the reconstruction of the internal pores of intact Malan loess and the comparative analysis of the experimental results of heat conduction thermography of intact Malan loess.
The internal image sections of intact Malan loess samples were obtained by CT scanning, and a model of the fine-scale pore structure of Malan loess was reconstructed using these CT scanned sections. A device was designed to observe the fine-scale heat transfer in Malan loess and the thermal insulation conditions were set on the side surfaces of the cylindrical Malan loess samples. The temperature pressure was applied at the bottom of the sample, and the change in the surface temperature of the Malan loess sample was observed at the top of the sample with a thermal imager. The three-dimensional pore structure extracted by the volume averaging method combined with a CT scan was used to simulate the process of heat transfer in the solid and gas phase media of the Malan loess sample. The experimental results were compared and analyzed with the simulation results to verify the reliability of the simulation results.
By setting up the verification experiment of perforation of Malan loess heat transfer in the solid and gas medium preferentially, it can be seen through the perforation experiment that in the process of heat transfer of intact Malan loess, the heat was preferentially transferred along the large pores, and an abnormal temperature point was formed at the junction of the surface and internal pores of Malan loess, and the temperature of the jointed large pores at the surface of the sample was about 1 °C higher than that of the surrounding solid skeleton.
The simulation process of heat transfer can be performed based on the volume averaging method combined with the pore skeleton extracted by CT scanning, and the thermal conductivity can also be calculated, providing a new solution for the calculation of thermal conductivity, and the heat transfer process of small-scale Malan loess can be studied to provide parameters such as thermal conductivity for heat transfer processes that are difficult to observe at the macroscopic level.
In this thermal imaging experiment of intact Malan loess, the smallest pore diameter detected was 500 μm and the minimum error in temperature was ±0.2 °C minimum. In order to detect smaller pores, a thermal imager with higher accuracy and a CT scanning device with higher resolution can be used. If smaller-scale pore loess heat transfer studies are conducted, smaller soil samples and computers with higher computing power are required. With the future development of computer technology, the improvement of CT scanning technology and infrared thermal imaging technology, smaller sample size, smaller scale, and higher resolution soil heat transfer studies can be carried out, so that the influence of loess pore structure and loess particle skeleton on the heat transfer of loess porous media at different scales can be better studied. With the development of a simulation model of heat transfer in Malan loess at multiple scales, coupling the heat conduction properties of macro-scale Malan loess with the microstructure of Malan loess, the micro-mechanism of the heat conduction process in Malan Loess can be better understood. Future research will further explore the relationship between pore structure and heat conduction and will provide scientific basis and technical support for the optimization and application of heat transfer properties of Malan Loess as well as other porous media.

Author Contributions

Conceptualization, Y.L. (Yangchun Lu) and Y.L. (Yudong Lu); methodology, Y.L. (Yangchun Lu); software, Y.L. (Yangchun Lu); validation, Y.L. (Yangchun Lu) and Y.L. (Yudong Lu); formal analysis, Y.L. (Yangchun Lu) and T.L.; investigation, Y.L. (Yangchun Lu), T.L. and X.Z.; resources, G.Z. and B.W.; data curation, Y.L. (Yangchun Lu) and X.Z.; writing—original draft preparation, Y.L. (Yangchun Lu); writing—review and editing, Y.L. (Yangchun Lu); visualization, Y.L. (Yangchun Lu); supervision, Y.L. (Yudong Lu). All authors have read and agreed to the published version of the manuscript.

Funding

This research was funded by the National Natural Science Foundation of China (Grants No. U2243204, 41630634, 42261144749 and 41877232), and the Natural Science Foundation of Hebei Province (Grant No.: E2021210092).

Data Availability Statement

Not applicable.

Acknowledgments

The editor and reviewers are highly appreciated for providing positive and constructive comments and suggestions concerning this manuscript.

Conflicts of Interest

The authors declare no conflict of interest. The funders had no role in the design of the study; in the collection, analyses, or interpretation of data; in the writing of the manuscript; or in the decision to publish the results.

Nomenclature

φ Heat flow (W·m−2)
λ Thermal conductivity of the material (W·m−1·K−1)
TTemperature (K)
ρ c p α Heat capacity of the α phase (J·m−3·K−1)
ρ α Density of the α phase (kg·m−3)
c p α Specific heat capacity of the α phase (J·kg−1·K−1)
λ α Thermal conductivity of the α phase (W·m−1·K−1)
T α Temperature of the α phase (K)
φ t o t a l Total heat flux through the input surface (W·m−2)
S i n Area of the material in contact with the heat input surface (m2)
λ Apparent thermal conductivity of the material (W·m−1·K−1)
T i n Input temperatures (K)
T o u t Output temperatures (K)
LLength of the material sample (m)
λ α Thermal conductivity in any phase (α phase)
T α Temperature in any phase (α phase)
S i n Area of the material in contact with the heat input surface (m2)
b Considered as a perturbation of the temperature field
λ e f f Effective thermal conductivity tensor
VTotal volume of the sample (m3)
α A conduction phase
V α Volume of each conduction phase (m3)
n α β Unit normal vector at the interface from α phase to β phase

References

  1. Li, X.; Lu, Y.; Zhang, X.; Fan, W.; Lu, Y.; Pan, W. Quantification of macropores of Malan loess and the hydraulic significance on slope stability by X-ray computed tomography. Environ. Earth Sci. 2019, 78, 522. [Google Scholar] [CrossRef]
  2. Li, Y.; Mo, P.; Wang, Y.; Zhang, T.; Zhang, H. Strength anisotropy of Malan loess and the implications for the formation of loess walls and columns. Catena 2020, 194, 104809. [Google Scholar] [CrossRef]
  3. Lu, Q.; Qiao, J.; Peng, J.; Liu, Z.; Liu, C.; Tian, L.; Zhao, J. A typical Earth fissure resulting from loess collapse on the loess plateau in the Weihe Basin, China. Eng. Geol. 2019, 259, 105189. [Google Scholar] [CrossRef]
  4. Yuan, K.; Ni, W.; Lü, X.; Zhu, M.; Wang, H.; Nie, Y. Mechanical properties and microstructure evolution of Malan loess. Quat. Int. 2022, 637, 74–84. [Google Scholar] [CrossRef]
  5. Zhang, X.; Lu, Y.; Li, X.; Lu, Y.; Sun, J.; Pan, W. Multilevel Collapsibility of Loess under Irrigation in Jinya Town, Gansu Province, China. Adv. Civ. Eng. 2019, 2019, 2153679. [Google Scholar] [CrossRef] [Green Version]
  6. Lu, Y.; Lu, Y.; Lu, T.; Wang, B.; Zeng, G.; Zhang, X. Computing of Permeability Tensor and Seepage Flow Model of Intact Malan Loess by X-ray Computed Tomography. Water 2023, 15, 2851. [Google Scholar] [CrossRef]
  7. Li, Y.; Zhang, T.; Zhang, Y.; Xu, Q. Geometrical appearance and spatial arrangement of structural blocks of the Malan loess in NW China: Implications for the formation of loess columns. J. Asian Earth Sci. 2018, 158, 18–28. [Google Scholar] [CrossRef]
  8. Luo, H.; Wu, F.; Chang, J.; Xu, J. Microstructural constraints on geotechnical properties of Malan Loess: A case study from Zhaojiaan landslide in Shaanxi province, China. Eng. Geol. 2018, 236, 60–69. [Google Scholar] [CrossRef]
  9. Zhang, X.; Li, X.; Lu, Y.; Lu, Y.; Fan, W. A study on the collapse characteristics of loess based on energy spectrum superposition method. Heliyon 2023, 9. [Google Scholar] [CrossRef]
  10. Chen, Y.; Shen, C.; Lu, P.; Huang, Y. Role of pore structure on liquid flow behaviors in porous media characterized by fractal geometry. Chem. Eng. Process. Process Intensif. 2014, 87, 75–80. [Google Scholar] [CrossRef]
  11. Pia, G.; Sanna, U. Case studies on the influence of microstructure voids on thermal conductivity in fractal porous media. Case Stud. Therm. Eng. 2014, 2, 8–13. [Google Scholar] [CrossRef] [Green Version]
  12. Qin, X.; Cai, J.; Xu, P.; Dai, S.; Gan, Q. A fractal model of effective thermal conductivity for porous media with various liquid saturation. Int. J. Heat Mass Transf. 2019, 128, 1149–1156. [Google Scholar] [CrossRef]
  13. Zheng, C.; Šimůnek, J.; Zhao, Y.; Lu, Y.; Liu, X.; Shi, C.; Li, H.; Yu, L.; Zeng, Y.; Su, Z. Development of the Hydrus-1D freezing module and its application in simulating the coupled movement of water, vapor, and heat. J. Hydrol. 2021, 598, 126250. [Google Scholar] [CrossRef]
  14. To, Q.D.; Bonnet, G. Fourier transform approach to homogenization of frequency-dependent heat transfer in porous media. Int. J. Numer. Methods Heat Fluid Flow 2023, 33, 2023–2048. [Google Scholar] [CrossRef]
  15. Wang, J.; Carson, J.K.; North, M.F.; Cleland, D.J. A new approach to modelling the effective thermal conductivity of heterogeneous materials. Int. J. Heat Mass Transf. 2006, 49, 3075–3083. [Google Scholar] [CrossRef]
  16. Wang, Y.; Ma, C.; Liu, Y.; Wang, D.; Liu, J. A model for the effective thermal conductivity of moist porous building materials based on fractal theory. Int. J. Heat Mass Transf. 2018, 125, 387–399. [Google Scholar] [CrossRef]
  17. Yu, B.; Cheng, P. Fractal Models for the Effective Thermal Conductivity of Bidispersed Porous Media. J. Thermophys. Heat Transf. 2002, 16, 22–29. [Google Scholar] [CrossRef]
  18. Cheng, Q.; Tang, C.-S.; Lin, Z.-Z.; Tian, B.-G.; Shi, B. Measurement of water content at bare soil surface with infrared thermal imaging technology. J. Hydrol. 2022, 615, 128715. [Google Scholar] [CrossRef]
  19. Zhao, W.; Dong, X.; Wu, Z.; Wei, C.; Li, L.; Yu, D.; Fan, X.; Ma, Y. Using infrared thermal imaging technology to estimate the transpiration rate of citrus trees and evaluate plant water status. J. Hydrol. 2022, 615, 128671. [Google Scholar] [CrossRef]
  20. Reyes-Urrutia, A.; Venier, C.; Mariani, N.J.; Nigro, N.; Rodriguez, R.; Mazza, G. A CFD Comparative Study of Bubbling Fluidized Bed Behavior with Thermal Effects Using the Open-Source Platforms MFiX and OpenFOAM. Fluids 2021, 7, 1. [Google Scholar] [CrossRef]
  21. Kou, J.; Liu, Y.; Wu, F.; Fan, J.; Lu, H.; Xu, Y. Fractal analysis of effective thermal conductivity for three-phase (unsaturated) porous media. J. Appl. Phys. 2009, 106, 054905. [Google Scholar] [CrossRef] [Green Version]
  22. Nait-Ali, B.; Haberko, K.; Vesteghem, H.; Absi, J.; Smith, D.S. Thermal conductivity of highly porous zirconia. J. Eur. Ceram. Soc. 2006, 26, 3567–3574. [Google Scholar] [CrossRef]
  23. Raed, K.; Gross, U. Modeling of Influence of Gas Atmosphere and Pore-Size Distribution on the Effective Thermal Conductivity of Knudsen and Non-Knudsen Porous Materials. Int. J. Thermophys. 2009, 30, 1343–1356. [Google Scholar] [CrossRef]
  24. Chen, Y.-C. Non-Darcy flow stability of mixed convection in a vertical channel filled with a porous medium. Int. J. Heat Mass Transf. 2004, 47, 1257–1266. [Google Scholar] [CrossRef]
  25. Babaei, H.; McGaughey, A.J.H.; Wilmer, C.E. Effect of pore size and shape on the thermal conductivity of metal-organic frameworks. Chem. Sci. 2017, 8, 583–589. [Google Scholar] [CrossRef] [Green Version]
  26. Brzić, D.; Pešić, R.; Arsenijević, Z.; Đuriš, M.; Bošković-Vragolović, N.; Kaluđerović-Radoičić, T. Heat transfer to a sphere immersed in a fluidized bed of coarse particles with transition from bubbling to turbulent flow regime. Part. Sci. Technol. 2022, 41, 75–83. [Google Scholar] [CrossRef]
  27. Freitas, S.K.S.; Borges, R.S.; Merlini, C.; Barra, G.M.O.; Esteves, P.M. Thermal Conductivity of Covalent Organic Frameworks as a Function of Their Pore Size. J. Phys. Chem. C 2017, 121, 27247–27252. [Google Scholar] [CrossRef]
  28. Jin, H.; Zhang, M.; Shen, S. Heat Transfer around and through Multiple Porous Particles. Ind. Eng. Chem. Res. 2022, 61, 8269–8278. [Google Scholar] [CrossRef]
  29. Carmignato, S.; Dewulf, W.; Leach, R. Industrial X-Ray Computed Tomography||Applications of CT for Non-destructive Testing and Materials Characterization. Ind. X-ray Comput. Tomogr. 2018, 17, 267–331. [Google Scholar]
  30. Ivanov, A.L.; Shein, E.V.; Skvortsova, E.B. Tomography of Soil Pores: From Morphological Characteristics to Structural–Functional Assessment of Pore Space. Eurasian Soil Sci. 2019, 52, 50–57. [Google Scholar] [CrossRef]
  31. Samant, P.; Trevisi, L.; Ji, X.; Xiang, L. X-ray induced acoustic computed tomography. Photoacoustics 2020, 19, 100177. [Google Scholar] [CrossRef]
  32. Shanti, N.O.; Chan, V.W.L.; Stock, S.R.; De Carlo, F.; Thornton, K.; Faber, K.T. X-ray micro-computed tomography and tortuosity calculations of percolating pore networks. Acta Mater. 2014, 71, 126–135. [Google Scholar] [CrossRef]
  33. Zhao, Z.; Zhou, X.-P. An integrated method for 3D reconstruction model of porous geomaterials through 2D CT images. Comput. Geosci. 2019, 123, 83–94. [Google Scholar] [CrossRef]
  34. Weigand, T.M.; Schultz, P.B.; Giffen, D.H.; Farthing, M.W.; Crockett, A.; Kelley, C.T.; Gray, W.G.; Miller, C.T. Modeling Nondilute Species Transport Using the Thermodynamically Constrained Averaging Theory. Water Resour. Res. 2018, 54, 6656–6682. [Google Scholar] [CrossRef]
  35. Wood, B.D.; Valdés-Parada, F.J. Volume averaging: Local and nonlocal closures using a Green’s function approach. Adv. Water Resour. 2013, 51, 139–167. [Google Scholar] [CrossRef]
  36. Yang, C.; Huang, R.; Lin, Y.; Qiu, T. Volume averaging theory (VAT) based modeling for longitudinal mass dispersion in structured porous medium with porous particles. Chem. Eng. Res. Des. 2020, 153, 582–591. [Google Scholar] [CrossRef]
  37. Battiato, I.; Ferrero, V.P.T.; O’ Malley, D.; Miller, C.T.; Takhar, P.S.; Valdés-Parada, F.J.; Wood, B.D. Theory and Applications of Macroscale Models in Porous Media. Transp. Porous Media 2019, 130, 5–76. [Google Scholar] [CrossRef]
  38. Blunt, M.J.; Bijeljic, B.; Dong, H.; Gharbi, O.; Iglauer, S.; Mostaghimi, P.; Paluszny, A.; Pentland, C. Pore-scale imaging and modelling. Adv. Water Resour. 2013, 51, 197–216. [Google Scholar] [CrossRef] [Green Version]
  39. Bu, S.S.; Yang, J.; Zhou, M.; Li, S.Y.; Wang, Q.W.; Guo, Z.X. On contact point modifications for forced convective heat transfer analysis in a structured packed bed of spheres. Nucl. Eng. Des. 2014, 270, 21–33. [Google Scholar] [CrossRef]
  40. Huo, A.; Wang, X.; Zhao, Z.; Yang, L.; Zhong, F.; Zheng, C.; Gao, N. Risk Assessment of Heavy Metal Pollution in Farmland Soils at the Northern Foot of the Qinling Mountains, China. Int. J. Environ. Res. Public Health 2022, 19, 14962. [Google Scholar] [CrossRef]
  41. Huo, A.; Yang, L.; Luo, P.; Cheng, Y.; Peng, J.; Nover, D. Influence of landfill and land use scenario on runoff, evapotranspiration, and sediment yield over the Chinese Loess Plateau. Ecol. Indic. 2021, 121, 107208. [Google Scholar] [CrossRef]
  42. Huo, A.; Zhao, Z.; Luo, P.; Zheng, C.; Peng, J.; Abuarab, M.E.L.S. Assessment of Spatial Heterogeneity of Soil Moisture in the Critical Zone of Gully Consolidation and Highland Protection. Water 2022, 14, 3674. [Google Scholar] [CrossRef]
  43. Baveye, P.; Sposito, G. The Operational Significance of the Continuum Hypothesis in the Theory of Water Movement through Soils and Aquifers. Water Resour Res. 1984, 20, 521–530. [Google Scholar] [CrossRef]
  44. Quintard, M.; Kaviany, M.; Whitaker, S. Two-medium treatment of heat transfer in porous media: Numerical results for effective properties. Adv. Water Resour. 1997, 20, 77–94. [Google Scholar] [CrossRef]
  45. Quintard, M.; Whitaker, S. Convection, dispersion, and interfacial transport of contaminants: Homogeneous porous media. Adv Water Resour. 1994, 17, 221–239. [Google Scholar] [CrossRef]
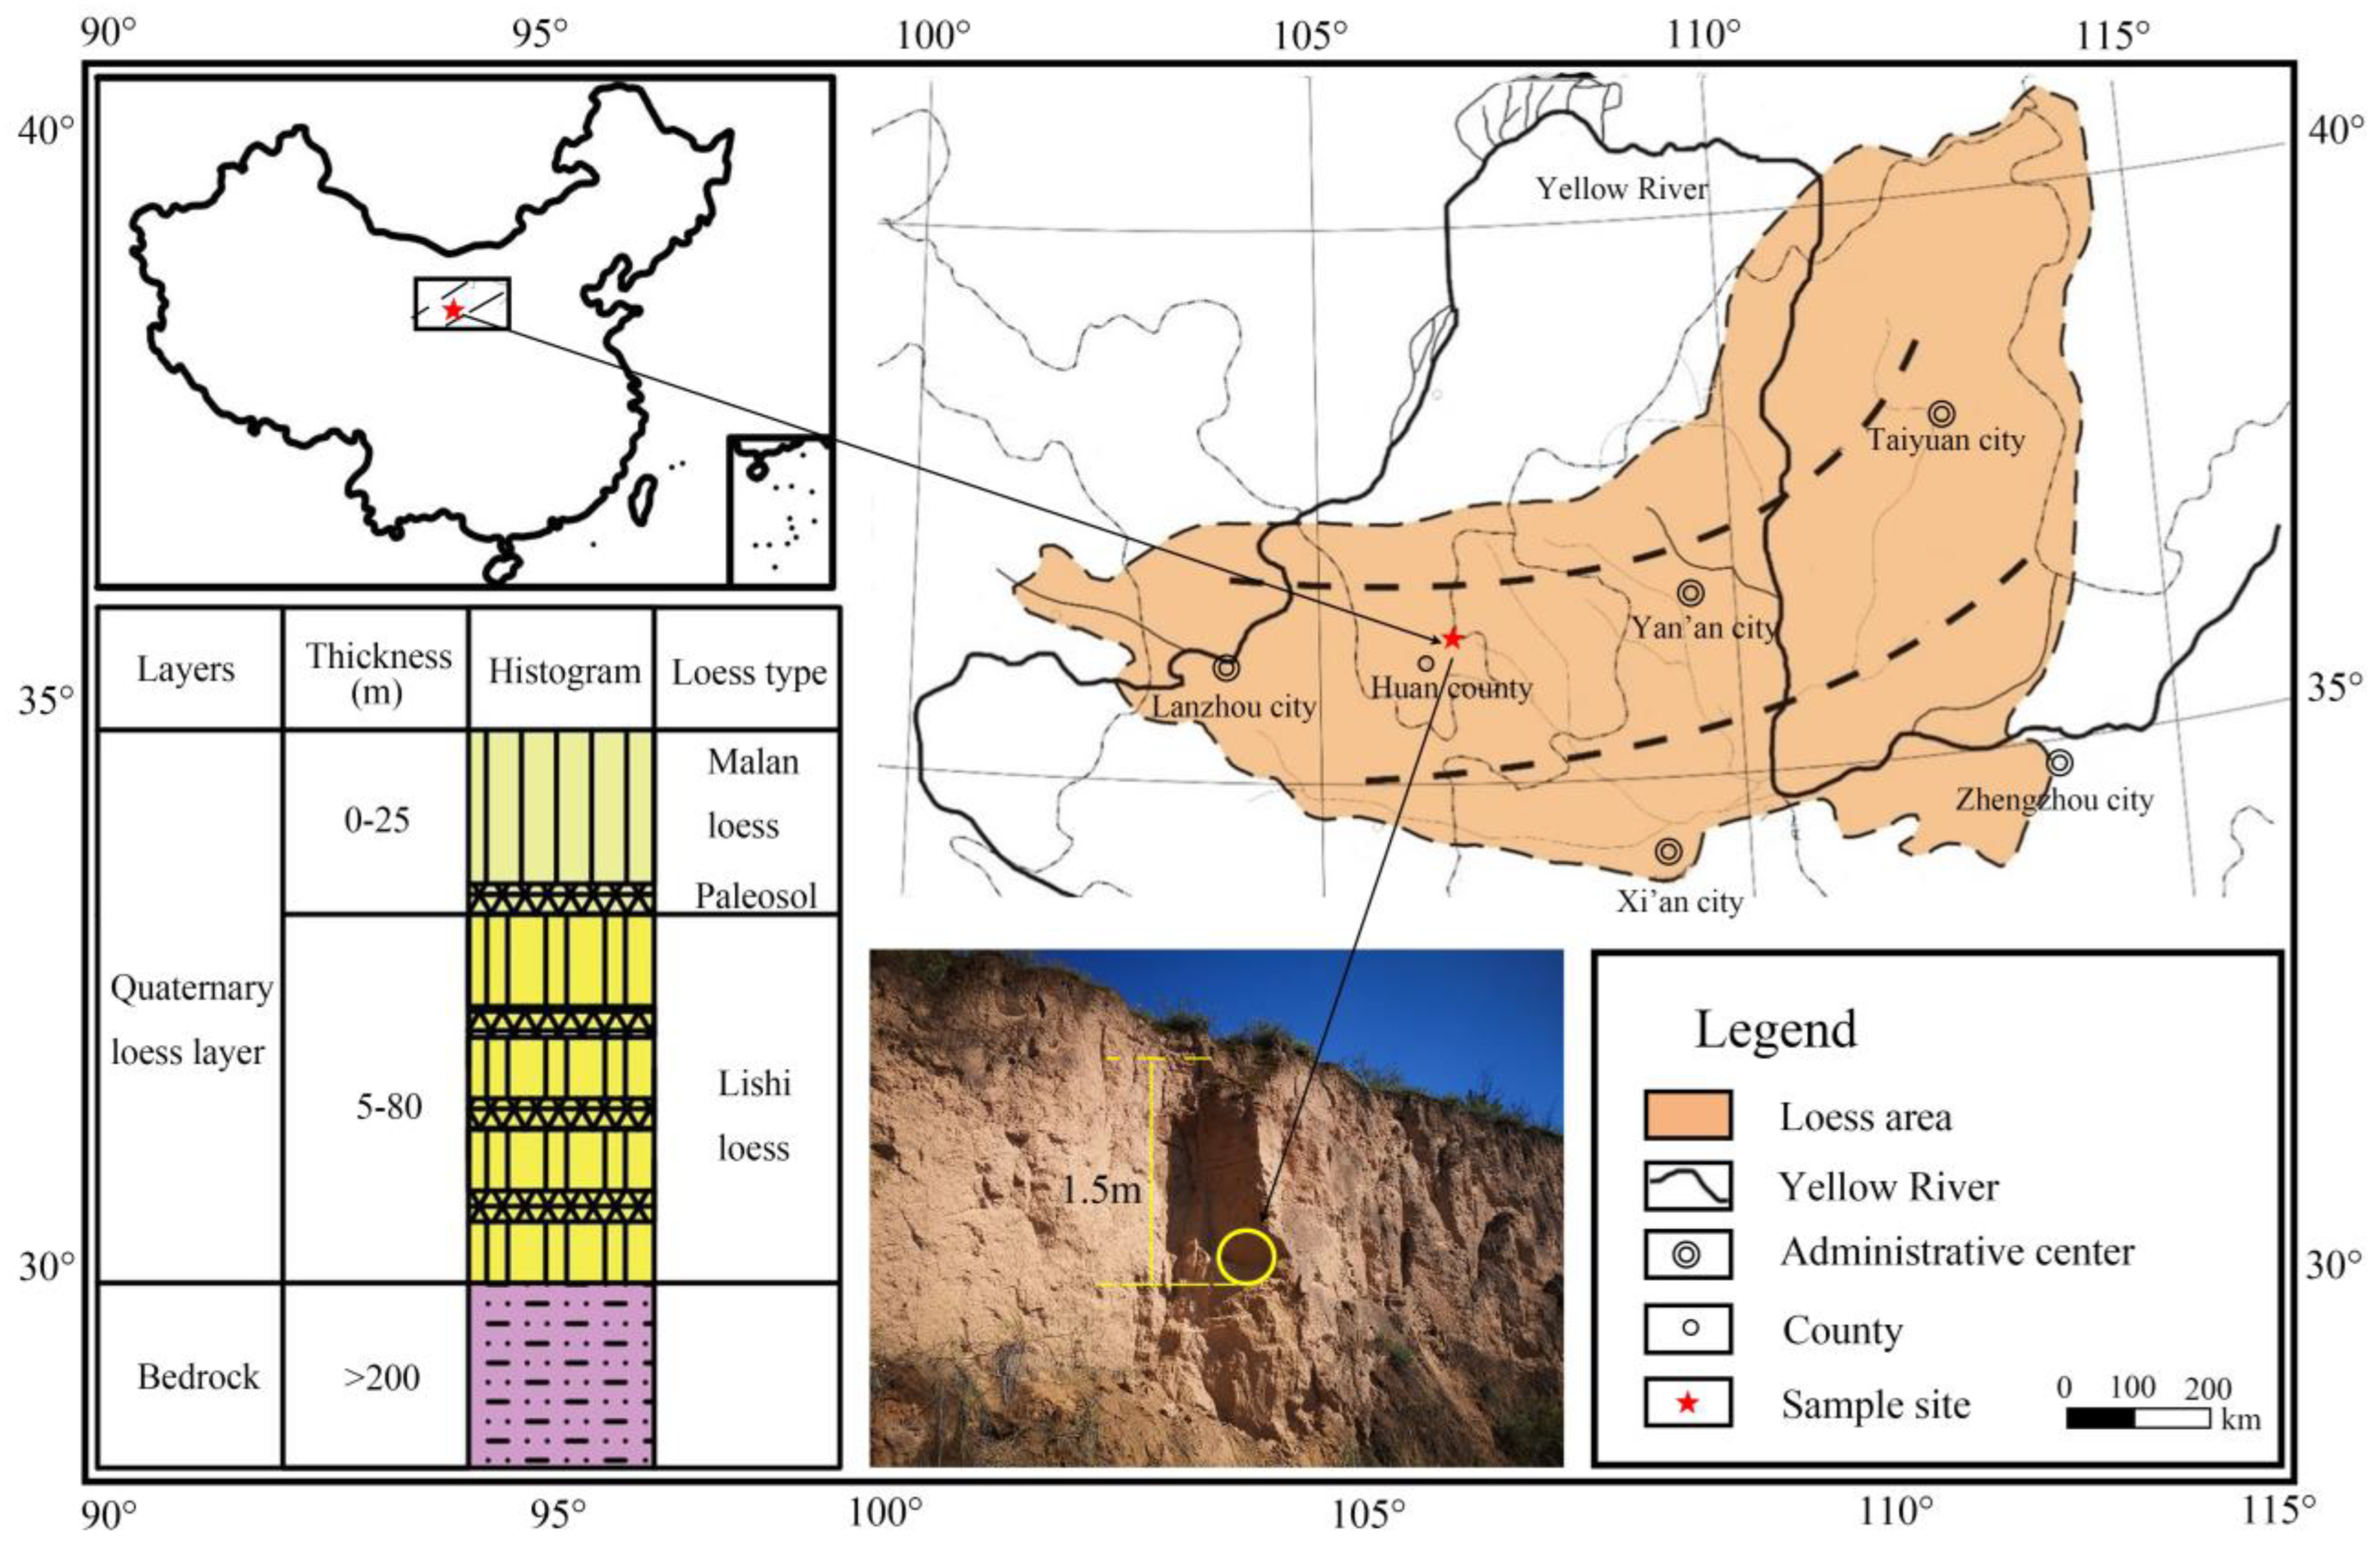
Figure 1. Location map of sampling points. (The yellow circle is the sampling position on the field section of Malan Loess).
Sustainability 15 12389 g001
Figure 2. (a) Overlay of CT scan sections of intact Malan loess; (b) 3D model of reconstructed Malan loess sample.
Sustainability 15 12389 g002
Figure 3. Schematic diagram of thermal imaging experiment: 1 is the power supply, 2 is the temperature control knob, 3 is the silica gel heating plate, 4 is the PVC fixing tube, 5 is the foam adhesive, 6 is the original cylindrical Malan loess, 7 is the infrared thermal imaging camera, 8 is the bracket, and 9 is the computer.
Sustainability 15 12389 g003
Figure 4. Schematic diagram of sample perforation. (a) The distribution of the artificial holes in the plane; (b) The perspective view of the artificial holes.
Sustainability 15 12389 g004
Figure 5. (a) Original CT scan section; (b) sample contour obtained after interactive segmentation of the original section; (c) sample internal pore filling; (d) mask layer; (e) flood segmentation; (f) top-hat segmentation; (g) flood segmented pores superimposed with mask layer; (h) top-hat segmented pores superimposed with mask layer; (i) g image and h image overlay; (j) pore space after splitting; (k) pore analysis.
Sustainability 15 12389 g005
Figure 6. Schematic diagram of the selection of the volume of the characterization unit.
Sustainability 15 12389 g006
Figure 7. Porosity versus cube side length.
Sustainability 15 12389 g007
Figure 8. Pore network model.
Sustainability 15 12389 g008
Figure 9. Pore and pore throat distribution characteristics.
Sustainability 15 12389 g009
Figure 10. Distribution of pore coordination number.
Sustainability 15 12389 g010
Figure 11. Thermal imaging of the surface of the perforation experiment.
Sustainability 15 12389 g011
Figure 12. Thermal imaging of Malan loess surface.
Sustainability 15 12389 g012
Figure 13. Sample surface abnormal temperature point localization. (a) The abnormal temperature points were projected onto the image of the intact Malan loess surface; (b) The abnormal temperature points on the CT scan image; (c) The corresponding pore positions of these five abnormal temperature points; (d) The three-dimensional shapes of the five abnormal temperature points.
Sustainability 15 12389 g013
Figure 14. Simulation results of heat transfer simulation. (a) Three-dimensional simulation model; (b) The simulation results; (c) The 41 °C isotherm in the heat conduction process; (d) The 45 °C isotherm in the heat conduction process; (e) The 50 °C isotherm in the heat conduction process.
Sustainability 15 12389 g014
Figure 15. Heat conduction simulation results in surface abnormal temperature points.
Sustainability 15 12389 g015
Table 1. Basic physical properties of Malan loess samples.
Dry Density
(g/cm3)
Void RatioClay (%)
(d < 5 μm)
Silt (%)
(5 < d < 50 μm)
Sand (%)
(d > 50 μm)
Liquid LimitPlastic LimitPlastic IndexPermeability Coefficient K
(cm/s)
1.2191.189.4661.0729.7411.5%8%11.83%1.38 × 10⁻⁴
Disclaimer/Publisher’s Note: The statements, opinions and data contained in all publications are solely those of the individual author(s) and contributor(s) and not of MDPI and/or the editor(s). MDPI and/or the editor(s) disclaim responsibility for any injury to people or property resulting from any ideas, methods, instructions or products referred to in the content.