Article

Spatiotemporal Variation in the Coupling Relationship between Human Activities and Soil Erosion—A Case Study in the Weihe River Basin

1
School of Water and Environment, Chang’an University, Xi’an 710054, China
2
Key Laboratory of Subsurface Hydrology and Ecological Effects in Arid Region, Ministry of Education, Chang’an University, Xi’an 710054, China
3
Key Laboratory of Mine Geological Hazards Mechanism and Control, Ministry of Natural Resources, Xi’an 710054, China
4
College of Geological Engineering and Geomatics, Chang’an University, Xi’an 710054, China
5
Agricultural Engineering Department, Faculty of Agriculture, Mansoura University, Mansoura 35516, Egypt
6
Agricultural Engineering Department, Faculty of Agriculture, Cairo University, Giza 12613, Egypt
7
Soil Science Department, Faculty of Agriculture, Zagazig University, Zagazig 44519, Egypt
*
Author to whom correspondence should be addressed.
Sustainability 2023, 15(14), 10785; https://doi.org/10.3390/su151410785
Submission received: 16 June 2023 / Revised: 6 July 2023 / Accepted: 8 July 2023 / Published: 10 July 2023
(This article belongs to the Special Issue Geological Environment Monitoring and Early Warning Systems)

Abstract

:
Studying the relationship between human activities and soil erosion on a regional scale is of great significance for macro-decision-making in soil erosion prevention and control. The entropy weight method and RUSLE model are used to analyze the spatiotemporal variation in human activity intensity (HAI) and soil erosion in the Weihe River Basin (WRB) from 2005 to 2020. Through geographic detectors and a four-quadrant model, the impact of various driving factors and the coupling degree of the human–land relationship are studied. The results showed: (1) During the past 15 years, the moderate, high, strong, and severe erosion areas in the WRB decreased by 9.88%, 35.89%, 45.17%, and 70.05%, respectively. The ratio of the historical sand transport modulus to the RUSLE model result is 0.83, indicating that the results obtained by the RUSLE model can be used for further analysis. (2) Slight and weak degrees account for 80% in the northwest region. The high and strong regions are mainly distributed in the Shaanxi section, accounting for 3% of the total basin. (3) The coupling between human activities and soil erosion is constantly strengthening, and the joint effect of pop and crop is the main reason for the slowdown and spatial differences in soil erosion. This indicates that the ecological environment became stable. These findings contribute by acting as references for soil and water conservation and management in the WRB to promote a harmonious relationship between humans and the environment.

1. Introduction

The human–land relationship is defined as the relationship between the survival and development of human society or human activities and the geographical environment [1]. In recent years, there has been a great shift in research focus to the coordinated and sustainable relationship between human beings and the living environment from land-use change and assessment [2,3]. Soil erosion is one of the major environmental problems causing worldwide soil degradation and crop yield reduction, which seriously threatens the sustainable development of society and the environment [4]. Changes in soil erosion are generally considered to be the result of a combination of natural factors and human activities. However, the effects of natural factors are generally long-lasting, while the effects of human activities are visible for a short period of time. With the enhancement of human activities and the expansion of their scope, human activities have gradually become the key factor leading to the change in soil erosion [5,6]. Research on the relationship between human activities and soil erosion changes and their spatiotemporal differentiation at a regional scale is of great significance for macroplanning of soil erosion prevention and control [7,8,9]. The research on the relationship between human activities and soil erosion changes and their spatiotemporal differences is a scientific issue to be solved urgently in current soil erosion research.
In the past 20 years, most of the research on soil erosion has focused on the spatial variability of soil erosion under the background of land-use or landscape pattern changes or on the use of models such as InVEST, SWAT, RUSLE, etc., to assess spatial and temporal changes in soil erosion [10,11,12]. For example, Zhang et al. [13] discussed the impact of land disturbance and restoration on runoff and sediment yield by comparing six temporary land protection measures. Xu et al. [14] analyzed the spatiotemporal evolution and susceptibility map of soil erosion on the Loess Plateau by using statistical methods and frequency ratio models through field investigations. Zhang et al. [3] evaluated soil erosion for different land-use types in each sub-basin of the Liusha River Basin based on the SWAT model. Li et al. [15] used the InVEST model to explore the spatial distribution characteristics of soil erosion intensity in Anxi County. However, it is not enough to only emphasize the impact of land-use change while ignoring socio-economic factors, or to only focus on the effects of different human activity factors and ignore spatial heterogeneity in the study of the human–land relationship as it affects soil erosion.
The relationships between human activities and soil erosion are closely bonded and complex, and these relationships can vary depending on the natural environment and human factors in the region [16]. It is found that human activities act on soil erosion in various ways, with complex processes and intensities, and the behavior is difficult to predict. Jia et al. [17] explored the effects of natural and socio-economic factors on soil erosion in the Weihe River Basin using a geodesic probe. Li et al. [18] used multisource data to decouple the causes of soil erosion in South China, and obtained the relative contribution of climate change and human activities. Wang et al. [19] used the coupled coordination degree model to evaluate the coupling coordination level between population demand, agricultural production, and soil erosion in 281 cities in China from 1995 to 2010, as well as the impact of socio-economic factors. However, the spatialization of human activities on soil erosion has not been reflected. The four-quadrant model can be used to indicate the interaction strength and correlation degree of factors from two dimensions [16]. It was originally used to analyze changes in the real estate market, but with the integration and development of other disciplines, it has been widely applied in multiple fields, such as culture and tourism, mining and agricultural ecology, human activities, and ecosystem services [20]. Research has shown that the four-quadrant model is suitable for the interaction between two subsystems. By quantifying the spatial distribution of human activities and soil erosion, the human–land relationship of soil erosion can be intuitively analyzed, and the areas that need to be controlled can be identified, providing targeted reference for soil and water conservation policies and work.
As the largest first-level tributary of the Yellow River Basin, the WRB undertakes an important ecosystem service function and plays a critical role in maintaining the ecological balance and social and economic development in Northwest China [21]. However, rapid urbanization and industrialization have increased the pressure on the ecological environment of the WRB, exposing it to serious problems of soil erosion and ecological degradation [22]). Several studies have revealed an improvement trend in vegetation and a good ecological transition in the WRB from 2000 to 2014 [23,24]. However, the spatiotemporal coupling between human activities and soil erosion changes should be strengthened, especially over different spaces. The human activity factors considered in such studies are relatively single, so the results are often more accurate. However, the effects of human activities on soil erosion are complex and diverse, and it is difficult to comprehensively investigate the patterns of human activities on a regional scale. In addition, research on the use of socio-economic statistical data to characterize human activities and analyze their relationship to soil erosion and spatiotemporal heterogeneity under the support of 3S technology has also made corresponding progress. Such studies often use regression models to measure the impact of soil erosion changes and human activities. However, socio-economic statistical data are limited by administrative units, and the representation of human activities is insufficient in terms of comprehensiveness and temporal and spatial details.
In this study, remote sensing and GIS technology were used as follows: (1) to integrate socio-economic data, land-use data, and topographic data; (2) to construct the human activity degree index at the raster level; (3) to simulate the soil erosion modulus in the study area using the RUSLE model; (4) to quantitatively analyze the relationship between soil erosion changes and human activity degree in the Weihe River Basin at the raster scale; and (5) to analyze the driving mechanism of human activities on soil erosion from multiple perspectives, such as population change, GDP, and land-use pattern change. On the basis of traditional research, we spatialized the relationship between human activities and soil erosion. We used a four-quadrant model to identify the spatiotemporal evolution characteristics of the coupling relationship between HAI and soil erosion, and provided targeted suggestions for controlling soil erosion in areas that need to be controlled. The main content is reflected in three aspects: (1) the quantification of the spatiotemporal variation characteristics of HAI in the WRB; (2) the clarification of the spatiotemporal changes in soil erosion in the WRB from 2005 to 2020, and the use of geographic detectors to analyze driving factors; and (3) the evaluation of the relationship between HAI and soil erosion in the WRB using a four-quadrant model, and the proposal of targeted recommendations for regional water and soil conservation. The results offer recommendations for soil and water conservation management and ecological sustainable development in the WRB.

2. Materials and Methodology
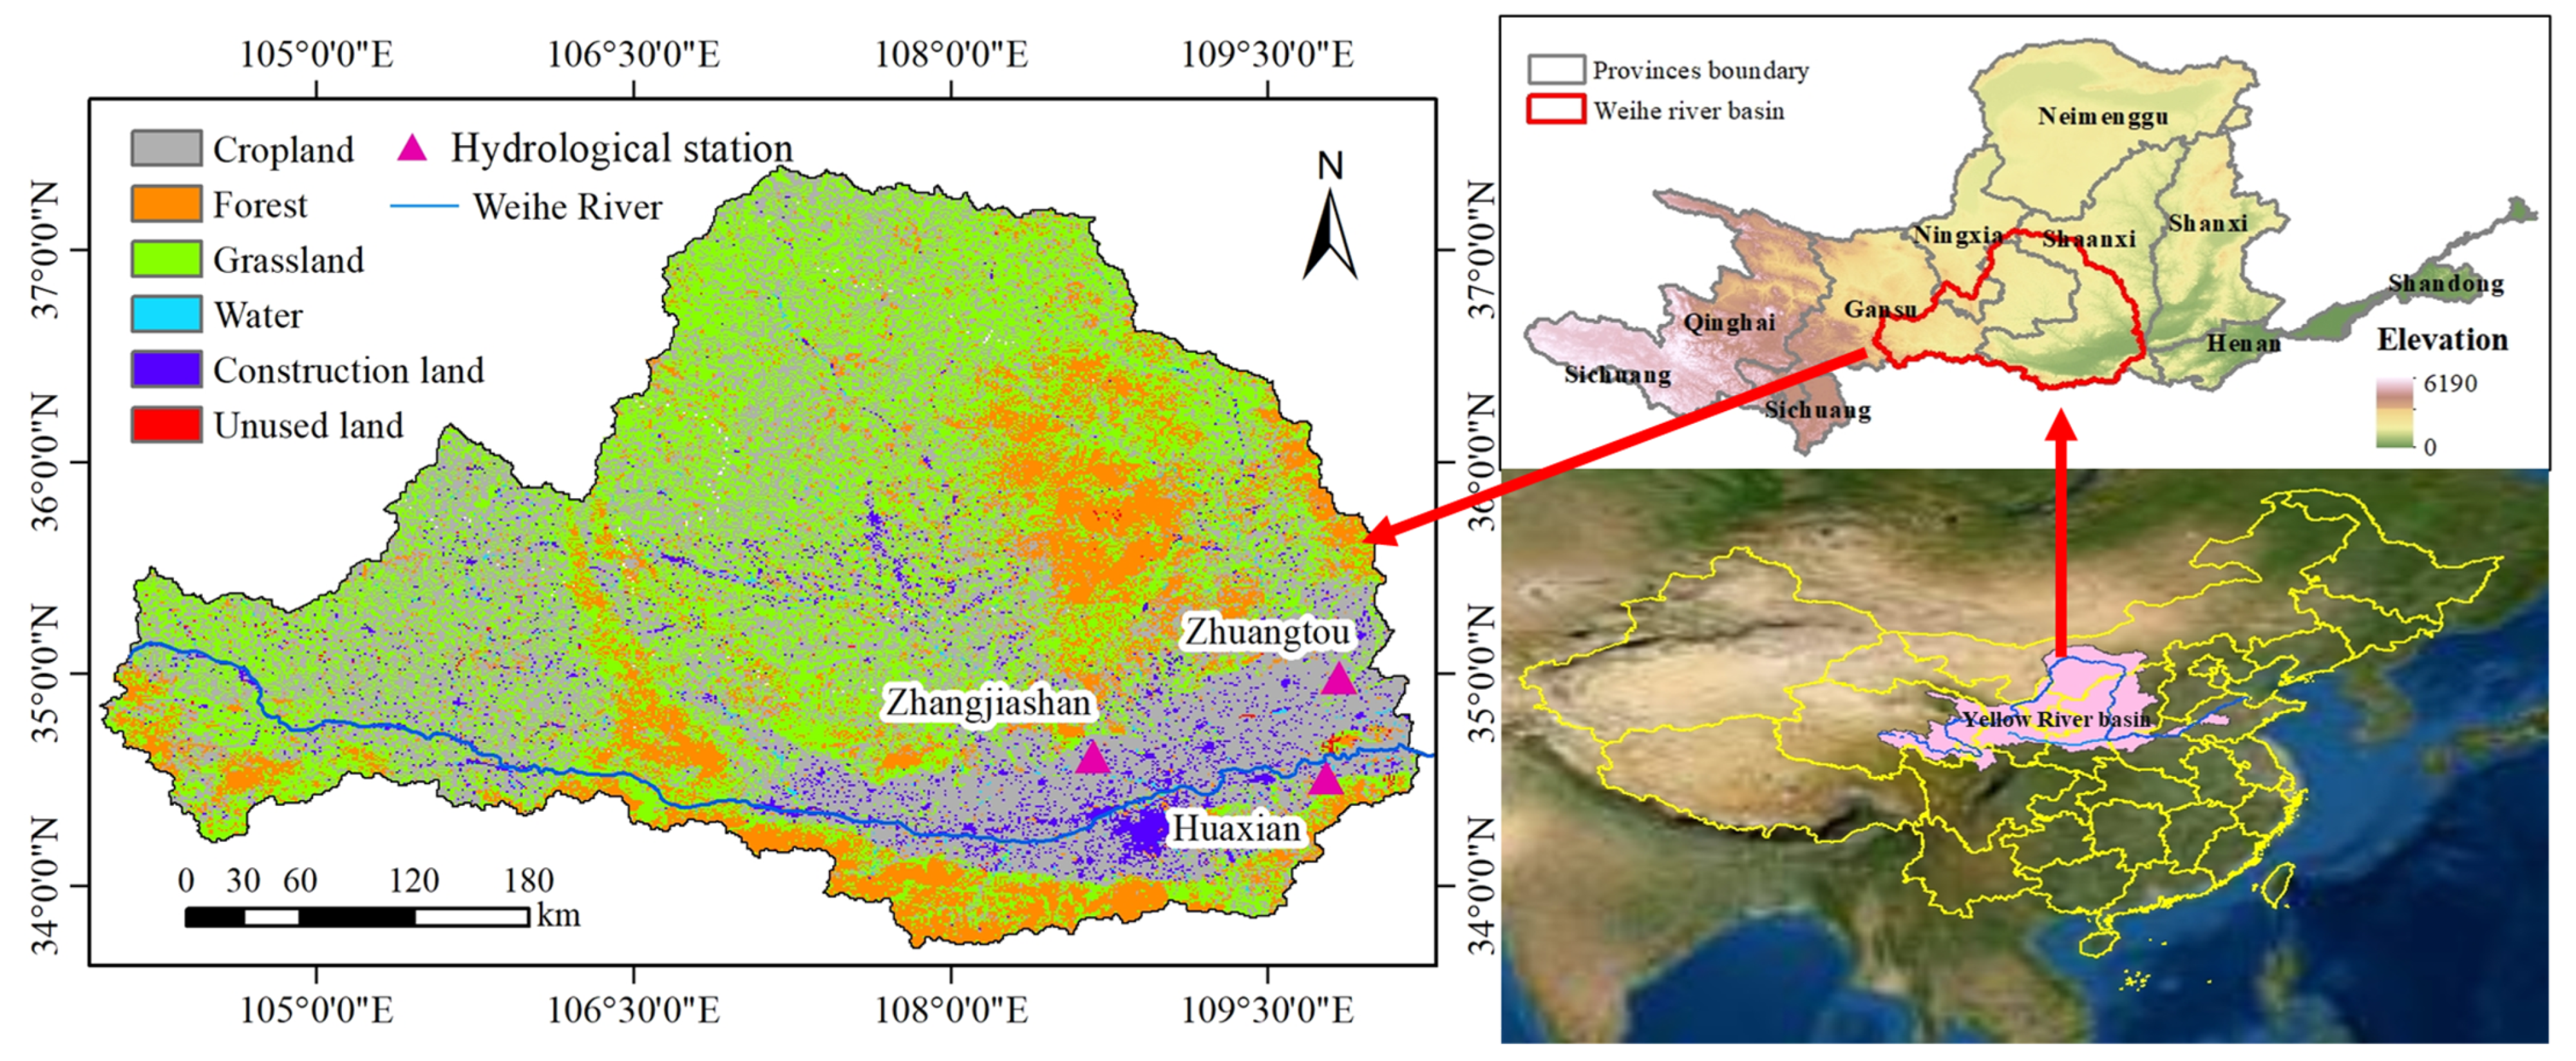
2.1. Study Area

The Weihe River belongs to the largest tributary of the Yellow River, with a total length of 818 km and a total basin area of about 1.35 × 10⁵ km2 (103°05′–110°05′ E, 33°50′–37°05′ N) [17]. The WRB spans 84 counties in Shaanxi Province, Gansu Province, and Ningxia Hui Autonomous Region, of which the Shaanxi, Gansu, and Ningxia sections account for 49.8%, 44.1%, and 6.1%, respectively (Figure 1). There are many geomorphic types in the basin, including the North Shaanxi, Longdong Eastern Loess Plateau, Qinling Mountains, and Weihe Valley. The region has a continental monsoon climate with an average annual precipitation of 500 to 800 mm and an average annual temperature of 7.8 to 13.5 °C [21]. The WRB is not only an essential strategic highland in the economic field in the western region of China but also a major industrial, agricultural, and energy base in China; it is also the location of an equally important transportation hub in the western region of China. However, due to its long history of indiscriminate logging, the ecology of the watershed has been damaged, resulting in the Weihe River becoming an important source of sediment for the Yellow River [23].

2.2. Data Sources

Table 1 displays a detailed description of the data sources, and the access date of the data is 1 March 2023. The data were all uniformly resampled to 1 km before use in this study to make the data additive.

2.3. Research Methodology

The RUSLE model was used to calculate soil erosion in the WRB. Four human activity influencing factors including night lighting, population density, GDP density, and the proportion of cultivated land, were selected to quantify the HAI in the WRB, and the driving factors affecting soil erosion were analyzed using a geographic detector. On this premise, a four-quadrant model of HAI and soil erosion was established to spatialize the coupling relationship between HAI and soil erosion. The research method is reported in the following subsections.

2.3.1. RUSLE Model

The RUSLE model is a modified version of the general soil erosion model, with a broader range of applications based on the USLE modification of the general soil erosion model [25]). The expression of the model is as follows:
A = R × K × L × S × C × P
where A is the soil erosion amount in t·km−2·a−1; R is the rainfall erosivity factor in MJ·mm/(hm2·h·a); K indicates the soil erodibility factor in t·hm2·h/(hm2·MJ·mm); L and S are the slope length factor and slope factor, respectively, usually expressed as LS; C is the vegetation cover and management factor; P is the soil conservation measure factor. LS, C, and P factors are all dimensionless units.
In this study, the rainfall erosion factor was calculated by annual rainfall as proposed by Zhang and Fu [26]):
R = α 4 × F F β 4
F F = 1 × N 1 i = 1 N [ ( j = 1 12 P i , j 2 ) × ( j = 1 12 P i , j ) 1 ]
where R is the multiyear average rainfall erosion force (MJ·mm·hm−2·h−1·a−1); P i , j   is the ith year, j is the annual month rainfall (mm), and N is the number of years; and α 4 and β 4 are model parameters with values of 0.1833 and 1.9957, respectively.
The soil erodibility factor (K) is a composite representation of the soil’s resistance to erosion and was calculated with reference to previous studies [27] as:
K = { 0.2 + 0.3 e x p [ 0.026 S A N ( 1 S I L 100 ) ] } × ( S I L C L A + S I L ) 0.3 × [ 1.0 0.25 C C + e x p ( 3.72 2.95 C ) ] × [ 1.0 0.7 S N I S N I + e x p ( 5.51 + 22.9 S N I ) ]
S N I = 1 S A N 100
where K is the soil erodibility factor value in t/(MJ-mm); SAN, SIL, and CLA are the sand, powder, and clay grain-mass content (%), respectively; and C is the organic carbon mass content (%).
According to the empirical formula established by the slope of cultivated land in the United States, the formula was modified by calculating the slope length factor (L) and slope factor (S) in segments, drawing on the method of Cao et al. [28]:
S = { 10.8 × s i n θ + 0.036                                 θ < 5 ° 16.8 × s i n θ 0.5                   5 ° < θ < 10 ° 21.9 × s i n θ 0.96                                 θ > 10 °
where S is the slope factor and θ is the ground slope.
L = ( λ 22.13 ) m
m = { 0.2                               θ < 1 ° 0.3             1 ° < θ < 3 ° 0.4             3 ° < θ < 5 ° 0.5                               θ 5 °
where θ denotes ground slope, L denotes slope length factor value, λ denotes slope length value, and m denotes slope factor index.
In this paper, the vegetation cover factor C is based on the algorithm of Almagro et al. [29]:
C = i = 1 12 e x p [ ( 2 ) × N D V I m a x i 1 N D V I m a x i ]
where C is the vegetation cover factor; and N D V I m a x i is the NDVI maximum value in the ith month of the study area.
Based on pertinent studies in loess hilly gully areas and combined with the actual situation of the WRB [17,30], P of 0.2, 0.6, 0.8, 0, 0, and 1 were obtained for arable land, forest land, grassland, water area, construction land, and unused land, respectively.

2.3.2. Entropy Method

Entropy has been applied in numerous research disciplines to determine the weight of index variables by assessing the degree of disorder in variables and contrasting the information content of variables [31]. Standardization is required to make each datum additive, with the positive indicator in Equation (10) and the negative indicator in Equation (11).
Y i j = X i j X i m i n X i m a x X i m i n
Y i j = X i m a x X i j X i m a x X i m i n
where X i m a x and X i m i n are the maximum and minimum values of the index, respectively, and Y i j is the jth impact prevention and control factor of the standardized results.
E j = 1 l n m i = 1 m ( Y i j i = 1 m Y i j ) l n ( Y i j i = 1 m Y i j )
where E j is the information entropy of the influence factor; the smaller the value, the less variation of the factor and the greater the weight. Y i j i = 1 m Y i j is the proportion of the standardized value Y i j to the total standardized value.
W j = 1 E j k j = 1 k E j
where W j is the weight occupied by the factor and k is the number of influencing factors.

2.3.3. Geographical Detector

The geographic detector is a statistical model for analyzing spatial variation, proposed by Wang et al. [31], which consists of four modules: factor detection, interaction detection, risk detection, and ecological detection. Based on the principle of spatial autocorrelation, factor detection and interactive detection can effectively determine the impact of a single independent variable and the interaction between two independent variables on the dependent variable, and can quantitatively analyze the impact of environmental change on vegetation change in the study area. The formulas are as follows:
q = 1 1 N σ 2 h = 1 L N h σ h 2 = 1 W T
W = h = 1 L N h σ h 2
T = N σ 2
where h is the hierarchy of the independent variable X, and h = 1,2, … L; and L is the classification of the independent variable X or the dependent variable Y. The range of q values is [0, 1]. The larger the q value, the stronger the spatial heterogeneity of the dependent variable Y, and the stronger the explanatory power of the independent variable X on the dependent variable Y. Nh and N represent the number of units in layer h and the entire area, respectively, and represent the variances of layer h and region Y, respectively; and W and T represent the sum of intralayer variances and the total regional variances, respectively.

2.3.4. Four-Quadrant Model

The four-quadrant model combines dynamic and static analysis to analyze the relationship between the two factors [32]. In this study, the model was applied to the coupling relationship between human activities and soil erosion in the WRB to explore the current situation of the human–land relationship and spatial differentiation characteristics. A four-quadrant model was constructed with the intensity of human activities as the horizontal axis and the soil erosion modulus as the vertical axis. The positions of the quadrants where the index values are located reflect the degree of differences to which human–land connections differ among various assessment units (Figure 2). Based on the natural break point method in ArcGIS, the human–land relationship is divided into four zones: excellent, good, general, and poor qualities (Table 2 and Table 3).
The quadrant flow state index (QFSI) is established to reveal the dynamic changes in the human–land relationship using the following equation:
Q F S I ( i ) = F ( i ) i n F ( i ) o u t F ( i ) i n + F ( i ) o u t   ( 1     QFST   1 )  
where Q F S I ( i ) is the quadrant flow state index, F ( i ) i n is the ith quadrant shift-in area, and F ( i ) o u t is the ith quadrant shift-out area. When QFST is less than 0, it means the quadrant area is in the decreasing state; when QFST is greater than 0, it means the quadrant area is in the increasing state. When QFST is close to 0, it means that the quadrant is in the equilibrium state of two-way conversion.

3. Result

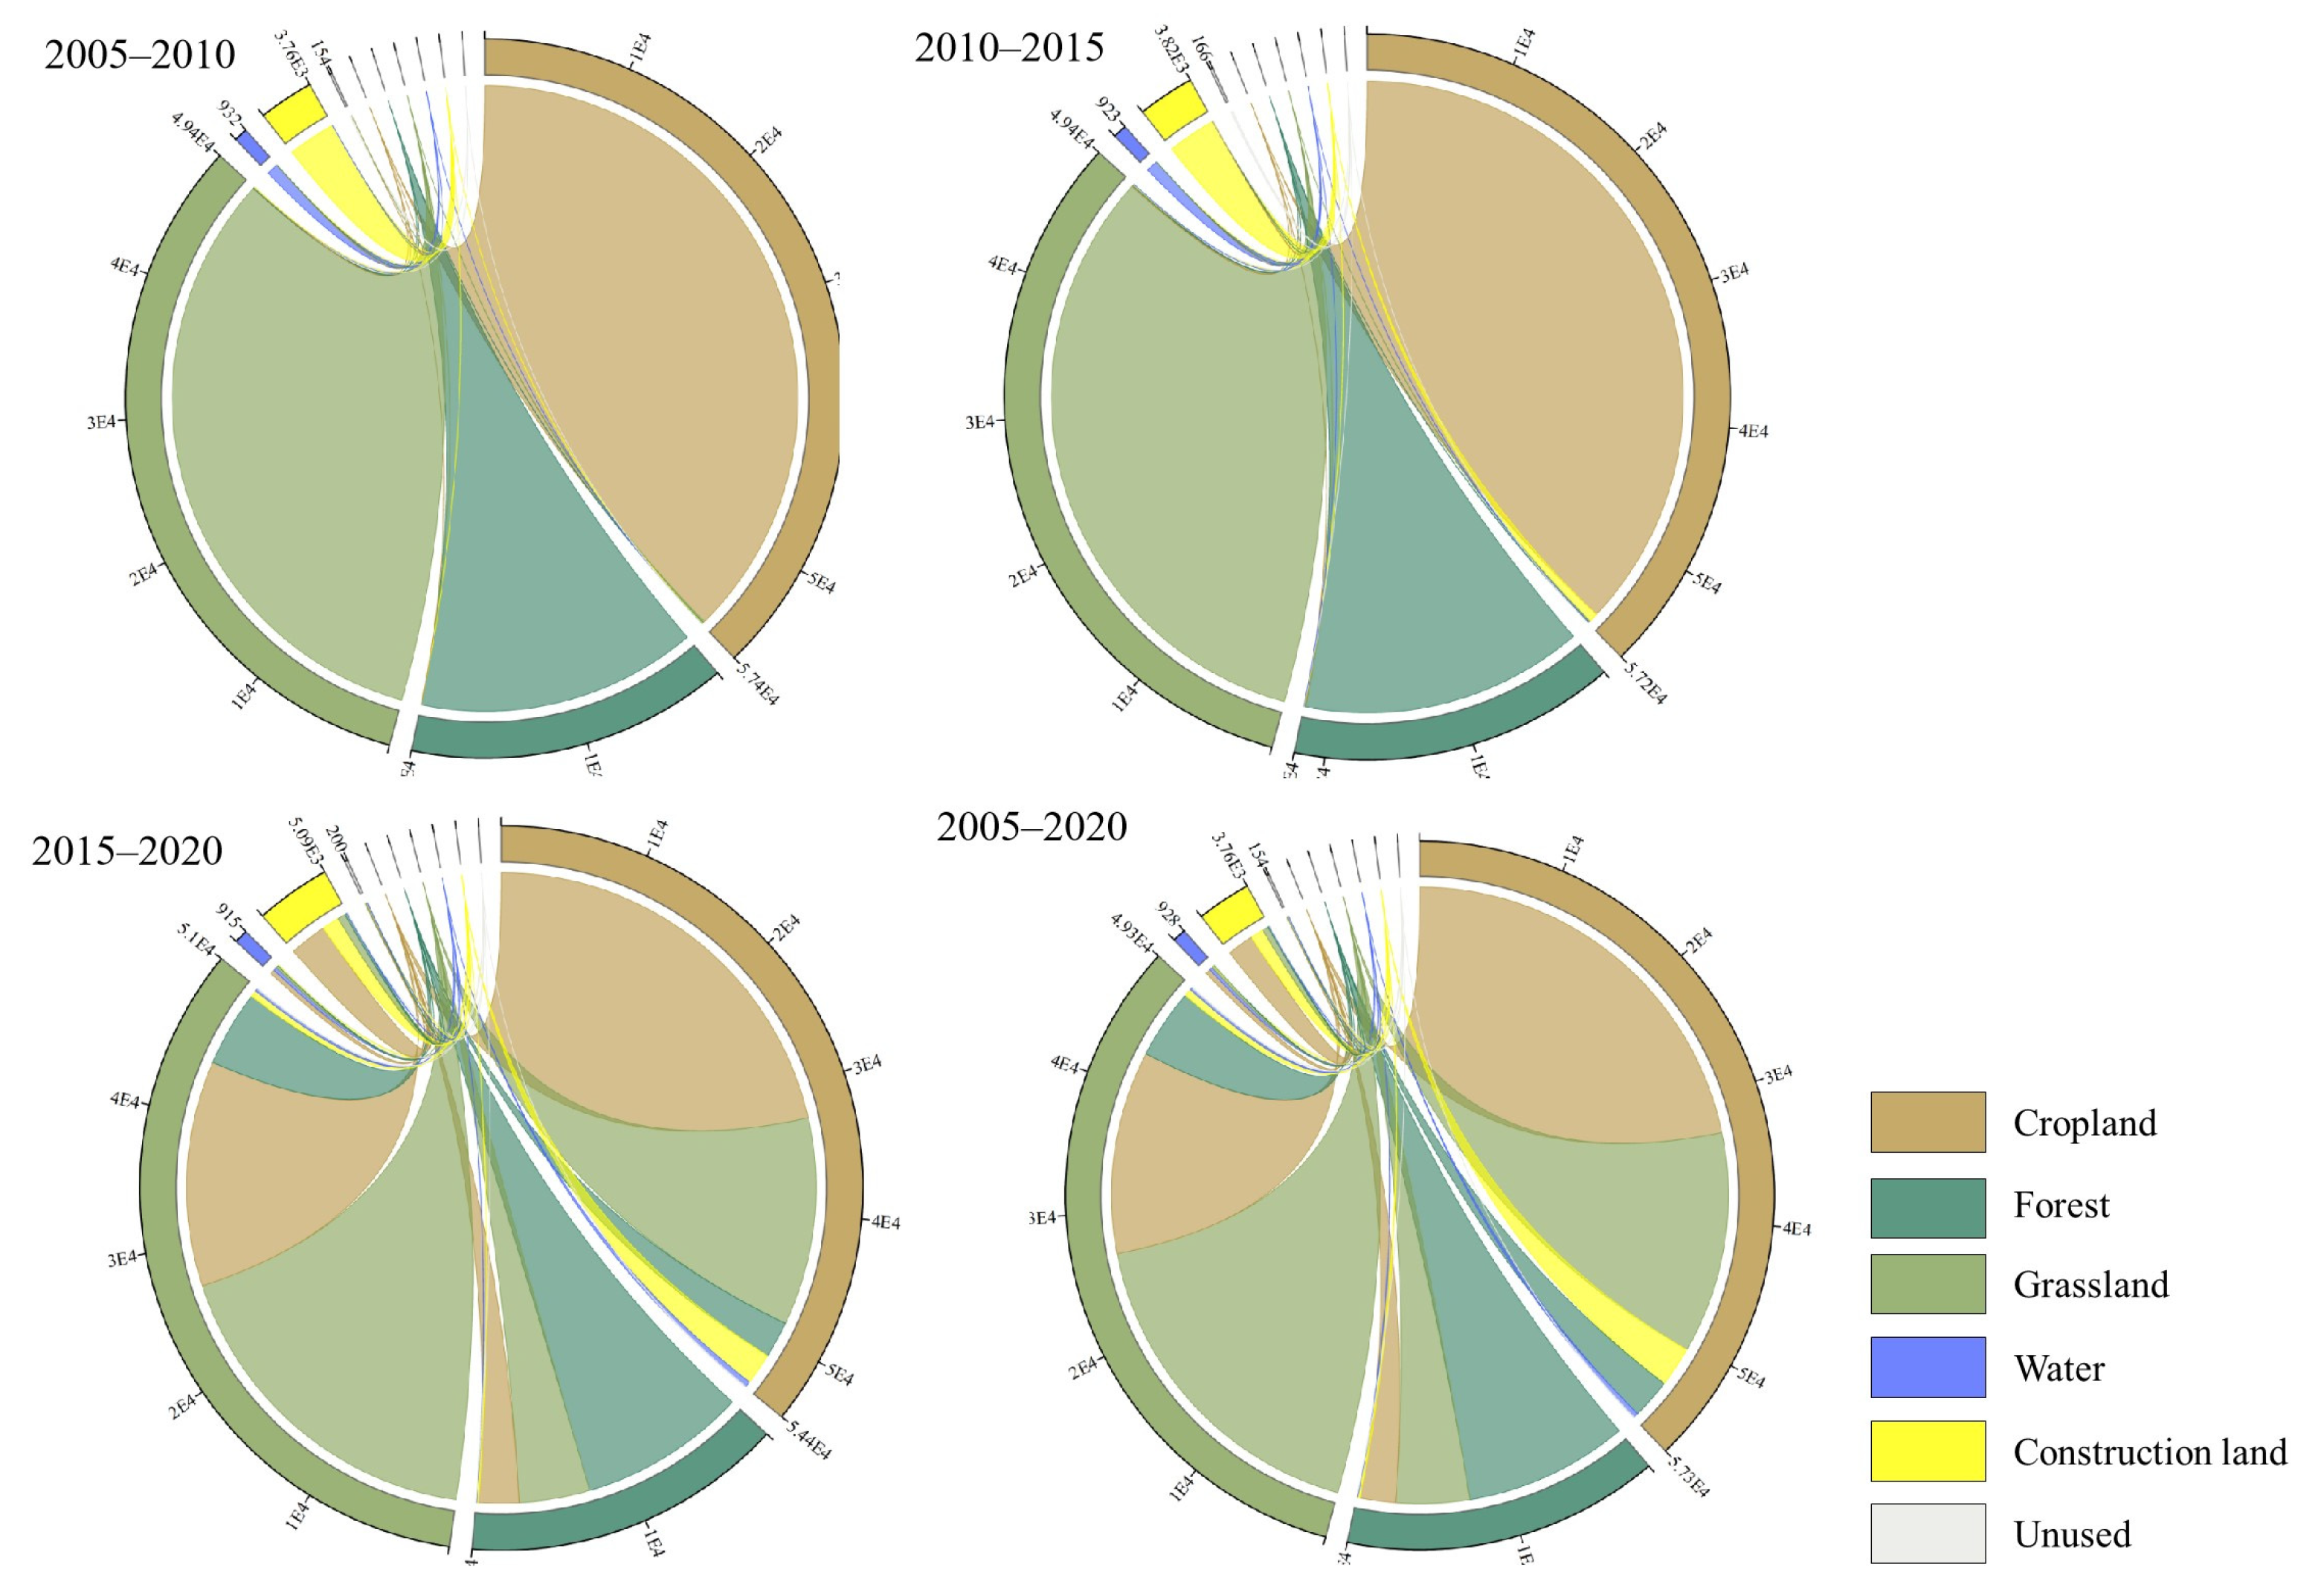
3.1. Changes to the Dynamics of LUCC

Figure 2 shows the changes in different land-use types in the WRB from 2005 to 2020. Cropland is the main type of land use in the WRB, accounting for 42.22% of the total area, followed by grassland (37.26%) and forest land (16.45%). The cumulative area of water and other types of land accounts for less than 5% of the total area. From 2005 to 2020, with population growth and rapid economic development, the land-use patterns in the WRB have undergone significant changes. The order of different land-use types according to the degree of area increase is grassland > construction land > unused land > water area > forest land > cropland. The area of cropland and forest land has generally decreased, with the former reaching 3.31 × 10⁵ ha. However, the area of grassland and construction land has increased year by year, with grassland increasing the most, reaching 2.04 × 10⁵ ha. The growth rate of construction land is the highest, with a dynamic increase of 35.39%.

3.2. Spatial–Temporal Variation Characteristics of Soil Erosion

3.2.1. Rationality and Validation of the Model

Using the annual sediment transport modulus data of hydrological stations within the watershed, spatial interpolation is performed in CIS to obtain the sediment transport modulus of the study area and compare it with the soil erosion modulus. Due to the use of multiyear average rainfall erosivity in this article, it is necessary to compare the multiyear average sediment transport modulus with the multiyear average soil erosion intensity in the watershed. The hydrological monitoring stations used are Zhuangtou, Zhangjiashan, and Huaxian (Figure 1). According to the “China River Sediment Bulletin” published on the website of the Ministry of Water Resources (http://www.mwr.gov.cn/, accessed on 1 March 2023), the average sediment transport moduli for many years in Zhuangtou, Zhangjiashan, and Huaxian are 2520, 4580, and 2680 t·km−2·a−1, respectively. Kriging interpolation was performed in GIS to obtain the annual average sediment transport modulus of 3523.26 t·km−2·a−1 in the WRB. Through calculation, the average soil erosion intensity of the Weihe River Basin from 2005 to 2020 was 4231.32 t·km−2·a−1, and the ratio of sediment transport modulus to the results of the RUSLE model was 0.83, indicating that the results obtained from the RUSLE model can be used for further analysis.

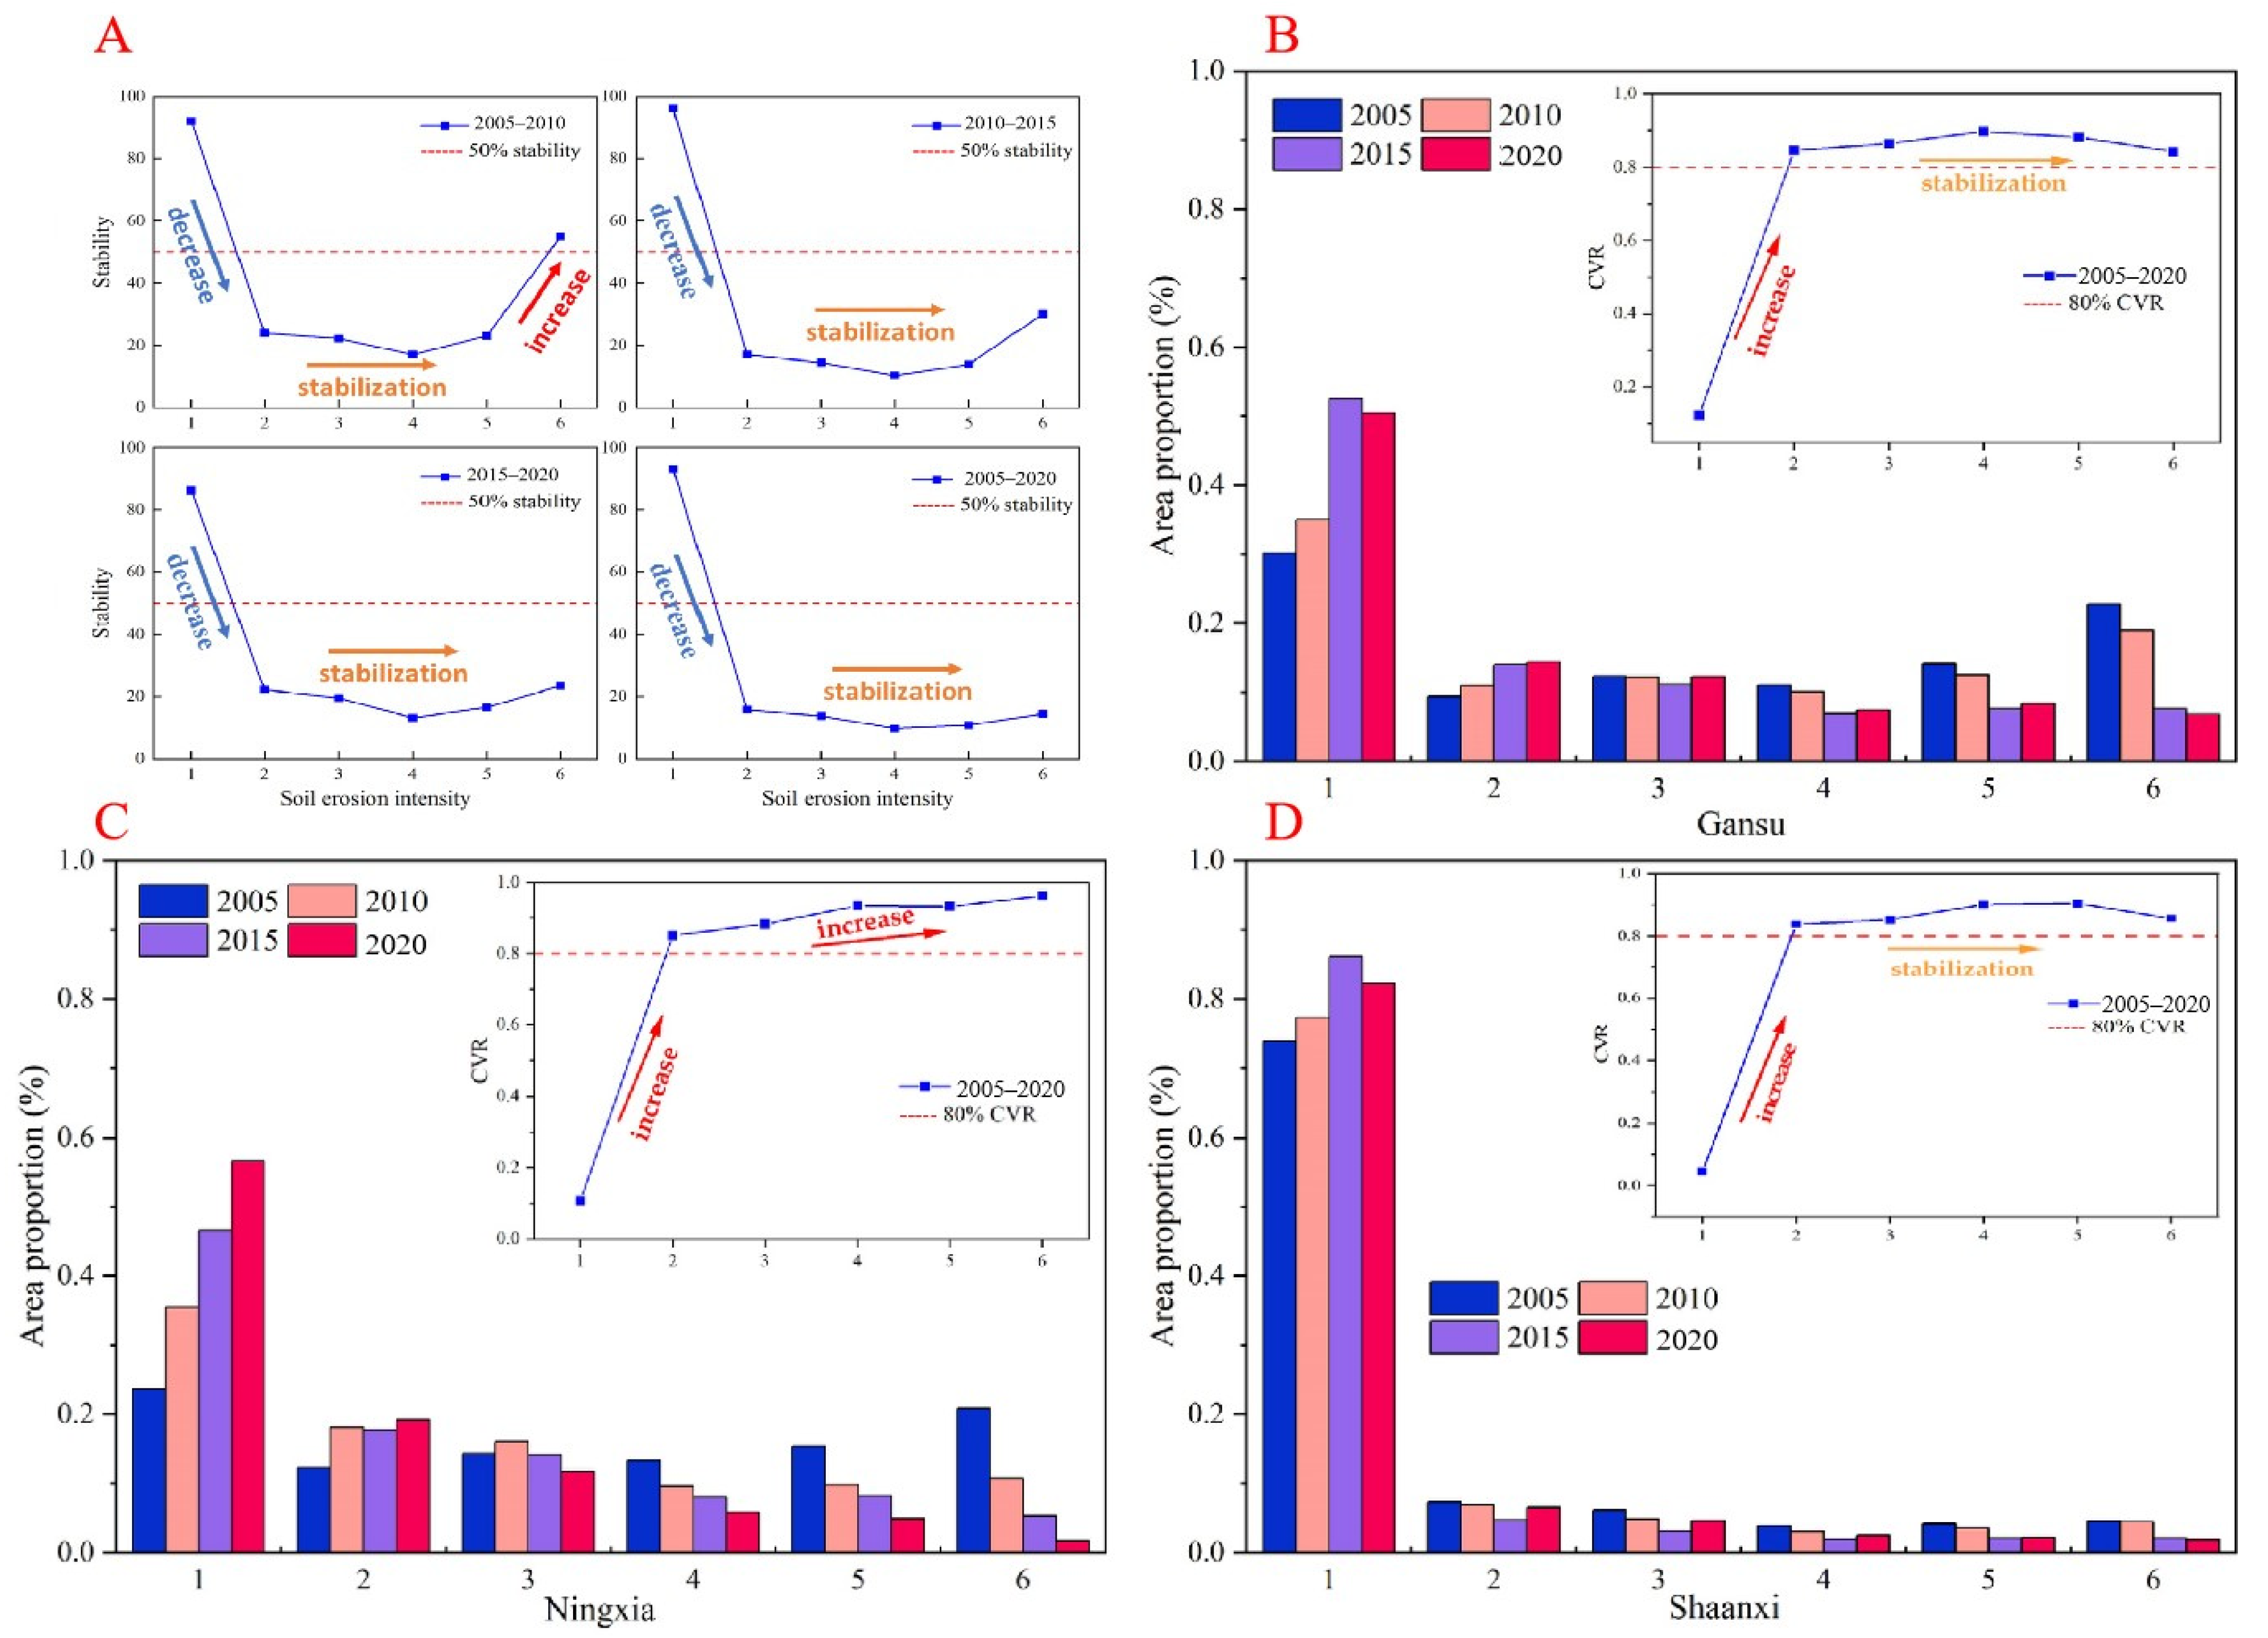
3.2.2. Time Variation in Soil Erosion Intensity

The soil erosion intensity of the study area in Phase 4 is divided into six erosion levels: slight, weak, moderate, high, strong, and severe, according to the Classification Standard for Soil Erosion. The area percentage of different soil erosion levels is presented in Table 4.
In 2005, the minimum erosion modulus was 0 t·km−2·a−1, the maximum erosion modulus was 214,439 t·km−2·a−1, and the average erosion modulus was 6363.49 t·km−2·a−1. Approximately 51.56% of the area had an erosion modulus of less than 1000 t·km−2·a−1, about 69.5% of the area erosion modulus was below 5000 t·km−2·a−1, and an erosion modulus of 15,000 t·km−2·a−1 or more accounted for about 13.61% of the watershed area.
In 2010, the minimum erosion modulus was 0 t·km−2·a−1, the maximum erosion modulus was 231253.78 t·km−2·a−1, and the average erosion modulus was 5451.36 t·km−2·a−1. Approximately 56.13% of the area had an erosion modulus of less than 1000 t·km−2·a−1, about 74.28% of the area erosion modulus was below 5000 t·km−2·a−1, and an erosion modulus of 15,000 t·km−2·a−1 or more accounted for about 11.25% of the watershed area.
In 2015, the minimum erosion modulus was 0 t·km−2·a−1, the maximum erosion modulus was 92,797.72 t·km−2·a−1, and the average erosion modulus was 2571.37 t·km−2·a−1. Approximately 68.91% of the area had an erosion modulus of less than 1000 t·km−2·a−1, about 85.87% of the area erosion modulus was below 5000 t·km−2·a−1, and the erosion modulus of 15,000 t·km−2·a−1 or more accounted for about 4.72% of the watershed area.
In 2020, the minimum erosion modulus was 0 t·km−2·a−1, the maximum erosion modulus was 231,100.56 t·km−2·a−1, and the average erosion modulus was 2539.06 t·km−2·a−1. Approximately 66.72% of the area had an erosion modulus of less than 1000 t·km−2·a−1, about 85.95% of the area erosion modulus was below 5000 t·km−2·a−1, and am erosion modulus of 15,000 t·km−2·a−1 or more accounted for about 4.08% of the watershed area.

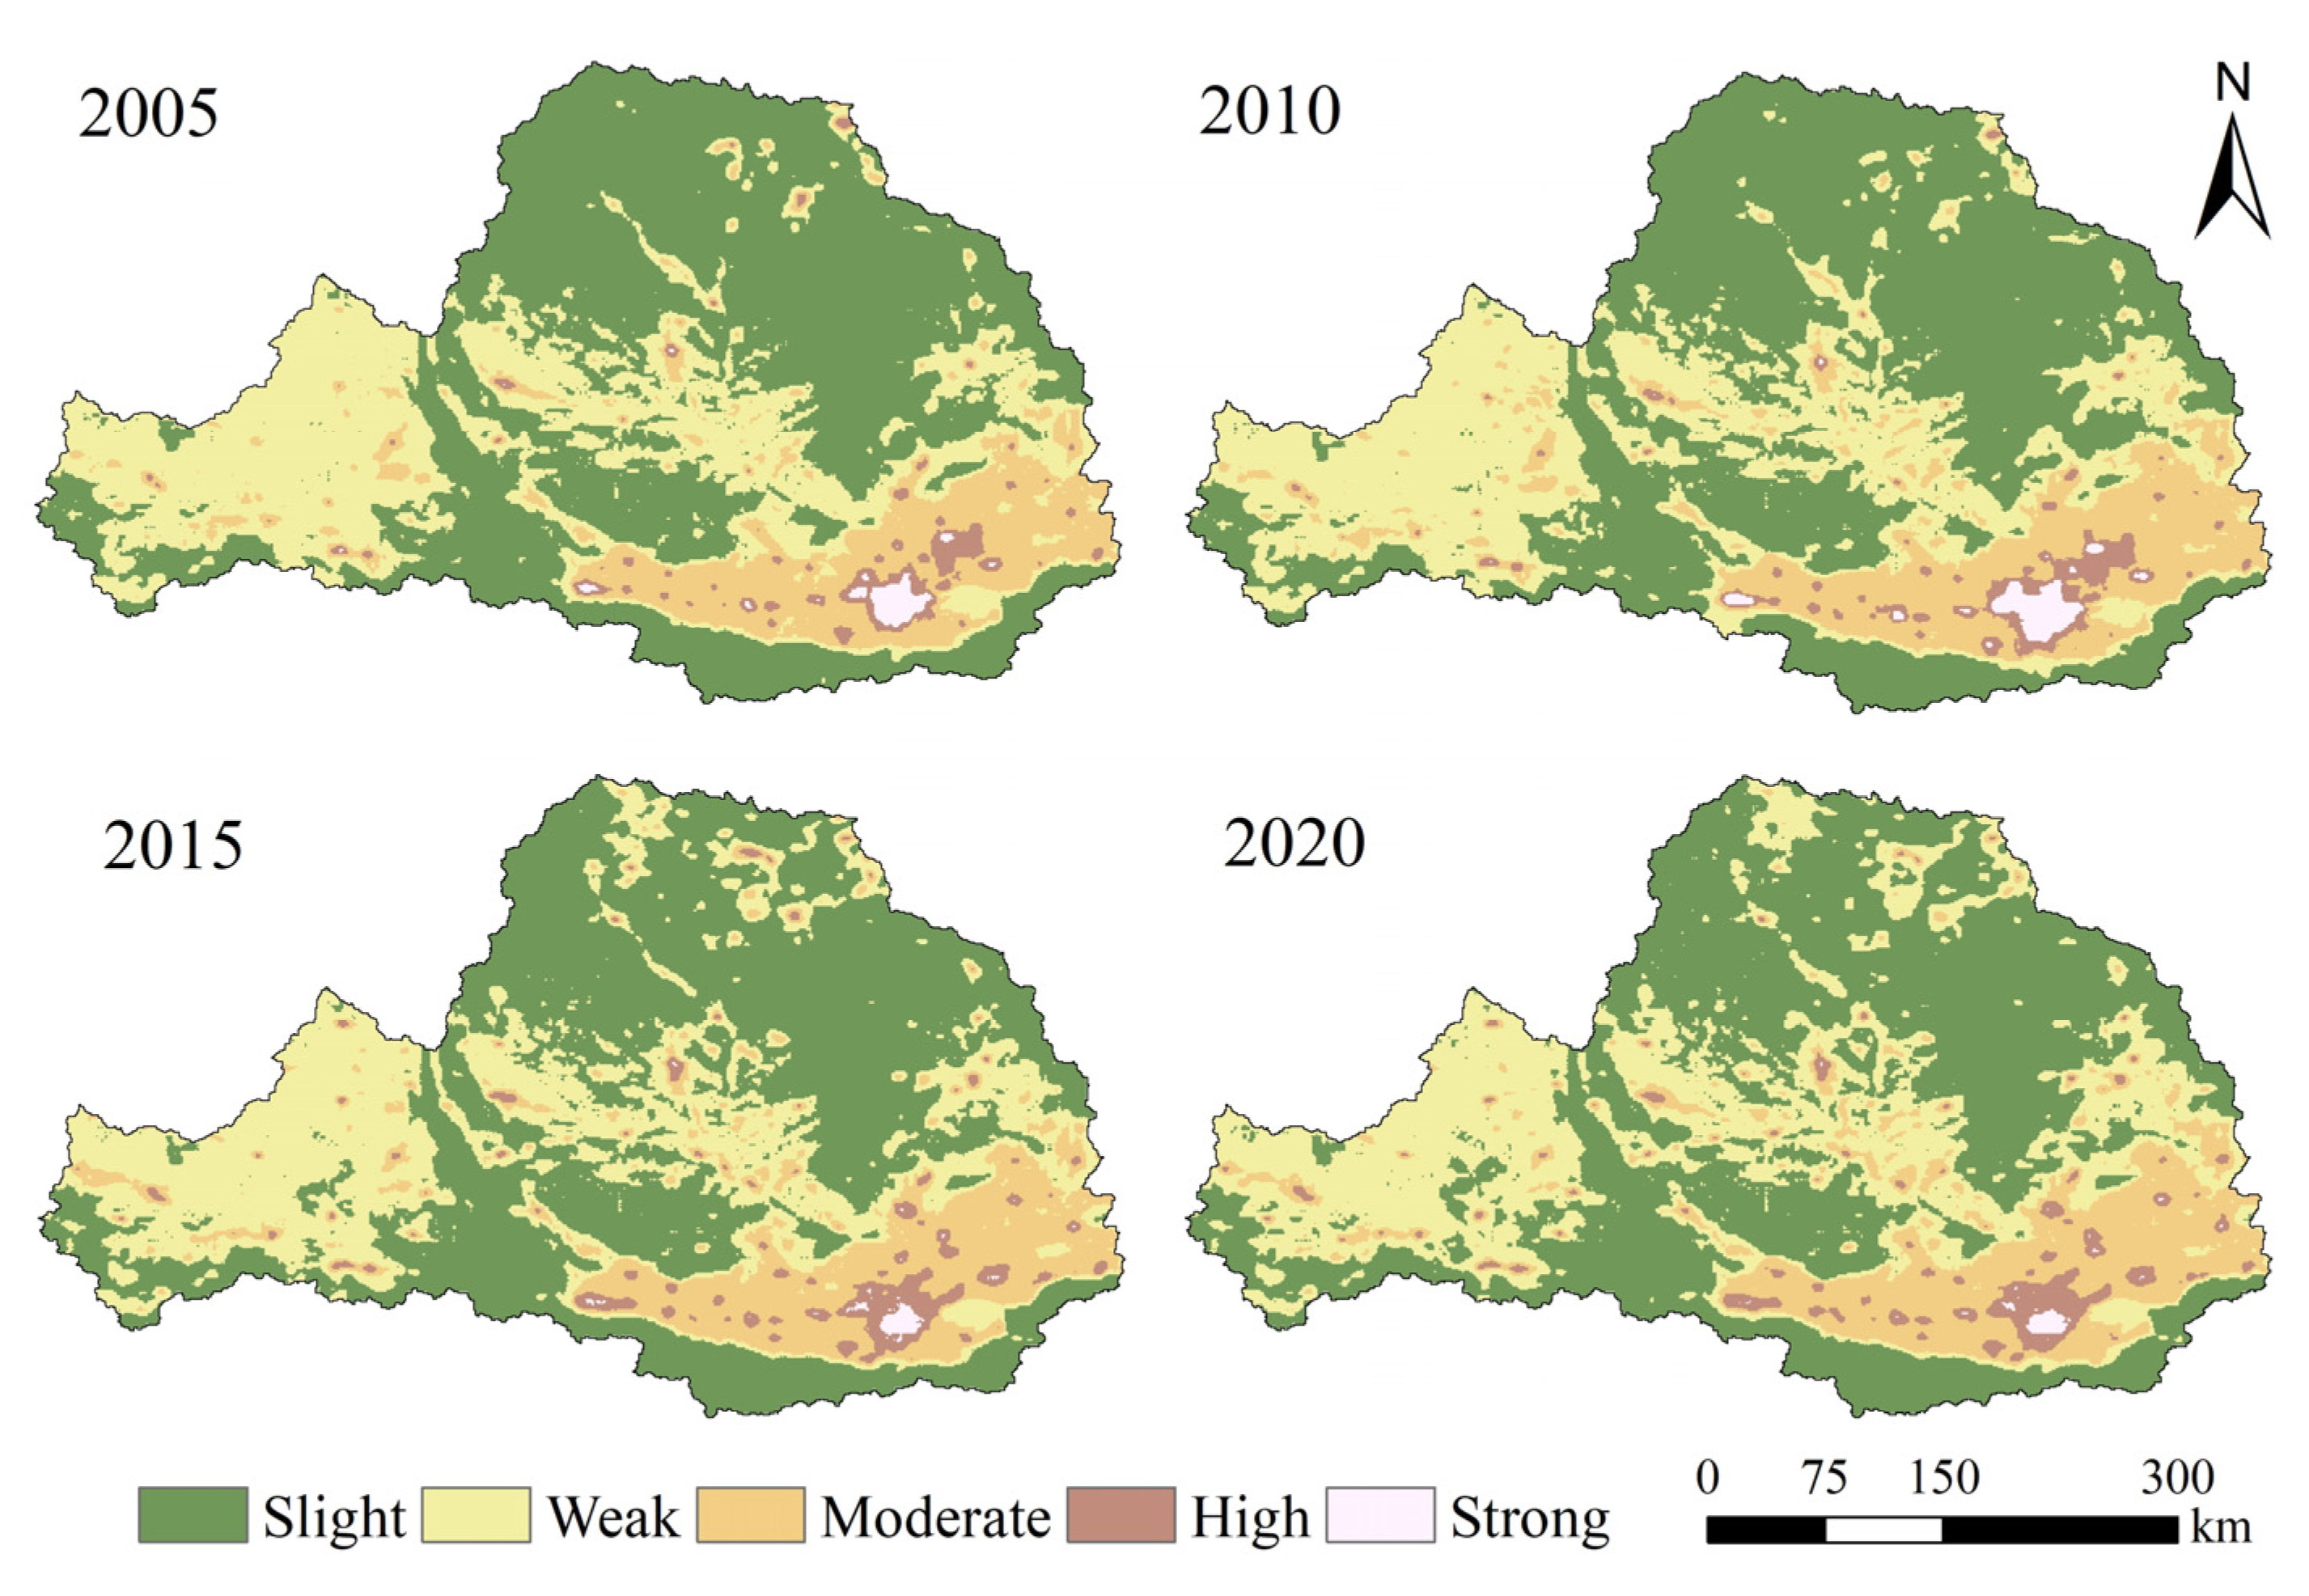
3.2.3. Spatial Variation in Soil Erosion Intensity

Figure 3 reveals that there was significant spatial variation in soil erosion from 2005 to 2020. The distribution of severe eroded areas was relatively stable, mostly with high and steep terrain and poor vegetation coverage, resulting in serious erosion and requiring focused targeted treatment. The areas with strong erosion were mainly distributed in the northern and western parts of the WRB, and the area gradually decreased with time changes. Areas of high erosion mostly existed around areas of strong erosion. Some areas of high erosion also existed in the central part from 2005 to 2010, and areas of high erosion showed a trend of conversion to moderate and slight erosion from 2010 to 2015.
The change degree of the stability rate of soil erosion intensity in different years and the change intensity of soil erosion in each province are shown in Figure 4. It can be seen from Figure 4A that the stability rate of weak, moderate, high, and strong erosion in the WRB is relatively low as a whole. The stability rate of severe erosion is only higher than 50% in the period of 2005–2010, and the stability rate of severe erosion is lower than 30% during the period of 2010–2020, which indicates a significant decreasing trend of soil erosion intensity. The WRB is composed of three sections: Gansu section, Ningxia section, and Shaanxi section. The conversion rates (CVR) of weak, moderate, strong, and severe in all three sections from 2005 to 2020 were above 80%, proving that soil erosion showed a decreasing trend (Figure 4B–D).

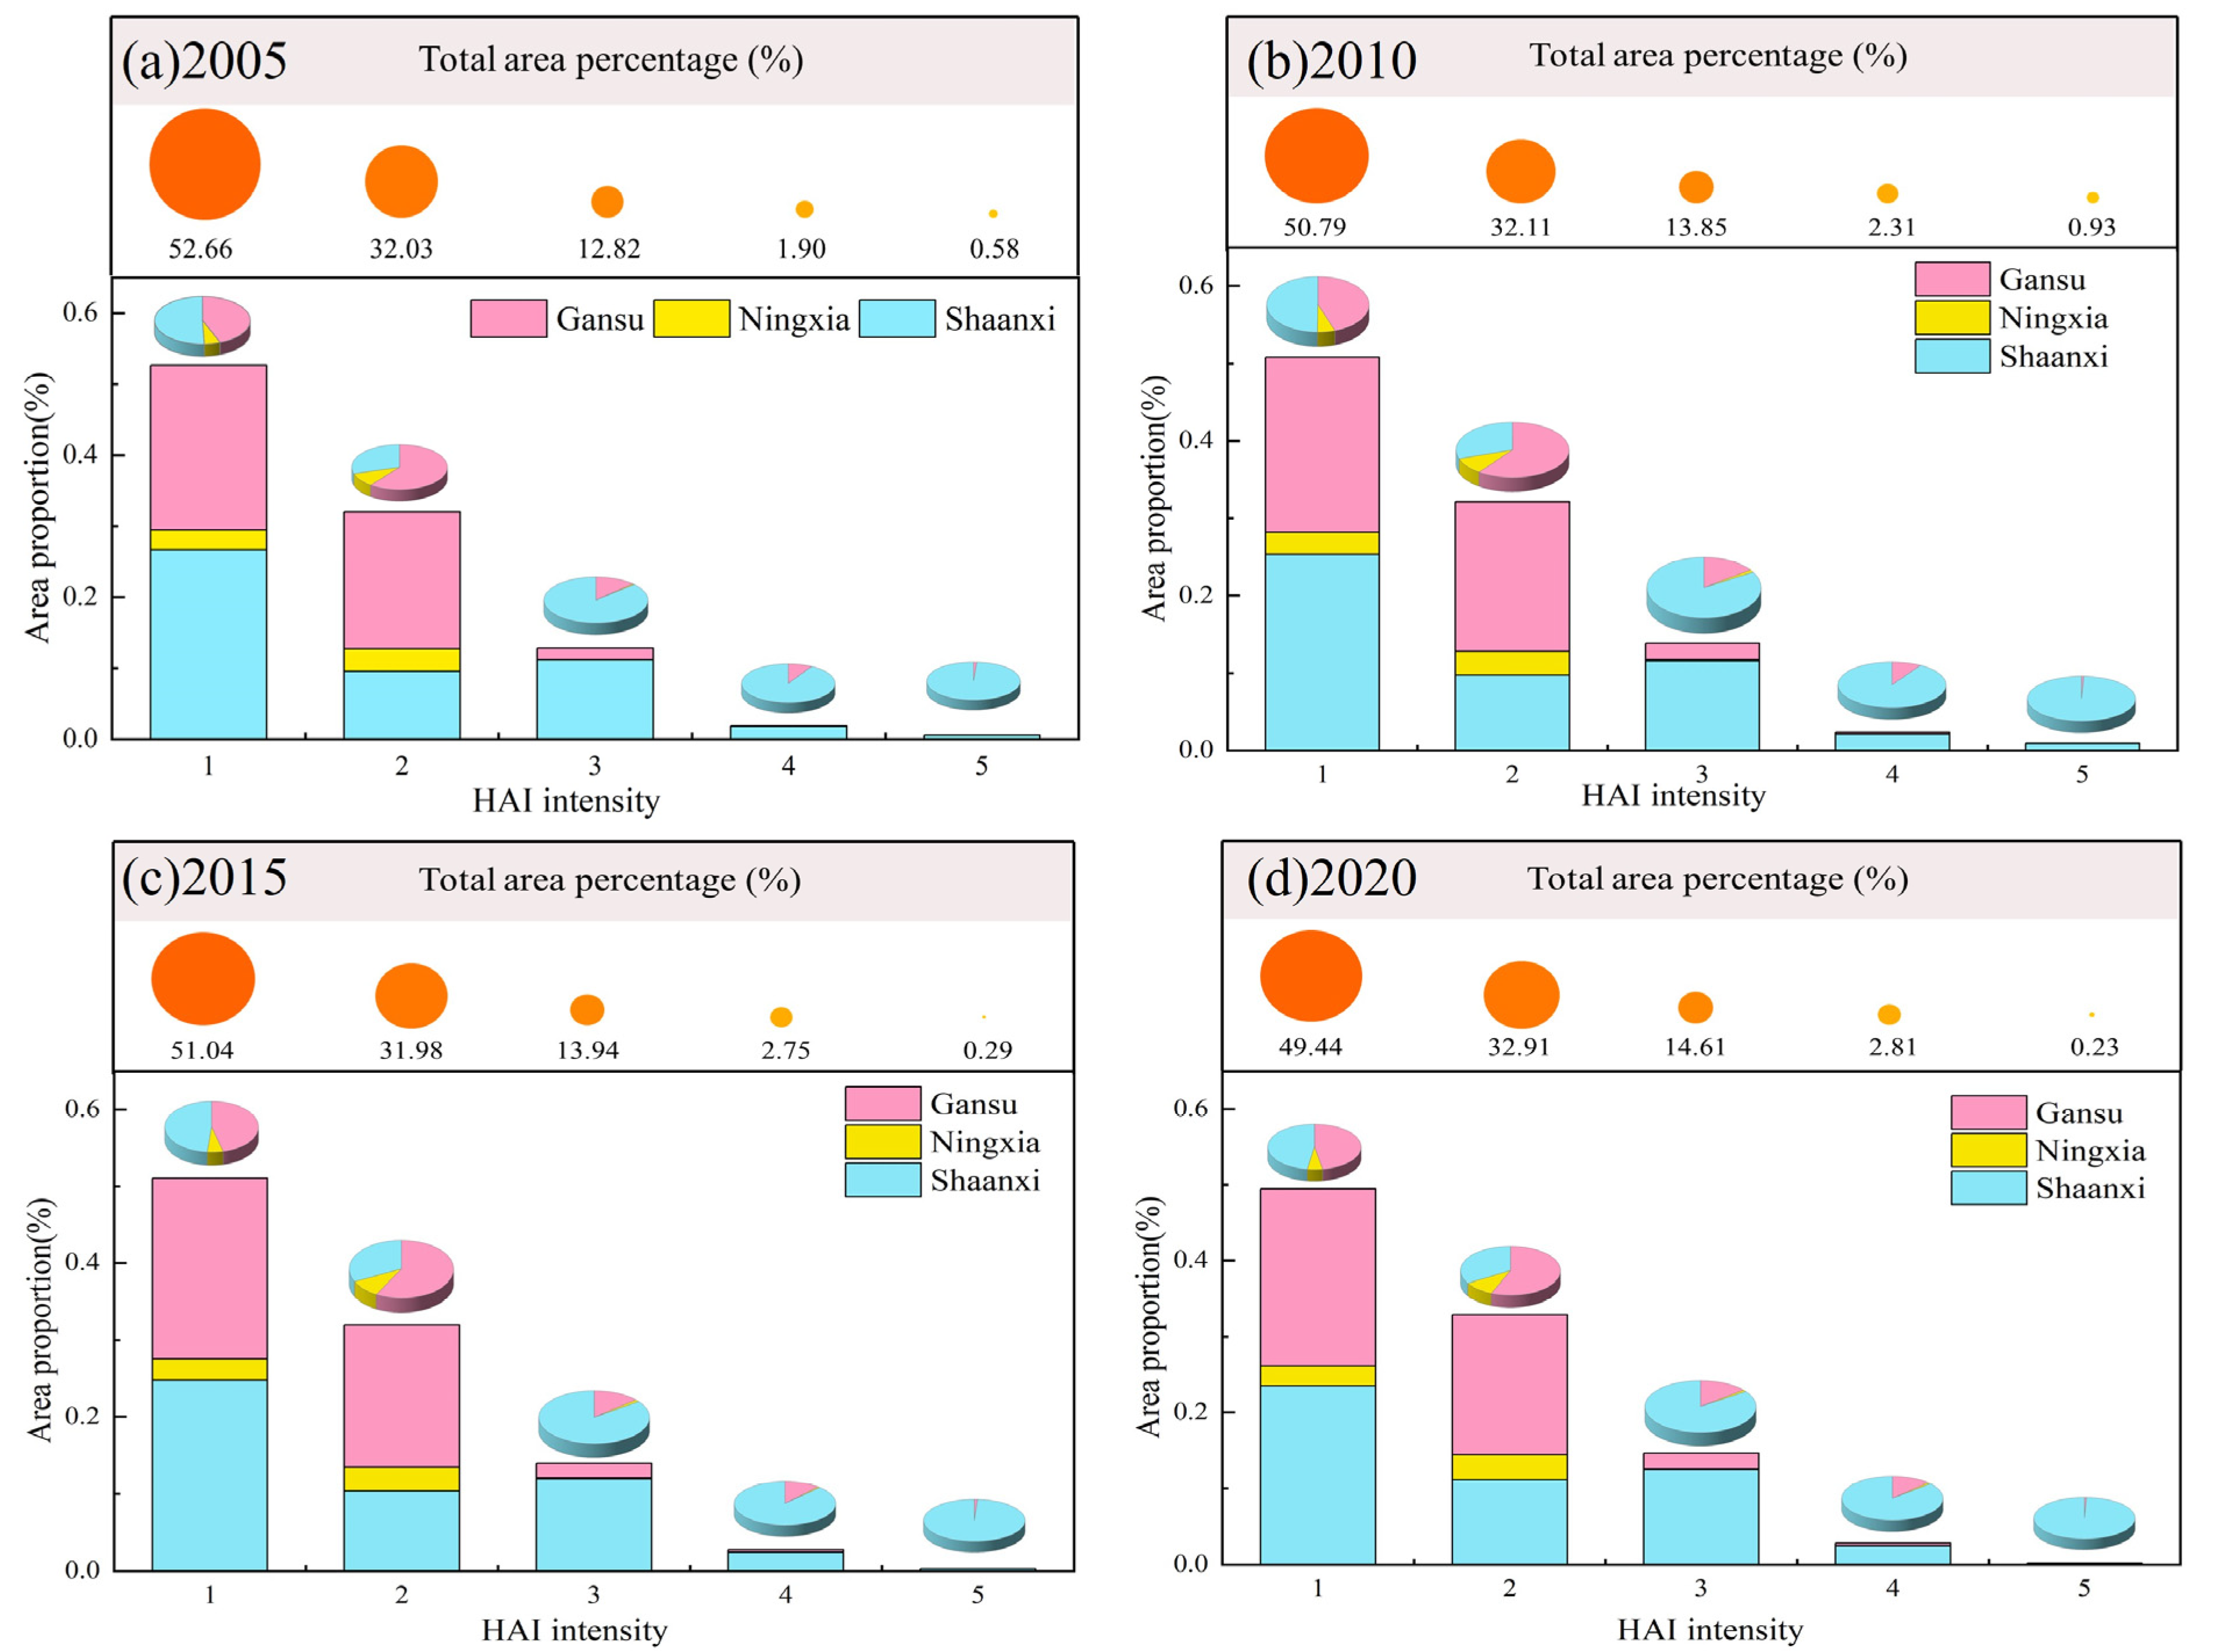
3.3. Spatial–Temporal Variation Characteristics of HAI

The natural breakpoint method of ArcGIS 10.3 was used to classify the HAI into five levels: slight, weak, moderate, high, and strong. During the period of 2005–2020, the distribution of HAI in the WRB did not change significantly, showing a spatially strong southeastern and weak northwestern feature (Figure 5). As shown in Figure 6a, there is considerable spatial variation in the HAI levels in the WRB, taking the HAI level in 2005 as an example. The slight HAI occupied 52.66%, of which the Shaanxi section accounted for the most (26.66%), followed by the Gansu section (23.17%); the Ningxia section accounted for the least (2.83%). The proportion of the three sections in the weak HAI changed, with the proportion of the Gansu section accounting for 60.32% of the entire weak HAI, the Shaanxi section accounting for 29.81%, and the Ningxia section accounting for 9.89%. The proportion of the Ningxia section in moderate HAI was very small at 0.56%, and the proportion of the Shaanxi section returned to the first position with 86.85%. The proportion of the Gansu section was 12.58%. The HAI in the Ningxia section of the WRB contained only weak, mild, and moderate HAI. The high level of HAI accounted for 1.90% of the whole basin, of which the Shaanxi section had an absolute advantage with 91.80%, followed by the Gansu section with 8.44%. The strong HAI in the WRB had a very small percentage of 0.58%, of which the Shaanxi section accounted for 98.93%. In terms of changes in different HAI levels from 2005 to 2020, the slight and weak HAIs covered most of the study area, mainly in the northern and western parts of the WRB, accounting for more than 80% of the total basin, as shown in Figure 5. The Ningxia section was basically in the stage of weak HAI. The high and strong areas were mainly distributed in the Shaanxi section of the WRB, accounting for 3% of the total basin. The degree of slight HAI decreased significantly, from 52.66% in 2005 to 49.44% in 2020. The area percentage of weak and moderate HAI showed an increasing trend, with the percentage of weak HAI increasing from 32.03% in 2005 to 32.90% in 2020 and the percentage of moderate HAI increasing from 12.82% in 2005 to 14.61% in 2020. The percentages of high and strong HAI increased by 47.56% and decreased by 60.55%, respectively. In general, most of the regions were characterized by slight and weak HAI during the period of 2005–2020; the changes were not very significant, and the high and strong HAI was mainly concentrated in the Shaanxi section of the WRB.

3.4. Analysis of Anthropogenic Driving Factors of Soil Erosion Based on Geographic Detector Model

The application results of the factor detector show that all five factors passed the 1% significance level test, and there are significant differences in the explanatory power of different factors on soil erosion in the WRB. Over time, the explanatory power of various factors on soil erosion in the watershed does not vary significantly, with POP and GDP having a higher explanation than PANDA and crop. Figure 7 shows the results of the interaction between factors, and it is found that the interaction results of any two factors present a dual factor or nonlinear enhancement. These results indicate that the spatial differences in soil erosion are caused by multiple influencing factors. The interaction between POP and cropland has the greatest explanatory power on soil erosion.

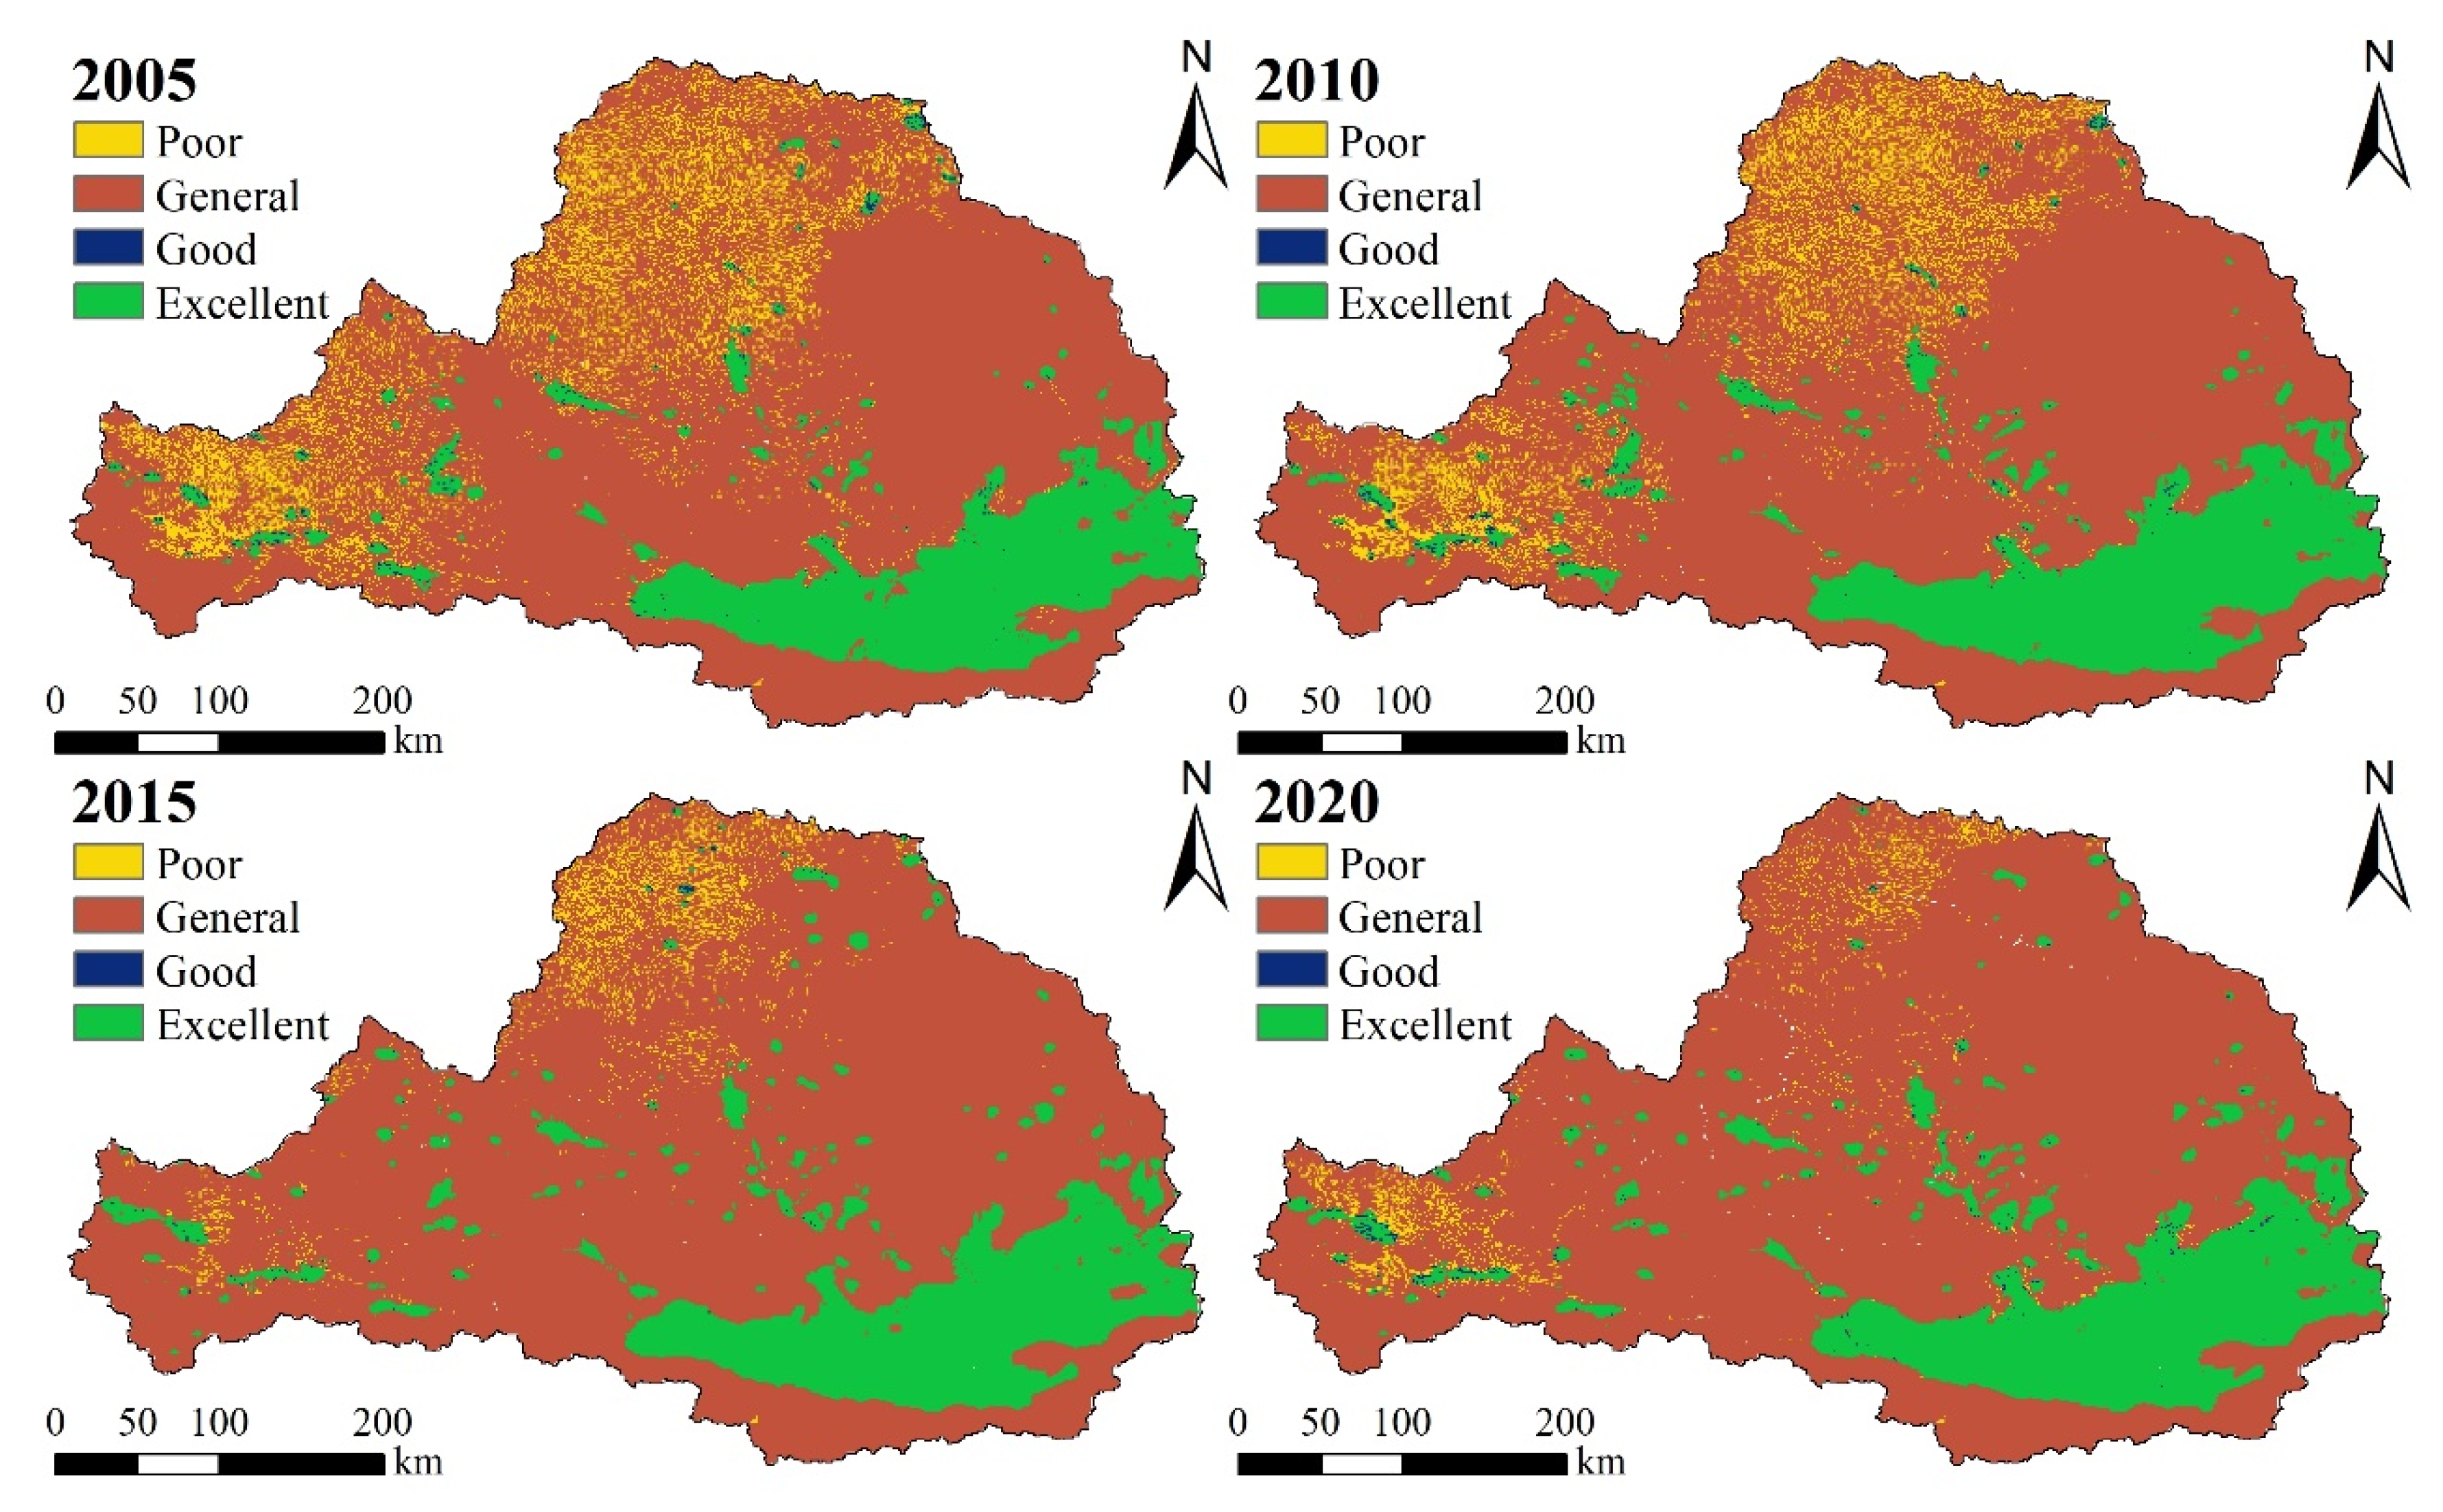
3.5. Spatiotemporal Coupling Evolution between HAI and Soil Erosion

The spatiotemporal coupling characteristics of HAI and soil erosion in the WRB were explored based on a four-quadrant model. As shown in Figure 8, there are obvious spatial differences between the coupling degree of HAI and soil erosion in the WRB from 2005 to 2020. The area with a coupling degree of poor is decreasing. Between 2005 and 2010, poor coupling degree was mainly distributed in the northern and western parts of the WRB, accounting for about 10%, and the area contracted to the north, reducing to about 3% of the study area from 2015 to 2020, which indicates a greater improvement in the ecosystem compared to 2005. The area with a coupling degree of general showed an increasing trend, with the area proportion increasing from 72.89% in 2005 to 78.44% in 2020, far exceeding the other three coupling degrees, indicating that the ecosystem is moving toward a stable trend. The area with a coupling degree of good is the smallest and is more stable, with the area being less than 0.5% in 2005–2020. The area with a coupling degree of excellent is mainly distributed in the southeast of the WRB, showing an overall increasing trend, with the area proportion increasing from 14.98% in 2005 to 17.36% in 2020, an increase of 15.89%.
Figure 9 illustrates the dynamics of the degree of coupling for different periods (2005–2010, 2010–2015, 2015–2020, and 2005–2020). From 2000 to 2010, the QFSI with the poor, general, good, and excellent coupling degrees were −0.228, 0.024, −0.075, and 0.536, respectively (Table 5). The outflow with a degree of coupling of poor is greater than the inflow, and its area tends to decrease, mainly shifting to the general coupling. The inflows are greater than the outflows in the excellent coupling degree, and their areas have a tendency to increase. The QFSI with good and general coupling degrees is close to 0, indicating that the change is not significant and is close to the equilibrium state of bidirectional conversion.
From 2010 to 2015, the QFSI with the poor, general, good, and excellent coupling degrees were −0.696, 0.495, −0.578, and 0.040, respectively (Table 5). Compared with 2005–2010, the area of the general coupling degree has increased significantly, while the areas of poor and good coupling degrees have decreased, among which the area with the poor coupling degree has decreased dramatically and the area with the general coupling degree is still at the highest percentage.
From 2015 to 2020, the QFSI with the poor, general, good, and excellent coupling degrees were −0.189, 0.023, 0.517, and 0.236, respectively (Table 5). Compared with 2010–2015, the area with the good, general, and excellent coupling degrees is increasing in varying degrees, indicating a steady increase in the effectiveness of ecological management in the WRB.
From 2005 to 2020, the QFSI with the good coupling degree is −0.139, indicating that the good human–land relationship is basically in a two-way transition equilibrium state. The area with the poor coupling degree where the relationship between humans and land is poor decreases a lot, and the QFSI is −0.746. The poor coupling degree mainly shifts to the general coupling degree. The general coupling degree has a partial flow into the fourth quadrant, indicating that the ecological environment has partially shifted to an excellent human–land relationship. Overall, it seems that the ecological environment of the WRB has gradually improved.

4. Discussion

The RUSLE method was used to quantify soil erosion in the WRB, and the temporal and spatial characteristics of soil erosion changes from 2005 to 2020 were discussed. In terms of space, the northern and western parts of the WRB are areas of relatively severe soil erosion. This heterogeneous spatial distribution is largely due to the special geographical environment, where the loess is deep and loose and prone to erosion [17,33]. The southeastern area of the WRB is more economically developed, and soil erosion is relatively low because socio-economic development has promoted awareness of soil erosion and conscious changes in production and lifestyle [34]. In terms of time, the average soil erosion modulus in the WRB has decreased over time, indicating a change from relatively severe to weak soil erosion. The results of Sun et al. [35] are consistent with our findings, demonstrating that soil erosion in the Loess Plateau is decreasing at a rate of more than 1 t·km−2·a−1. Furthermore, the stability rate of soil erosion in the WRB was calculated, and the results showed that the stability rate of severe erosion in the WRB from 2005 to 2020 showed a downward trend. Among them, the transformation rate of severe erosion in the Shaanxi and Gansu sections was greater than 85%, and the transformation rate of severe erosion in the Ningxia section was as high as 96.28%. This may be attributed to the implementation of ecological protection projects, such as returning farmland to forests and grassland, and the GCHP project, which increased vegetation cover and improved the ecological environment of the WRB [24,36].
In addition, this study also found that the interaction between any two factors on soil erosion is greater than that of one factor and mainly exhibits a nonlinear enhancement effect, which is consistent with the findings of Xu et al. [23]. Soil erosion is affected by multiple factors. This study uses the geographical detector method to determine the driving factors that affect regional soil erosion changes. The results show that POP and crop have a greater impact than other factors and are dominant factors. Due to the implementation of ecological protection measures such as returning farmland to forests and grassland and GCHP since 1996, the overall ecosystem of the Loess Plateau has been restored and improved. For example, the forest cover, grass cover, and habitat quality have shown an increasing trend due to the implementation of the Grain for Green project [21]. Based on experiments, Xu et al. [14] came to the conclusion that GLC projects can restore and mitigate soil erosion while maintaining water and soil. Human activities are mainly concentrated in production and living activities such as the development and utilization of natural ecological resources; therefore, population density is also an important factor affecting soil erosion [37,38].
In this study, we analyzed the HAI in the WRB during the period of 2005–2020. Temporally, there is an upward trend in the percentage of area with weak, moderate, and high HAI. This indicates that the watershed ecosystem was effectively affected by human activities from 2005 to 2020, which is consistent with previous studies [39,40]. Xu and Xu [41] concluded that from 1992 to 2008, the number of county-level units included in the intermediate type area of the Loess Plateau increased substantially, and the mean value showed an overall upward trend. Spatially, the spatial distribution of HAI in the WRB shows strong southeast and weak northwest characteristics, which are related to urban population density. Human activities are mainly concentrated in production and living activities such as the development and utilization of natural ecological resources [36,37], so the higher values of HAI are mainly distributed in the southeastern part of the WRB. The northwestern region is less densely populated and has less space and fewer resources needed for human survival, so the Ningxia section as a whole is basically in a weak stage of HAI. This is consistent with the findings of previous studies on human activities in the WRB [17,21].
The relationship between HAI and soil erosion is dynamic. Our results show that about 97% of the region is distributed in the good, general, and excellent coupling degrees. Only 3% of the region is distributed in the poor coupling degree. This implies that the ecological quality of the WRB is generally good, and the coupling of HAI and soil erosion is good. The implementation of returning farmland to forests has improved the overall ecosystem service quality of the Loess Plateau [42,43]. In addition, Xu et al. [23] concluded based on the InVEST model that the soil conservation service capacity of the Jing River Basin improved after ecological conservation measures, such as GCHP. The proportion of good coupled regions gradually increased from 2005 to 2020. This may be related to human activities and climate change during the study period, consistent with previous studies [44]. In the 19th century, soil erosion rates on the Loess Plateau increased due to disturbances from human activities and interannual climate change [45]. However, with regard to the QFSI of the human–land relationship, the area of poor human–land relationship decreased between 2005 and 2020, with a QFSI of −0.746, in which there is mostly a flow to a general human–land relationship. Some of the general human–land relationship flows into the excellent human–land relationship flow. These basic characteristics of this study are consistent with the research results of Tan et al. [1] that the human–land relationship is constantly improving.
Identifying the impact of human activities on soil erosion can support regional soil and water conservation management and healthy development. It will be a long-term and gradual process to improve the coupling relationship between human activities and soil erosion, and the two will reach a good coupling state in order to achieve the goal of harmonizing the relationship between humans and the environment. Therefore, future policies should follow the principle of adapting measures to local conditions. For areas with strong human activities and high soil erosion, it is necessary to rationally allocate various land resources to avoid excessive reclamation and excessive use of land resources. Water and soil conservation measures such as dams and terraces should be implemented in the area. In areas with low human activity intensity and high soil erosion, environmental management and resource protection should be strengthened to enhance regional ecological resistance. For degraded land, vegetation restoration techniques can be used, such as artificial planting or natural vegetation growth to restore land vegetation. Shelter belts can also be established to reduce soil erosion. In some cases, there may be hydrologic factors unfavorable to afforestation in some areas. There is a practical need for a rational allocation of ecological conservation measures in the context of local economic development and urban planning. Due to the relationship between regional economy and soil erosion, it is possible to appropriately promote the development of cultural and tourism industries, increase the income of local residents, enhance their awareness of soil and water conservation, and reasonably develop land resources.
The quantification of HAI using the entropy weighting method has some limitations, which cannot take into account the cross-sectional effects between indicators [43]. The habitat of the WRB may face more anthropogenic influences than we have demonstrated, with studies suggesting that anthropogenic factors such as traffic volume and grazing intensity both impact the ecology [46,47]. Unfortunately, these factors must be excluded due to discontinuous inventory records. The above problems can lead to bias in the calculation of HAI [48]. Therefore, future work will comprehensively consider the impact of other factors on HAI, refine socio-economic indicators, and further explore the impact and contribution of regional industries to soil and water conservation. At the same time, we will improve the model to simulate the dynamic feedback process between human activities and soil erosion.

5. Conclusions

Anthropogenic disturbances to the ecosystem of the WRB will affect the spatial variation in soil erosion. Five types of landmark human activity factors were used to quantify the HAI from 2005 to 2020, and the spatiotemporal trends of HAI were explored from regional and provincial perspectives. Subsequently, the spatial–temporal variations of soil erosion in the WRB from 2005 to 2020 were quantified based on the RUSLE method, and the driving factors were analyzed using a geographical detector. Finally, based on the four-quadrant model, the coupling relationship between HAI and soil erosion was evaluated to identify areas with a low human–land relationship. The key findings can be summarized as follows:
(1) During the period of 2005–2020, the trend of soil erosion in the WRB shifted from high erosion levels to low erosion levels. Over the 15-year period, the erosion areas of moderate, high, strong, and severe decreased by 9.88%, 35.89%, 45.17%, and 70.05%, respectively. The areas of slight and weak erosion increased by 29.41% and 25.93%, respectively.
(2) HAI shows spatially strong southeast and weak northwest characteristics. The slight and weak HAI account for 80% in the northwest of the WRB, and the high HAI areas are mainly concentrated in the Shaanxi section.
(3) The overall human–land relationship in the WRB was generally stable and had a great improvement trend from 2005 to 2020. The proportion of general area in terms of the human–land relationship increased from 72.89% in 2005 to 78.44% in 2020. The distribution range of poor in the human–land relationship gradually shrank to about 3% of the study area.
Changes in regional economic and social factors, especially due to the implementation of ecological protection projects, may be the main reason for the improvement of human–land relationships across the region. The results are valuable for studying changes in human–land relations in the WRB and provide effective references for future ecosystem management.

Author Contributions

Conceptualization, Z.Z. and A.H.; methodology, Z.Z. and Q.L.; software, Z.Z. and Q.L.; validation, J.P., A.E. and A.H.; investigation, Z.Z. and Q.L.; data curation, Q.L. and M.E.-S.A.; writing—original draft preparation, Z.Z.; writing—review and editing, M.S.D.A.-H. All authors have read and agreed to the published version of the manuscript.

Funding

This research was funded by the National Natural Science Foundation of China (Grant No. 42261144749, 41790444 and 41877232); the Key Laboratory Open Project Fund of State Key Laboratory of Loess and Quaternary Geology, Institute of Earth Environment, CAS (Grant No. SKLLQG1909), Strategic Priority Program of the Chinese Academy of Sciences (No. XDA20030302); and Ningxia Natural Science Foundation of China (No. 2020AAC03476).

Institutional Review Board Statement

Research that does not involve humans or animals.

Informed Consent Statement

Research that does not involve humans or animals.

Data Availability Statement

Data will be made available on request.

Acknowledgments

The authors would like to extend their sincere appreciation to the National Natural Science Foundation of China (Grant No. 42261144749, 41790444 and 41877232); the Key Laboratory Open Project Fund of State Key Laboratory of Loess and Quaternary Geology, Institute of Earth Environment, CAS (Grant No. SKLLQG1909), Strategic Priority Program of the Chinese Academy of Sciences (No. XDA20030302); and Ningxia Natural Science Foundation of China (No. 2020AAC03476).

Conflicts of Interest

The authors declare that they have no known competing financial interests or personal relationships that could have appeared to influence the work reported in this paper.

References

  1. Tan, S.; Liu, Q.; Han, S. Spatial-temporal evolution of coupling relationship between land development intensity and resources environment carrying capacity in China. J. Environ. Manag. 2022, 301, 113778. [Google Scholar] [CrossRef]
  2. Barhagh, S.E.; Zarghami, M.; Ghale, Y.A.G.; Shahbazbegian, M.R. System dynamics to assess the effectiveness of restoration scenarios for the Urmia Lake: A prey-predator approach for the human-environment uncertain interactions. J. Hydrol. 2021, 593, 125891. [Google Scholar] [CrossRef]
  3. Zhang, S.; Fan, W.; Li, Y.; Yi, Y. The influence of changes in land use and landscape patterns on soil erosion in a watershed. Sci. Total Environ. 2017, 574, 34–45. [Google Scholar] [CrossRef]
  4. Singh, R.; Tiwari, K.N.; Mal, B.C. Hydrological studies for small watershed in India using the ANSWERS model. J. Hydrol. 2006, 318, 184–199. [Google Scholar] [CrossRef]
  5. Cunha, J.E.F.; Bravo, J.V.M. Effects of environmental protection policies on fragile areas of a watershed occupied by agriculture in the Brazilian Cerrado. J. Environ. Manag. 2022, 319, 115695. [Google Scholar] [CrossRef] [PubMed]
  6. Huo, A.; Yang, L.; Luo, P.; Cheng, Y.; Peng, J.; Nover, D. Influence of landfill and land use scenario on runoff, evapotranspiration, and sediment yield over the Chinese Loess Plateau. Ecol. Indic. 2021, 121, 107208. [Google Scholar] [CrossRef]
  7. Huo, A.; Yang, L.; Peng, J.; Cheng, Y.; Jiang, C. Spatial characteristics of the rainfall induced landslides in the Chinese Loess Plateau. Hum. Ecol. Risk Assess. 2020, 26, 2462–2477. [Google Scholar] [CrossRef]
  8. Luo, P.; Luo, M.; Li, F.; Qi, X.; Huo, A.; Wang, Z.; He, B.; Takara, K.; Nover, D.; Wang, Y. Urban flood numerical simulation: Research, methods and future perspectives. Environ. Model. Softw. 2022, 156, 105478. [Google Scholar] [CrossRef]
  9. Schiettecatte, W.; D´hondt, L.; Cornelis, W.; Acosta, M.; Leal, Z.; Lauwers, N.; Almoza, Y.; Alonso, G.; Díaz, J.; Ruíz, M.; et al. Influence of landuse on soil erosion risk in the Cuyaguateje watershed (Cuba). CATENA 2008, 74, 1–12. [Google Scholar] [CrossRef]
  10. Foucher, A.; Evrard, O.; Cerdan, O.; Chabert, C.; Lefèvre, I.; Vandromme, R.; Salvador-Blanes, S. Deciphering human and climatic controls on soil erosion in intensively cultivated landscapes after 1950 (Loire Valley, France). Anthropocene 2021, 34, 100287. [Google Scholar] [CrossRef]
  11. Mhaske, S.N.; Pathak, K.; Dash, S.S.; Nayak, D.B. Assessment and management of soil erosion in the hilltop mining dominated catchment using GIS integrated RUSLE model. J. Environ. Manag. 2021, 294, 112987. [Google Scholar] [CrossRef] [PubMed]
  12. Sreedevi, S.; Eldho, T.I.; Jayasankar, T. Physically-based distributed modelling of the hydrology and soil erosion under changes in landuse and climate of a humid tropical river basin. CATENA 2022, 217, 106427. [Google Scholar] [CrossRef]
  13. Zhang, Z.; Xu, W.; Li, L.; Huang, J.; Deng, L.; Wang, Q. Effects of temporal conservation measures on water erosion processes of disturbed soil accumulation in construction projects. J. Clean. Prod. 2021, 319, 128612. [Google Scholar] [CrossRef]
  14. Xu, Q.; Chen, W.; Zhao, K.; Zhou, X.; Du, P.; Guo, C.; Ju, Y.; Pu, C. Effects of land-use management on soil erosion: A case study in a typical watershed of the hilly and gully region on the Loess Plateau of China. CATENA 2021, 206, 105551. [Google Scholar] [CrossRef]
  15. Li, W.; Geng, J.; Bao, J.; Lin, W.; Wu, Z.; Fan, S. Analysis of Spatial and Temporal Variations in Ecosystem Service Functions and Drivers in Anxi County Based on the InVEST Model. Sustainability 2023, 15, 10153. [Google Scholar] [CrossRef]
  16. Sun, Y.; Liu, S.; Shi, F.; An, Y.; Li, M.; Liu, Y. Spatio-temporal variations and coupling of human activity intensity and ecosystem services based on the four-quadrant model on the Qinghai-Tibet Plateau. Sci. Total Environ. 2020, 743, 140721. [Google Scholar] [CrossRef]
  17. Jia, L.; Yao, S.; Deng, Y.; Li, Y.; Hou, G.; Gong, Z. Temporal and Spatial Characteristics of Soil Erosion Risk in Weihe River Basin and Its Geographical Exploration. J. Ecol. Rural Environ. 2021, 37, 305–314. [Google Scholar] [CrossRef]
  18. Li, N.; Zhang, Y.; Wang, T.; Li, J.; Yang, J.; Luo, M. Have anthropogenic factors mitigated or intensified soil erosion over the past three decades in South China? J. Environ. Manag. 2022, 302, 114093. [Google Scholar] [CrossRef]
  19. Wang, J.; Wang, Z.; Li, K.; Li, C.; Wen, F.; Shi, Z. Factors affecting phase change in coupling coordination between population, crop yield, and soil erosion in China’s 281 cities. Land Use Policy 2023, 132, 106761. [Google Scholar] [CrossRef]
  20. Liu, Y.; Zhao, Y.; Xu, G. Correlation between ecosystem services value and human activity intensity based on the four-quadrant model: A case study in the International Tourism and Culture Demonstration Area, the South Anhui Province. Acta Ecol. Sin. 2022, 42, 5200–5210. [Google Scholar]
  21. Xu, X.; Zhao, X.; Song, X. Impacts of the returning farmland to forest (grassland) project on ecosystem services in the Weihe River Basin, China. Chin. J. Appl. Ecol. 2021, 32, 3893–3904. [Google Scholar] [CrossRef]
  22. Hou, K.; Tao, W.; Wang, L.; Li, X. Study on hierarchical transformation mechanisms of regional ecological vulnerability and its applicability. Ecol. Indic. 2020, 114, 106343. [Google Scholar] [CrossRef]
  23. Xu, C.; Jiang, Y.; Su, Z.; Liu, Y.; Lyu, J. Assessing the impacts of Grain-for-Green Programme on ecosystem services in Jinghe River basin, China. Ecol. Indic. 2022, 137, 108757. [Google Scholar] [CrossRef]
  24. Sun, C.; Liu, Y.; Song, H.; Li, Q.; Cai, Q.; Wang, L.; Fang, C.; Liu, R. Tree-ring evidence of the impacts of climate change and agricultural cultivation on vegetation coverage in the upper reaches of the Weihe River, northwest China. Sci. Total Environ. 2020, 707, 136160. [Google Scholar] [CrossRef]
  25. Park, S.; Oh, C.; Jeon, S.; Jung, H.; Choi, C. Soil erosion risk in Korean watersheds, assessed using the revised universal soil loss equation. J. Hydrol. 2011, 399, 263–273. [Google Scholar] [CrossRef]
  26. Zhang, W.; Fu, J. Rainfall Erosivity Estimation Under Different Rainfall Amount. Resour. Sci. 2003, 25, 35–41. [Google Scholar]
  27. Williams, J.R.; Arnold, J.G. A system of erosion—Sediment yield models. Soil Technol. 1997, 11, 43–55. [Google Scholar] [CrossRef]
  28. Cao, S.; Ouyang, M.; Zhou, W. Quantitative evaluation of soil erosion in Ningxiang City based on GIS and USLE. J. China Agric. Univ. 2018, 23, 149–157. [Google Scholar]
  29. Almagro, A.; Thomé, T.; Colman, C.; Pereira, R.; Junior, J.; Rodrigues, D.; Oliveira, P. Improving cover and management factor (C-factor) estimation using remote sensing approaches for tropical regions. Int. Soil Water Conserv. Res. 2019, 7, 325–334. [Google Scholar] [CrossRef]
  30. Zhong, D. Study on Soil Erosion in Loess Hill and Gully Area on USLE Model: A Case Study of Wuqi County; Northwest A&F University: Xianyang, China, 2012. [Google Scholar]
  31. Wang, Q.; Wu, C.; Sun, Y. Evaluating corporate social responsibility of airlines using entropy weight and grey relation analysis. J. Air Transp. Manag. 2015, 42, 55–62. [Google Scholar] [CrossRef]
  32. Ma, S.; Xie, F.; Ding, C.; Zhang, H. Spatio-temporal change of landscape ecological quality and influencing factors based on four-quadrant model in overlapped area of cropland and coal production. Trans. Chin. Soc. Agric. Eng. 2020, 36, 259–268. [Google Scholar]
  33. Cheng, Y.; Huo, A.; Zhao, Z.; Peng, J. Analysis of loess fracture on slope stability based on centrifugal model tests. Bull. Eng. Geol. Environ. 2021, 80, 3647–3657. [Google Scholar] [CrossRef]
  34. Dotterweich, M. The history of human-induced soil erosion: Geomorphic legacies, early descriptions and research, and the development of soil conservation—A global synopsis. Geomorphology 2013, 201, 1–34. [Google Scholar] [CrossRef]
  35. Sun, W.; Shao, Q.; Liu, J. Soil erosion and its response to the changes of precipitation and vegetation cover on the Loess Plateau. J. Geogr. Sci. 2013, 23, 1091–1106. [Google Scholar] [CrossRef]
  36. Zhu, Y.; Luo, P.; Zhang, S.; Sun, B. Spatiotemporal Analysis of Hydrological Variations and Their Impacts on Vegetation in Semiarid Areas from Multiple Satellite Data. Remote Sens. 2020, 12, 4177. [Google Scholar] [CrossRef]
  37. Zhang, F.; Wang, Y.; Ma, X.; Wang, Y.; Yang, G.; Zhu, L. Evaluation of resources and environmental carrying capacity of 36 large cities in China based on a support-pressure coupling mechanism. Sci. Total Environ. 2019, 688, 838–854. [Google Scholar] [CrossRef] [PubMed]
  38. Zhang, P.; Yang, D.; Qin, M.; Jing, W. Spatial heterogeneity analysis and driving forces exploring of built-up land development intensity in Chinese prefecture-level cities and implications for future Urban Land intensive use. Land Use Policy 2020, 99, 104958. [Google Scholar] [CrossRef]
  39. Du, J.; Shi, C. Effects of climatic factors and human activities on runoff of the Weihe River in recent decades. Quat. Int. 2012, 282, 58–65. [Google Scholar] [CrossRef]
  40. Zhang, T.; Su, X.; Zhang, G.; Wu, H.; Wang, G.; Chu, J. Evaluation of the impacts of human activities on propagation from meteorological drought to hydrological drought in the Weihe River Basin, China. Sci. Total Environ. 2022, 819, 153030. [Google Scholar] [CrossRef]
  41. Xu, X.; Xu, Y. Analysis of spatial-temporal variation of human activity intensity in Loess Plateau region. Geogr. Res. 2017, 36, 661–672. [Google Scholar]
  42. Sun, D.; Li, H.; Dawson, R.; Tang, C.; Li, X. Characteristics of Steep Cultivated Land and the Impact of the Grain-for-Green Policy in China. Pedosphere 2006, 16, 215–223. [Google Scholar] [CrossRef]
  43. Wang, Y.; Zhao, J.; Fu, J.; Wei, W. Effects of the Grain for Green Program on the water ecosystem services in an arid area of China—Using the Shiyang River Basin as an example. Ecol. Indic. 2019, 104, 659–668. [Google Scholar] [CrossRef]
  44. Zhao, A.; Zhu, X.; Liu, X.; Pan, Y.; Zuo, D. Impacts of land use change and climate variability on green and blue water resources in the Weihe River Basin of northwest China. CATENA 2016, 137, 318–327. [Google Scholar] [CrossRef]
  45. Wang, X.; Wang, Z.; Xiao, J.; He, M.; Zhang, F.; Pan, Y.; Zhang, Y.; Jin, Z. Soil erosion fluxes on the central Chinese Loess Plateau during CE 1811 to 1996 and the roles of monsoon storms and human activities. CATENA 2021, 200, 105148. [Google Scholar] [CrossRef]
  46. Holden, P.B.; Ziervogel, G.; Hoffman, M.T.; New, M.G. Transition from subsistence grazing to nature-based recreation: A nuanced view of land abandonment in a mountain social-ecological system, southwestern Cape, South Africa. Land Use Policy 2021, 105, 105429. [Google Scholar] [CrossRef]
  47. Wang, X.; Birch, G.F.; Liu, E. Traffic emission dominates the spatial variations of metal contamination and ecological-health risks in urban park soil. Chemosphere 2022, 297, 134155. [Google Scholar] [CrossRef]
  48. Burkhard, B.; Müller, A.; Müller, F.; Grescho, V.; Anh, Q.; Arida, G.; Bustamante, J.; Chien, H.; Heong, K.; Escalada, M.; et al. Land cover-based ecosystem service assessment of irrigated rice cropping systems in southeast Asia—An explorative study. Ecosyst. Serv. 2015, 14, 76–87. [Google Scholar] [CrossRef]
Figure 1. Geographical location, elevation, and land use of the study area.
Sustainability 15 10785 g001
Figure 2. Chord chart of changes in different land-use types in the WRB from 2005 to 2020.
Sustainability 15 10785 g002
Figure 3. Spatial distribution of soil erosion from 2005 to 2020.
Sustainability 15 10785 g003
Figure 4. Degree of change in the stability rate of soil erosion intensity in different years ((A) represents the steady change of soil erosion in different years, (B) represents the change of soil erosion intensity and conversion rate in the Gansu section of the WRB, (C) represents the change of soil erosion intensity and conversion rate in the Ningxia section of the WRB, and (D) represents the soil erosion intensity and conversion rate in the Shaanxi section of the WRB rate change. Note: abscissa 1–6 represents the degree of erosion, with 1 representing slight and 6 representing severe).
Sustainability 15 10785 g004
Figure 5. Spatial–temporal variation characteristics of HAI.
Sustainability 15 10785 g005
Figure 6. Changes in HAI in different provinces ((a) the change of HAI in the three provinces in 2005; (b) the change of HAI in the three provinces in 2010; (c) the change of HAI in the three provinces in 2015; (d) the change of HAI in the three provinces in 2020. Note: The columns represent the proportion of each province to the total HAI. The pie chart represents the proportion of each province in the same HAI, and the orange circle represents the proportion of each type of HAI).
Sustainability 15 10785 g006
Figure 7. Variable correlation and interaction between 2005 and 2020 ((a) Driver correlations in 2005, (b) Driver correlations in 2010, (c) Driver correlations in 2015, (d) Driver correlations in 2020. Note: * represents p less than 0.05, F1 represents POP, F2 represents PANDA, F3 represents crop, and F4 represents GDP).
Sustainability 15 10785 g007
Figure 8. Spatial distribution and changes in human–land relationship coupling in the WRB in 2005, 2010, 2015, and 2020.
Sustainability 15 10785 g008
Figure 9. Dynamic changes in different coupling levels during different periods (2005–2010, 2010–2015, 2015–2020, and 2005–2020).
Sustainability 15 10785 g009
Table 1. Detailed description of data.
DataResolution Time PeriodSource
DEM90 m2005, 2010, 2015, 2020http://www.gscloud.cn/search
NDVI250 m2005, 2010, 2015, 2020https://ladsweb.modaps.eosdis.nasa.gov
Monthly rainfall data1 km2005, 2010, 2015, 2020http://www.geodata.cn/
Land use500 m2005, 2010, 2015, 2020http://www.ncdc.ac.cn
Soil1:1 million2009http://www.ncdc.ac.cn
Population1 km2005, 2010, 2015, 2020https://www.worldpop.org/
GDP1 km2005, 2010, 2015http://www.resdc.cn/
Cropland3 km2007, 2011, 2015, 2020https://glad.umd.edu/dataset/croplands
PANDA1 km2005, 2010, 2015, 2020http://data.tpdc.ac.cn
Table 2. Weight assignment results.
IndicatorDirectionWeight
PopulationPositive0.29
GDPPositive0.26
CroplandPositive0.12
PANDAPositive0.33
Table 3. Four-quadrant zoning table of HAI and soil erosion.
QuadrantFirst QuadrantSecond QuadrantThird QuadrantFourth Quadrant
HAI0.106–0.8750–0.1060–0.1060.106–0.875
Soil erosion19,044.43–231,253.7819,044.43–231,253.780–19,044.430–19,044.43
Human–environment interactionGoodPoorGeneralExcellent
Table 4. Area proportions of different soil erosion levels in the WRB from 2005 to 2020.
SlightWeakModerateHighStrongSevereAverage Erosion Modulus
200551.56%8.56%9.38%7.64%9.25%13.61%6363.49
201056.13%9.38%8.77%6.54%7.92%11.25%5451.36
201568.91%9.63%7.33%4.51%4.89%4.72%2571.37
202066.72%10.78%8.45%4.90%5.07%4.08%2539.06
Table 5. QFSI with different coupling levels in different periods.
PoorGeneralGoodExcellent
2005–2010−0.2280.024−0.0750.536
2010–2015−0.6960.495−0.5780.040
2015–2020−0.1890.0230.5170.236
2005–2020−0.7460.396−0.1390.592
Disclaimer/Publisher’s Note: The statements, opinions and data contained in all publications are solely those of the individual author(s) and contributor(s) and not of MDPI and/or the editor(s). MDPI and/or the editor(s) disclaim responsibility for any injury to people or property resulting from any ideas, methods, instructions or products referred to in the content.

