Article

A Simplified Equation for Calculating the Water Quality Index (WQI), Kalu River, Sri Lanka

by
Kushan D. Siriwardhana
1,
Dimantha I. Jayaneththi
1,
Ruchiru D. Herath
1,
Randika K. Makumbura
1,
Hemantha Jayasinghe
2,
Miyuru B. Gunathilake
3,4,
Hazi Md. Azamathulla
5,
Kiran Tota-Maharaj
6 and
Upaka Rathnayake
7,*
1
Water Resources Management and Soft Computing Research Laboratory, Millennium City, Athurugiriya 10150, Sri Lanka
2
Central Environmental Authority, Denzil Kobbekaduwa Mawatha, Battaramulla 10120, Sri Lanka
3
Hydrology and Aquatic Environment, Environment and Natural Resources, Norwegian Institute of Bioeconomy and Research, 1433 Ås, Norway
4
Water, Energy, and Environmental Engineering Research Unit, Faculty of Technology, University of Oulu, P.O. Box 8000, FI-90014 Oulu, Finland
5
Department of Civil Engineering, Faculty of Engineering, University of the West Indies, St. Augustine P.O. Box 331310, Trinidad and Tobago
6
Department of Civil Engineering, School of Infrastructure & Sustainable Engineering, College of Engineering and Physical Sciences, Aston University Birmingham, Aston Triangle, Birmingham B4 7ET, UK
7
Department of Civil Engineering and Construction, Faculty of Engineering and Design, Atlantic Technological University, F91 YW50 Sligo, Ireland
*
Author to whom correspondence should be addressed.
Sustainability 2023, 15(15), 12012; https://doi.org/10.3390/su151512012
Submission received: 22 May 2023 / Revised: 29 July 2023 / Accepted: 2 August 2023 / Published: 4 August 2023
(This article belongs to the Special Issue Hydrosystems Engineering and Water Resource Management)

Abstract

:
The water supply system plays a major role in the community. The water source is carefully selected based on quality, quantity, and reliability. The quality of water at its sources is continuously deteriorating due to various anthropogenic activities and is a major concern to public health as well. The Kalu River is one of the major water resources in Sri Lanka that supplies potable water to the Kalutara district (a highly populated area) and Rathnapura district. But, there has been no significant research or investigation to examine anthropogenic activities in the river. Due to this, it is difficult to find any proper study related to the overall water quality in the Kalu River. Therefore, this study covers a crucial part related to the water quality of the Kalu River. The spatiotemporal variation of river water quality is highly important not only to processing any treatment activities but also to implementing policy decisions. In this context, water quality management is a global concern as countries strive to meet the United Nations Sustainable Development Goal 6, which aims to ensure the availability and sustainable management of water and sanitation for all. Poor water quality can have severe consequences on human health, ecosystems, and economies. Contaminated water sources pose risks of waterborne diseases, reduced agricultural productivity, and ecological imbalances. Hence, assessing and improving water quality is crucial for achieving sustainable development worldwide. Therefore, this paper presents a comprehensive analysis of spatiotemporal analysis of the water quality of the Kalu River using the water quality data of eight locations for 6 years from 2017 to 2023. Nine water quality parameters, including the pH, electrical conductivity, temperature, chemical oxygen demand, biological oxygen demand, total nitrate, total phosphate, total sulfate, total chlorine, and hardness, were used to develop a simple equation to investigate the water quality index (WQI) of the river. Higher WQI values were not recorded near the famous Kalutara Bridge throughout the years, even though the area is highly urbanized and toured due to religious importance. Overall, the water quality of the river can be considered acceptable based on the results of the WQI. The country lockdowns due to COVID-19 might have impacted the results in 2020; this can be clearly seen with the variation of the annual WQI average, as it clearly indicates decreased levels of the WQI in the years 2020 and 2021, and again, the rise of the WQI level in 2022, as this time period corresponds to the lockdown season and relaxation of the lockdown season in the country. Somehow, for most cases in the Kalu River, the WQI level is well below 25, which can be considered acceptable and suitable for human purposes. But, it may need some attention towards the areas to find possible reasons that are not in the range. Nevertheless, the results suggest the importance of continuous water quality monitoring in the Kalu River.

1. Introduction

Water is probably the most important resource in the world. Water resources directly impact the socio-economic development of society [1]. Therefore, the quality and quantity of a water supply system is important. Water is not only used for domestic purposes but also for industrial purposes, including farming. It has been used for agricultural purposes and fisheries by farmers and fishermen for their occupations for centuries in the world. It is also used for leisure activities, such as swimming, rafting, water polo, etc., all around the world. Not only that, many of the major tourist attractions of the world have always been the ocean, rivers, lakes, and waterfalls. Therefore, surface water has been exposed and exploited due to various human activities. Since water plays a major role in day-to-day human life, it should be protected from pollution at any cost [2]. However, some countries only treat potable water in urban areas. Most of the rural areas use raw water as it is. This practice can be seen in most of the developing countries. In addition, water quality monitoring is highly important in water distribution networks and combined sewer networks to understand the receiving water qualities. Much research work has been carried out using multi-objective optimization techniques in the design stage, as well as in the controlling stage, of these distribution networks [3,4].
Mining, livestock farming, production, and disposal of waste (industrial, municipal, and agricultural) are considered leading causes of anthropogenic activities in the river that affect water quality in general [5,6,7]. Due to the land use changes, it is also possible to register heavy metal pollution in the water bodies [8]. Numerous studies have also shown that, over the past few years, the impact of various industries on surface water has increased significantly, with a focus on the crucial factors that overexploited the quality of the water’s surface [1,9]. However, only a small percentage of generated wastewater is treated, but the majority is untreated and immediately discharged into streams and other water bodies [10]. In addition, polluted stormwater directly accumulates in river systems and worsens the water quality [11,12,13]. Most developing countries do not have policies on wastewater treatment; thus, waste loads are dumped into the water bodies. Therefore, significant issues with water resources can be observed in developing countries [14,15,16].
Measuring water quality in natural water bodies is challenging due to many reasons, including accessibility [17], lack of technology [18], and financial limitations [19]. In addition, the number of samples required to have a clear interpretation of the water quality is important [20]. Furthermore, continuous measurements are required to understand the temporal changes in the water quality [21]. Some of the important water bodies are continuously monitored for water quality due to their high importance [22]. The measurements are taken on an hourly basis [23,24,25,26]. However, these parameters were analyzed as a single index in some of the cases.
The water quality index (WQI) is a single numerical index used to express the overall quality of water based on a set of parameters [27,28,29,30,31,32]. The WQI is an important tool for assessing the water quality of a particular water body, as it provides a quick and easy way to understand the overall health of the water body [33]. WQI models are based on aggregation functions that enable an analysis of sizable datasets of water quality that vary both temporally and spatially to produce a single value, the water quality index, that represents the caliber of the water body. They convert complicated water quality datasets into a single value measure known as the water quality index, which makes it simpler to understand for both suppliers and users [34]. Among the different methods for calculating the WQI, the weighted arithmetic index method has gained popularity due to its simplicity and effectiveness [35,36]. The weighted arithmetic index method allows for the customization of the index to the specific water quality context, making it more relevant and accurate for local water quality assessments using available parameters [37].
Anthropogenic activities across every continent endanger the quality of both surface water and groundwater [38,39,40,41]. Over five billion people worldwide rely on groundwater and surface water systems for a variety of purposes, including potable water, housing, crop production, and manufacturing applications [37,42]. The quality of surface water and the quality of groundwater are at a threat due to anthropogenic activities all over the world. Water resource degradation is a well-studied phenomenon that can be caused by natural processes (climate change, water–rock interactions, and geological factors), as well as human activity (agriculture practices and urban waste), and the presence of significant chemical compounds since the Industrial Revolution [43]. Apart from anthropogenic activities, natural rock/soil heterogeneities interact with water, influencing natural water cycles and affecting the water quality across all domains [44]. The quality of water is at an alarming rate all over the world, according to the WHO/UNICEF Joint Monitoring Program (JMP), especially in Ethiopia, Papua New Guinea, The Republic of Chad, Uganda, the Democratic Republic of the Congo, etc. [45], and especially in the African region and Asian regions, this issue is critical [46,47] when considering that Asian countries like Pakistan, China, India, Bangladesh, and Iran are suffering from water scarcity for quality usable portable water due to different anthropogenic activities [48]. Therefore, developing a WQI for all main surface water bodies and groundwater is very important to ensure that all people have good-quality water. The development of a standardized index would allow for consistent monitoring and evaluation of water quality on a global scale. This would enable countries to identify trends, track changes over time, and compare their water quality with that of other regions. By having a clear understanding of the state of their water resources, nations can develop targeted strategies to address specific issues and prioritize interventions based on the severity and urgency of the problems identified.
Similar circumstances have happened in Sri Lanka, where the quality of both the surface water and the groundwater has drastically deteriorated in the last 2–3 decades. One of the primary causes of Sri Lanka’s rapidly declining water quality is rapid and unmitigated industrialization [49,50,51]. This can be clearly seen from the downstream waters of the Kelani River, which is one of the most important rivers in Sri Lanka [52,53]. Sri Lanka has a rich radial river network; however, improper management of water resources has caused some water quality issues in the recent past.
The Kalu River is significant in Sri Lanka, which is subjected to various anthropogenic activities that affect the ecological and socio-economic values of the river. Around the Kalu River, major industries and factories are located, including gem mining, sand extraction, textile manufacturers, raw rubber production facilities, food and dairy industries, wood plywood manufacturing facilities, steel production, chemical manufacturers, fertilizer production, tire factories, and other commercial industries. However, the Kalu River has been designated as one of the least contaminated rivers in Sri Lanka [54]. The Kalu River is the main source of water supply for the Ratnapura and Kaluthara districts. This study addresses a significant gap in the existing literature by investigating the impact of anthropogenic activities on the Kalu River and providing the first comprehensive assessment of the water quality in this context.
Therefore, the drinking water users in the Rathnapura and Kaluthara districts might be under threat, and solid research is required to study and implement mitigation practices to reduce water pollution. It will be very useful to provide safe drinking water for the community. However, this study is designed to deliver a comprehensive picture of the water quality along the Kalu River as a simple index. There have been several studies on the water quality levels of the Kalu River [17,55]; however, this research is the first study to look at the water quality of the Kalu River using the WQI. Therefore, the findings of this research would be helpful in understanding the spatiotemporal state-of-the-art of water levels in the Kalu River, Sri Lanka.

2. Study Area and Methodology
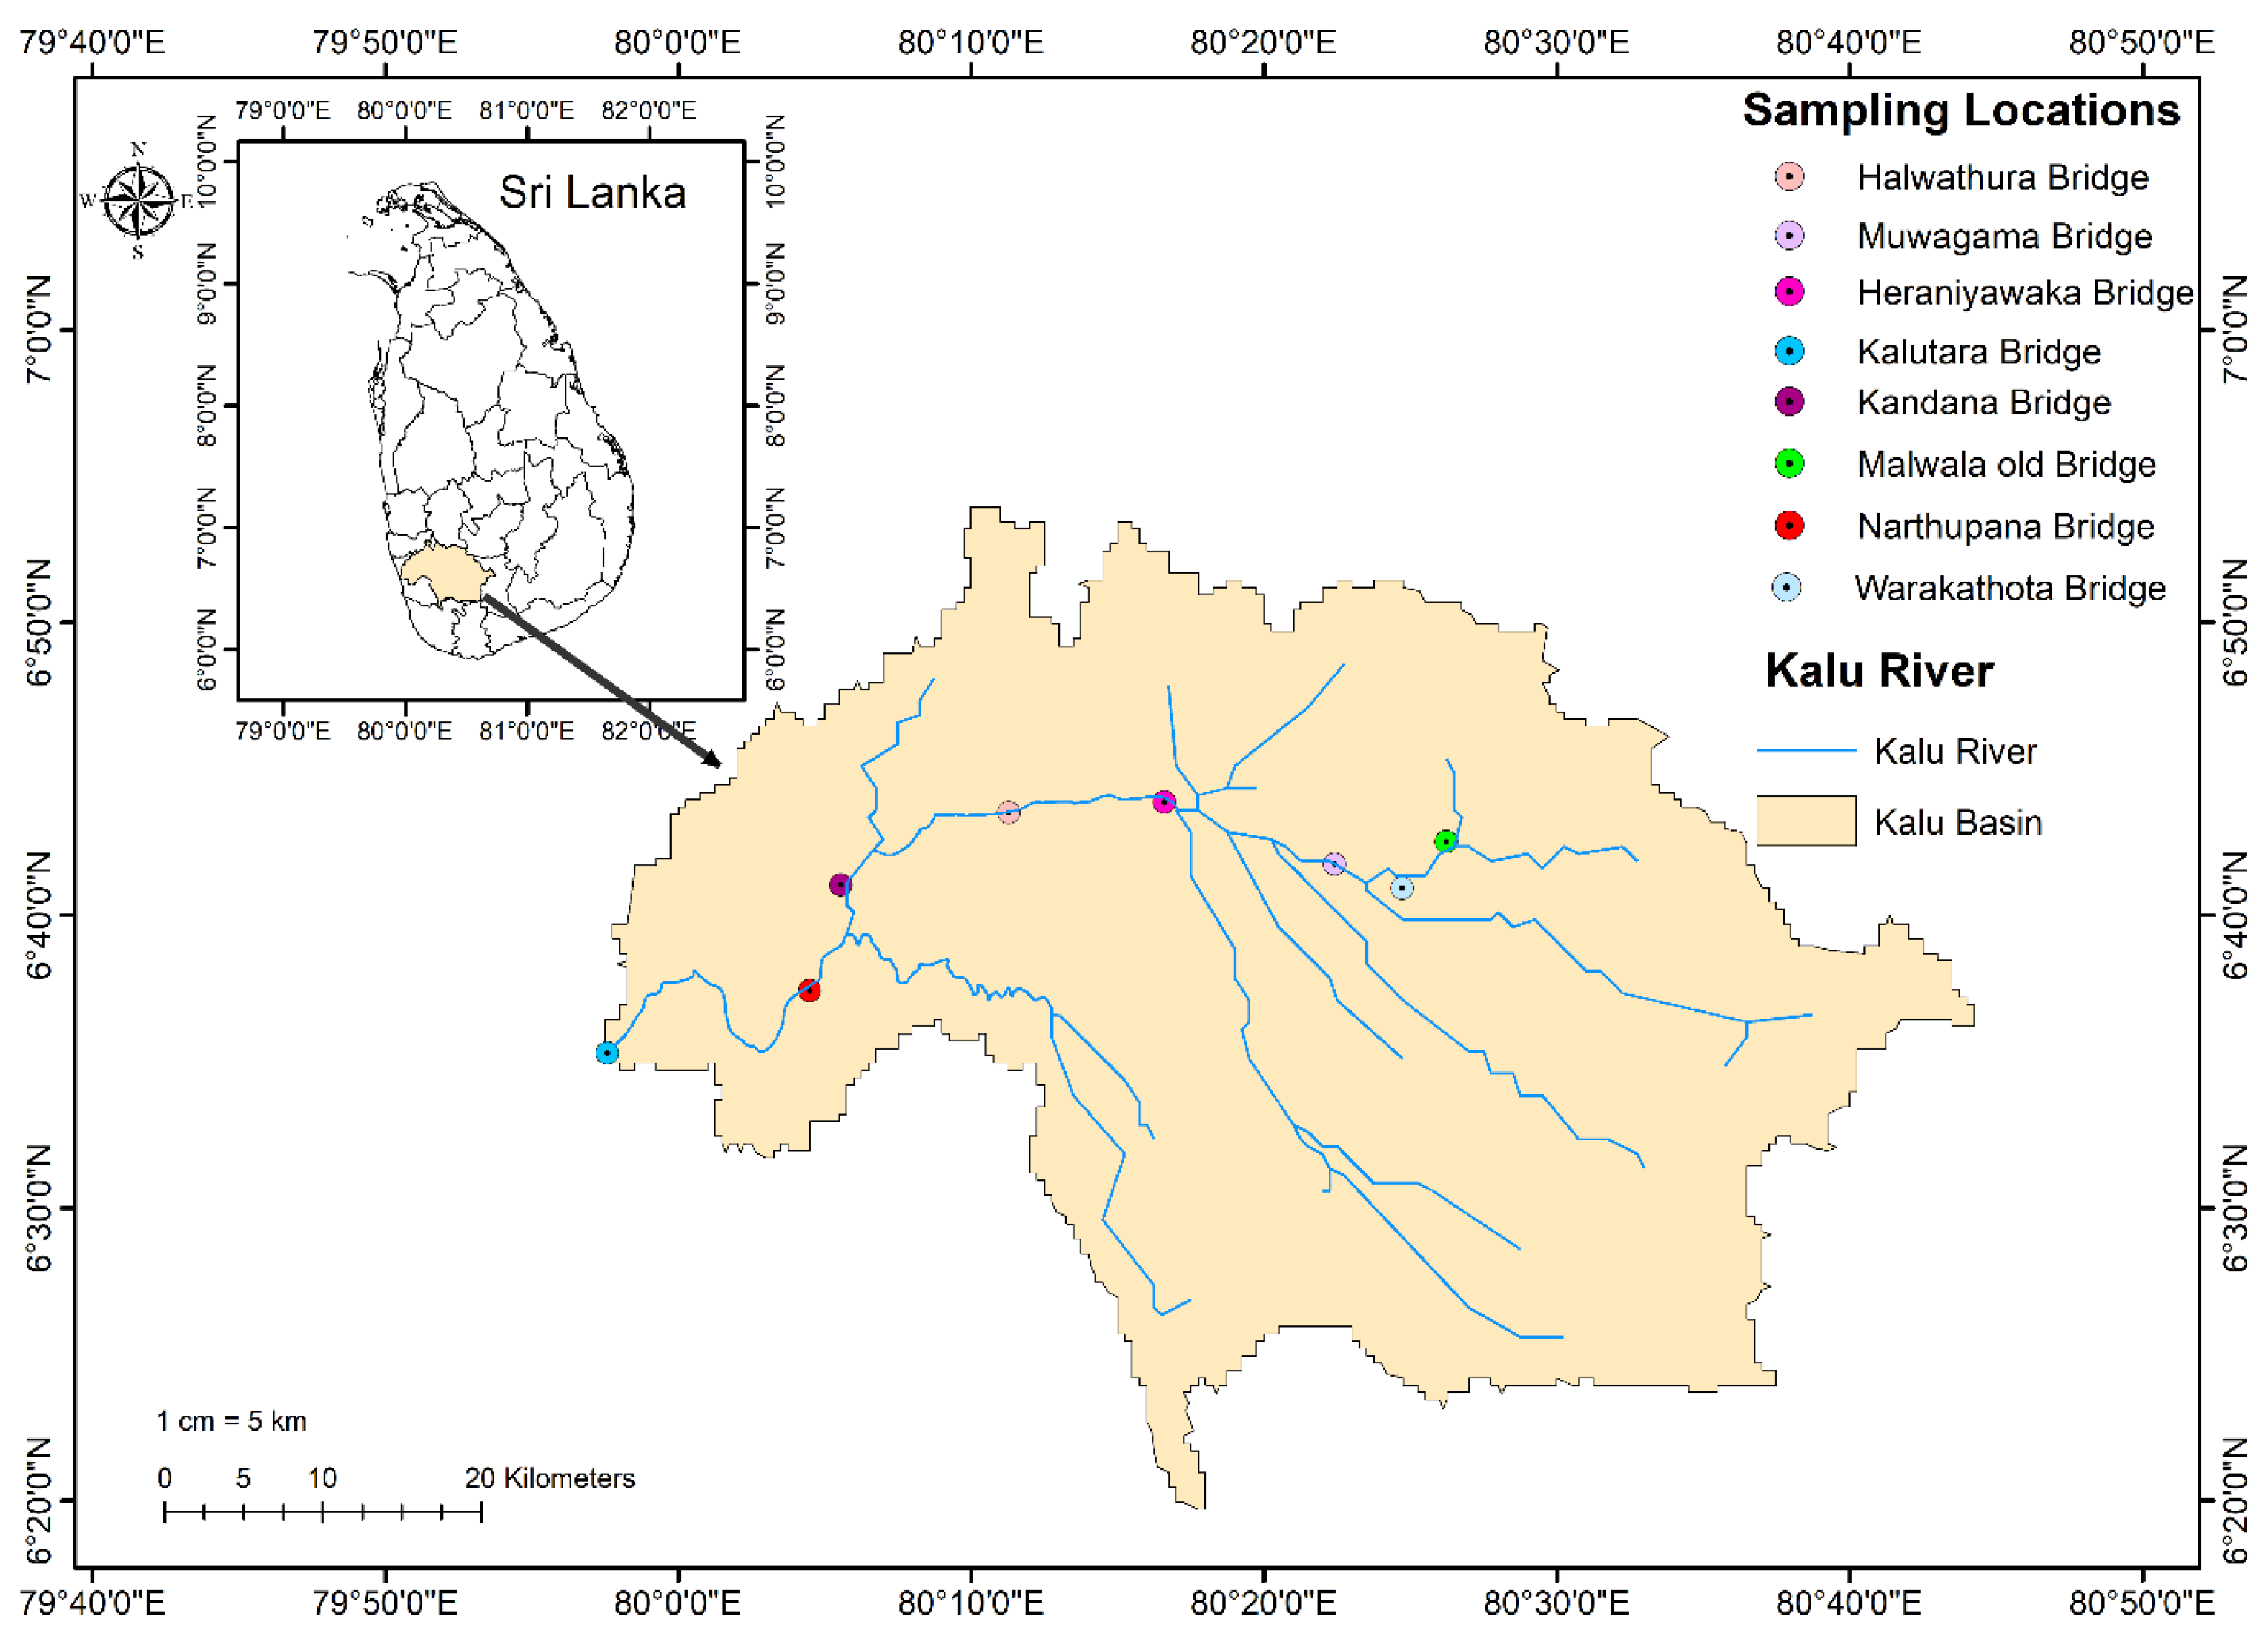
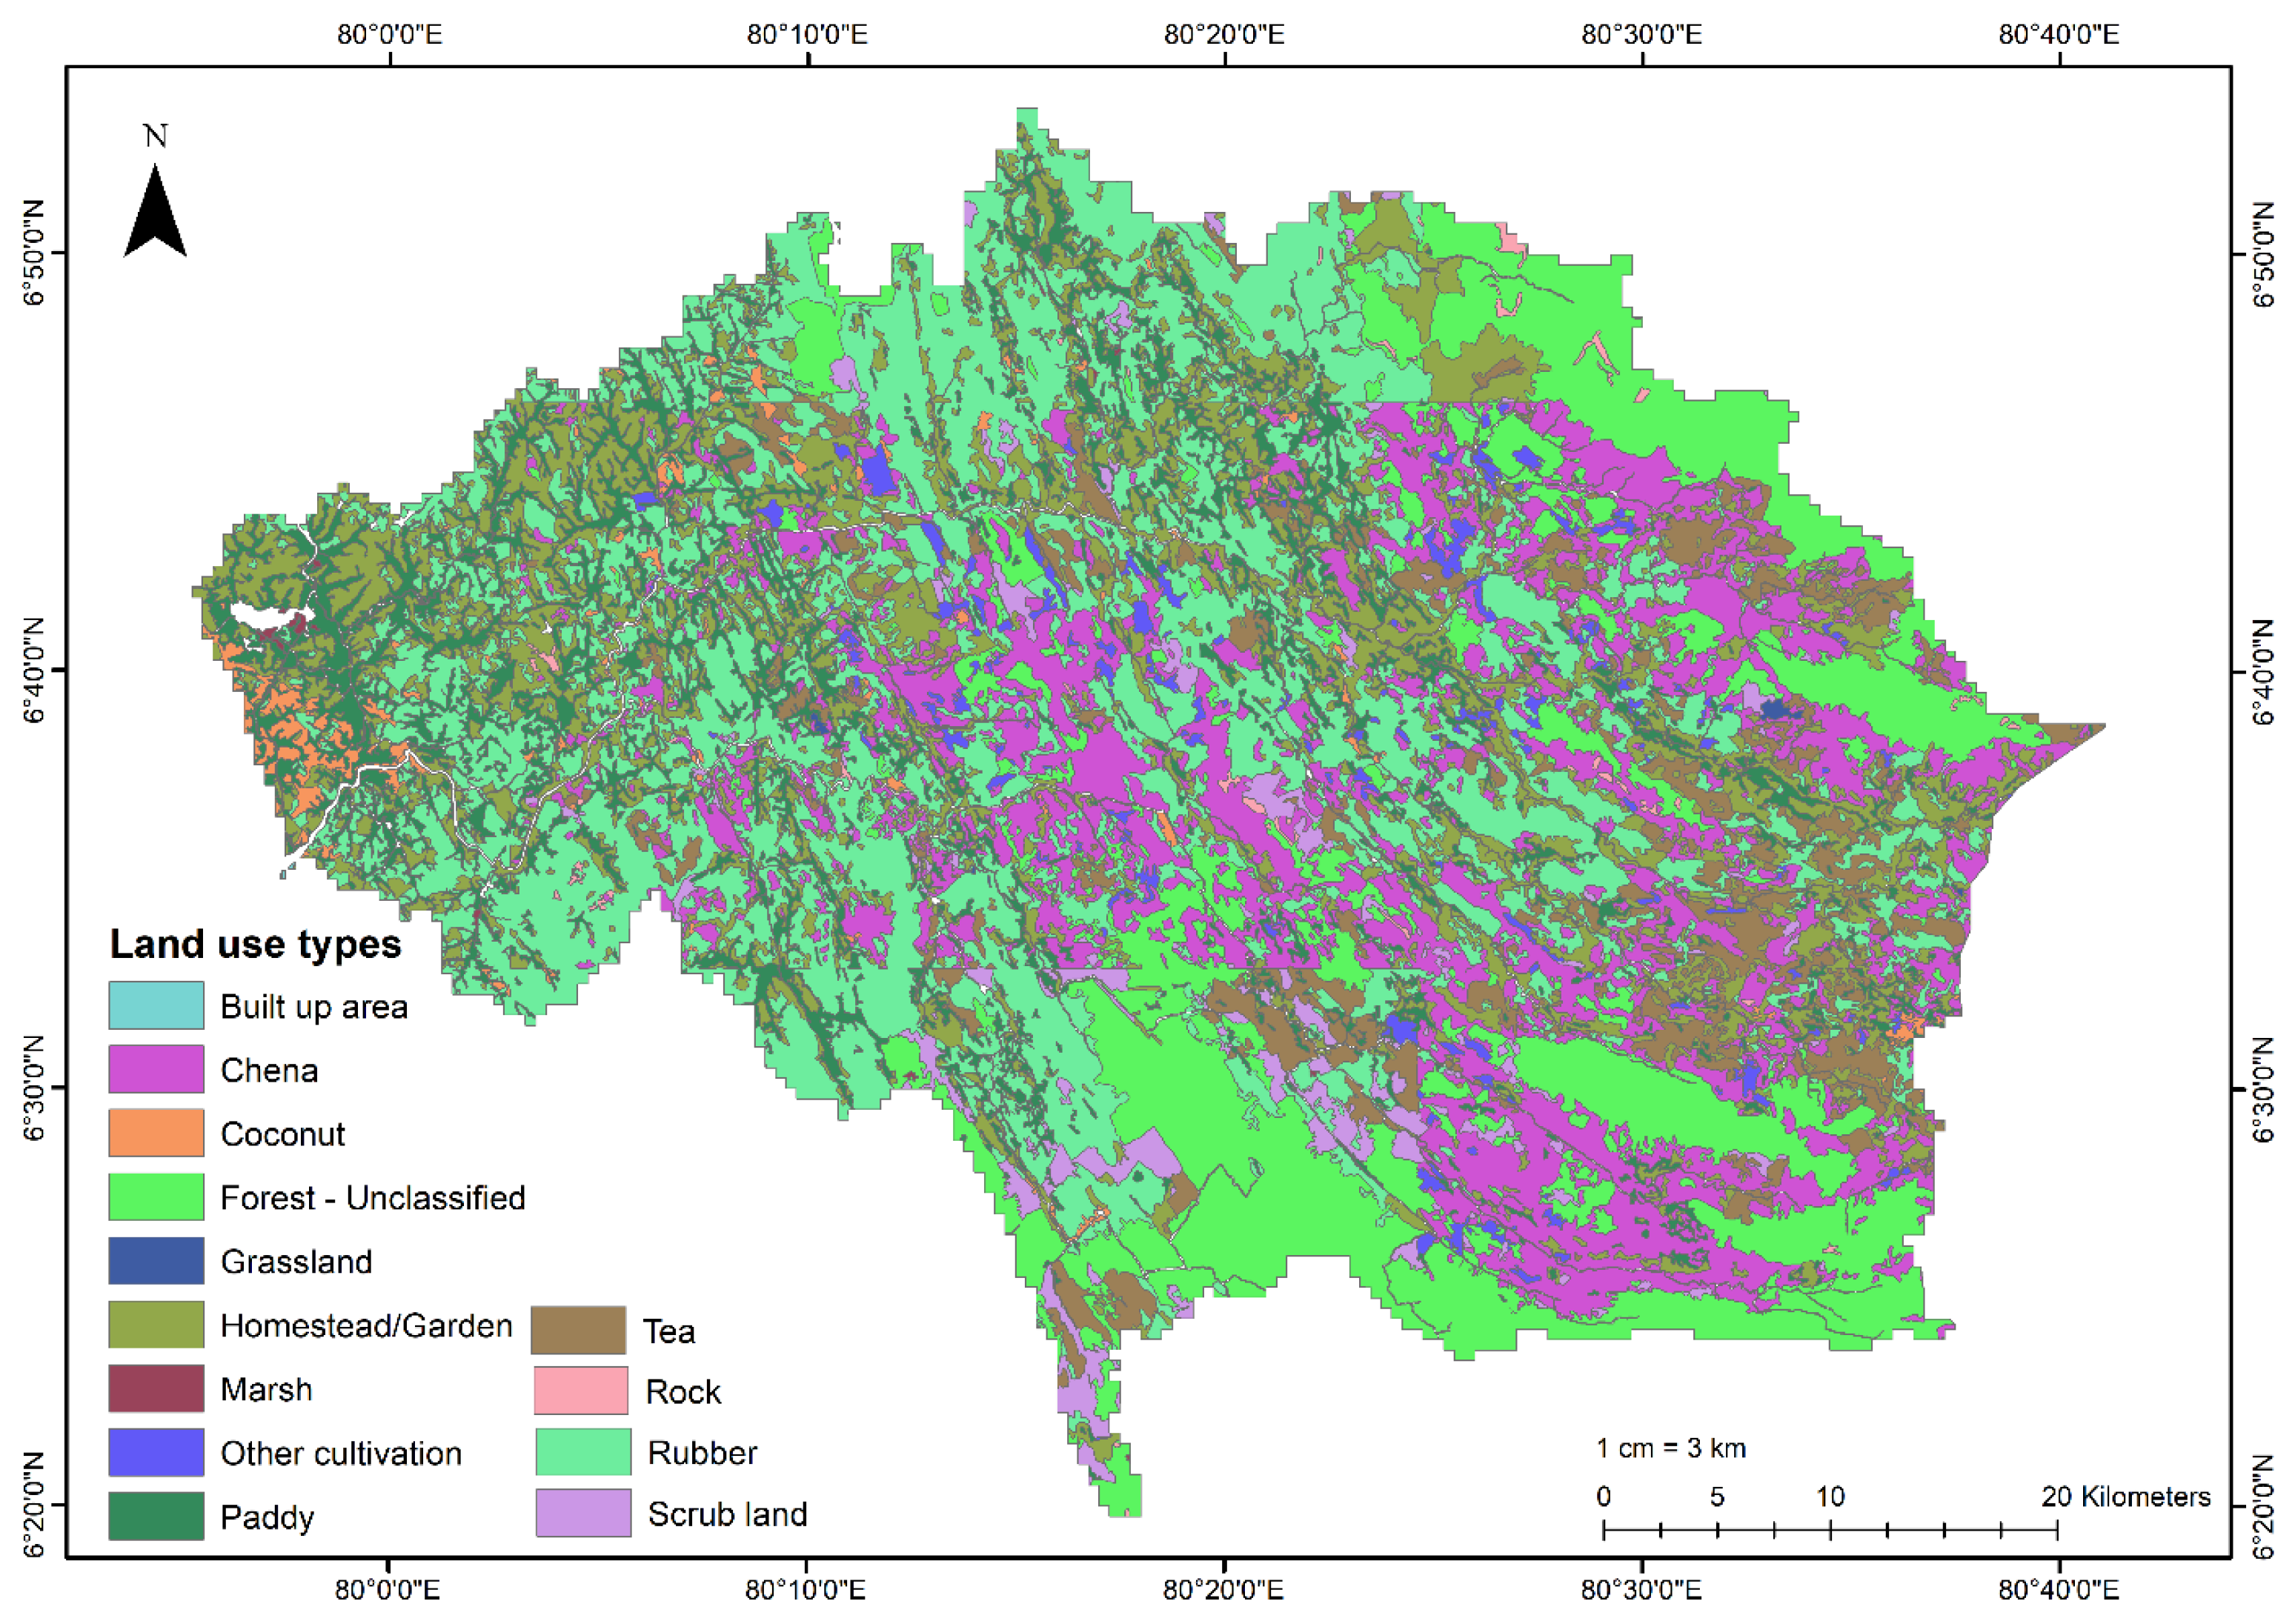
2.1. Study Area

The Kalu River basin (2766 km2) is located in the southwestern part of Sri Lanka (refer to Figure 1). The river length is about 129 km long and extends from 80.00° to 80.67° E and 6.42° to 6.83° N. The Kalu River starts in the central hills of the country at an altitude of 2250 m and runs into the Indian Ocean near Kalutara after traveling through one of the highest rainfall-receiving areas of the country [56]. The annual average rainfall in the Kalu River basin is about 4000 mm and has an annual flow of 4000 million m3 [57]. The Kalu River is one of the most important rivers in Sri Lanka, as it is the main water source for the Ratnapura and Kaluthra districts.
The major land use is forest, residential, and agricultural cropland along the river [58]. The other main uses of the Kalu River are for transportation, irrigation, fisheries, tourism, and hydropower generation. Figure 2 shows the land use of the Kalu River. Urbanized patches can be identified in the catchment; however, it is comparably less urbanized. Therefore, this is one of the lush catchments in Sri Lanka.

2.2. Water Quality Data

The water quality data of the Kalu River were available and collected from the Central Environmental Authority (CEA), Sri Lanka, for seven sampling sites: (1) Sri Palabaddala Bridge, (2) Geleemale Bridge, (3) Malwana Bridge, (4) Warakathota Bridge, (5) Muwagama bridge, (6) Kurugammodara Bridge, and (7) Ella Bridge (refer to Figure 1). These water quality data are available for six years at monthly intervals (i.e., from January 2017 to December 2022). Only one set of water quality measurements was taken per month due to various reasons, as described in the Section 1 (keeping a minimum of two replicates); financial and technical issues are the major of them.
Ten commonly used water quality parameters including the pH, chemical oxygen demand (COD/(mg/L)), biochemical oxygen demand (BOD/(mg/L)), total nitrate (NO3/(mg/L), total phosphate (PO42−/(mg/L), dissolved oxygen (DO/(mg/L)), temperature (°T), electric conductivity (EC (mS/cm)), and chloride (Cl/(mg/L), were measured, and data were collected for this analysis. Many researchers have used these commonly used water quality parameters for WQI calculations [1,59,60,61,62].

2.3. Water Quality Index (WQI) Model Development

As it was stated in the Section 1, the WQI has been used by many researchers. The WQI is developed using the weighted arithmetic index method and given in Equation (1).
W Q I = Σ Q i W i Σ W i
where Q i is the water quality rating of the i t h water quality parameter, and W i ( Σ W i = 1 ) is the unit weight of the i t h water quality parameter. The quality rating, Q i , can be calculated using Equation (2).
Q i = 100 V i V 0 S i V 0
where V i is the actual amount of the i t h parameter, V 0 represents the ideal value of the parameter V 0 = 0 , except for the pH V 0 = 7 and DO V 0 = 14.6   m g / L , and S i is the standard allowable value for the i t h parameter. The unit weight ( W i ) is calculated using Equation (3).
W i = K S i ;           K = 1 Σ ( 1 S i )
The term K is a proportional constant and is calculated as per Equation (4). The water quality status (WQS), based on the WQI rating, is presented in Table 1 [61]. The intended use based on the WQS is also given in the same table.
The WQI was calculated using the water quality concentrations at the 7 sampling sites. The Sri Lankan standards of SLS614 (National Environmental Act No. 47 of 1980) [63] were used to interpret the findings of the analysis carried out. Finally, a regression model was developed using R Project (statistical computing) to implement a simple mathematical function for the WQI for the Kalu River. Data from 2017 to 2021 were used to train the water quality model, and data from 2022 to 2023 were used to validate the output results from this model.

3. Results and Discussion

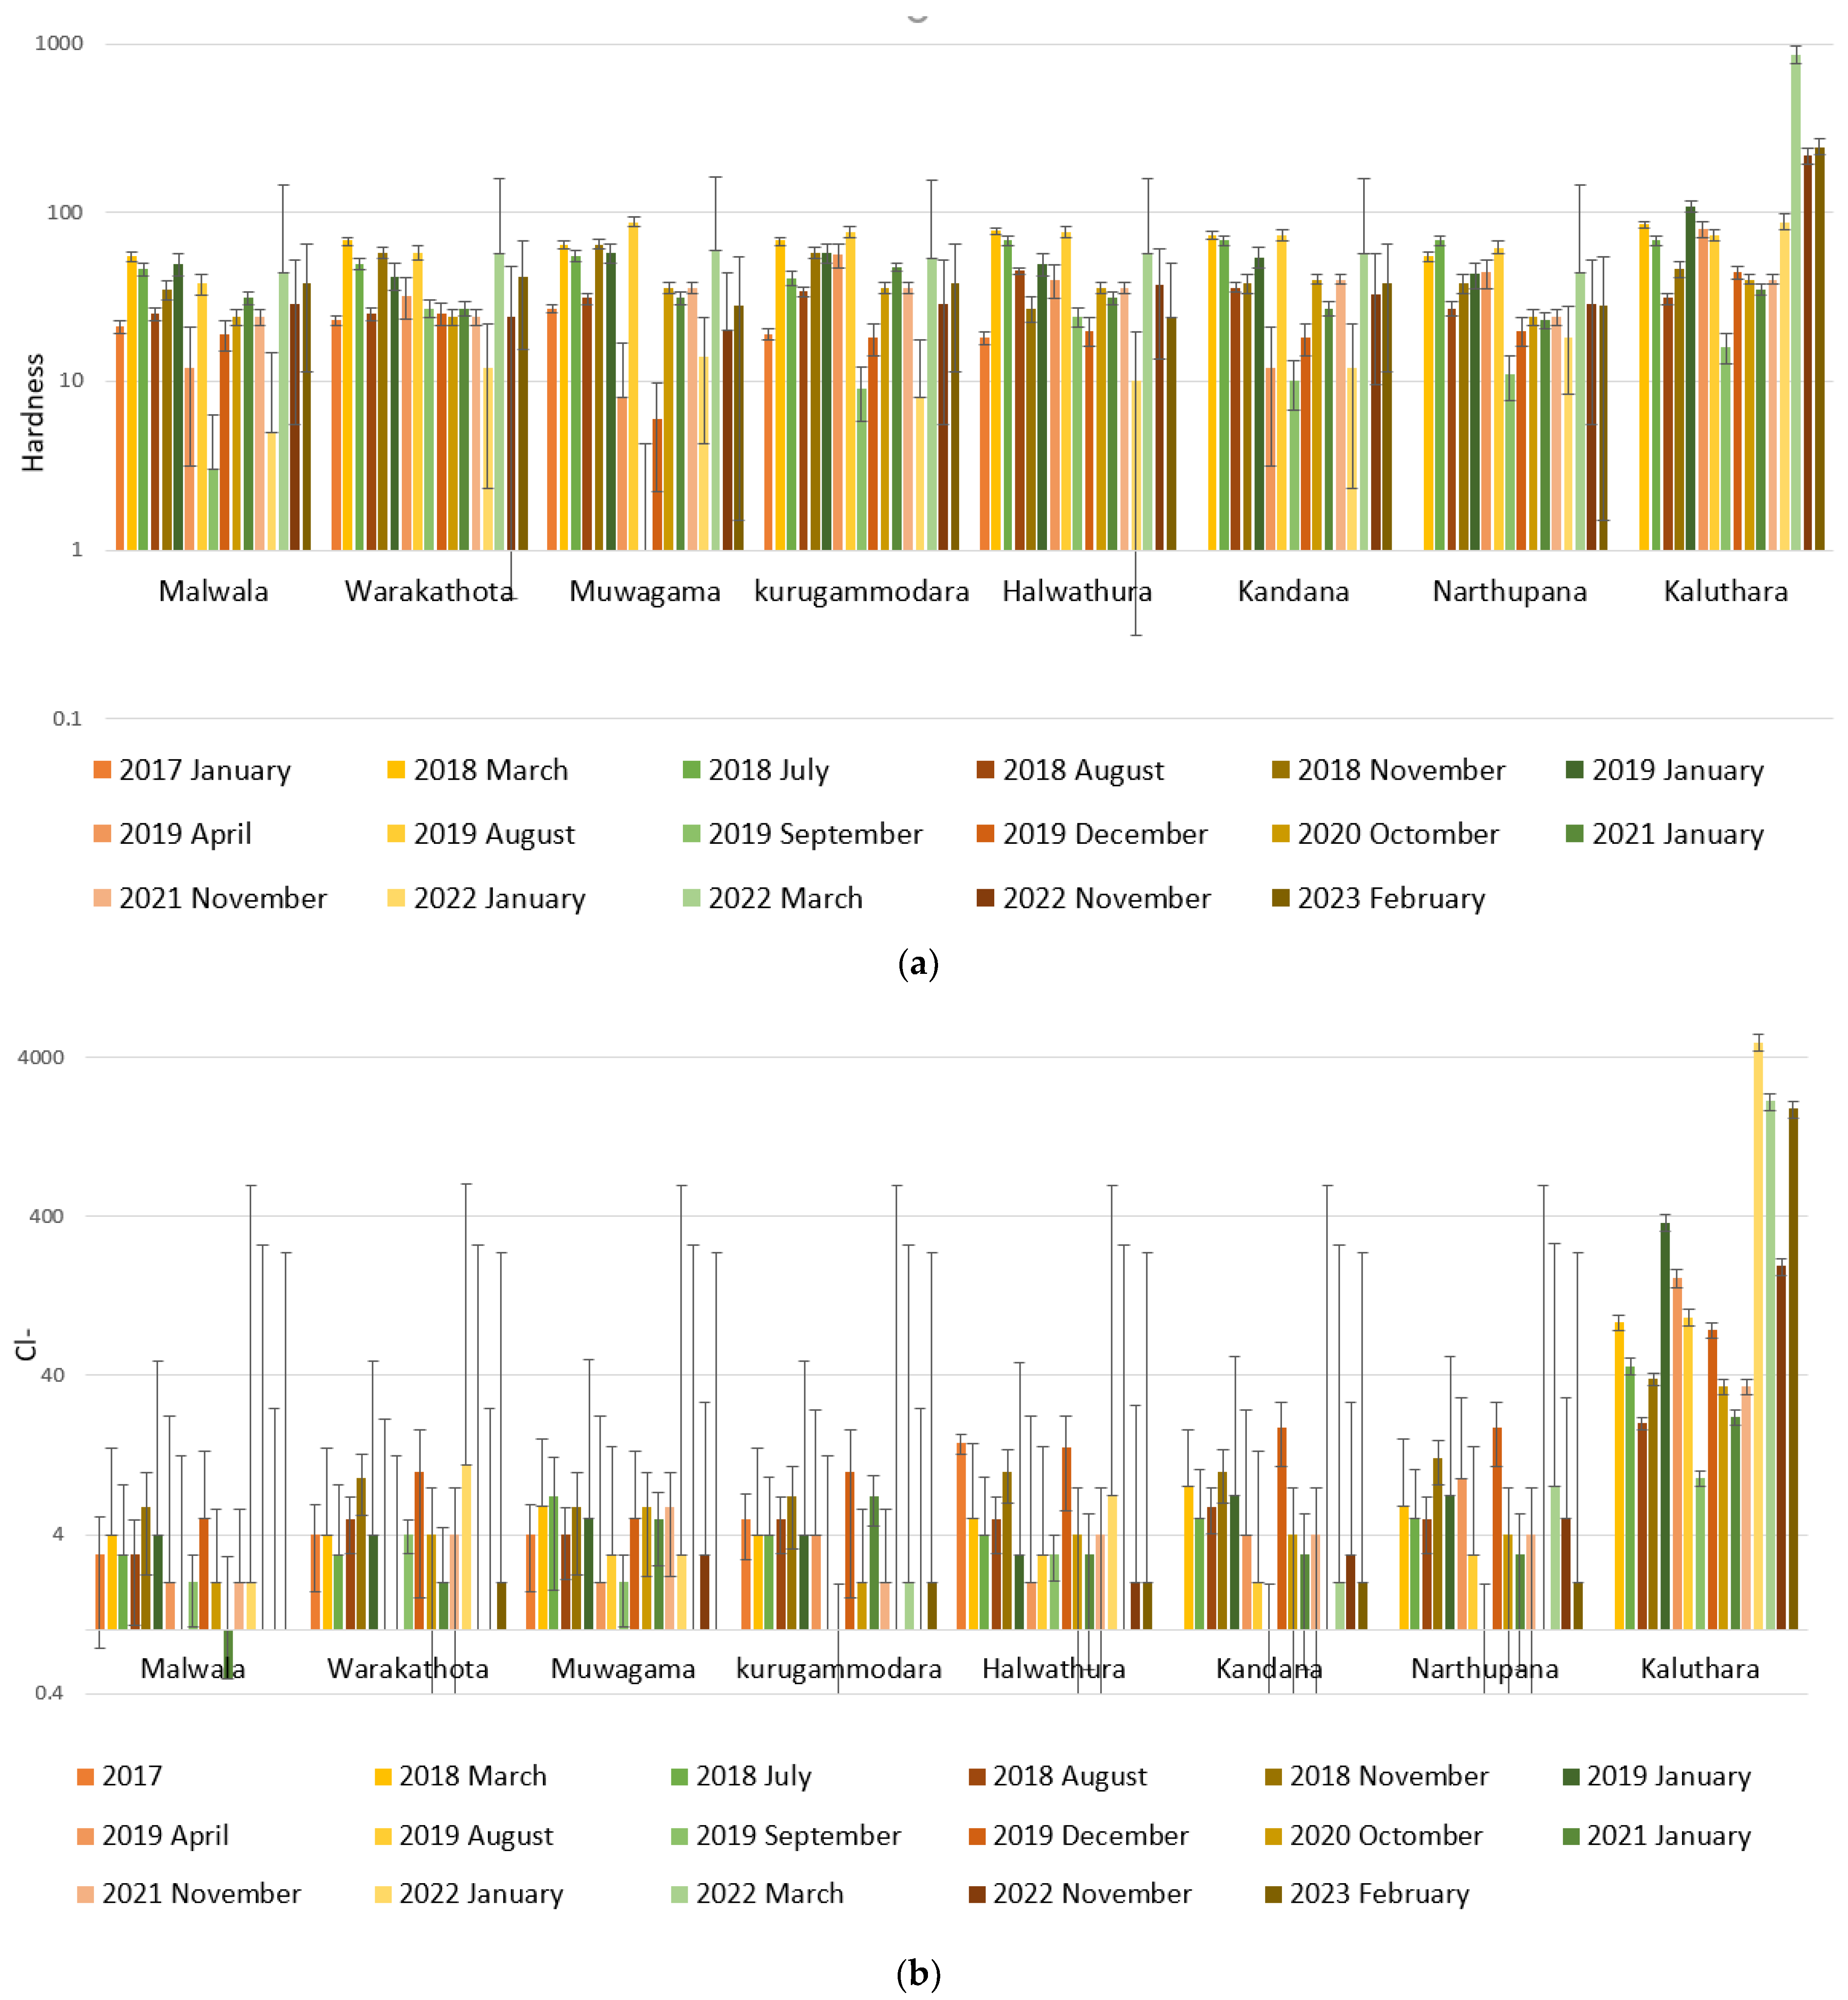
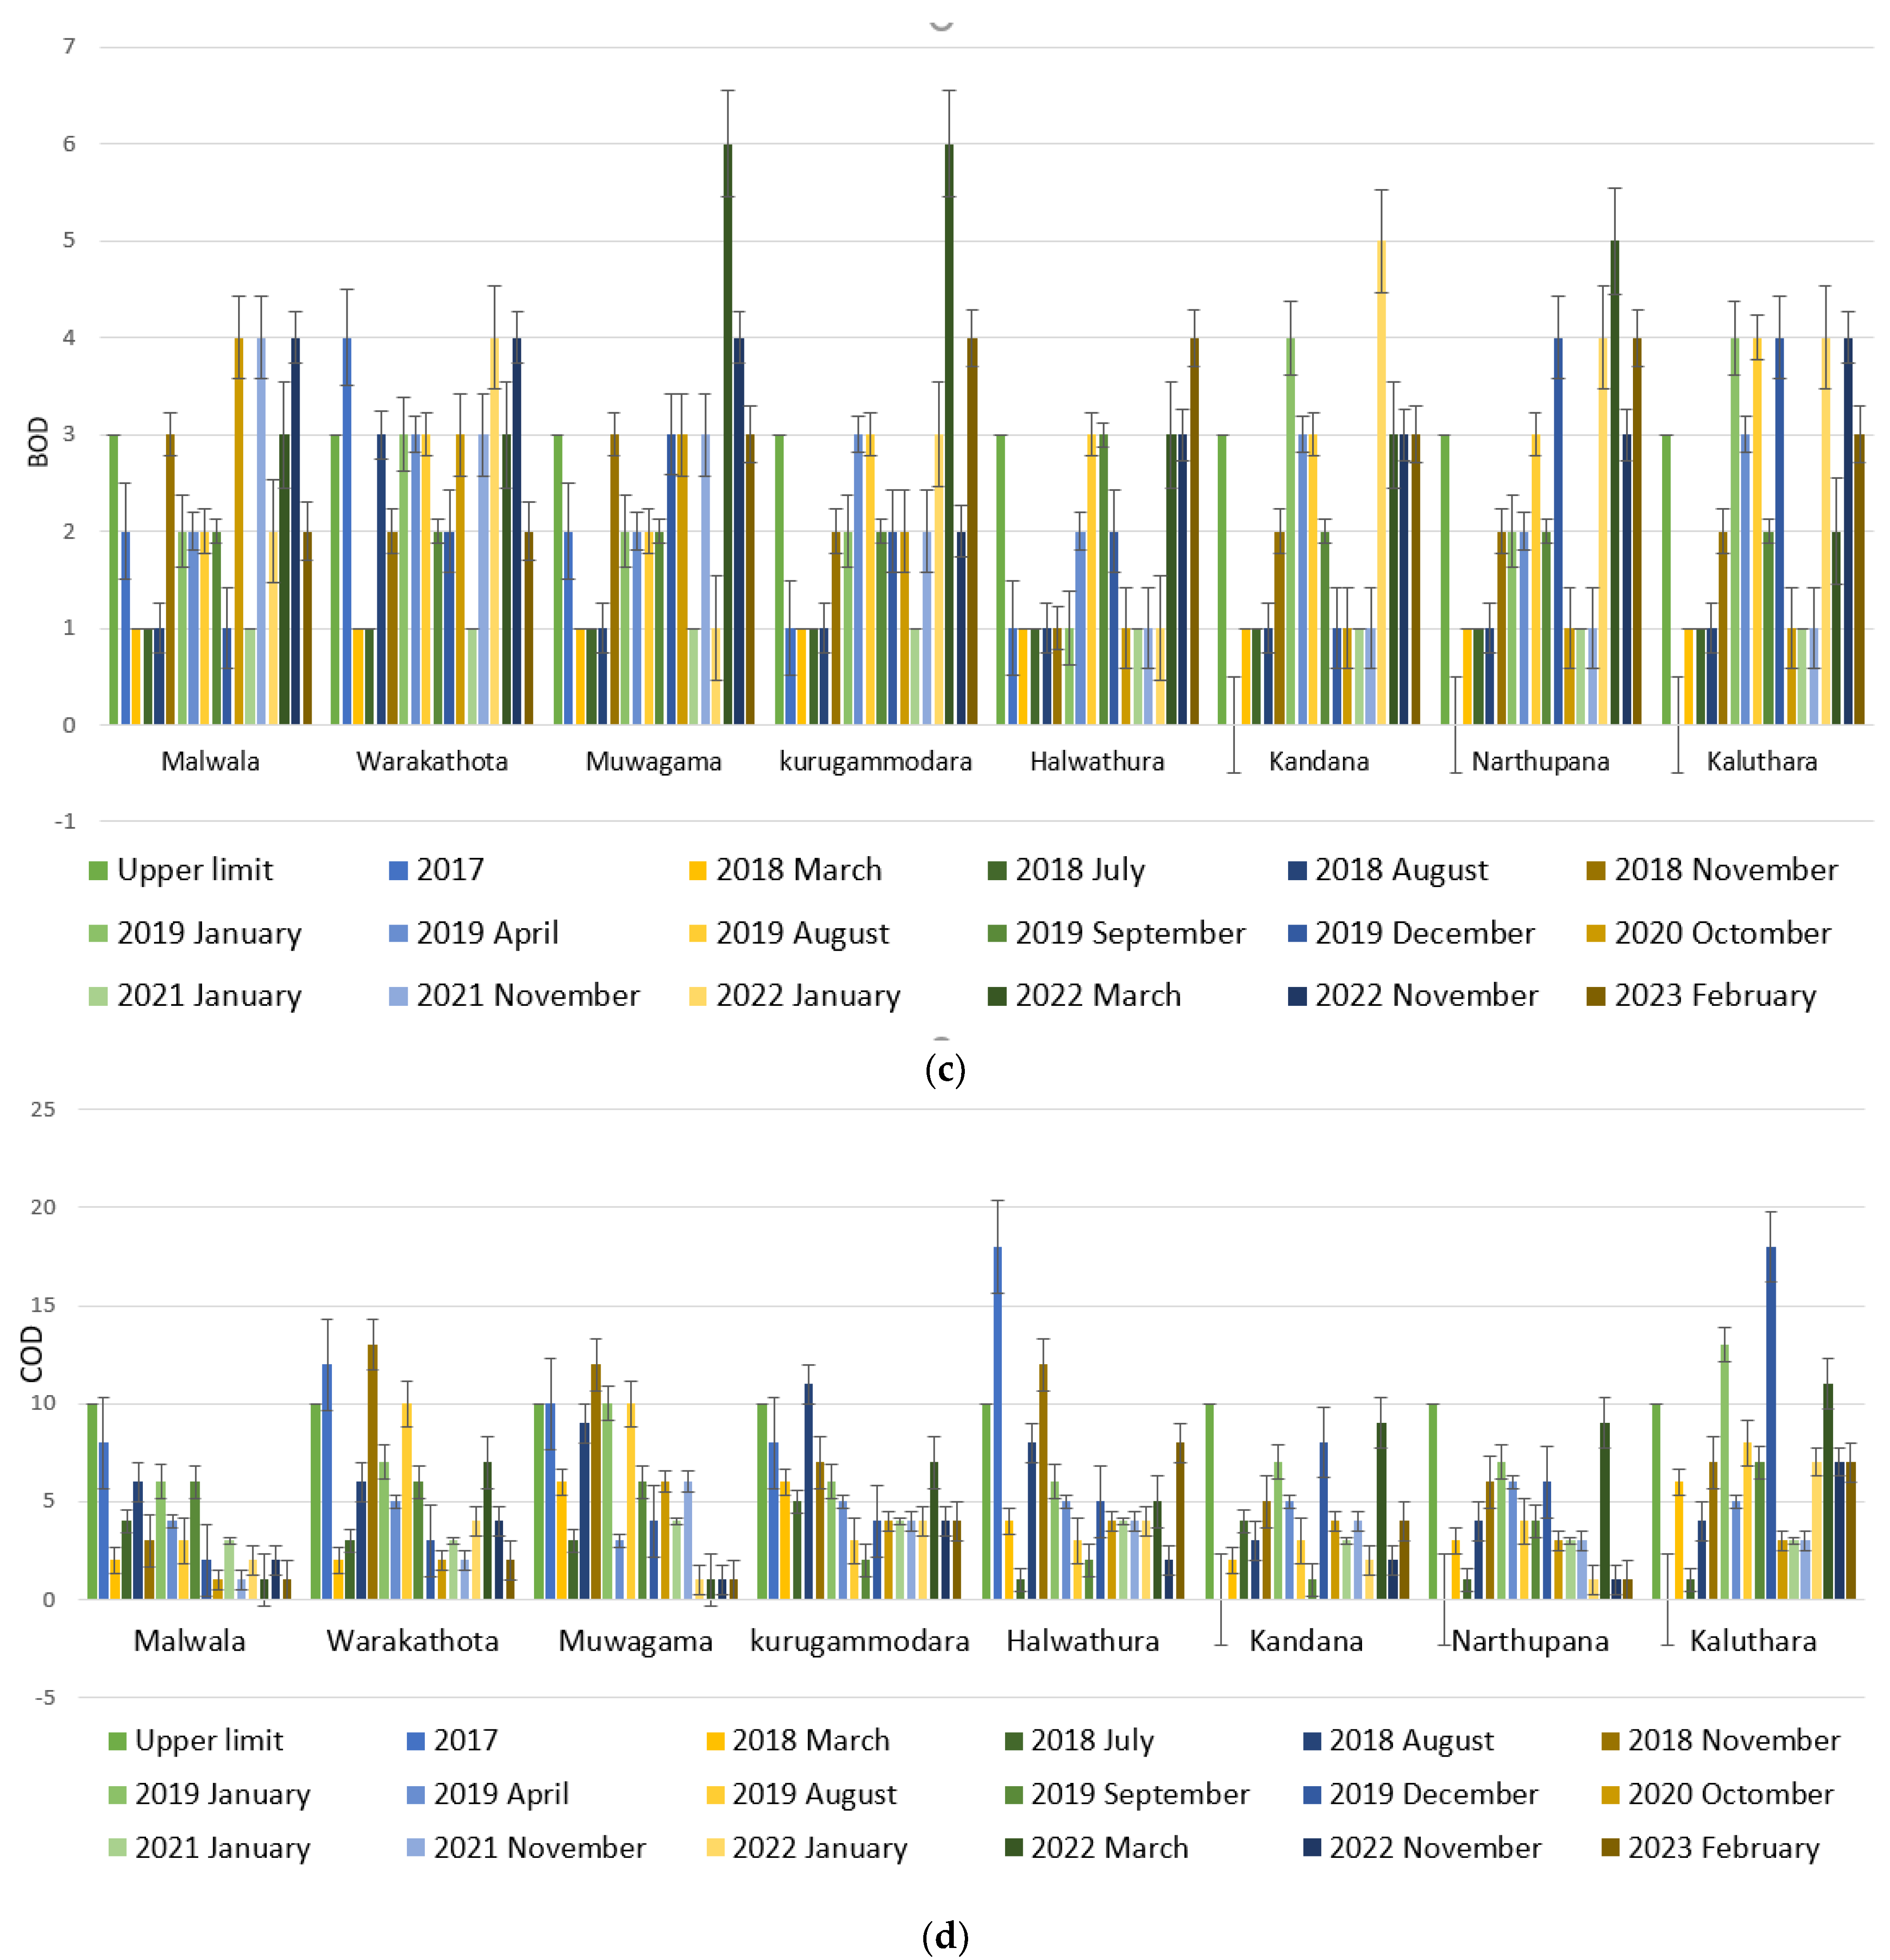
3.1. Spatiotemporal Variation of Water Quality Parameters
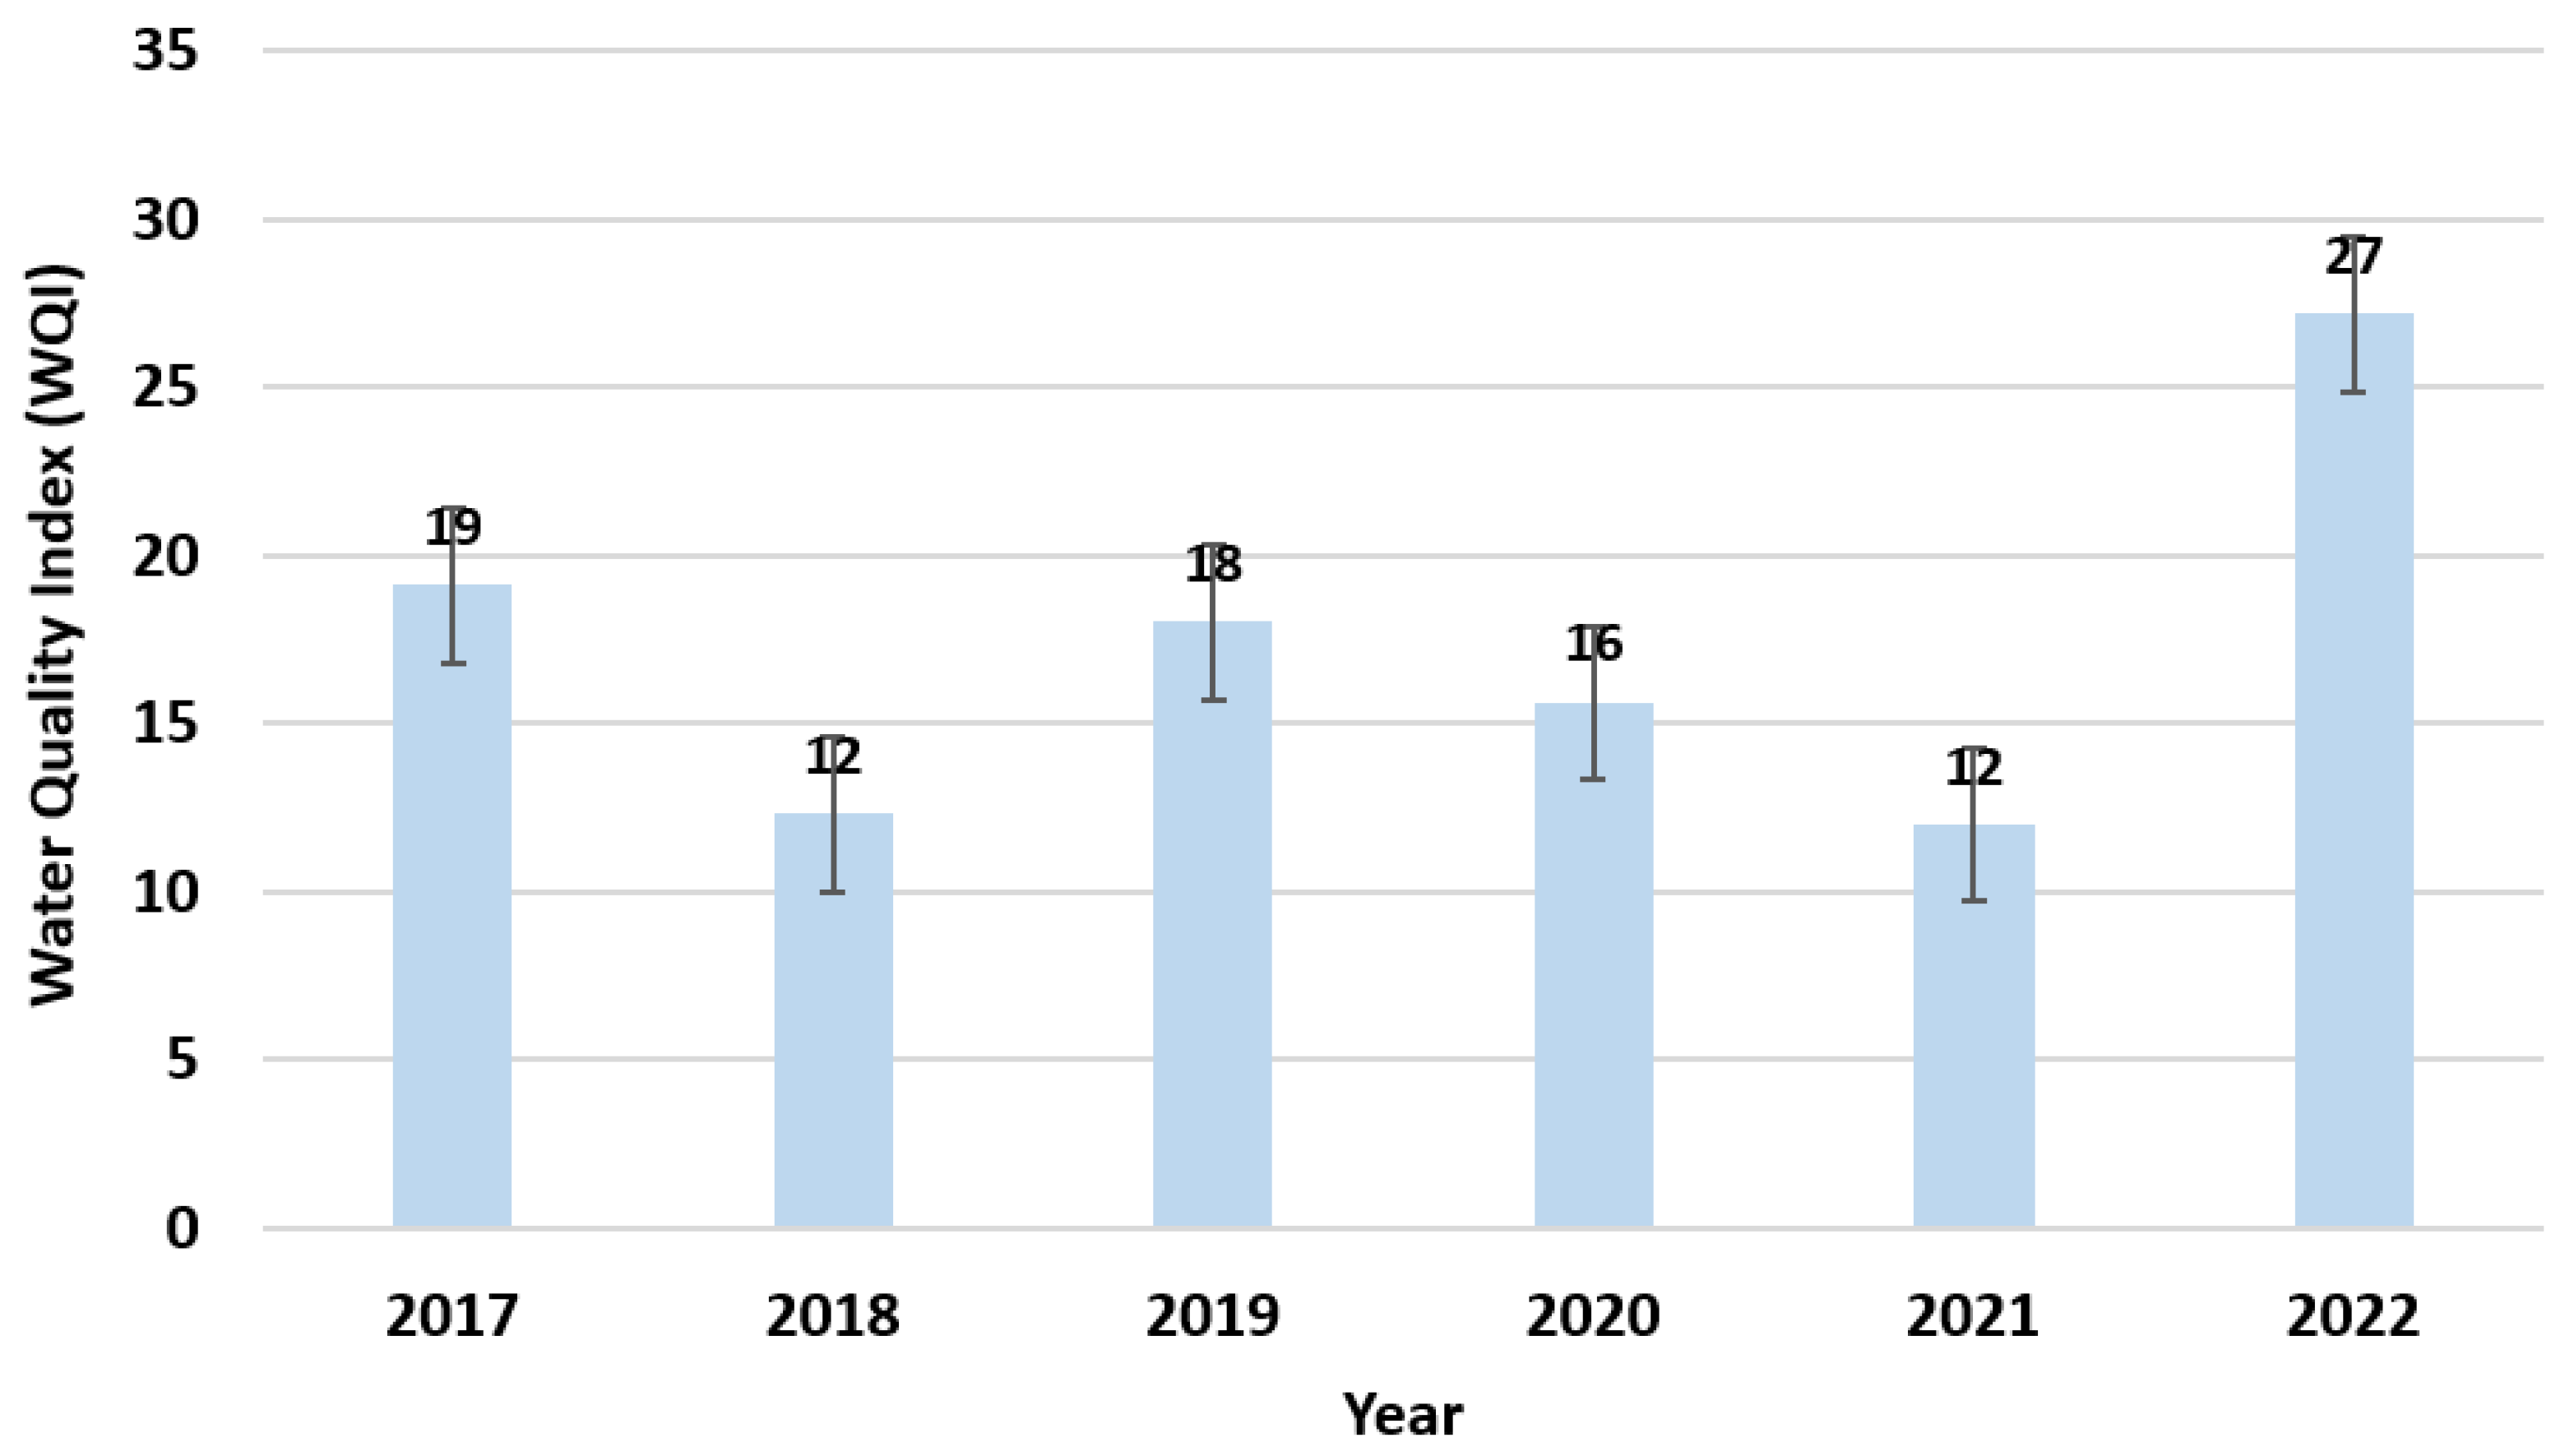
As it was stated, ten commonly measured water quality parameters were considered in this study. Spatiotemporal variations of the pH, EC, temperature, COD, BOD, total nitrate, total phosphate, total sulfate, total chloride, and hardness have been taken into consideration to identify distinguishing patterns for each of them. Figure 3a illustrates the hardness variation over the years. Some significant variations can be observed. Drastic changes can be clearly observed around the Kalutara Bridge, which can be categorized as very hard according to the standard values. This might be due to various discharges around the area because it is within the city limit of the Kalutara urban area. Typically, hardness increases due to a high concentration of calcium and magnesium in the water body. This can naturally occur in the river. However, the levels around Kalutara showcase some alarming hardness levels. This can be clearly seen in 2022 and 2023.
The same patterns can be observed in the chloride concentration in the river (refer to Figure 3b). Significant increases in chloride can be observed near Kalutara Bridge in 2022 and 2023. The acceptable range is somewhere between 45–155 mg/L; however, chloride concentrations near Kalutara Bridge are much higher. The chloride concentration of the water body always indicates the levels of salts in the water; hence, it is a major inorganic anion that is present in the water body. This high concentration of chloride endangers the aquatic life in the water body as well. This could be due to the saltwater incursion to the sampling point during the high tide period. The sampling location is just near the river mouth, where it meets the Indian Ocean.
The occasional rises of the BOD can be seen in some years along the river (refer to Figure 3c). The highest recorded BOD levels (6 mg/L) were found in Muwagama and Kurugammodara in the year of 2018. BOD defines the amount of oxygen needed to break down organic matter in the water, and 3 mg/L is considered the upper limit for a water body (refer to Table A1 in Appendix A). Hence, this is a clear indication of organic waste in the water body. The same as the BOD, the COD variation of the river shows significant changes along the river (refer to Figure 3d). The highest record of COD can be observed in Halwathura in the year of 2017 and Kalutara in the year 2019 (18 mg/L). A total of 10 mg/L is the maximum level in terms of the acceptable range for the COD parameter (refer to Table A1 in Appendix A). The COD of the river water reflects the amount of oxygen that needs to be oxidized in the presence of organic matter. Accordingly, this indicates the presence of high concentrations of organic matter in the different locations along the river.

3.2. WQI Analysis

As it was discussed earlier, data unavailability is one of the main issues in understanding the spatiotemporal variation of water quality in the Kalu River. With the available limited data, an optimized data set was identified for calculating the WQI. The weighted arithmetic method was used to calculate WQI values in the river. The calculated WQI values are illustrated in Figure 4.
The WQI value of the Malwala area shows less than 25 for all the years. Therefore, the overall water quality around Malawala can be identified as the most preferable water quality. However, Kalutara Bridge has higher WQI values. Most of the values from the Kalutara Bridge exceeded 25, and it gradually increased over the years. As expected, the water quality around the urbanized Kalutara area is not at its best. In addition, the Kalutara area is a high tourist destination due to its religious importance (Kalutara Pagoda and the Kalutara Temple). This might have triggered the water quality levels. Nevertheless, significantly reduced WQI values can be observed in 2020. This could be due to the countrywide lockdown due to the COVID-19 pandemic. Thus, the area was not visited by many local tourists. However, just after 2021, a significant increment of the WQI can be noted in the river. This difference can be clearly indicated, especially in the areas like Narthupaana and the Kalutara Bridge.
As shown in the graph (refer to Figure 5), the WQI level is in the acceptable range for most of the cases in the Kalu River. However, a noticeable variation can be found from 2019 to 2021, with a clear downward trend. Though this could not be solely related to the COVID-19 lockdown period in the country, it is a possibility that the lockdown period had impacted the water quality of the Kalu River. Moreover, a sudden rise of the WQI level in 2022 validates this assumption, as the lockdown period ended in the same year, and the country had gone back to normal by the beginning of the year 2022.

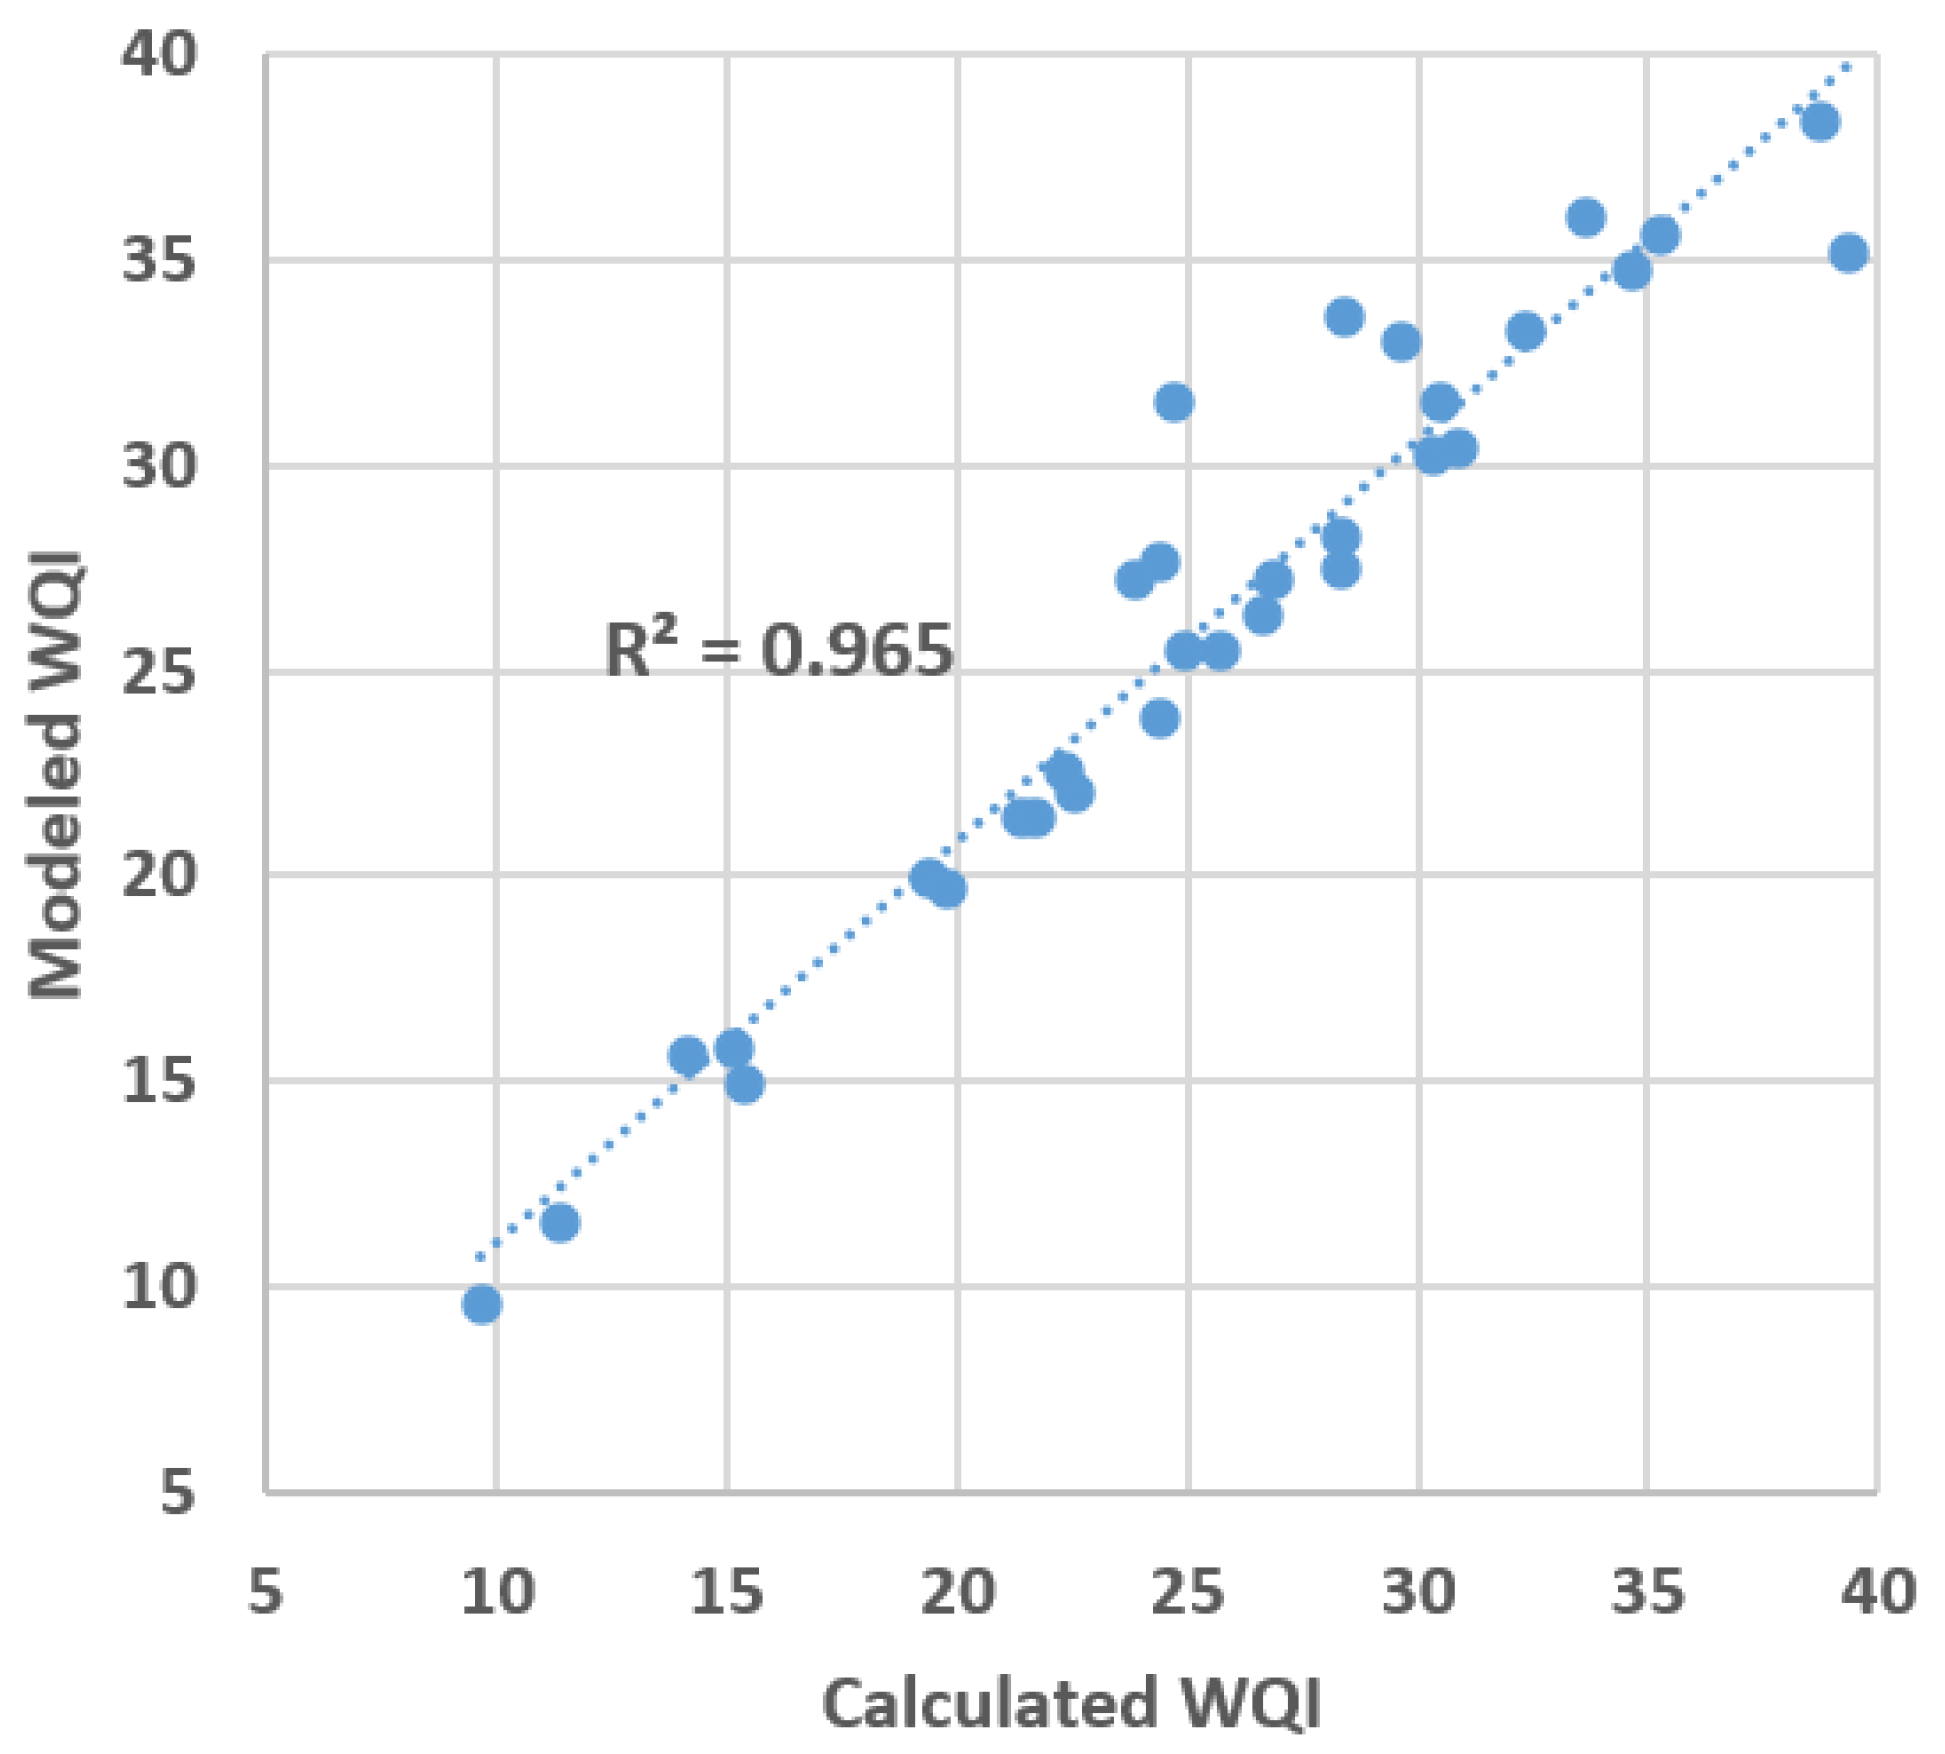
3.3. Development of Simplified Equation for WQI

A regression model was developed to identify a simplified equation for the WQI. The coefficients obtained for each parameter using the multivariable regression model are shown in Table 2. The interception point was located at −14.79. Equation (4) presents the identified simple equation for the WQI.
W Q I = 14.79 + 1.86 ( p H ) 0.018 ( E C ) + 60.1643 ( T e m p ) + 0.4454 ( C O D ) + 5.16 ( B O D ) + 0.4188 ( N O 3 ) + 96.04 ( P O 4 3 ) + 0.000619 ( S O 4 2 ) + 0.0004 ( C l ) + 0.009218 ( H a r d n e s s )
According to the coefficient obtained for the equation, critical parameters can be identified to understand their contribution of them. It is obvious that phosphate dominates in the WQI for the Kalu River, with the highest coefficient. This could be due to fertilizer usage in the agricultural lands. As a result, a deeper investigation of phosphate levels and their sources has to be carried out. There is, however, a negligible contribution from SO42−, chloride, hardness, and electrical conductivity. If the multiplication of the parameter and coefficient is higher, that can be identified as a critical parameter, whereas some parameters can be neglected if the multiplication is lower. This is a less complicated and more time-saving method to get a proper understanding of the water quality of the river.
Figure 6 shows the modeled WQI (linear equation) vs. the calculated WQI for the validation period 2022 and 2023. A perfect match of the modeled WQI should have a linear line to the calculated WQI with a coefficient of determination (R2) of 1. The variation showcases the high results and has an R2 of 0.965, which is almost 1. Therefore, the accuracy of the developed model can be justified, as well as the WQI for the other years, without requiring more involved complicated calculations. However, the modeled equation (Equation (4)) is only applicable to the chosen Kalu basin.
However, the results cannot be ruled out using the equation’s form for different basins. Based on their water quality indicators, regression coefficients can be calculated. Therefore, it is encouraged that future researchers build such correlations for other basins, which could be useful for obtaining WQI values easily without complicated calculations.
Many studies can be found in the literature to showcase the spatiotemporal variation of water quality along rivers using the WQI. However, in the context of Sri Lanka, a few studies can be found. Makubura et al. [61] carried out a WQI analysis for the Kelani River in Sri Lanka. However, most of the other studies were on groundwater resources in Sri Lanka. This is the first-ever study to be carried out on the Kalu River, Sri Lanka, to understand the spatiotemporal variation of the WQI.
One possible source of contamination of the river water can be assumed to be the unmitigated gem and sand mining in the riverbed and nearby mining sites. This mainly happens in the Ratnapura district. Other sources can be identified as industries located along the path of the river. This is a common cause of contamination in most rivers in Sri Lanka. Mostly, industries related to chemical processes are the cause, severely, even though contaminated water has gone through the treatment process, as required. Finally, there could be a possibility that households and hotels might have an impact on the river water quality due to their sewage lines, which are directed into the river. In this scenario, it is clear that households may release larger amounts of contaminated water, as there were no treatment facilities on a small scale, such as for hotels. Therefore, it has to be thoroughly investigated to map these contamination sources separately. However, this has to be controlled by laws and regulations in the country. Apparently, the current system of legislation regarding environmental safety in Sri Lanka is not adequate for modern issues and has to be replaced in a more scientific and practical way. Temporarily, authorities can do a continuous monitoring process and identify the most critical cause and location of contamination and implement prevention strategies accordingly.

3.4. Comparative Analysis

Similar research work can be found in the region for some river basins; however, the related research in the context of Sri Lanka is minimal, other than the research carried out by Makumbura et al. [61]. Some of the regional studies carried out are showcased in Table 3. It presents a comparative analysis of the water quality for four river basins in Asian countries based on the water quality index. As shown in the table, the methodology, results, and solutions are presented as a summary. More details on these can be found in the respective papers.

4. Conclusions

This research presents a spatiotemporal variation of the WQI in the Kalu River, Sri Lanka. In addition, a simple equation has been presented to calculate the WQI for the river basin. Spatiotemporal variation showcases some alarming water quality levels, specifically near the urbanized Kalutara Bridge. However, overall, the water quality along the Kalu River is at an acceptable level. The COVID-19 pandemic impacted the water quality of the Kalu River. Lowered WQI values (better water qualities) were found for the periods when the areas were under lockdown conditions. However, a significant increase in the WQI could be found after the relaxation of COVID-19 lockdown rules, according to the annual average WQI values. Therefore, the water quality was adversely affected. Contamination sources of the river water can be assumed to be gem and sand mining, industries located near the river, and households and hotels around the river. However, prevention strategies for river pollution should come from the upper level of authorities through new rules and regulations. The simplified equation for the calculation of the WQI showcases a higher accuracy. Therefore, this equation can be well-used for any future studies. Nevertheless, the results do not comprehensively present a detailed analysis in the temporal domain due to data scarcity. It is well-recommended to measure water quality levels, if possible, daily to produce better analysis. However, the developed WQI formulation would help in identifying the most critical parameters in water quality, therefore reducing any operational and management costs in water quality measurements.

Author Contributions

Conceptualization, K.D.S. and U.R.; methodology, K.D.S.; software, D.I.J. and R.D.H.; validation, R.K.M. and U.R.; formal analysis, K.D.S.; investigation, K.D.S. and M.B.G.; resources, H.J.; data curation, K.D.S. and D.I.J.; writing—original draft preparation, K.D.S. and R.D.H.; writing—review and editing, H.M.A., K.T.-M. and U.R.; visualization, M.B.G.; supervision, U.R.; project administration, U.R. All authors have read and agreed to the published version of the manuscript.

Funding

This research received no external funding.

Institutional Review Board Statement

Not applicable.

Informed Consent Statement

Not applicable.

Data Availability Statement

Data are only available for research purposes.

Conflicts of Interest

The authors declare no conflict of interest.

Appendix A

Table A1. Standards for surface water contamination based on the WHO, BIS, and Sri Lankan water quality standards (SLS 614) [63] and ideal values.
ParameterUnitStandardIdeal Values
pH-6.5–8.07
TemperatureCelsius2525
ECmS/cm3000
CODmg/L100
BODmg/L30
NO3mg/L100
PO43−mg/L0.70
SO42−mg/L2500
Clmg/L4000
Total Hardnessmg/L6000

References

  1. Gartsiyanova, K.; Varbanov, M.; Kitev, A.; Genchev, S. Water quality analysis of the rivers Topolnitsa and Luda Yana, Bulgaria using different indices. J. Physics Conf. Ser. 2021, 1960, 012018. [Google Scholar] [CrossRef]
  2. Edokpayi, J.N.; Odiyo, J.O.; Durowoju, O.S. Impact of wastewater on surface water quality in developing countries: A case study of South Africa. In Water Quality; IntechOpen: London, UK, 2017. [Google Scholar] [CrossRef] [Green Version]
  3. Piazza, S.; Blokker, E.J.M.; Freni, G.; Puleo, V.; Sambito, M. Impact of diffusion and dispersion of contaminants in water distribution networks modeling and monitoring. Water Supply 2019, 20, 46–58. [Google Scholar] [CrossRef]
  4. Rathnayake, U.S.; Tanyimboh, T.T. Optimal control of combined sewer systems using SWMM 5.0. WIT Trans. Built Environ. 2012, 122, 87–96. [Google Scholar] [CrossRef] [Green Version]
  5. Vaccaro, M.M.; García-Liñeiro, A.; Fernández-Cirelli, A.; Volpedo, A.V. Life cycle assessment of water in sport equine production in Argentina: A case study. Agriculture 2021, 11, 1084. [Google Scholar] [CrossRef]
  6. Vaccaro, M.M.; Volpedo, A.V.; García Liñeiro, A.; Fernñandez Cirelli, A. Water quality in equine production in Buenos Aires Province, Argentina. SN Appl. Sci. 2020, 2, 482. [Google Scholar] [CrossRef] [Green Version]
  7. Whitehead, P.G.; Wilby, R.L.; Battarbee, R.W.; Keran, M.; Wade, A.J. A review of the potential impacts of climate change on surface water quality. Hydrol. Sci. J. 2009, 54, 101–123. [Google Scholar] [CrossRef] [Green Version]
  8. Darko, H.F.; Ansa-Asare, O.; Paintsil, A. A number description of Ghanaian water quality—A case study of the southwestern and Coastal Rivers Systems of Ghana. J. Environ. Prot. 2013, 04, 1318–1327. [Google Scholar] [CrossRef] [Green Version]
  9. Mokarram, M.; Pourghasemi, H.R.; Huang, K.; Zhang, H. Investigation of water quality and its spatial distribution in the Kor River basin, Fars Province, Iran. Environ. Res. 2022, 204, 112294. [Google Scholar] [CrossRef] [PubMed]
  10. Sultana, M.N.; Hossain, M.S.; Latifa, G.A. Water quality assessment of balu river, Dhaka Bangladesh. Water Conserv. Manag. 2019, 3, 08–10. [Google Scholar] [CrossRef]
  11. Tota-Maharaj, K.; Scholz, M. Combined permeable pavement and photocatalytic titani-um dioxide oxidation system for urban run-off treatment and disinfection. Water Environ. J. 2012, 27, 338–347. [Google Scholar] [CrossRef]
  12. Paul, P.; Tota-Maharaj, K. Laboratory studies on granular filters and their relationship to geotextiles for stormwater pollutant reduction. Water 2015, 7, 1595–1609. [Google Scholar] [CrossRef] [Green Version]
  13. Tota-Maharaj, K.; Paul, P. Sustainable approaches for stormwater quality improvements with experimental geothermal paving systems. Sustainability 2015, 7, 1388–1410. [Google Scholar] [CrossRef] [Green Version]
  14. Adeloju, S.B.; Khan, S.; Patti, A.F. Arsenic contamination of groundwater and its implications for drinking water quality and human health in under-developed countries and remote communities—A review. Appl. Sci. 2021, 11, 1926. [Google Scholar] [CrossRef]
  15. He, X.; Li, P.; Ji, Y.; Wang, Y.; Su, Z.; Elumalai, V. Groundwater arsenic and fluoride and associated arsenicosis and fluorosis in China: Occurrence, distribution and management. Expo. Health 2020, 12, 355–368. [Google Scholar] [CrossRef]
  16. Puntoriero, M.L.; Volpedo, A.V.; Fernández Cirelli, A. Arsenic, fluoride, and vanadium in surface water (chasicã3 lake, Argentina). Front. Environ. Sci. 2014, 2, 1–5. [Google Scholar] [CrossRef] [Green Version]
  17. Batugedara, B.D.; Senanayake, S.A. Plankton diversity in coastal waters near Kalu Ganga river mouth; Sri Lanka. KDU J. Multidiscip. Stud. 2022, 4, 7–20. [Google Scholar] [CrossRef]
  18. Kirschke, S.; Avellán, T.; Bärlund, I.; Bogardi, J.J.; Carvalho, L.; Chapman, D.; Dickens, C.W.S.; Irvine, K.; Lee, S.; Mehner, T.; et al. Capacity challenges in water quality monitoring: Understanding the role of human development. Environ. Monit. Assess. 2020, 192, 298. [Google Scholar] [CrossRef] [Green Version]
  19. Berthet, A.; Vincent, A.; Fleury, P. Water quality issues and agriculture: An International Review of Innovative Policy Schemes. Land Use Policy 2021, 109, 105654. [Google Scholar] [CrossRef]
  20. McMillan, H.; Krueger, T.; Freer, J. Benchmarking observational uncertainties for hydrology: Rainfall, River Discharge and water quality. Hydrol. Process. 2012, 26, 4078–4111. [Google Scholar] [CrossRef]
  21. Méndez-Barroso, L.A.; Rivas-Márquez, J.A.; Sosa-Tinoco, I.; Robles-Morúa, A. Design and implementation of a low-cost multiparameter probe to evaluate the temporal variations of water quality conditions on an estuarine lagoon system. Environ. Monit. Assess. 2020, 192, 710. [Google Scholar] [CrossRef]
  22. Meyer, A.M.; Klein, C.; Fünfrocken, E.; Kautenburger, R.; Beck, H.P. Real-time monitoring of water quality to identify pollution pathways in small and Middle Scale Rivers. Sci. Total Environ. 2019, 651, 2323–2333. [Google Scholar] [CrossRef] [PubMed]
  23. Yeon, I.S.; Kim, J.H.; Jun, K.W. Application of artificial intelligence models in water quality forecasting. Environ. Technol. 2008, 29, 625–631. [Google Scholar] [CrossRef]
  24. Jordan, P.; Cassidy, R. Perspectives on Water Quality Monitoring Approaches for Behavioral Change Research. Front. Water 2022, 4, 1–12. [Google Scholar] [CrossRef]
  25. Jung, H.; Senf, C.; Jordan, P.; Krueger, T. Benchmarking inference methods for water quality monitoring and status classification. Environ. Monit. Assess. 2020, 192, 261. [Google Scholar] [CrossRef] [PubMed] [Green Version]
  26. Tinnevelt, G.H.; Lushchikova, O.; Augustijn, D.; Lochs, M.; Geertsma, R.W.; Rijkeboer, M.; Kools, H.; Dubelaar, G.; Veen, A.; Buydens, L.M.; et al. Water quality monitoring based on chemometric analysis of high-resolution phytoplankton data measured with flow cytometry. Environ. Int. 2022, 170, 107587. [Google Scholar] [CrossRef]
  27. Al-Janabi, S.; Al-Barmani, Z. Intelligent multi-level analytics of soft computing approach to predict water quality index (IM12CP-WQI). Soft Comput. 2023, 27, 7831–7861. [Google Scholar] [CrossRef]
  28. Pandey, S.; Kumari, N.; Al Nawajish, S. Land use land cover (LULC) and surface water quality assessment in and around selected dams of Jharkhand using water quality index (WQI) and Geographic Information System (GIS). J. Geol. Soc. India 2023, 99, 205–218. [Google Scholar] [CrossRef]
  29. Abu El-Magd, S.A.; Ismael, I.S.; El-Sabri, M.A.; Abdo, M.S.; Farhat, H.I. Integrated machine learning–based model and WQI for groundwater quality assessment: ML, geospatial, and hydro-index approaches. Environ. Sci. Pollut. Res. 2023, 30, 53862–53875. [Google Scholar] [CrossRef]
  30. Lumb, A.; Sharma, T.C.; Bibeault, J.-F. A review of Genesis and evolution of Water Quality Index (WQI) and some future directions. Water Qual. Expo. Health 2011, 3, 11–24. [Google Scholar] [CrossRef]
  31. Moscuzza, C.; Volpedo, A.V.; Ojeda, C.; Cirelli, A.F. Water quality index as an tool for river assessment in agricultural areas in the pampean plains of Argentina. J. Urban Environ. Eng. 2007, 1, 18–25. [Google Scholar] [CrossRef]
  32. Tyagi, S.; Sharma, B.; Singh, P.; Dobhal, R. Water quality assessment in terms of water quality index. Am. J. Water Resour. 2013, 1, 34–38. [Google Scholar] [CrossRef]
  33. Olubukola Ajoke Adelagun, R.; Edet Etim, E.; Emmanuel Godwin, O. Application of water quality index for the assessment of water from different sources in Nigeria. In Promising Techniques for Wastewater Treatment and Water Quality Assessment; IntechOpen Limited: London, UK, 2021. [Google Scholar] [CrossRef]
  34. Uddin, M.G.; Nash, S.; Olbert, A.I. A review of water quality index models and their use for assessing surface water quality. Ecol. Indic. 2021, 122, 107218. [Google Scholar] [CrossRef]
  35. Lukhabi, D.K.; Mensah, P.K.; Asare, N.K.; Pulumuka-Kamanga, T.; Ouma, K.O. Adapted water quality indices: Limitations and potential for water quality monitoring in Africa. Water 2023, 15, 1736. [Google Scholar] [CrossRef]
  36. Machireddy, S.R. Assessment and distribution of groundwater quality using water quality index and geospatial technology in Vempalli Mandal of Andhra Pradesh, India. Water Resour. Manag. 2023, 9, 51. [Google Scholar] [CrossRef]
  37. Akhtar, N.; Ishak, M.I.S.; Ahmad, M.I.; Umar, K.; Md Yusuff, M.S.; Anees, M.T.; Qadir, A.; Ali Almanasir, Y.K. Modification of the water quality index (WQI) process for simple calculation using the multi-criteria decision-making (MCDM) method: A Review. Water 2021, 13, 905. [Google Scholar] [CrossRef]
  38. Akhtar, N.; Syakir Ishak, M.I.; Bhawani, S.A.; Umar, K. Various natural and anthropogenic factors responsible for water quality degradation: A Review. Water 2021, 13, 2660. [Google Scholar] [CrossRef]
  39. Belkhiri, L.; Mouni, L. Geochemical modeling of groundwater in the El Eulma area, Algeria. Desalination Water Treat. 2013, 51, 1468–1476. [Google Scholar] [CrossRef]
  40. Belkhiri, L.; Mouni, L. Geochemical characterization of surface water and groundwater in Soummam Basin, Algeria. Nat. Resour. Res. 2014, 23, 393–407. [Google Scholar] [CrossRef]
  41. Xu, S.; Li, S.-L.; Yue, F.; Udeshani, C.; Chandrajith, R. Natural and anthropogenic controls of groundwater quality in Sri Lanka: Implications for chronic kidney disease of unknown etiology (CKDU). Water 2021, 13, 2724. [Google Scholar] [CrossRef]
  42. Khatri, N.; Tyagi, S. Influences of natural and anthropogenic factors on surface and groundwater quality in rural and urban areas. Front. Life Sci. 2014, 8, 23–39. [Google Scholar] [CrossRef]
  43. Nagaraju, A.; Thejaswi, A.; Sreedhar, Y. Assessment of groundwater quality of Udayagiri area, Nellore district, Andhra Pradesh, South India using multivariate statistical techniques. Earth Sci. Res. J. 2016, 20, 1. [Google Scholar] [CrossRef] [Green Version]
  44. Trabelsi, R.; Zouari, K. Coupled geochemical modeling and Multivariate Statistical Analysis Approach for the assessment of groundwater quality in irrigated areas: A study from North Eastern of Tunisia. Groundw. Sustain. Dev. 2019, 8, 413–427. [Google Scholar] [CrossRef]
  45. Kahn, C. How Many Countries Don’t Have Clean Water? Top 10 List and Facts. 2020. Available online: https://lifewater.org/blog/how-many-countries-dont-have-clean-water-top-10-list-and-facts (accessed on 26 April 2023).
  46. Easterly, W. How the millennium development goals are unfair to Africa. World Dev. 2009, 37, 26–35. [Google Scholar] [CrossRef]
  47. Charlet, L.; Polya, D.A. Arsenic in shallow, reducing groundwaters in Southern Asia: An Environmental Health Disaster. Elements 2006, 2, 91–96. [Google Scholar] [CrossRef]
  48. Dawood, F.; Akhtar, M.M.; Ehsan, M. Evaluating urbanization impact on Stressed Aquifer of Quetta Valley, Pakistan. Desalination Water Treat. 2021, 222, 103–113. [Google Scholar] [CrossRef]
  49. Liyanage, C.; Yamada, K. Impact of population growth on the water quality of natural water bodies. Sustainability 2017, 9, 1405. [Google Scholar] [CrossRef] [Green Version]
  50. Bandara, N.J.G.J. Water and wastewater related issues in Sri Lanka. Water Sci. Technol. 2003, 47, 305–312. [Google Scholar] [CrossRef]
  51. Amarathunga, A.A.D.; Kazama, F. Impact of land use on surface water quality: A case study in the Gin River Basin, Sri Lanka. Asian J. Water Environ. Pollut. 2016, 13, 1–13. [Google Scholar] [CrossRef]
  52. Narangoda, C.; Amarathunga, D.; Dangalle, C.D. Evaluation of water quality in the upper and lower catchments of the Kelani River Basin, Sri Lanka. Water Pr. Technol. 2023, 18, 716–737. [Google Scholar] [CrossRef]
  53. Narangoda, C.N.; Dangalle, C.D.; Amarathunga, D. Selected freshwater fish species for assessing the water quality of the lower catchment of the Kelani River, Sri Lanka. Environ. Monit. Assess. 2022, 194, 650. [Google Scholar] [CrossRef] [PubMed]
  54. Gunaratne, M.M.T.N.; Bandara, N.J.G.J.; Goonewardene, N.P. Water Quality in Selected Locations of the Kalu Ganga. In Proceedings of the 17th International Forestry and Environment Symposium 2012, Nugegoda, Sri Lanka, 16–17 November 2012; Volume 17. [Google Scholar]
  55. Ratnayake, N.P.; Silva, K.B.; Kumara, I.G. Chloride contamination in construction aggregates due to periodic saline water intrusion: A case study in the Kaluganga River estuary, Sri Lanka. Environ. Earth Sci. 2012, 69, 2529–2540. [Google Scholar] [CrossRef]
  56. Panditharathne, D.L.; Abeysingha, N.S.; Nirmanee, K.G.; Mallawatantri, A. Application of revised universal soil loss equation (Rusle) model to assess soil erosion in “Kalu ganga” river basin in Sri Lanka. Appl. Environ. Soil Sci. 2019, 2019, 4037379. [Google Scholar] [CrossRef] [Green Version]
  57. Ampitiyawatta, A.; Guo, S. Precipitation trends in the Kalu Ganga Basin in Sri Lanka. J. Agric. Sci. 2010, 4, 10. [Google Scholar] [CrossRef] [Green Version]
  58. Samarasinghe, S.M.J.S.; Nandalal, H.K.; Weliwitiya, D.P.; Fowze, J.S.M.; Hazarika, M.K.; Samarakoon, L. Application of Remote Sensing and GIS for Flood Risk Analysis: A Case Study at Kalu-Ganga River, Sri Lanka. International Archives of the Photogrammetry, Remote Sensing and Spatial Information Science, Volume XXXVIII (Part 8), Kyoto, Japan. 2010. Available online: https://www.isprs.org/publications/archives.aspx (accessed on 30 April 2023).
  59. Bora, M.; Goswami, D.C. Water quality assessment in terms of Water Quality Index (WQI): Case study of the Kolong River, Assam, India. Appl. Water Sci. 2016, 7, 3125–3135. [Google Scholar] [CrossRef] [Green Version]
  60. Sharma, P.; Bora, P. Water Quality Assessment Using Water Quality Index and Principal Component Analysis: A Case Study of Historically Important Lakes of Guwahati City, North-East India. Appl. Ecol. Environ. Sci. 2020, 8, 207–2017. [Google Scholar]
  61. Makumbura, R.; Meddage, D.P.; Azamathulla, H.M.; Pandey, M.; Rathnayake, U. A simplified mathematical formulation for water quality index (WQI): A case study in the Kelani River Basin, Sri Lanka. Fluids 2022, 7, 147. [Google Scholar] [CrossRef]
  62. Radin Nizar, F.S.; Mohd Ghazi, R.; Awang, N.R.; Muhammad, M. Assessment of kelantan river water quality using water quality index (WQI). IOP Conf. Series Earth Environ. Sci. 2021, 842, 012005. [Google Scholar] [CrossRef]
  63. Socialist Republic of Sri Lanka, National Environmental Act No. 47 of 1980 1–4. 2019. The Gazette of the Democratic Socialist Republic of Sri Lanka. Available online: http://citizenslanka.org/wp-content/uploads/2016/02/National-Environmental-Act-No-47-0f-1980-E.pdf (accessed on 30 April 2023).
  64. Das Kangabam, R.; Bhoominathan, S.D.; Kanagaraj, S.; Govindaraju, M. Development of a water quality index (WQI) for the Loktak Lake in India. Appl. Water Sci. 2017, 7, 2907–2918. [Google Scholar] [CrossRef] [Green Version]
  65. Howladar, M.F.; Al Numanbakth, M.A.; Faruque, M.O. An application of Water Quality Index (WQI) and multivariate statistics to evaluate the water quality around Maddhapara granite mining industrial area, Dinajpur, Bangladesh. Environ. Syst. Res. 2017, 6, 13. [Google Scholar] [CrossRef] [Green Version]
  66. Kumar, N.; Mahessar, A.A.; Memon, S.A.; Ansari, K.; Qureshi, A.L. Impact assessment of groundwater quality using WQI and geospatial tools: A case study of islamkot, Tharparkar, Pakistan. Eng. Technol. Appl. Sci. Res. 2020, 10, 5288–5294. [Google Scholar] [CrossRef]
Figure 1. The Kalu River catchment and the water quality sampling locations.
Sustainability 15 12012 g001
Figure 2. Land use of the Kalu River basin.
Sustainability 15 12012 g002
Figure 3. Spatiotemporal variation of water quality parameters: (a) hardness; (b) Cl; (c) BOD; (d) COD.
Sustainability 15 12012 g003aSustainability 15 12012 g003b
Figure 4. Calculated WQI values.
Sustainability 15 12012 g004
Figure 5. Water Quality Indices (WQI) over the years.
Sustainability 15 12012 g005
Figure 6. WQI validation from 2022 to 2023.
Sustainability 15 12012 g006
Table 1. Water quality status (WQS) based on the WQI.
WQIWQSIntended Usage
DrinkingIrrigationIndustrial
0–25 SuitableSuitableSuitable
25–50GoodSuitableSuitableSuitable
50–75PoorNot SuitableSuitableSuitable
75–100Very poorNot SuitableSuitableNot Suitable
Above 100Not suitable for drinking or fish cultureProper treatment is required
Table 2. Coefficients from multivariable regression.
ParameterCoefficientParameterCoefficient
pH1.86NO−3 (mg/L)0.4188
EC (mS/cm)−0.018PO4−3 (mg/L)96.04
Temperature (°C)0.1643SO4−2 (mg/L)0.000619
COD (mg/L)0.4454Cl (mg/L)0.0004
BOD (mg/L)5.16Hardness (mg/L)0.009218
Table 3. Comparative analysis of water quality in river water in the Asian region.
CountryBasinMethodologyResultsSuggested SolutionsReference
Sri LankaKelani River BasinWeighted arithmetic index method to calculate WQIKelani River WQI average values
varying by 35.9 (2011)–58.7 (2012) (considered time period, 2005–2012); water is not fit for drinking
Establish a water quality monitoring strategy, public awareness campaigns, and some policy decisions addressing the quality of water near industrial zones, such as imposing new legislation on industries that discharge effluents into natural streams.[61]
IndiaLoktak LakeWeighted arithmetic index method to calculate WQIWQI values range from 64 to 77, indicating that the Loktak Lake water is not fit for drinkingThe study recommends the urgent need for continuous monitoring of the lake water and identifying the pollution sources to protect the largest freshwater lake from further contamination.[64]
BangladeshMaddhapara Granite Mining Industrial Area, DinajpurWeighted arithmetic index method to calculate WQI multivariate statistical analysisWater quality index analysis revealed that 96.77% of the water samples fell under excellent quality and the rest 3.23% of the water samples were of good quality typesMonitor activities for further water quality management to prevent pollution.[65]
PakistanIslamkot, TharparkarWeighted arithmetic index method to calculate WQIThe computed WQI values range from 98 to 153 under the very poor categoryWater quality monitoring and health impact assessment must be conducted constantly.[66]
Disclaimer/Publisher’s Note: The statements, opinions and data contained in all publications are solely those of the individual author(s) and contributor(s) and not of MDPI and/or the editor(s). MDPI and/or the editor(s) disclaim responsibility for any injury to people or property resulting from any ideas, methods, instructions or products referred to in the content.

