Evolution of the Spatial Patterns of Global Egg Trading Networks in the 21 Century
Abstract
:1. Introduction
1.1. Background
1.2. Literature Review
2. Methods and Data
2.1. Methods
2.2. Data
3. Spatial Patterns of Global Egg Trading Networks
3.1. Findings of Global Egg Trading Network Evolution
3.2. Main Countries in Global Egg Trading Networks
3.3. Clusters of Global Egg Trading Networks
4. Factors Impacting on Global Egg Trading Networks
4.1. Selection of Influence Factors
4.2. Estimation Strategy
5. Discussion
6. Conclusions
Author Contributions
Funding
Institutional Review Board Statement
Informed Consent Statement
Data Availability Statement
Conflicts of Interest
References
- Hák, T.; Janoušková, S.; Moldan, B. Sustainable Development Goals: A need for relevant indicators. Ecol. Indic. 2016, 60, 565–573. [Google Scholar]
- United Nations World Food Programme (WFP). Global Report on Food Crises [R/EO]. 2023. Available online: https://www.wfp.org/publications/global-report-food-crises-2023 (accessed on 3 April 2023).
- Yang, N. Egg Production China: Current Status and Outlook. Front. Agric. Sci. Eng. 2021, 8, 25–34. [Google Scholar]
- FAO Database [DB/OL]. Available online: http://www.fao.org/faostat (accessed on 1 January 2023).
- Brandon, J.K. Multilateral Trade and Militarized Conflict: Centrality, Openness, and Asymmetry in the Global Trade Network. J. Politics 2012, 74, 308–322. [Google Scholar]
- Río-Chanona, R.M.; Grujić, J.; Jeldtoft, J.H. Trends of the World Input and Output Network of Global Trade. PLoS ONE 2017, 12, e0170817. [Google Scholar]
- Christina, P. Wealth and pollution inequalities of global trade: A network and input-output approach. Soc. Sci. J. 2016, 53, 111–121. [Google Scholar]
- Song, Z.; Che, S.; Yang, Y. The trade network of the Belt and Road Initiative and its topological relationship to the global trade network. J. Geogr. Sci. 2018, 28, 1249–1262. [Google Scholar] [CrossRef] [Green Version]
- Zhou, Y.; Chen, S.; Chen, M. Global value chain, regional trade networks and Sino-EU FTA. Struct. Chang. Econ. Dyn. 2019, 50, 26–38. [Google Scholar] [CrossRef]
- Konar, M.; Dalin, C.; Suweis, S.; Hanasaki, N.; Rinaldo, A.; Rodriguez-Iturbe, I. Water for food: The global virtual water trade network. Water Resour. Res. 2011, 47, W05520. [Google Scholar] [CrossRef] [Green Version]
- Prell, C.; Feng, K. The evolution of global trade and impacts on countries’ carbon trade imbalances. Soc. Netw. 2016, 46, 87–100. [Google Scholar] [CrossRef]
- Wang, W.; Li, Z.; Cheng, X. Evolution of the global coal trade network: A complex network analysis. Resour. Policy 2019, 62, 496–506. [Google Scholar]
- Petridis, N.E.; Petridis, K.; Stiakakis, E. Global e-waste trade network analysis. Resour. Conserv. Recycl. 2020, 158, 104742. [Google Scholar]
- Akerman, A.; Seim, A.L. The global arms trade network 1950–2007. J. Comp. Econ. 2014, 42, 535–551. [Google Scholar] [CrossRef] [Green Version]
- Gephart, J.A.; Pace, M.L. Structure and evolution of the global seafood trade network. Environ. Res. Lett. 2015, 10, 125014. [Google Scholar] [CrossRef] [Green Version]
- Shutters, S.T.; Muneepeerakul, R. Agricultural Trade Networks and Patterns of Economic Development. PLoS ONE 2012, 7, e39756. [Google Scholar]
- Castillo, C.; Bellina, B.; Fuller, D.I. Rice, beans and trade crops on the early maritime Silk Route in Southeast Asia. Antiquity 2016, 90, 1255–1269. [Google Scholar]
- Qiang, W.; Niu, S.; Wang, X.; Zhang, C.; Liu, A.; Cheng, S. Evolution of the Global Agricultural Trade Network and Policy Implications for China. Sustainability 2020, 12, 192. [Google Scholar]
- Parthasarathy, S.; Ruan, Y.; Satuluri, V. Community discovery in social networks: Applications, methods and emerging trends. In Social Network Data Analytics; Springer: Berlin/Heidelberg, Germany, 2011; pp. 79–113. [Google Scholar]
- Saramäki, J.; Kivelä, M.; Onnela, J.P.; Kaski, K.; Kertesz, J. Generalizations of the clustering coefficient to weighted complex networks. Phys. Rev. E 2007, 75, 027105. [Google Scholar] [CrossRef] [Green Version]
- Fronczak, A.; Fronczak, P.; Hołyst, J.A. Average path length in random networks. Phys. Rev. E 2004, 70, 056110. [Google Scholar] [CrossRef] [Green Version]
- Telesford, Q.K.; Joyce, K.E.; Hayasaka, S.; Burdette, J.H.; Laurienti, P.J. The ubiquity of small-world networks. Brain Connect. 2011, 1, 367–375. [Google Scholar]
- Zhang, J.; Luo, Y. Degree centrality, betweenness centrality, and closeness centrality in social network. In Proceedings of the 2017 2nd International Conference on Modelling, Simulation and Applied Mathematics (MSAM2017), Bangkok, Thailand, 26–27 March 2017; Atlantis Press: Amsterdam, The Netherlands, 2017; pp. 300–303. [Google Scholar]
- Ajayi, F.O. Nigerian indigenous chicken: A valuable genetic resource for meat and egg production. Asian J. Poult. Sci. 2010, 4, 164–172. [Google Scholar]
- Tobler, W.R. A computer movie simulating urban growth in the Detroit region. Econ. Geogr. 1970, 46, 234–240. [Google Scholar]
- World Bank Database. World Development Indicators [DB/OL]. Available online: http://www.data.worldbank.org.cn (accessed on 10 January 2023).
- Rodionova, I. Competitiveness of countries in the world innovation economy: Central-Eastern Europe and Russia. Quaest. Geogr. 2013, 32, 15–24. [Google Scholar]
- Olsen, J.A. Understanding NATO. RUSI J. 2020, 165, 60–72. [Google Scholar]
- Felbermayr, G.J.; Toubal, F. Cultural proximity and trade. Eur. Econ. Rev. 2010, 54, 279–293. [Google Scholar]

| Indicators | Meaning | Formula |
|---|---|---|
| Network density (D) | It refers to the ratio of the total number of existing relationships in a network to the maximum number of potential relationships that could exist in theory, reflecting the degree of connection between nodes within a social network. | |
| Average density (AD) | It refers to the average number of connections that each node in a network possesses, reflecting the level of trade links between countries and the overall complexity of the network. | |
| Average clustering coefficient (CL) | It refers to the likelihood that any two nodes within a network have a trading relationship, reflecting the level of cohesion within the trading network. | |
| Average path length (L) | It refers to the shortest path between all pairs of nodes in a network, reflecting the transmission efficiency of traded goods within the network. | |
| Degree centrality (DC) | In directed networks, degree can be divided into two indicators: out-degree and in-degree. Out-degree indicates the degree to which a node sends objects of the trading relationship, while in-degree indicates the degree to which it accepts them, reflecting the importance of exports and imports in the economy. | |
| Out-degree (OD) | ||
| In-degree (ID) | ||
| Closeness Centrality (CC) | It refers to the proximity of nodes in the network to each other, reflecting the degree of independence in trading relations. | |
| Betweenness centrality (BC) | It refers to the measurement of the shortest path between all pairs of nodes that pass through a specific node, reflecting the degree of resource flow control exerted by that node. | |
| Cluster separation (Q) | It refers to a subset of nodes within a trading network where the connections between nodes within the subset are dense, while the connections between nodes outside the subset are sparse. |
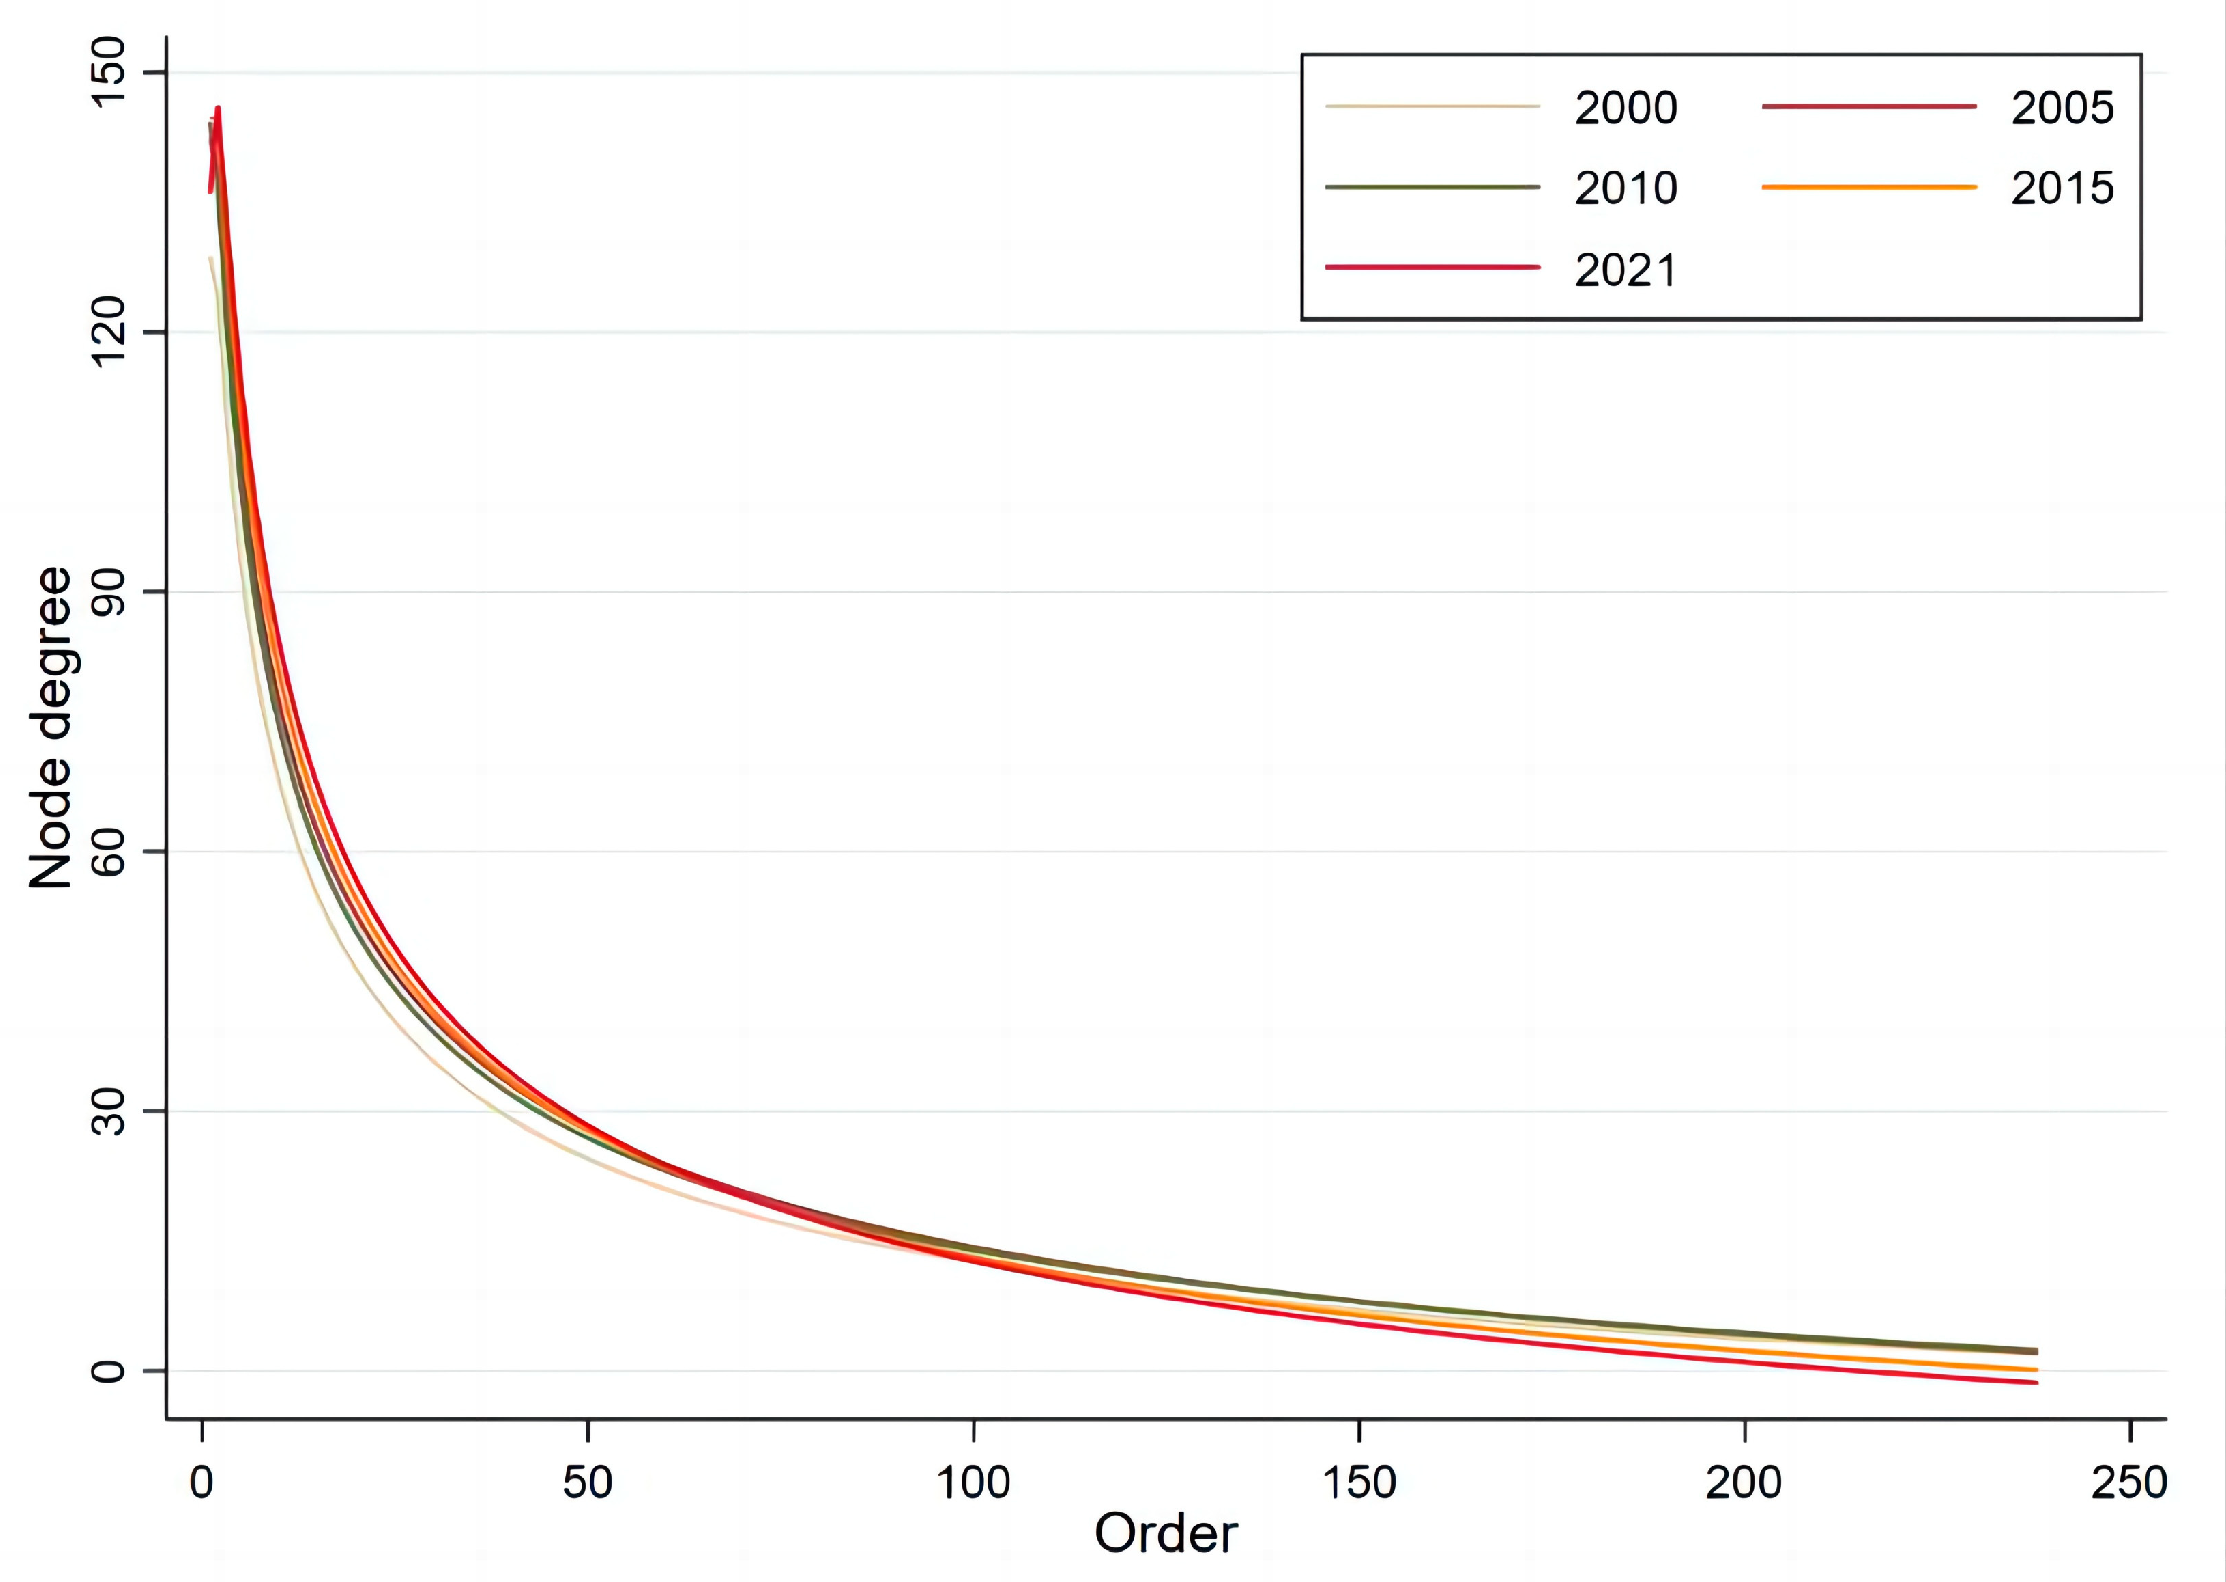
| Year | Fitting Equation | R2 | p |
|---|---|---|---|
| 2000 | 95.31532 × 0.9742782x | 0.9516 | 0.0000 |
| 2005 | 106.5343 × 0.9748419x | 0.9530 | 0.0000 |
| 2010 | 103.6603 × 0.9746435x | 0.9442 | 0.0000 |
| 2015 | 115.0746 × 0.9722739x | 0.9576 | 0.0000 |
| 2021 | 123.5967 × 0.9699222x | 0.9726 | 0.0000 |
| 2000 | 2021 | ||||||||||
|---|---|---|---|---|---|---|---|---|---|---|---|
| Node | Degree | Node | Out-degree | Node | In-degree | Node | Degree | Node | Out-degree | Node | In-degree |
| USA | 0.527 | USA | 0.405 | The Netherlands | 0.131 | The Netherlands | 0.574 | The Netherlands | 0.430 | Germany | 0.186 |
| The Netherlands | 0.511 | The Netherlands | 0.380 | Germany | 0.127 | Germany | 0.570 | USA | 0.430 | The Netherlands | 0.177 |
| Germany | 0.477 | Germany | 0.350 | USA | 0.122 | USA | 0.561 | Germany | 0.426 | Russian | 0.148 |
| France | 0.435 | France | 0.333 | Italy | 0.114 | Turkey | 0.553 | Turkey | 0.392 | China, Hong Kong SAR | 0.148 |
| UK | 0.363 | UK | 0.274 | Austria | 0.110 | Belgium | 0.460 | Poland | 0.380 | Belgium | 0.143 |
| Belgium | 0.342 | India | 0.245 | Switzerland | 0.110 | Poland | 0.460 | Spain | 0.346 | Mexico | 0.135 |
| Denmark | 0.287 | Belgium | 0.236 | Belgium | 0.105 | Russia | 0.426 | France | 0.338 | Saudi Arabia | 0.135 |
| India | 0.287 | China | 0.228 | Kuwait | 0.105 | France | 0.426 | Belgium | 0.308 | France | 0.131 |
| China | 0.283 | South Africa | 0.207 | France | 0.101 | Spain | 0.418 | China | 0.300 | UK | 0.127 |
| South Africa | 0.278 | Denmark | 0.203 | China, Hong Kong SAR | 0.101 | Denmark | 0.388 | Brazil | 0.283 | United Arab Emirates | 0.122 |
| 2000 | 2021 | ||||||
|---|---|---|---|---|---|---|---|
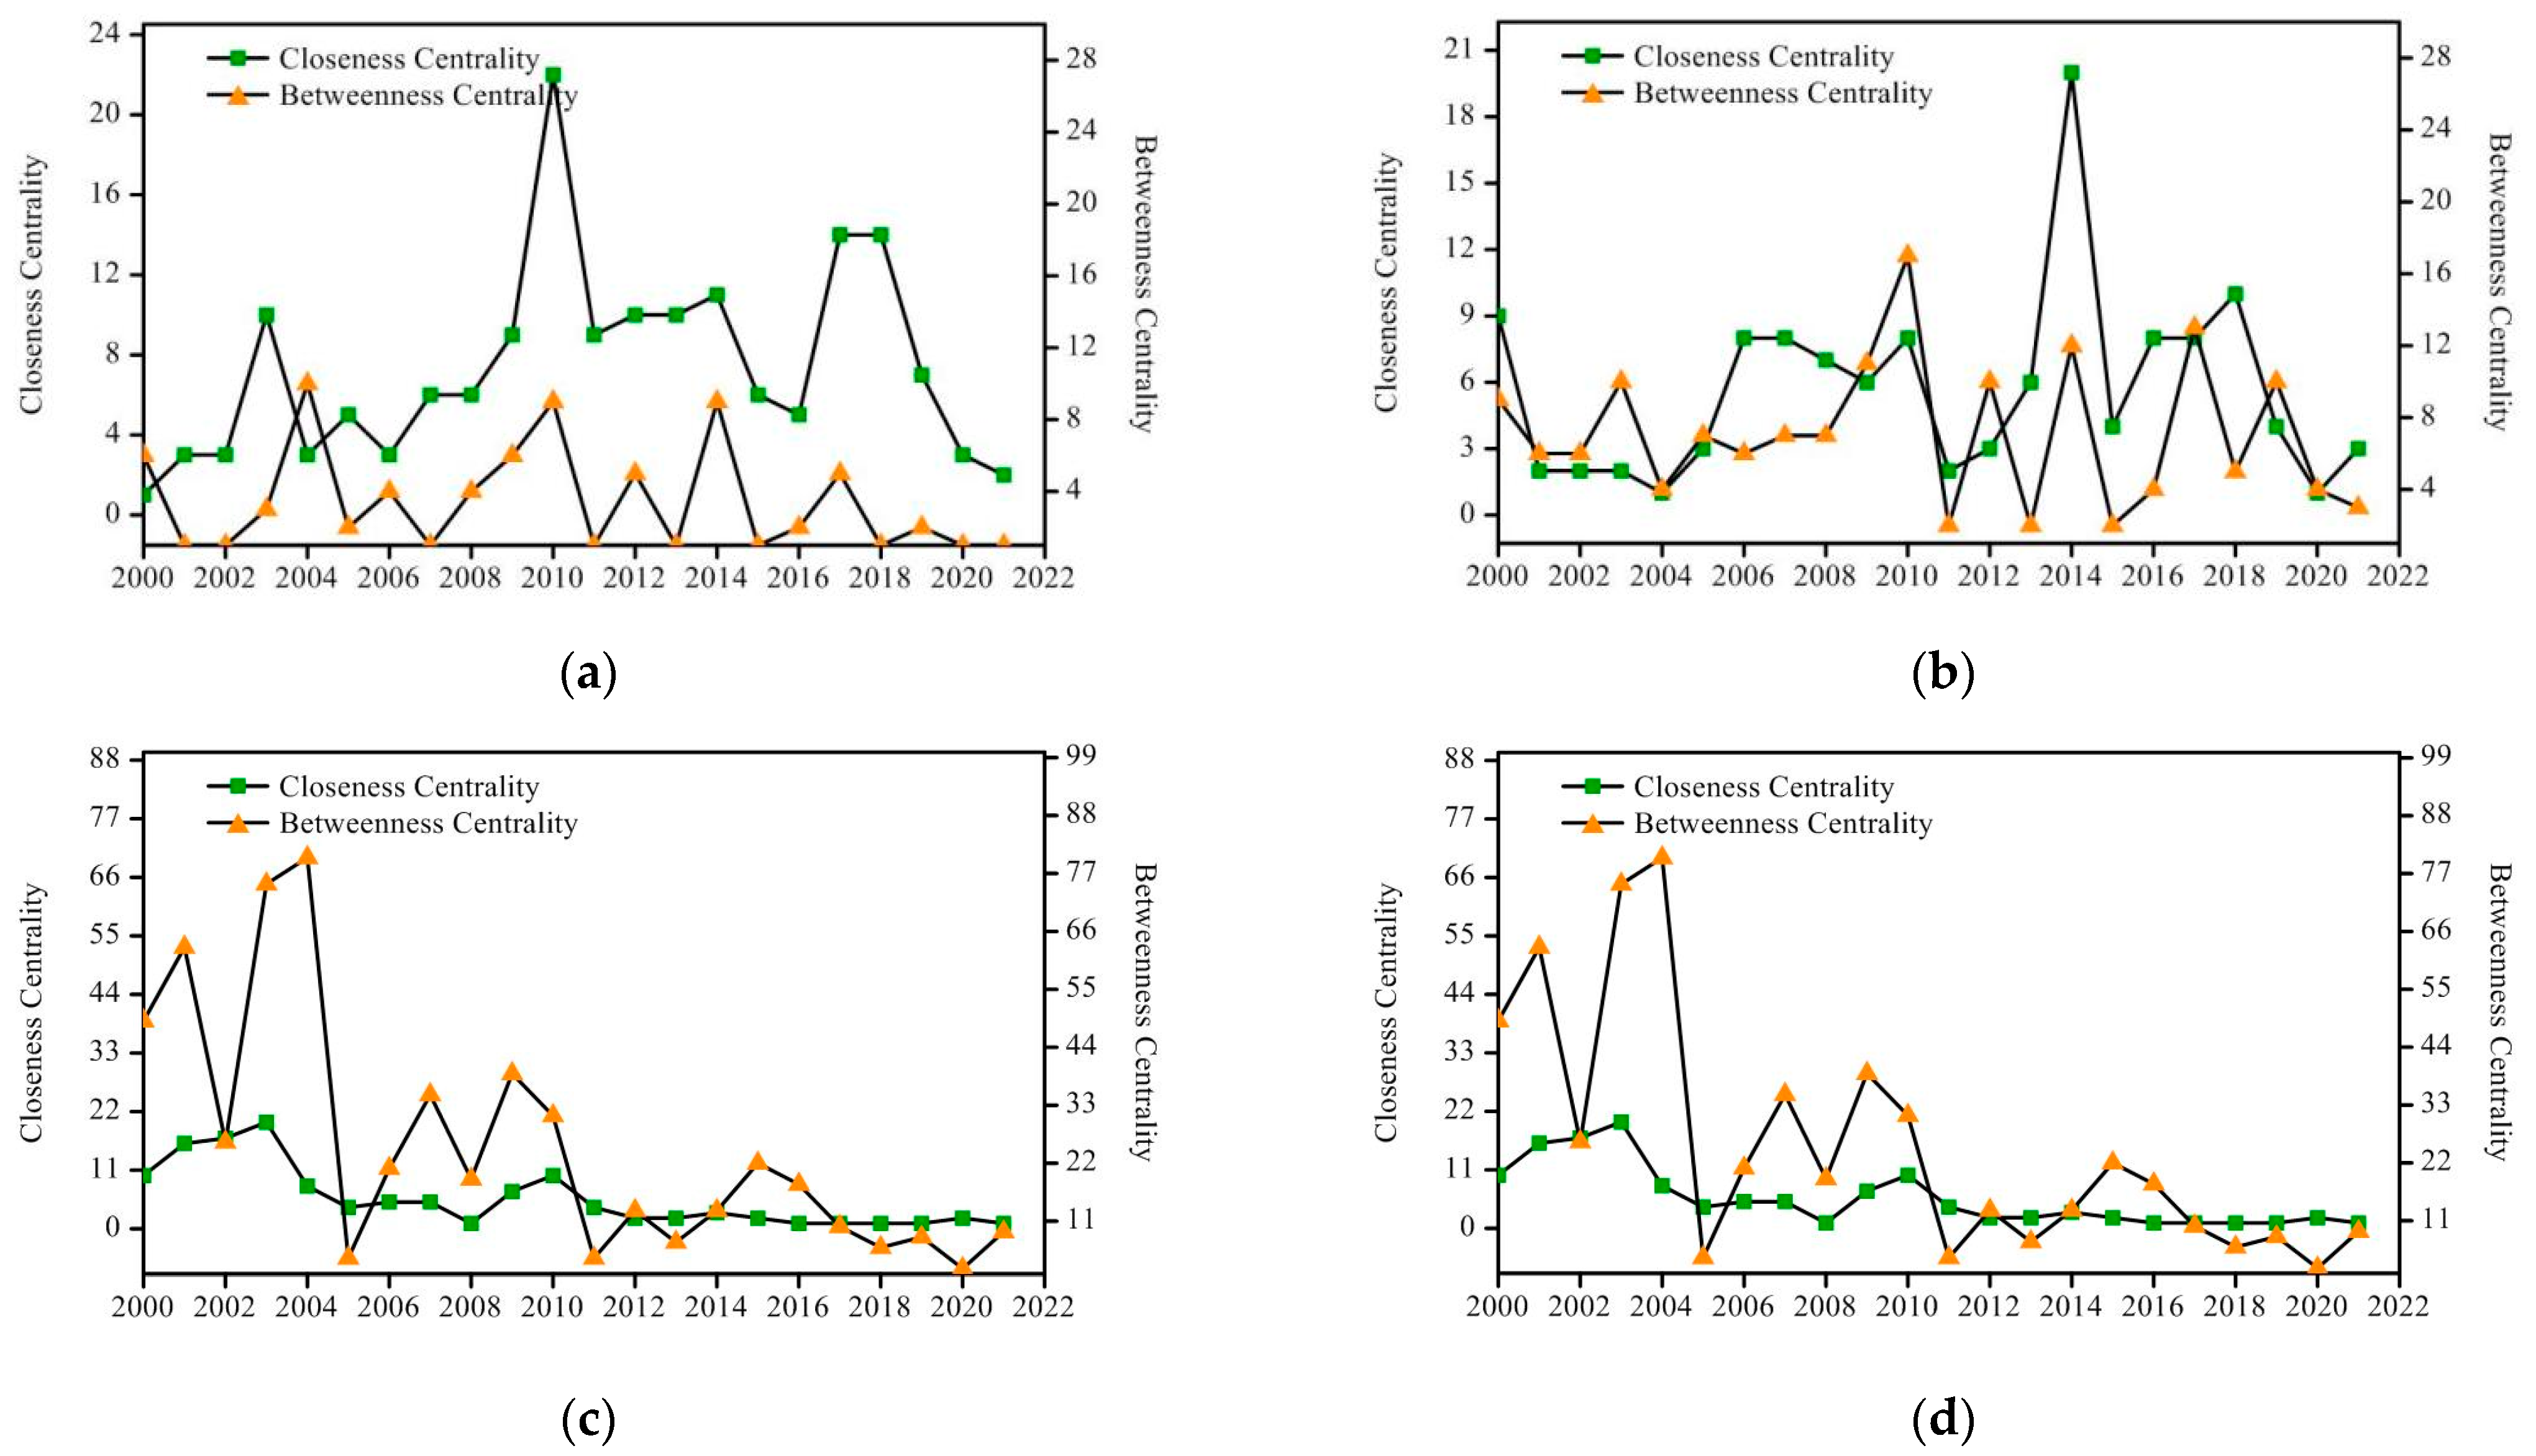
| Node | Closeness Centrality | Node | Betweenness Centrality | Node | Closeness Centrality | Node | Betweenness Centrality |
| USA | 0.235 | Russia | 0.118 | France | 0.267 | USA | 0.174 |
| Italy | 0.228 | USA | 0.103 | USA | 0.246 | France | 0.171 |
| France | 0.228 | France | 0.095 | The Netherlands | 0.242 | The Netherlands | 0.116 |
| Germany | 0.225 | Czech | 0.085 | Brazil | 0.241 | Germany | 0.088 |
| Belgium | 0.225 | Kazakhstan | 0.083 | Turkey | 0.237 | Turkey | 0.087 |
| China, Hong Kong SAR | 0.225 | Ukraine | 0.057 | Germany | 0.236 | Spain | 0.042 |
| Kuwait | 0.224 | Germany | 0.047 | Spain | 0.233 | Russian | 0.039 |
| Spain | 0.222 | United Arab Emirates | 0.036 | Ukraine | 0.232 | Mozambique | 0.028 |
| The Netherlands | 0.221 | Brazil | 0.031 | Italy | 0.231 | United Arab Emirates | 0.026 |
| United Arab Emirates | 0.219 | The Netherlands | 0.027 | Belgium | 0.228 | Denmark | 0.019 |
| Variable | QAP Correlations | Significance | Std. Dev. | Min | Max |
|---|---|---|---|---|---|
| layer | 0.032 | 0.035 | 0.012 | −0.011 | 0.078 |
| gdp | 0.079 | 0.000 | 0.012 | −0.013 | 0.067 |
| pgdp | 0.018 | 0.059 | 0.010 | −0.026 | 0.047 |
| sys | 0.023 | 0.28 | 0.030 | −0.079 | 0.026 |
| fla | 0.18 | 0.000 | 0.029 | −0.043 | 0.091 |
| lan | 0.006 | 0.067 | 0.016 | −0.042 | 0.084 |
| dis | −0.016 | 0.026 | 0.008 | −0.030 | 0.028 |
| Variable | (1) | (2) | (3) | (4) | (5) |
|---|---|---|---|---|---|
| layer | 0.032 ** (0.000) | 0.036 *** (0.000) | 0.032 *** (0.000) | 0.033 *** (0.000) | 0.031 *** (0.000) |
| gdp | 0.103 *** (0.000) | 0.089 *** (0.000) | 0.078 *** (0.000) | 0.069 *** (0.000) | |
| fla | 0.123 *** (0.001) | 0.105 *** (0.001) | 0.121 *** (0.001) | ||
| dis | −0.033 ** (0.001) | −0.029 ** (0.001) | |||
| lan | −0.023 (0.000) |
Disclaimer/Publisher’s Note: The statements, opinions and data contained in all publications are solely those of the individual author(s) and contributor(s) and not of MDPI and/or the editor(s). MDPI and/or the editor(s) disclaim responsibility for any injury to people or property resulting from any ideas, methods, instructions or products referred to in the content. |
© 2023 by the authors. Licensee MDPI, Basel, Switzerland. This article is an open access article distributed under the terms and conditions of the Creative Commons Attribution (CC BY) license (https://creativecommons.org/licenses/by/4.0/).
Share and Cite
Yu, A.; She, H.; Cao, J. Evolution of the Spatial Patterns of Global Egg Trading Networks in the 21 Century. Sustainability 2023, 15, 11895. https://doi.org/10.3390/su151511895
Yu A, She H, Cao J. Evolution of the Spatial Patterns of Global Egg Trading Networks in the 21 Century. Sustainability. 2023; 15(15):11895. https://doi.org/10.3390/su151511895
Chicago/Turabian StyleYu, Aizhi, Huiling She, and Jingsheng Cao. 2023. "Evolution of the Spatial Patterns of Global Egg Trading Networks in the 21 Century" Sustainability 15, no. 15: 11895. https://doi.org/10.3390/su151511895
APA StyleYu, A., She, H., & Cao, J. (2023). Evolution of the Spatial Patterns of Global Egg Trading Networks in the 21 Century. Sustainability, 15(15), 11895. https://doi.org/10.3390/su151511895


