Article

Numerical Study of Resistance Loss and Erosive Wear during Pipe Transport of Paste Slurry

1
School of Resources and Safety Engineering, Central South University, Changsha 410083, China
2
Feny Corporation Limited, Changsha 410600, China
3
Guizhou Lufa Industrial Co., Guiyang 550300, China
*
Author to whom correspondence should be addressed.
Sustainability 2023, 15(15), 11890; https://doi.org/10.3390/su151511890
Submission received: 6 June 2023 / Revised: 11 July 2023 / Accepted: 16 July 2023 / Published: 2 August 2023
(This article belongs to the Special Issue Research on Green Mining Technology with Cemented Paste Backfill)

Abstract

:
Cemented paste backfill (CPB) as a solid waste treatment technology that prepares tailings as aggregate into a highly concentrated slurry to be transported to the underground mining area, is now widely used in mines. However, the pipeline resistance loss and erosion wear during CPB slurry transportation considering the coupling effect of inlet velocities, viscosities, and particle sizes have not yet been well evaluated and analyzed. Hence, the CFD-based three-dimensional network simulation of CPB slurry flow in an L-shaped pipe at different combinations of the three parameters was developed using COMSOL Multiphysics software. The results showed that the pipe resistance loss was most affected by the inlet velocity and viscosity, with the minimum pipe resistance loss occurring at an inlet velocity of 1.5 m/s, a viscosity of 2.0 Pa·s, and a particle size of 150 μm. In particular, pipe erosion wear was severest at the bend and was positively correlated with inlet velocity and particle size, and negatively correlated with slurry viscosity, with maximum pipe erosion wear occurring at an inlet velocity of 3.5 m/s, a viscosity of 3.0 Pa·s, and a particle size of 2000 μm. The findings would be important for the design of the CPB pipeline transportation, which will improve the safety and economic level of a mine.

1. Introduction

Mining, as a traditional heavy industry, provides raw material support for national economic development [1,2], but also inevitably brings a negative impact on the environment [3,4,5]. In the 1980s, with the development of cemented paste backfill (CPB), tailings were used in large quantities for the preparation of high concentration backfill slurry and were recycled [6,7]. Meanwhile, CPB has gradually become a current research hotspot because of its excellent performance in controlling surface settlement, consuming mine solid waste, and backfill underground mining areas, which fits in with the theme of green development [8,9,10,11,12].
CPB as a comprehensive system engineering technology includes tailings flocculation concentration technology, slurry preparation technology, and slurry transport technology [13,14,15]. Among them, the slurry pipeline transport technology is mainly adopted to transport the highly concentrated backfill slurry made of tailings, hydraulic binder, and water mixture to the backfill area by self-flow or pumping over long distances [16,17]. Since the backfill slurry is usually characterized as a pseudoplastic fluid, the longtime cyclic conditions contribute to production accidents, such as blockages and ruptures of the pipeline during the conveying process [18,19]. Therefore, it is essential to recognize the mechanism of resistance loss and pipe wear during pipeline transport for determining the selection of backfilling industrial pumps and the stability of the backfilling process [20,21,22].
Many researches on pipeline transport resistance losses have been conducted, focusing mainly on calculating the pipeline pressure drop and flow rate under different working conditions by using numerical simulation software such as Fluent, FLOW-3D, COMSOL Multiphysics, etc., with fluid’s own physical properties, pipe size, pipe layout form, etc. as independent variables [23,24,25,26,27]. Wu et al. conducted a study utilizing the powerful COMSOL Multiphysics software to explore the comprehensive impact of pipe internal diameter and flow rate on pressure drop in a novel cement slag-coal ash slurry pipe [25]. At the meaning time, Bandyopadhyay et al. delved into the investigation of pressure drop phenomena specifically in small diameter pipes, utilizing the Fluent software [26]. Nevertheless, based on our current understanding, a noticeable void exists within the literature concerning the comprehensive exploration of CPB resistance variations, taking into account the interconnected influences of tailings size, inlet velocity and viscosity. With regard to erosive wear of pipes, Bansal et al. [28] carried out a slurry erosion wear experiment and found that the erosion rate of steel increased with the rise of the impact rate of erosive materials and the slurry concentration. Zhang et al. [29] proposed that the impact angle, flow rate, stress state, mud concentration, and fluid viscosity are the key factors affecting erosion during pipeline transportation in the oil and gas industry. Parsi et al. [30] used Fluent to simulate the erosion caused by sand particles of two different sizes (150 mm and 300 mm) in a 76.2 mm pipe elbow with the air-water flow. Calderon-Hernandez et al. [31] explained the mechanisms by which pipeline wear was associated with erosion, corrosion, and material microstructure. However, the aforementioned studies were mainly focused on the petroleum and chemical industries, and few studies have been completed to investigate pipeline wear during CPB transportation. Furthermore, the coupling effect of the inlet velocity, viscosity, and particle size on the resistance losses and erosion wear has not yet been investigated.
Therefore, the present research employs a computational fluid dynamics (CFD) simulation method implemented in COMSOL Multiphysics software to investigate the properties and mechanism of resistance loss and erosion wear on the pipe wall due to the inlet velocity, viscosity, and particle size during the CPB transportation. Then, the relevant calculation models for resistance loss and erosion wear were established through loop experiment and pipe wear experiment.

2. Computational Model

2.1. Mixture Laminar Flow Model

The COMSOL is a multi-physics field simulation software with a convenient interface and robust post-processing capabilities for users. It is therefore used for modeling the pipeline transport of CPB slurry. Hewitt D et al. [32] defined CPB slurry as a solid-liquid two-phase flow mixture. In comparison to the Eulerian model, the mixture model offers a simpler and more efficient approach to manipulate and describe the flow characteristics of the CPB slurry in the pipeline. As a result, the COMSOL software utilizes the mixture model to accurately represent the flow state of the CPB slurry, providing a practical and effective solution [33,34,35]. Specific expressions for the mixture momentum equations and the dispersed phase transport equations are given in the literature [36]. The flow regime of viscous fluid in a circular pipe (i.e., laminar, transition, or turbulent) can be specified by the Reynolds number (Re), which depends on the flow velocity, density and viscosity of the fluid as well as the diameter of the pipe [37]. Furthermore, the calculated Re value for the CPB slurry is less than 2000, which is consistent with the laminar flow regime.

2.2. Particle Flow Tracking Model

For the description of the effect of particle motion in the CPB slurry on the erosion and wear of the pipe wall, a fluid flow particle tracking model was adopted. Based on CFD principles and Newton’s second law, the equations of particle motion were solved and information on impact particle collisions close to the pipe wall was recorded at each CFD cell and substituted into the E/CRC equation [38] to calculate the erosion wear rate of the backfill slurry on the pipe wall.
The equation of motion of the particle can be written as:
d ( m p v ) d t = F t
where m p is the mass of the particle (units: kg), v is its velocity (units: m/s), and F t is the external force on the particle at a given moment (units: N).
The E/CRC erosion and wear equation can be written as:
E R = C ( B H ) 0.59 F S v n F ( α )
where ER is the erosion rate (units: kg/(m2·s), defined as the amount of wall mass lost due to particle impact divided by the mass of impacting particles, C is an erosion model coefficient, FS is the particle shape coefficient, BH is the Brinell hardness of the wall material (dimensionless), n is an empirical constant equal to 2.41, and F α is the impact angle function, defined as follows:
F ( α ) = 0.6947 ( sin ( α ) ) 0.2 ( 1 + 1.4811 ( 1 sin ( α ) ) ) 2

2.3. Flow Domain and Boundary Conditions

Due to the symmetry of the model geometry, only one half of the model needs to be simulated, reducing the size of the 3D simulation domain in COMSOL without compromising the calculation results. Figure 1a illustrates the configuration of the pipe, comprising vertical and horizontal sections measuring 5 m and 20 m in length, respectively. These sections are interconnected by a 90° bend, featuring radii of curvature measuring 0.5 m and 0.4 m on the outer and inner sides of the pipe, respectively. The pipe mouth diameter is 0.1 m. Furthermore, a structured network grid was employed to create the simulation model, ensuring accurate and precise representation of the system. The mesh sizing was chosen according to the ‘based on fluid dynamics’ setting in COMSOL, with the vertical and horizontal pipe meshes set to ‘finer’ (defined as a maximum grid of 0.171 m and a minimum grid of 2.44 × 10⁻³ m) and the bent pipe section meshes set to ‘superfine’ (defined as a maximum grid of 0.0793 and a minimum grid of 9.15 × 10⁻⁴ m). Based on the grid subdivision setting in COMSOL, the grid convergence test is shown in the Table 1 below, and we found that grid 4 meets the accuracy requirement after refinement, which is the grid used in this paper. The local mesh division of the pipe are shown in Figure 1b.
The CPB slurry was influenced by the force of gravity acting in the downward direction (g = 9.8 m/s2) along the negative z-axis, as illustrated in Figure 1. To accurately capture the flow behavior, the boundary conditions for the mixture laminar flow model were meticulously selected. These included the inlet velocity, outlet pressure (with a relative value of 0 compared to the inlet), and the application of the no-slip condition at the pipe wall. These thoughtfully chosen boundary conditions ensured a comprehensive and precise representation of the fluid dynamics within the system. The fluid flow particle tracking model sets the inlet (based on mixture velocity inlet), pipe wall (adhesion), and outlet wall (disappearance) conditions. As for the convergence criterion, the model accuracy of 0.001 is adopted. The time step used for the simulation in this paper is 0.01 s and the total time is 5 s.
The relative complexity of the mechanical structure of the CPB slurry resulted in the flow law being difficult to solve accurately, so modeling and calculations were carried out under the following assumptions: (1) the CPB slurry was assumed to be a flowing incompressible fluid; (2) the viscosity of the CPB slurry was constant in time and temperature; (3) heat transfer during CPB slurry transport was neglected; (4) CPB slurry transport was considered to be unaffected by external forces such as vibration and ground pressure waves; (5) the CPB slurry is uniformly distributed around the pipe inlet because it is uniformly mixed prior to conveying.

2.4. Simulation Scenarios

In this study, various simulation runs were performed with different parameters. The inlet velocities of the CPB slurry were adjusted to 1.5 m/s, 2.5 m/s, and 3.5 m/s, while the viscosities ranged from 2.0 Pa·s to 3.0 Pa·s. Additionally, the particle sizes used in the simulations varied, including 150 μm, 1000 μm, and 2000 μm. These values were chosen based on a prototype pipeline system of a mine with the purposes of researching the changes in the resistance loss in bends (section AB in Figure 1) and horizontal pipes (section BC in Figure 1), and the erosion and wear on the pipe walls under the combination of these three variables. The material parameters of the simulations are presented in Table 1. The CFD simulations are based on the COMSOL finite element solution platform, using a mixed laminar flow model coupled with a particle tracking model. The relevant material parameters for the simulations are listed in Table 2. The CFD simulations were performed on the COMSOL software, combining a mixed laminar flow model with a particle tracking model.

2.5. Model Validation

To ensure the accuracy of the simulation outcomes, the model was meticulously validated by comparing the results with experimental data obtained from reputable literature sources [39]. The focus of the study was to investigate the slurry transport characteristics, which were effectively captured by simulating the flow behavior in a horizontal pipe with precise dimensions. The pipe had a diameter of 54.9 mm and a length of 3.3 m, mirroring the experimental setup closely. This careful selection of the pipe configuration enabled a robust and reliable comparison between the simulated results and the observed data, establishing the model’s credibility. In this particular scenario, a simulation velocity of 1 m/s was carefully selected. The slurry composition consisted of spherical glass beads with varying concentrations: 10%, 20%, and 30%. These different concentrations corresponded to specific viscosities of 0.032 Pa·s, 0.057 Pa·s, and 0.065 Pa·s, respectively. By considering these parameters, the simulation accurately captured the behavior of the slurry, allowing for a comprehensive analysis of its flow dynamics. Figure 2 depicts a detailed comparison between the numerical simulations and experimental findings. Strikingly, the two datasets demonstrate an impressive level of concordance, with a maximum error of less than 8%. This outstanding agreement firmly attests to the precision and reliability of the numerical simulations, rendering them highly appropriate for conducting studies on pipeline transport. These results unequivocally affirm the accuracy and acceptability of employing such simulations as a valuable tool for comprehending and analyzing the intricate dynamics of slurry flow within pipeline systems.

3. Results and Discussion

3.1. Resistance Loss Characteristics of CPB Slurry in Pipes

The average pressure and average velocity of the cross-section at points A and B of the bend and at point C of the outlet of the horizontal pipe section (Figure 1) were modeled using COMSOL. The pressure at the exit point C was defined as 0 relative to the inlet pressure, and the resistance loss within the pipe was evaluated utilizing Bernoulli’s equation [40]:
ρ g ( y 1 + p 1 ρ g + v 1 2 2 g ) = ρ g ( y 2 + p 2 ρ g + v 2 2 2 g ) + h f
In the equation, ρ represents the average density of the mixture, while y 1   and   y 2 denote the heights at positions 1 and 2 respectively (measured in meters). The corresponding pressures at these positions are represented by p 1   and   p 2 , while the average velocities are denoted as v 1   and   v 2 respectively. Furthermore, h f represents the resistance loss occurring between positions 1 and 2, measured in pascals (Pa).

3.1.1. Variation of Flow Rate and Pressure Patterns

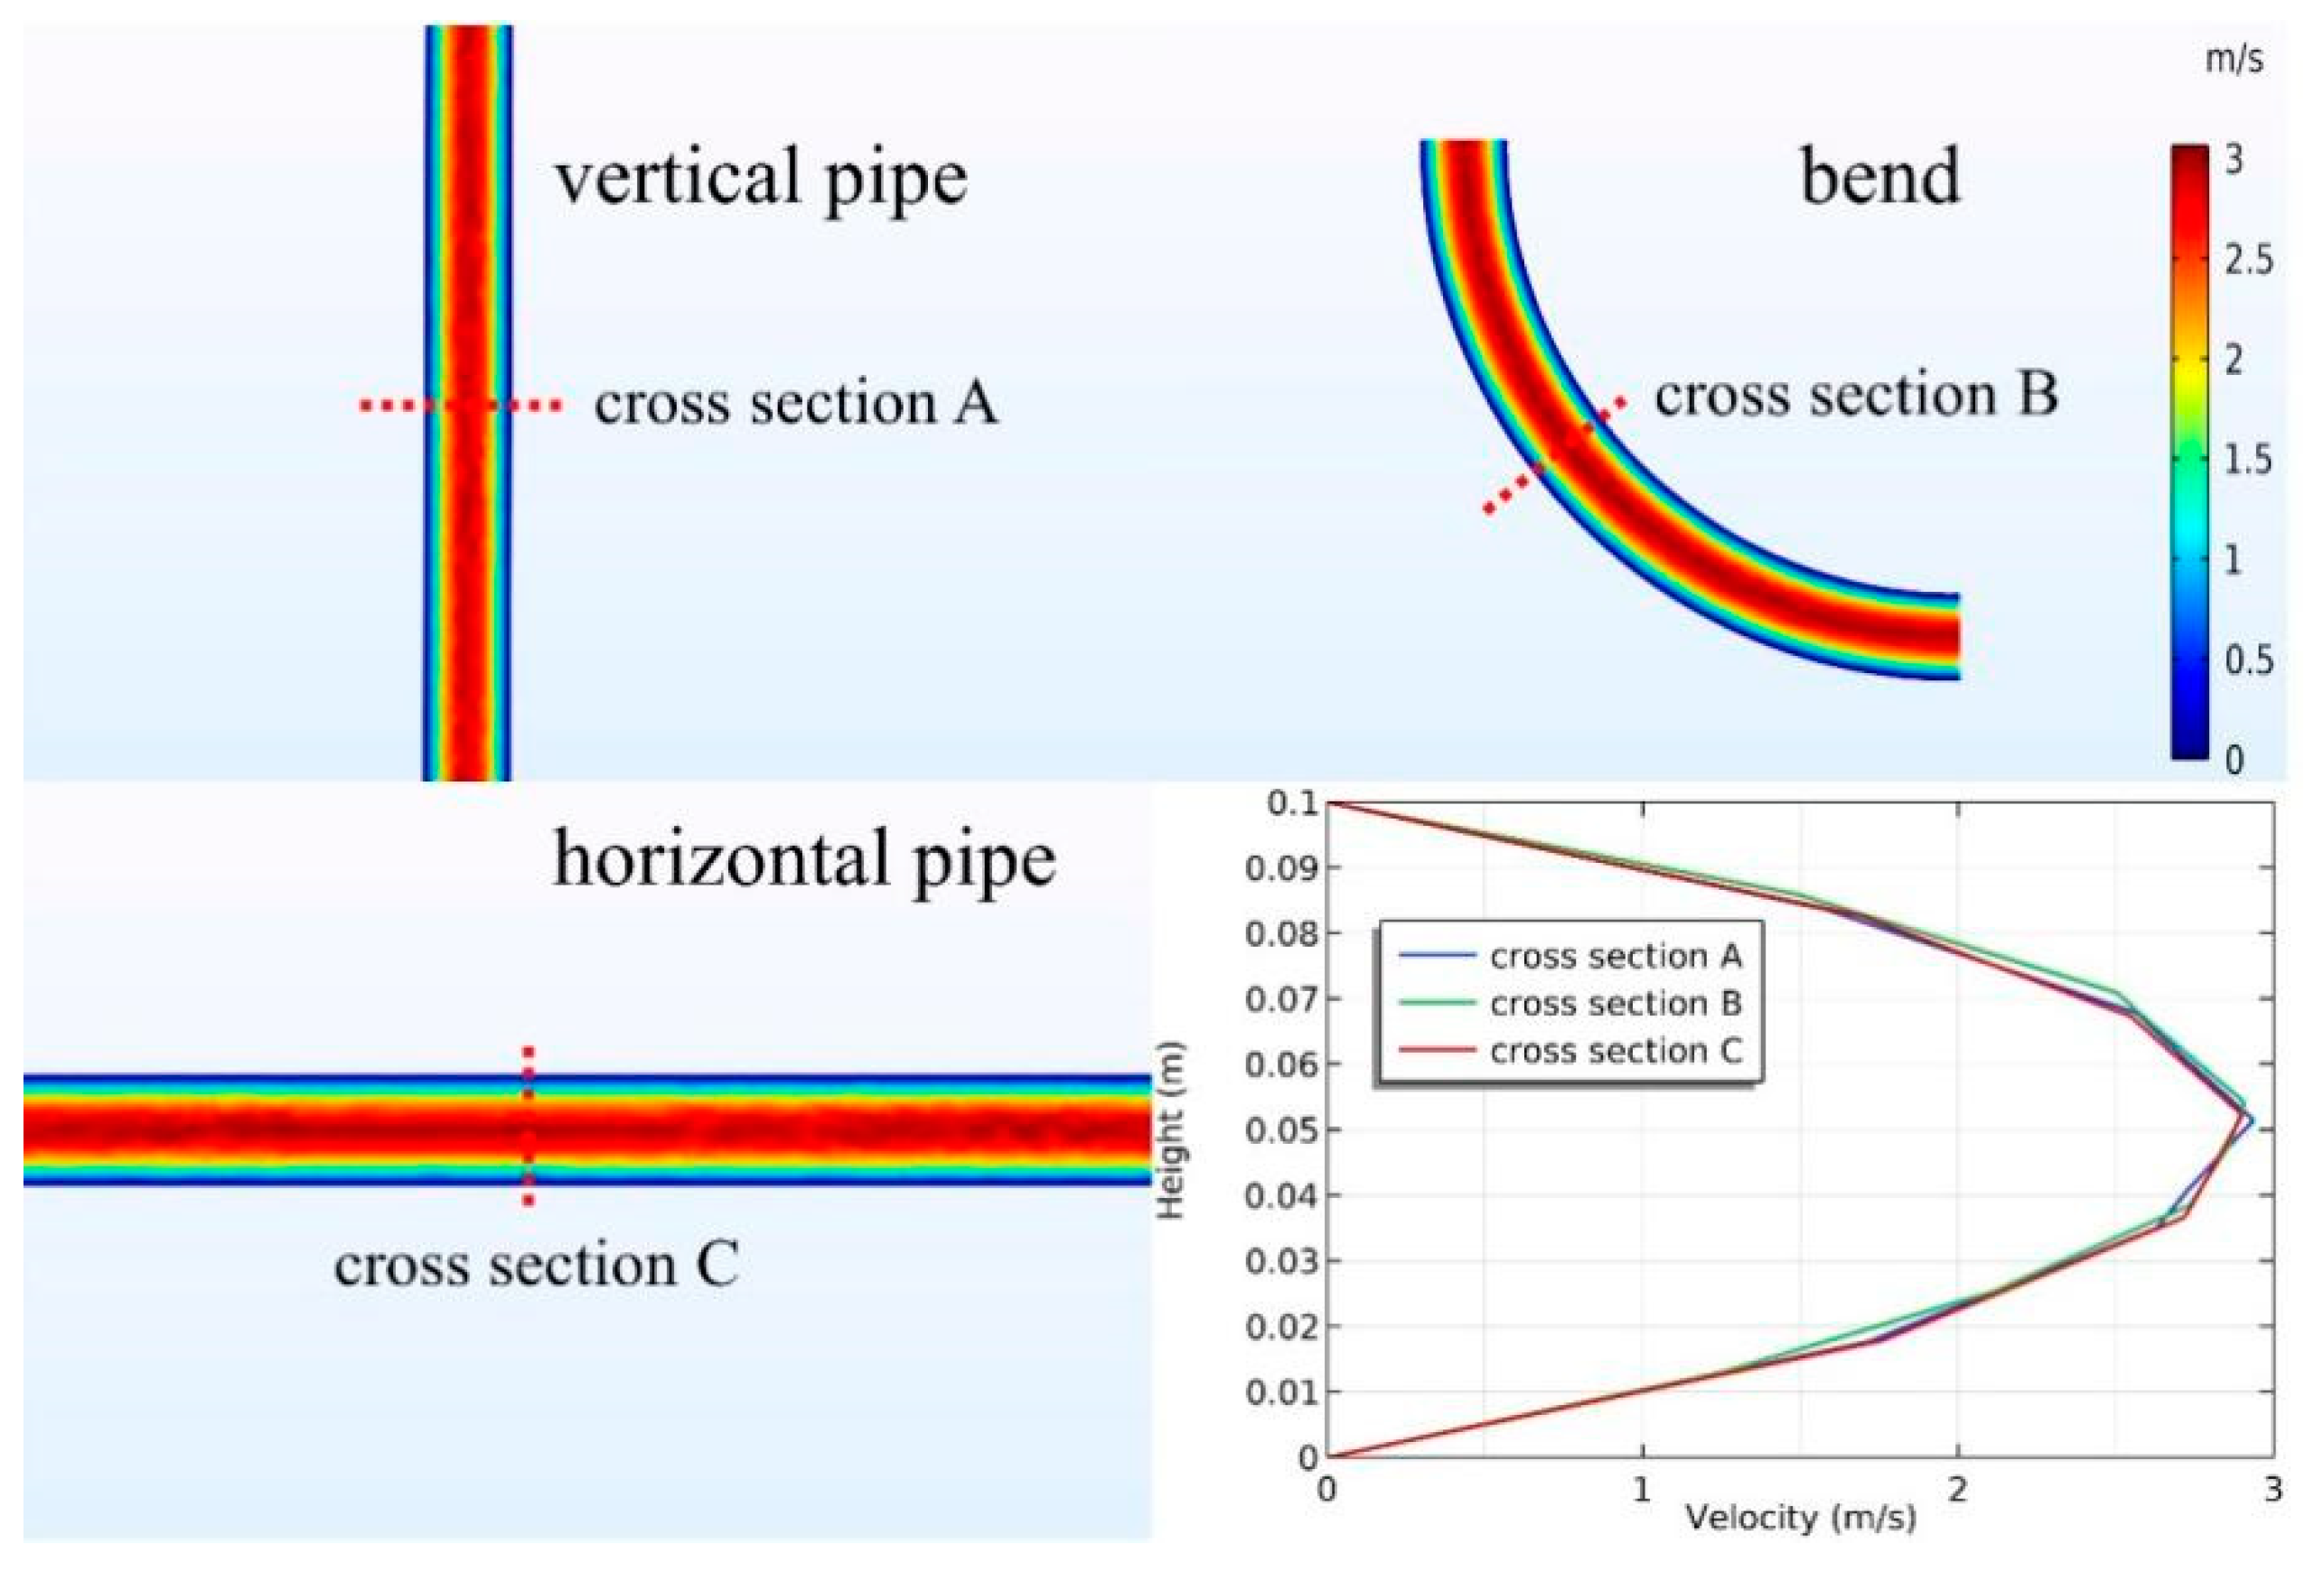
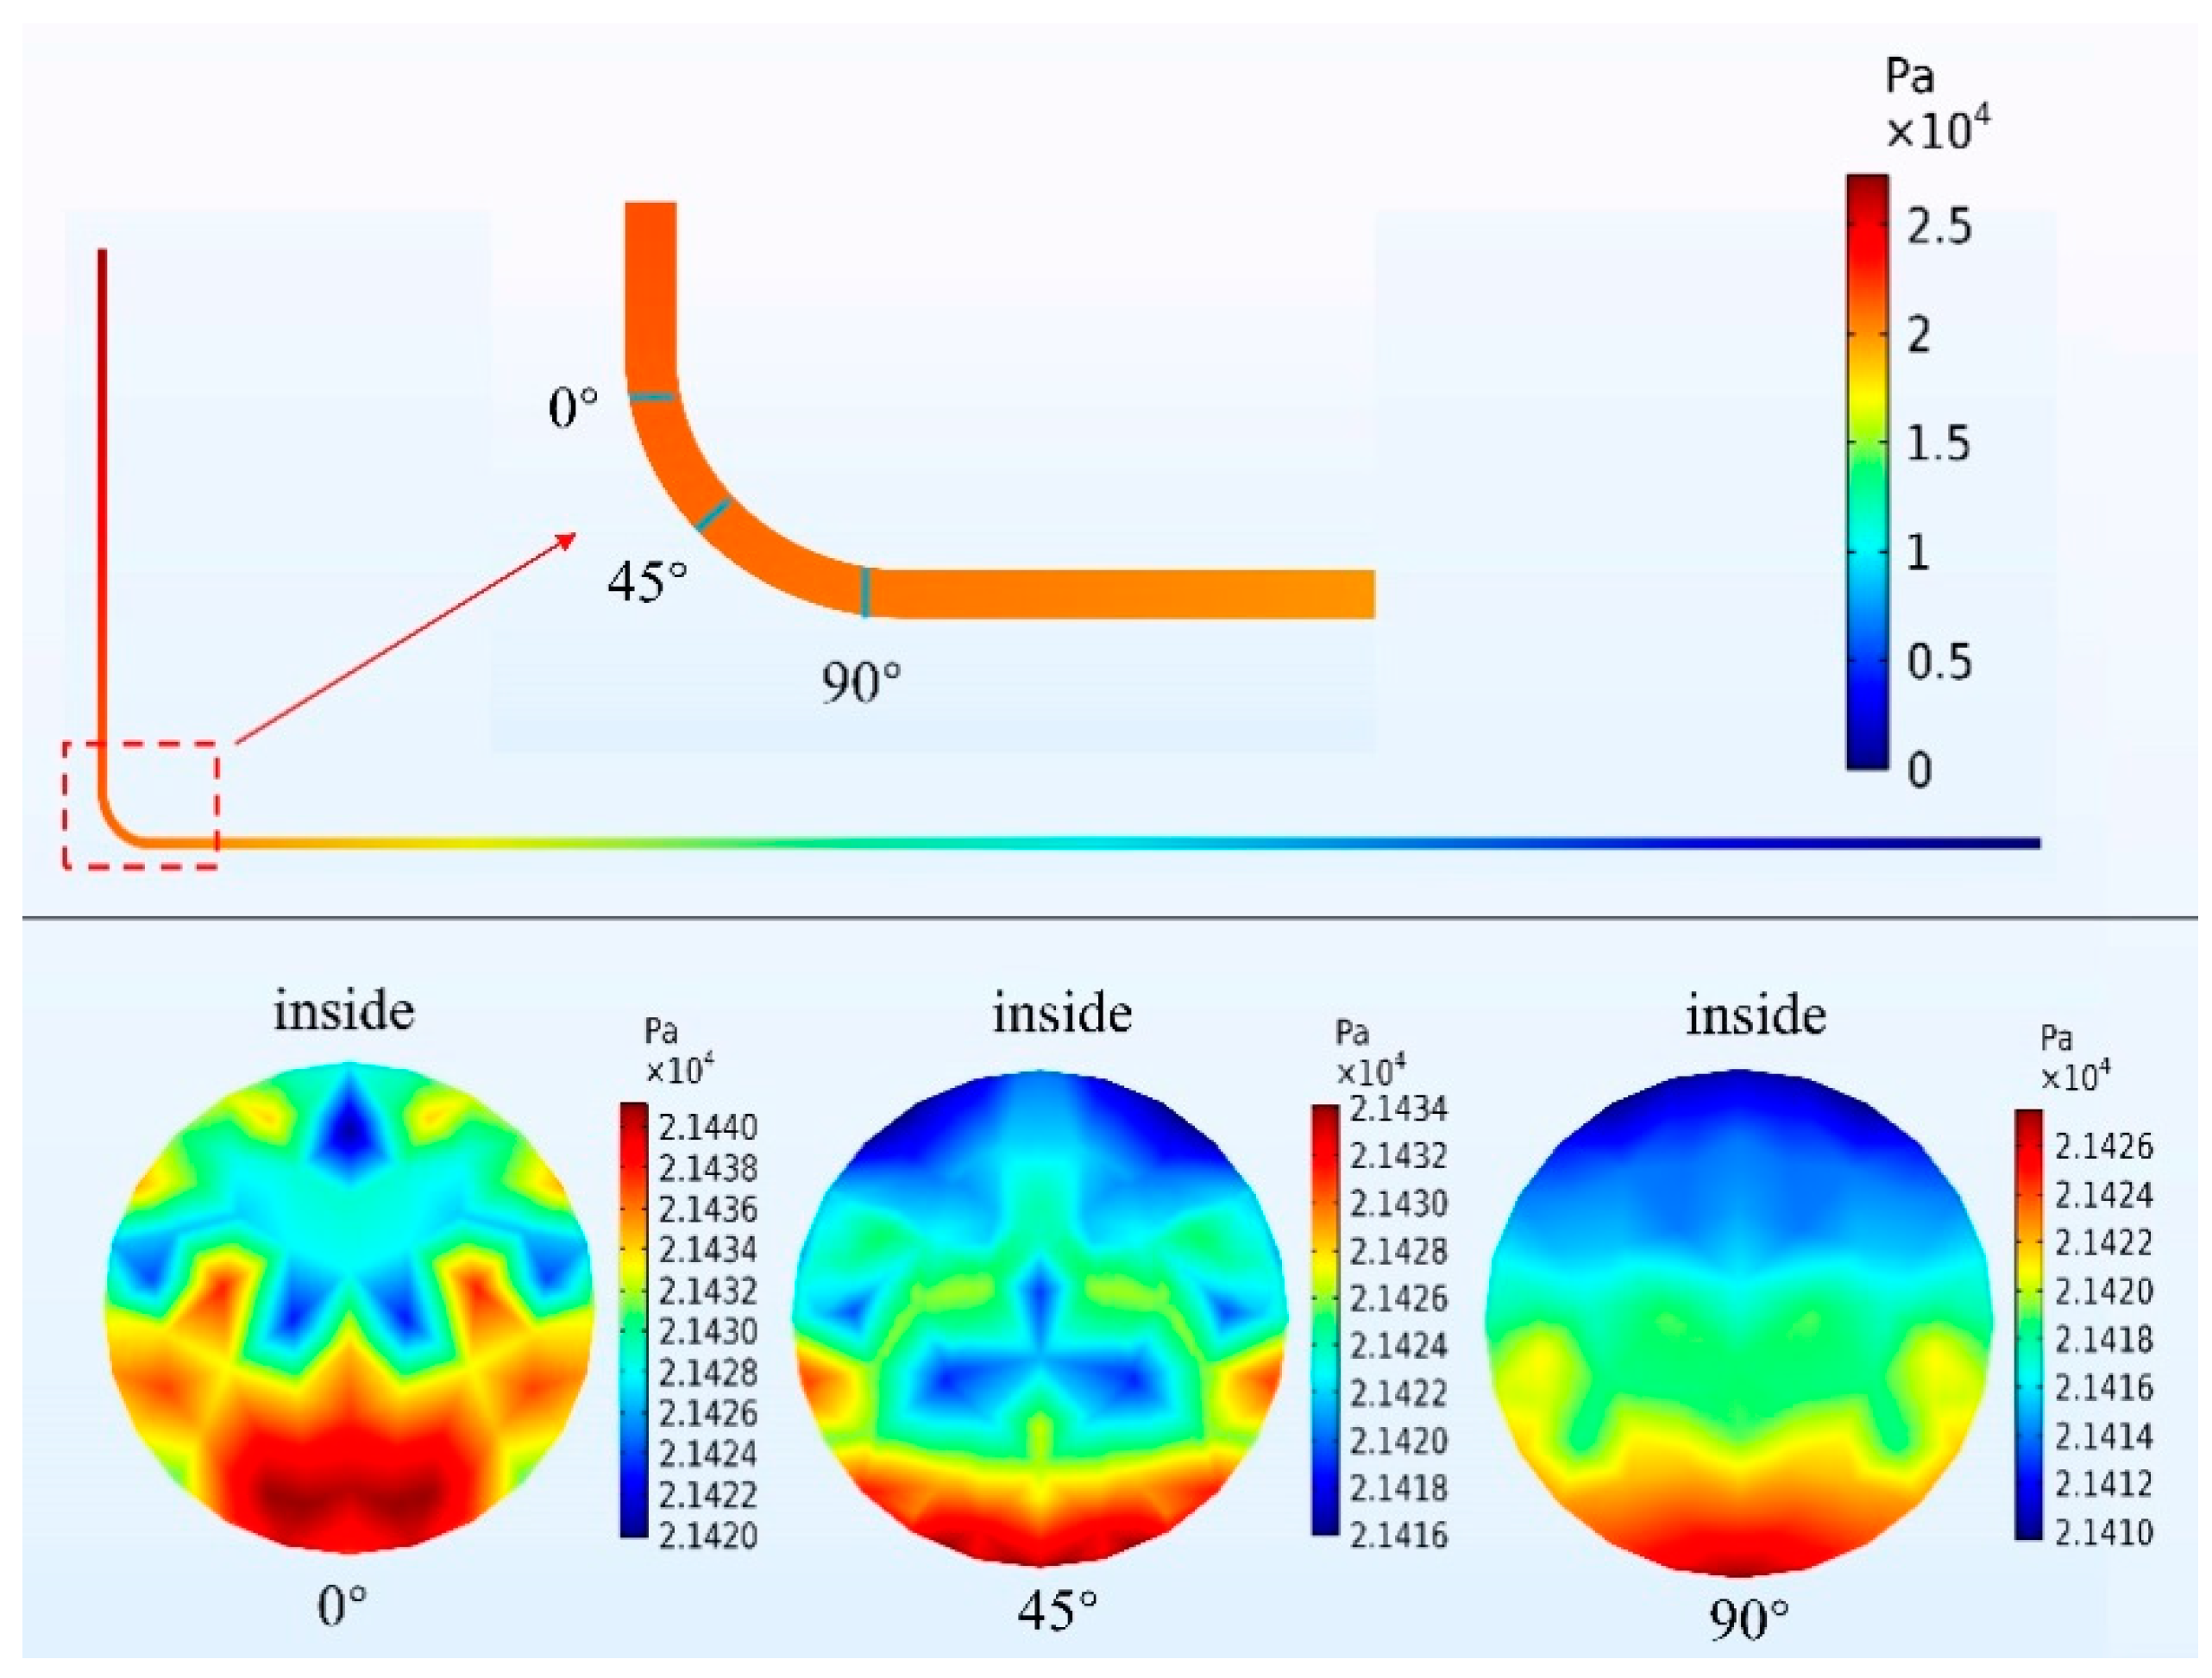
As shown in Figure 3, it is obvious that the velocity of the slurry is greatest at the center of the pipe before gradually decreasing to a velocity of 0 near the wall, which is consistent with previous results [41]. Figure 4 demonstrates the pressure distribution of the CPB slurry during the flow in the pipe, from which it can be seen that the pressure drops from the inlet to the outlet. The pressure distributions at the inlet (0°), center (45°), and outlet (90°) of the bend are intercepted at the bend. It is evident that the cross-sectional pressure distributions are different depending on the position. The main reason is that the CPB slurry entering the bend and being subjected to centrifugal forces, which causes a change of the inner and outer fluid velocities in the pipe, resulting in a pressure difference [42]. The results also indicated that the pressure was larger at the outer wall of the bend, but that the difference in values between the outer and inner walls was small, ranging from 15–25 Pa. It may be caused by the high concentration of CPB slurry, which resulted in a small change in the velocity gradient between the outer and inner fluid layers of the bend. These findings were also funded in the bend pipe pressure distribution in Wu et al.’s study [43].

3.1.2. The Impact of Inlet Velocity and Viscosity on Resistance Loss

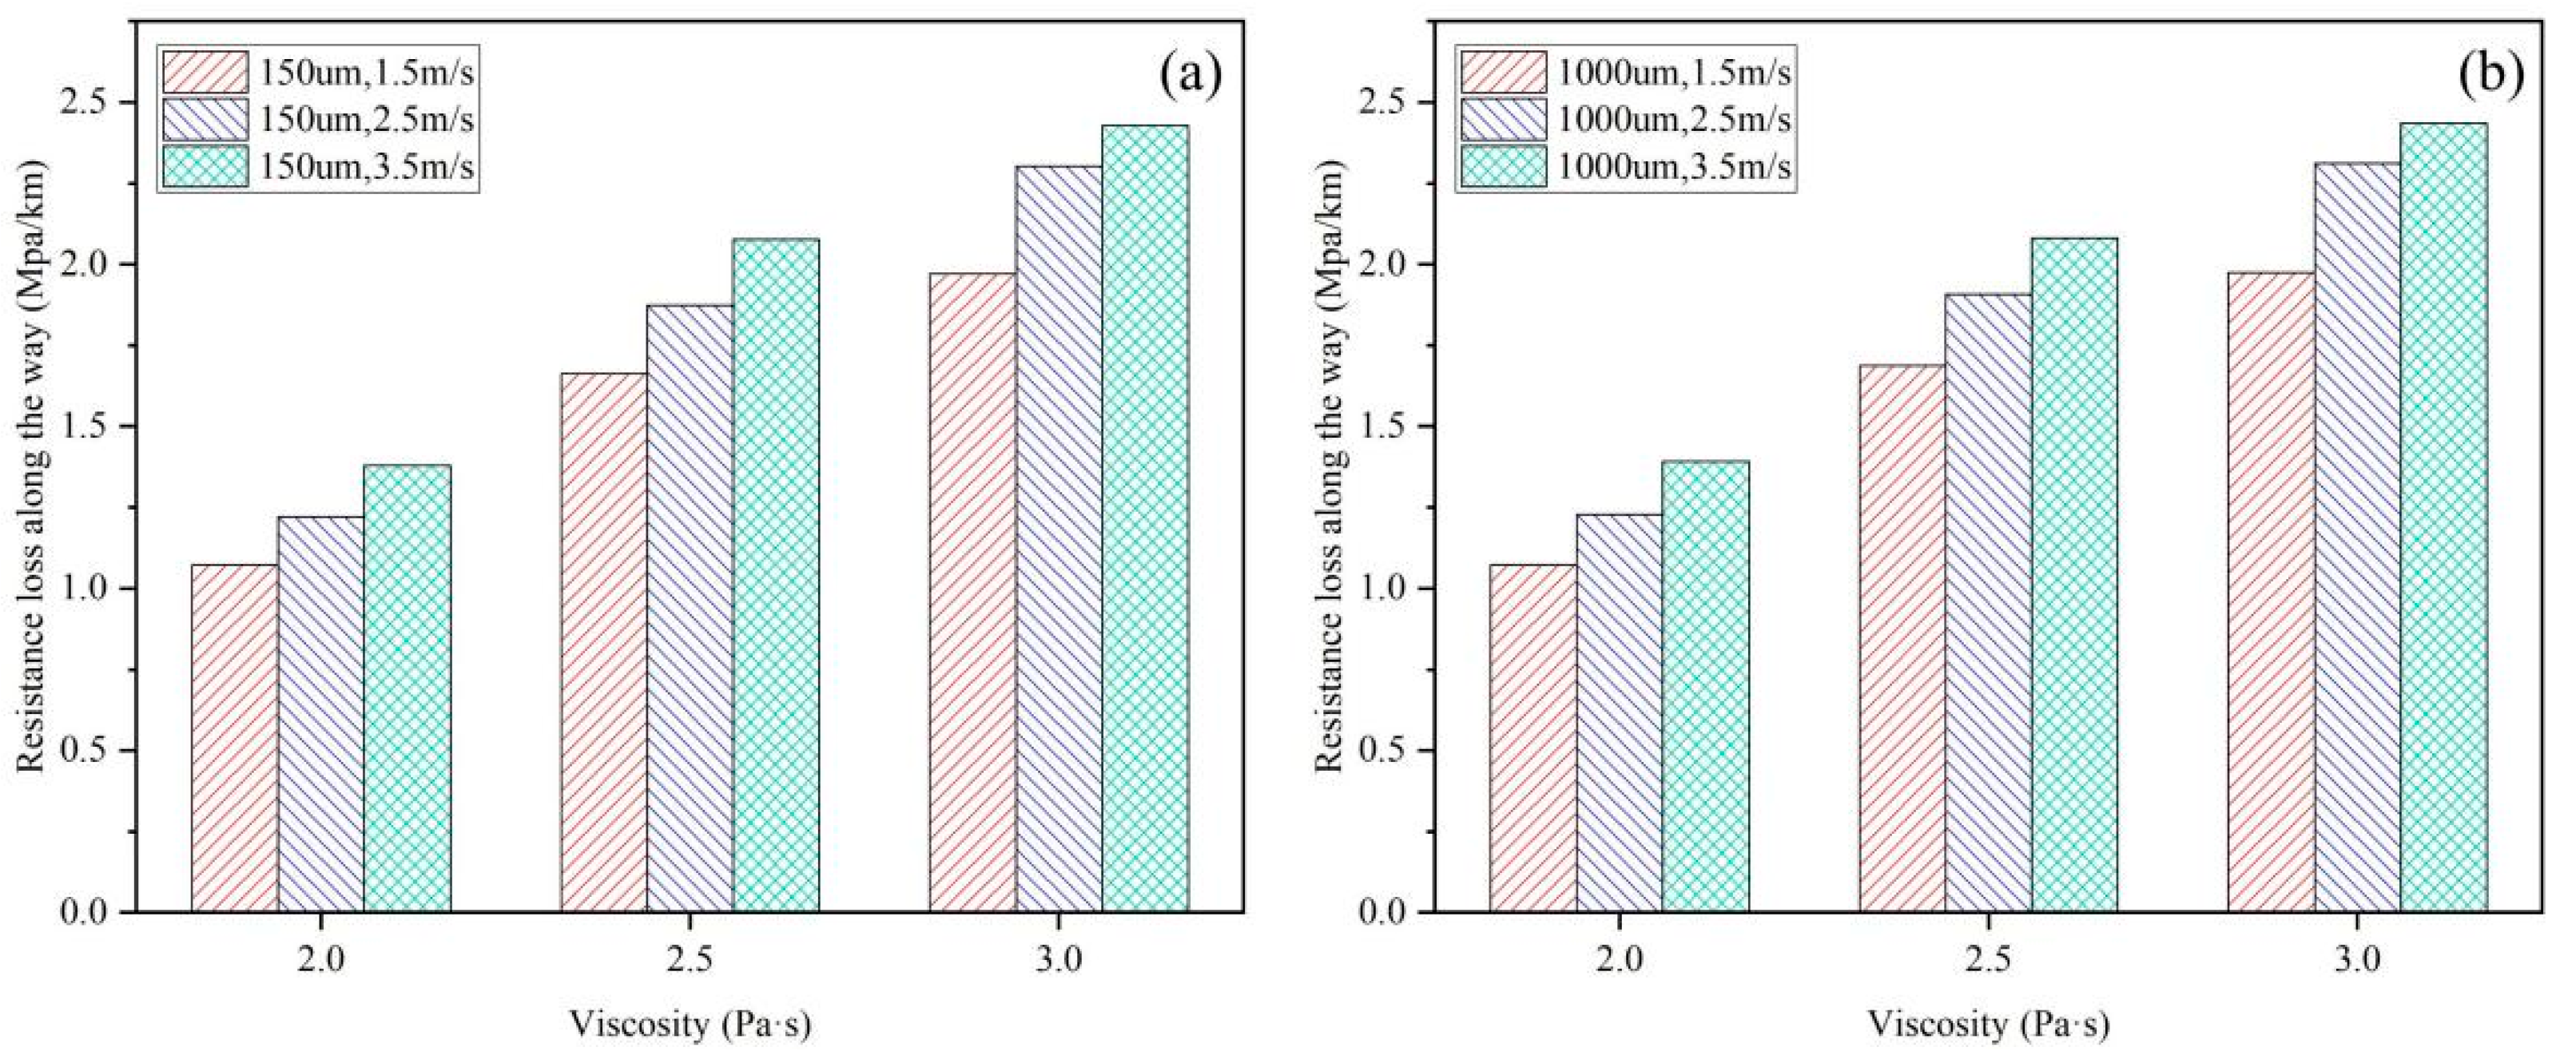
Figure 5 illustrates the unit resistance losses during horizontal pipeline transport of CPB slurry with an average particle size of 150 μm (Figure 4a) and 1000 μm (Figure 5b). As can be seen from Figure 5a, there is a clear trend towards a significant increase in the corresponding pipe resistance losses as the viscosity increases from 2.0 to 3.0 Pa·s or the inlet velocity increases from 1.5 to 3.5 m/s. As per the Bingham fluid model [44,45,46], the primary source of resistance loss in high concentration slurry during pipeline transport arises from the relative motion between different fluid layers. The increase in fluid velocity and viscosity will result in a corresponding shear stress gain, which in turn will cause more energy to be consumed in the CPB slurry conveying process, manifesting itself as greater resistance losses [47,48].

3.1.3. The Impact of Particle Size on Resistance Loss

Figure 6 displays the simulation findings of various particle sizes on the resistance loss of CPB slurry in the straight pipe section (BC section in Figure 1). The findings show that the resistance loss increases under the same circumstances with increasing CPB slurry particle size. The resistance loss increases from 1.66 MPa/km to 1.71 MPa/km as the particle size grows from 150 m to 2000 m at a viscosity of the CPB slurry of 2.5 Pa/s and an inlet velocity of 1.5 m/s. In line with these findings, an increase in the inflow velocity from 1.5 m/s to 3.5 m/s leads to a proportional rise in resistance loss, from 1.71 MPa/km to 2.08 MPa/km. These outcomes remain consistent when the viscosity of the CPB slurry is maintained at 2.5 Pa/s, and the particle size measures 2000 μm. As a result, the CPB slurry’s resistance loss will grow as the particles increase, although the sensitivity is considerably lower than the inflow velocity and viscosity. This is primarily due to the high concentration of CPB slurry flowing in the pipe, which interacts with the pipe wall to reduce friction between the fluid and the pipe wall. This is macroscopically reflected in an increase in particles and a corresponding increase in resistance losses, but the increase is only slight. While this is happening, more little particles are present in the slurry at the same mass concentration, which results in a more significant loss of power through particle-to-particle collision and partially cancels out the reduction in resistance loss. As a result, compared to a tiny particle slurry, the resistance loss of the big particle slurry obtained in this research is slightly higher. Still, the gain is restricted, which is more consistent with the experimental findings in the literature [38].

3.1.4. Resistance Loss at Bends

Figure 7 presents the local resistance loss of the CPB slurry at the bend (section AB in Figure 1). The results demonstrate that the local resistance loss increases with increasing inlet velocity, slurry viscosity and particle size, and that the first two variables are more influential. It was consistent with the resistance loss patterns for sections BC and AB. In addition, the resistance loss in the AB section was higher than those in the BC section due to the sharp pressure changes at the bend, the collision of fluid particles, and the increased friction, all of which caused additional local losses [49].

3.2. Erosion Wear Characteristics of the Pipe Wall

3.2.1. Effect of Inlet Velocity on Erosion Wear

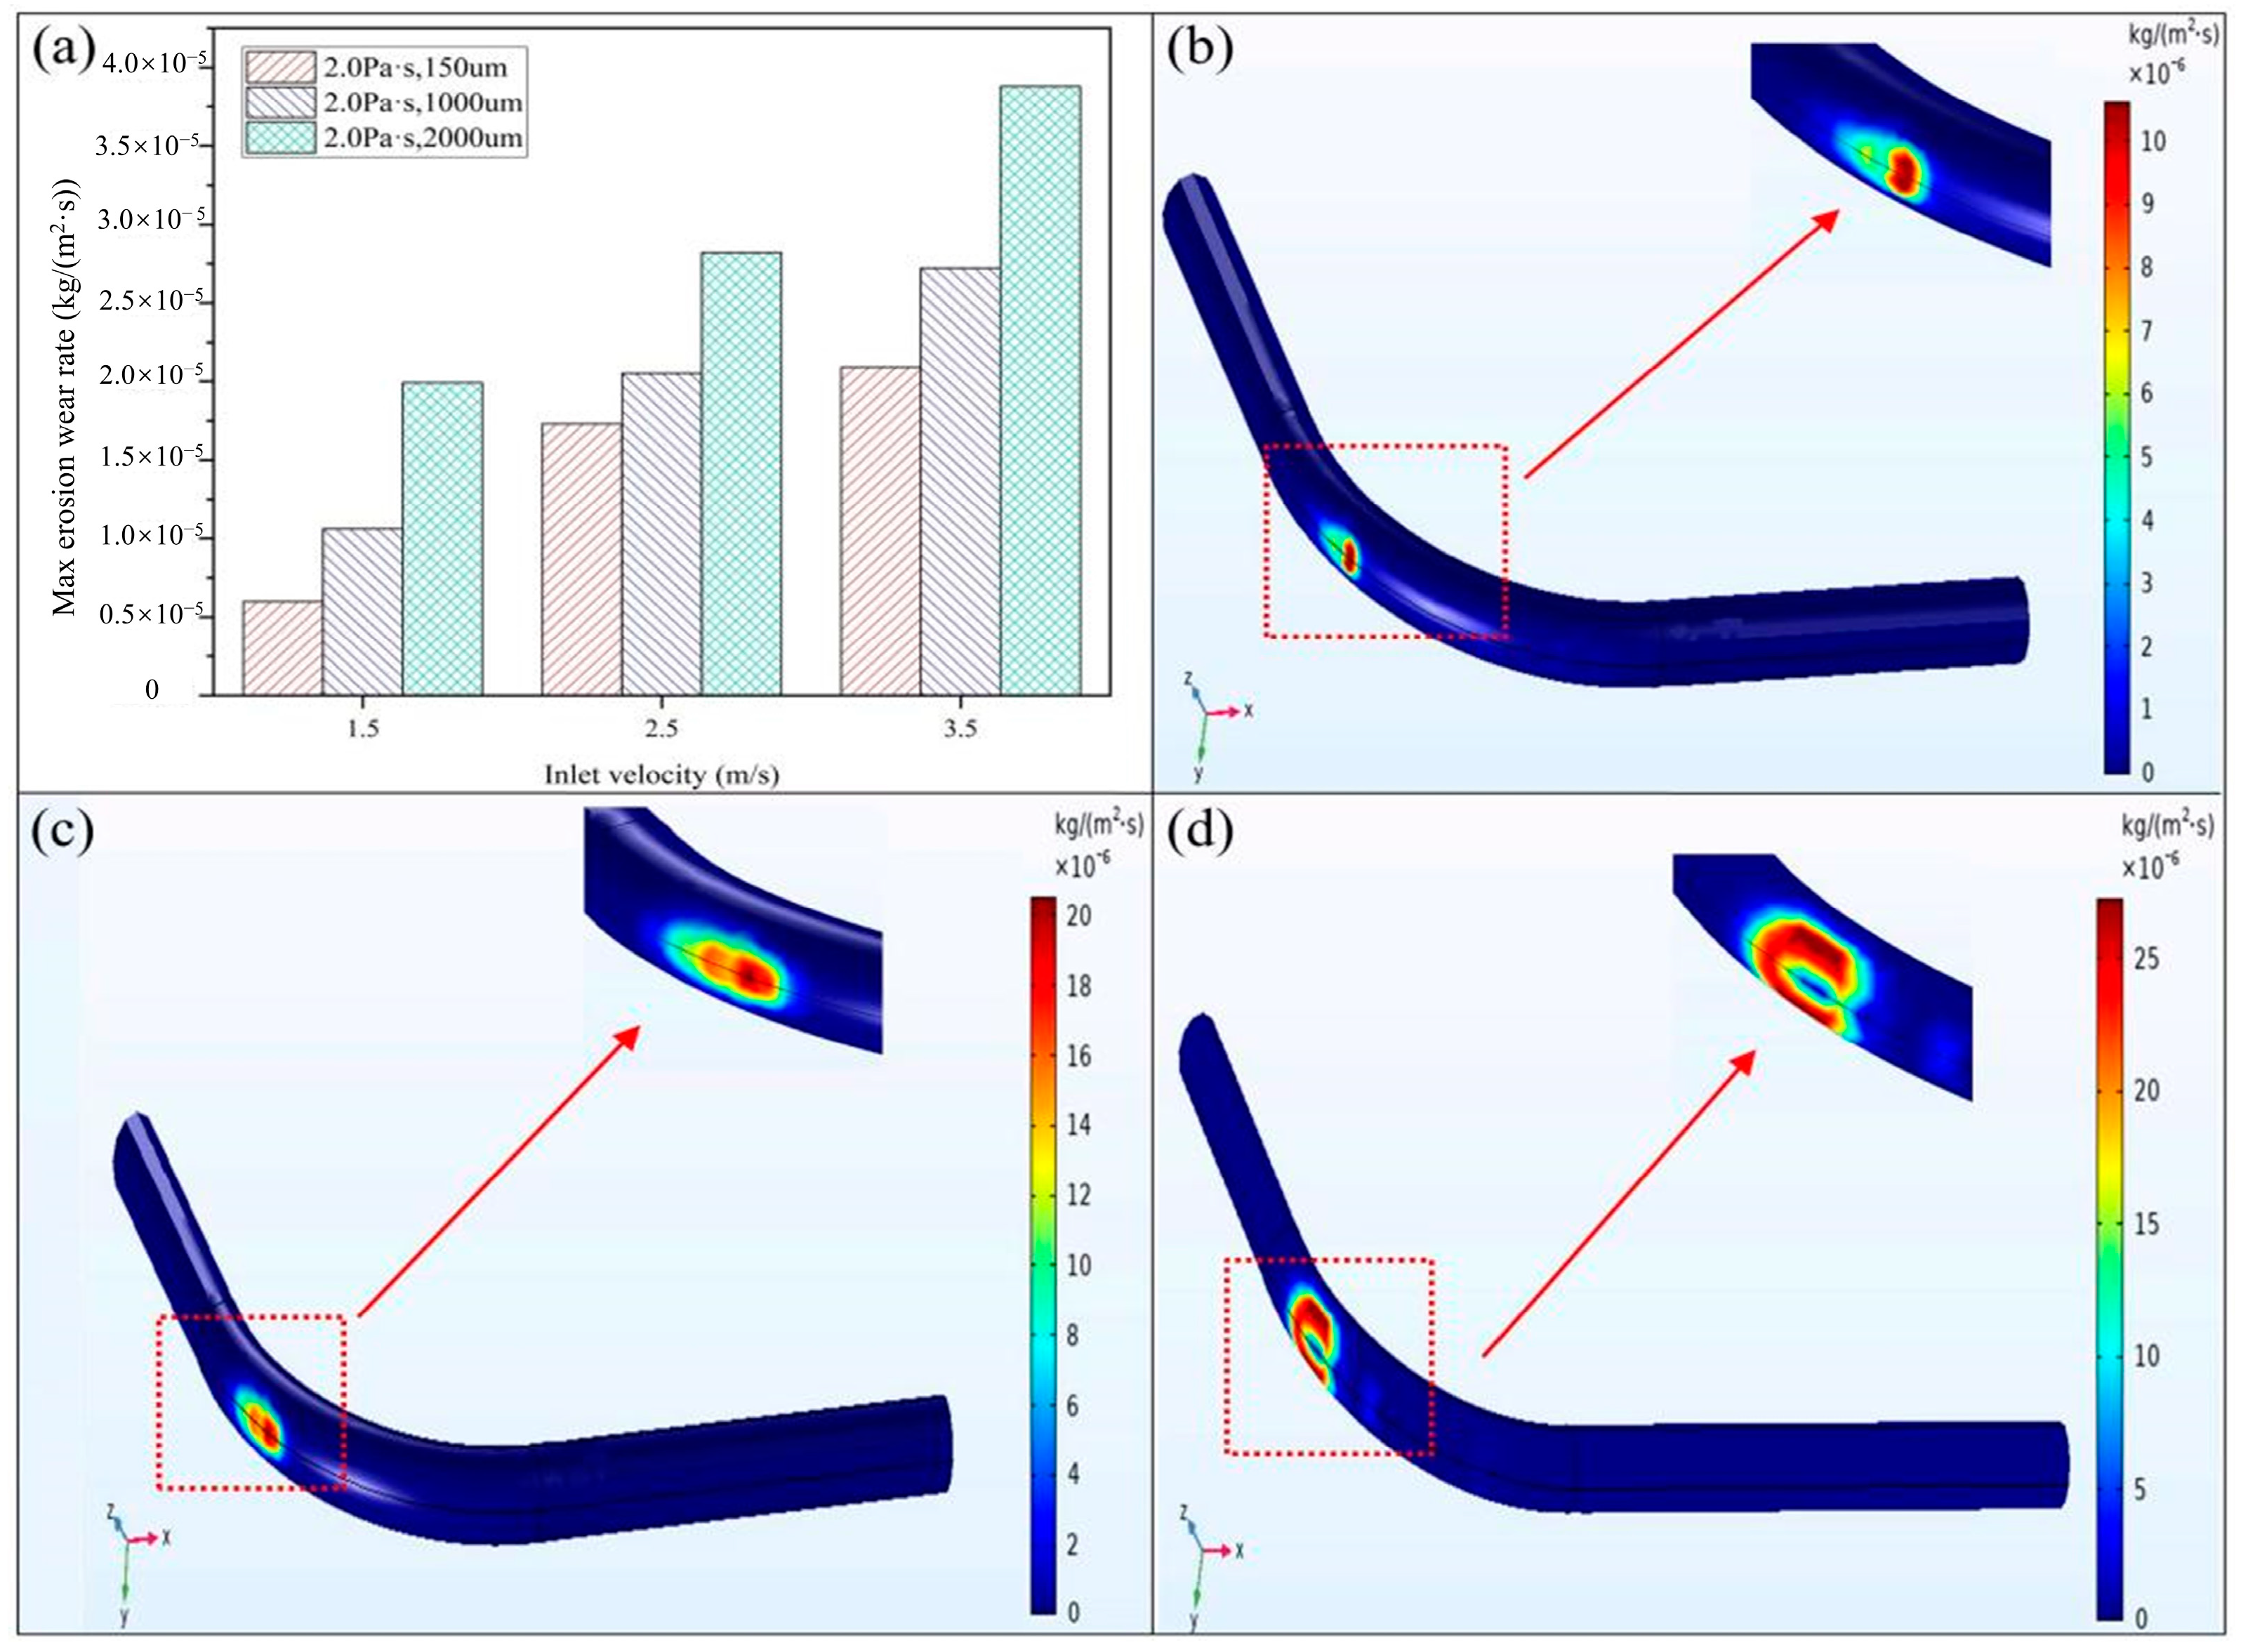
Figure 8a illustrates the effect of the inlet velocity on the erosion wear of the pipe wall at the bend for a given slurry viscosity. The results indicate that the maximum erosion wear rate of the pipe wall increases as the inlet velocity of the filling slurry increases. Taking the CPB slurry with the particle size of 1000 μm and viscosity of 2.0 Pa·s as an example, Figure 8b–d show the distribution of the erosion wear rate of the pipe wall at the bend for different inlet velocities. The results demonstrate that the area of the pipe wall eroded by the CPB slurry and the increase in erosion wear rate are both positively associated with the inlet velocity. The maximum erosion and wear rates of the pipe wall were found to be 1.06 × 10⁻⁵ kg/(m2·s), 2.05 × 10⁻⁵ kg/(m2·s), and 2.72 × 10⁻⁵ kg/(m2·s) at velocities of 1.5 m/s, 2.5 m/s, and 3.5 m/s, respectively.

3.2.2. Effect of Viscosity on Erosion Wear

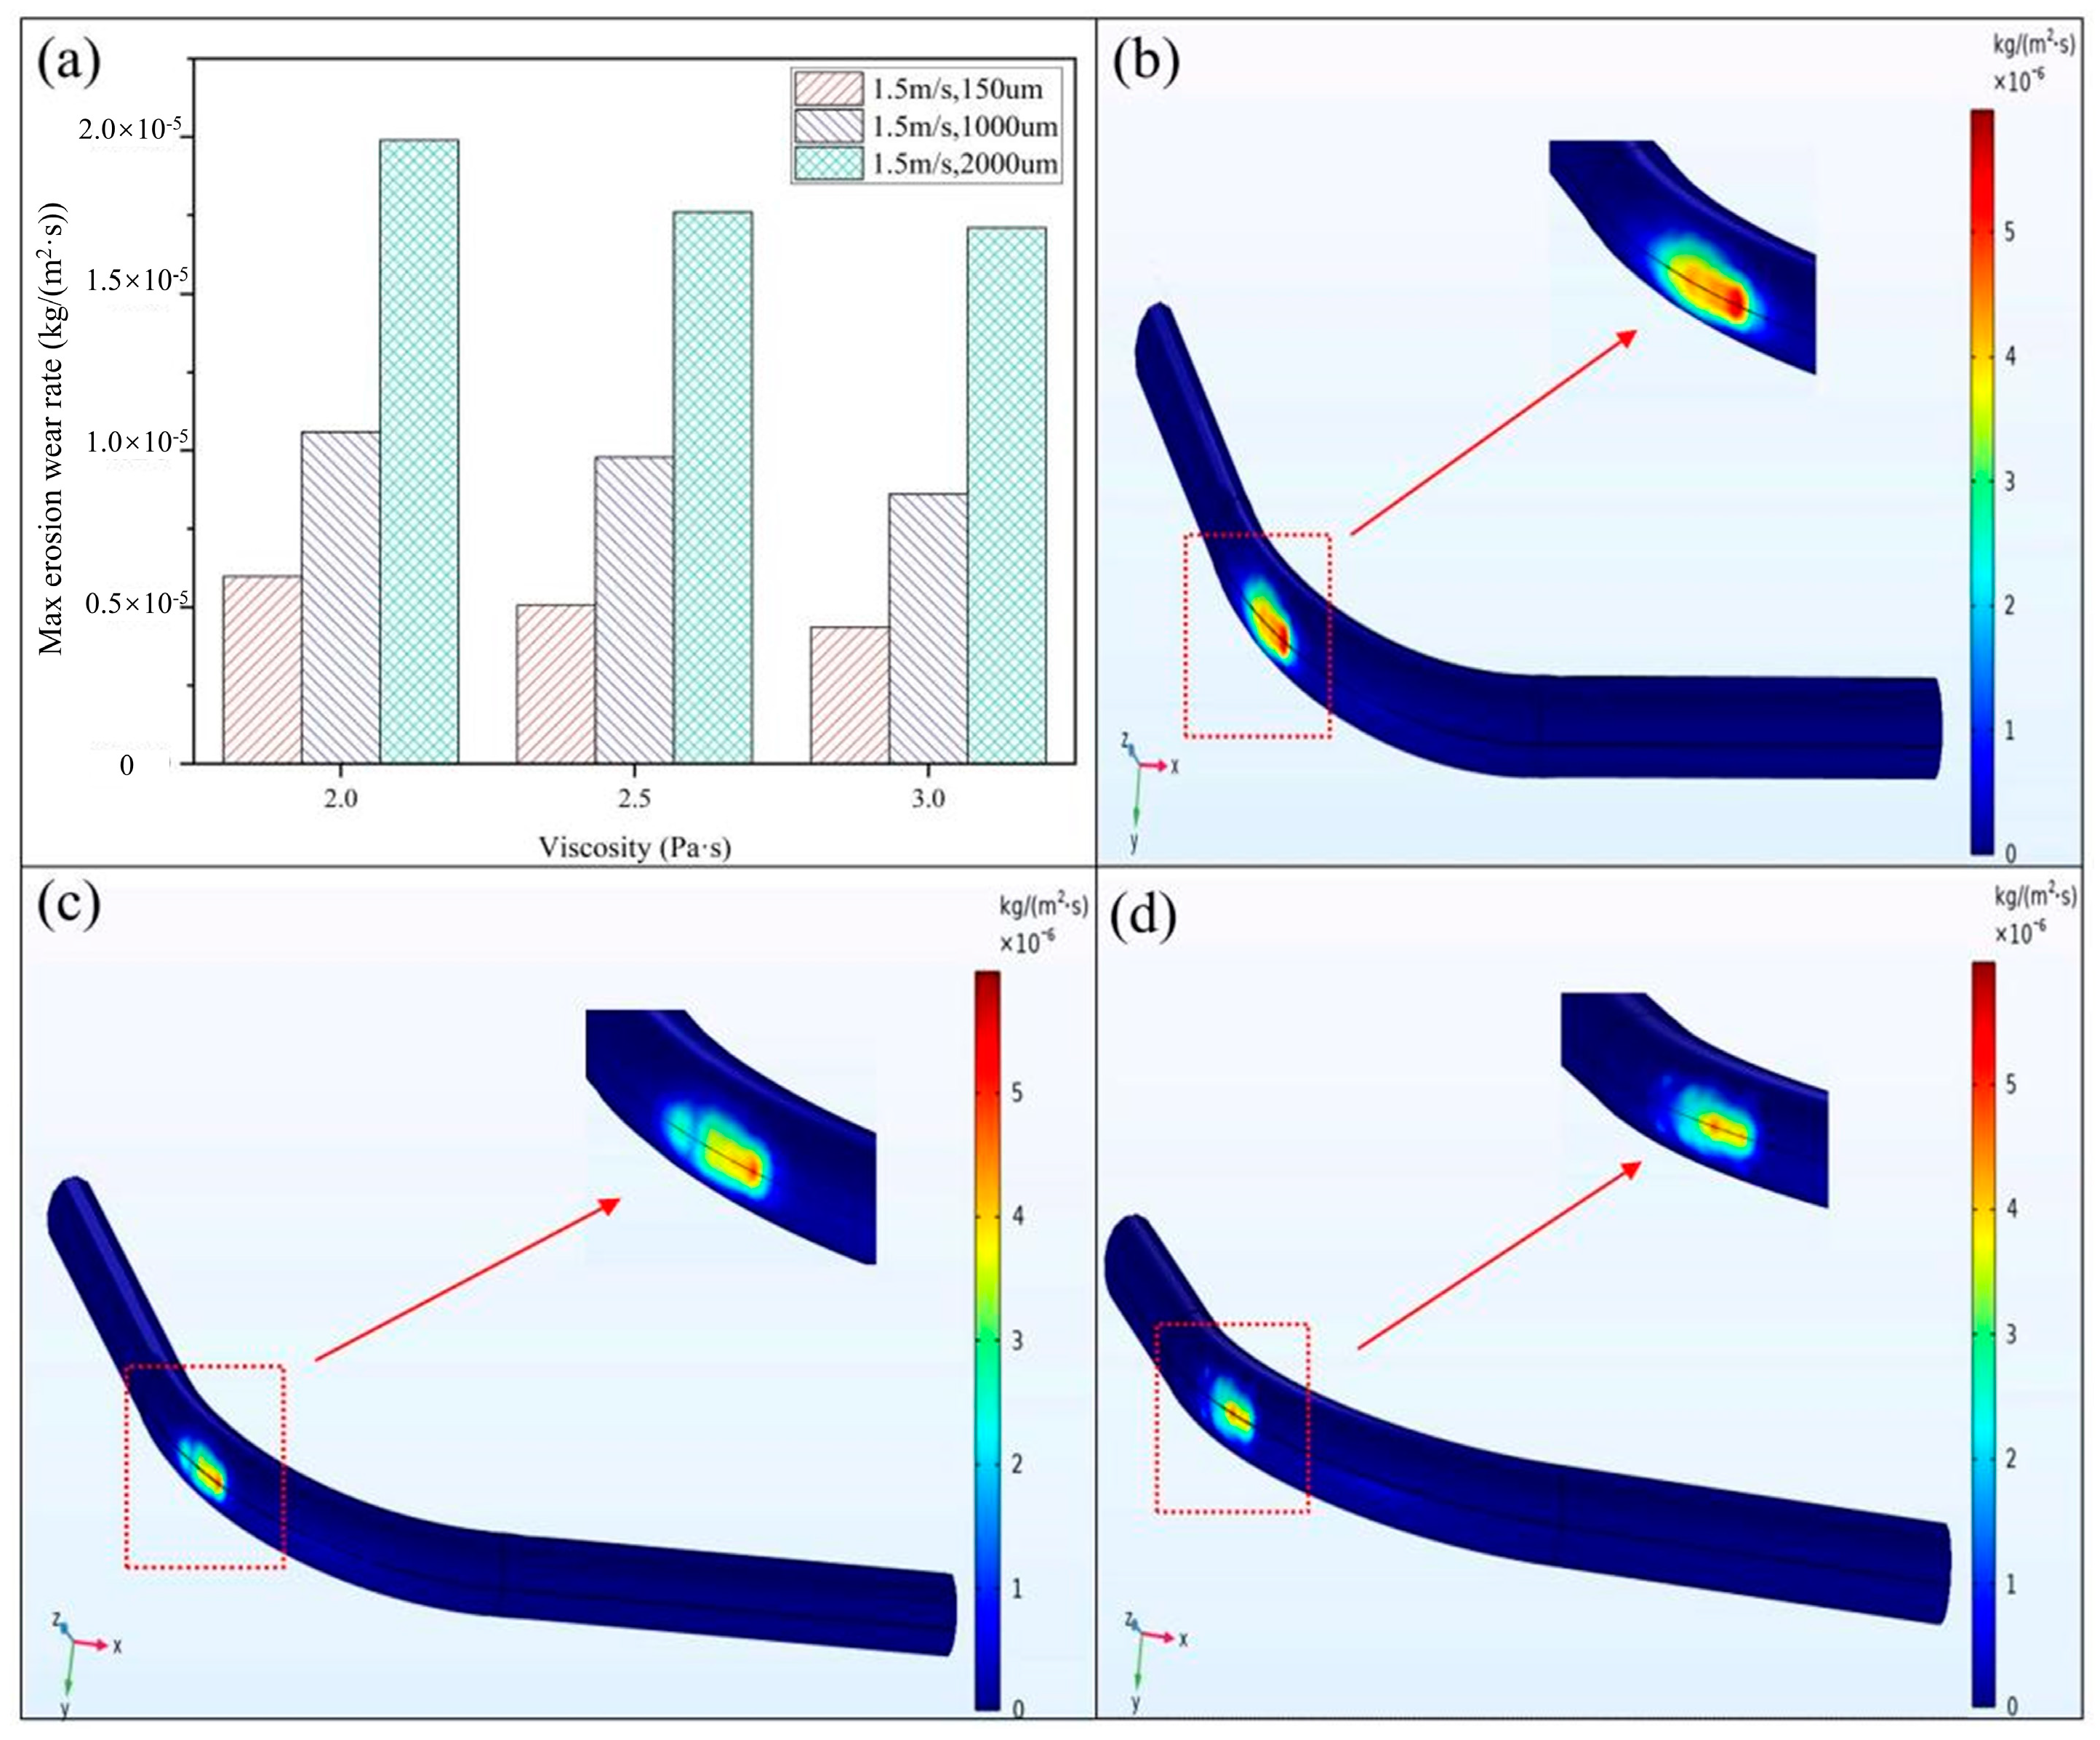
Figure 9a indicates that the maximum erosion wear rate of the pipe wall decreases with increasing viscosity of the CPB slurry. The CPB slurry with a particle size of 150 μm and a velocity of 1.5 m/s was considered as an example, a comparison of Figure 8b–d indicates obvious signs of erosion wear at the bend for the CPB slurry regardless of viscosity, with maximum erosion and wear rates of 5.98 × 10⁻⁶ kg/(m2·s), 5.07 × 10⁻⁶ kg/(m2·s), and 4.36 × 10⁻⁶ kg/(m2·s) for viscosities of 2.0 Pa·s, 2.5 Pa·s, and 3.0 Pa·s, respectively. Consequently, with increasing viscosity, the more severely eroded areas of the pipeline are decreased.

3.2.3. Effect of Particle Size on Erosion Wear

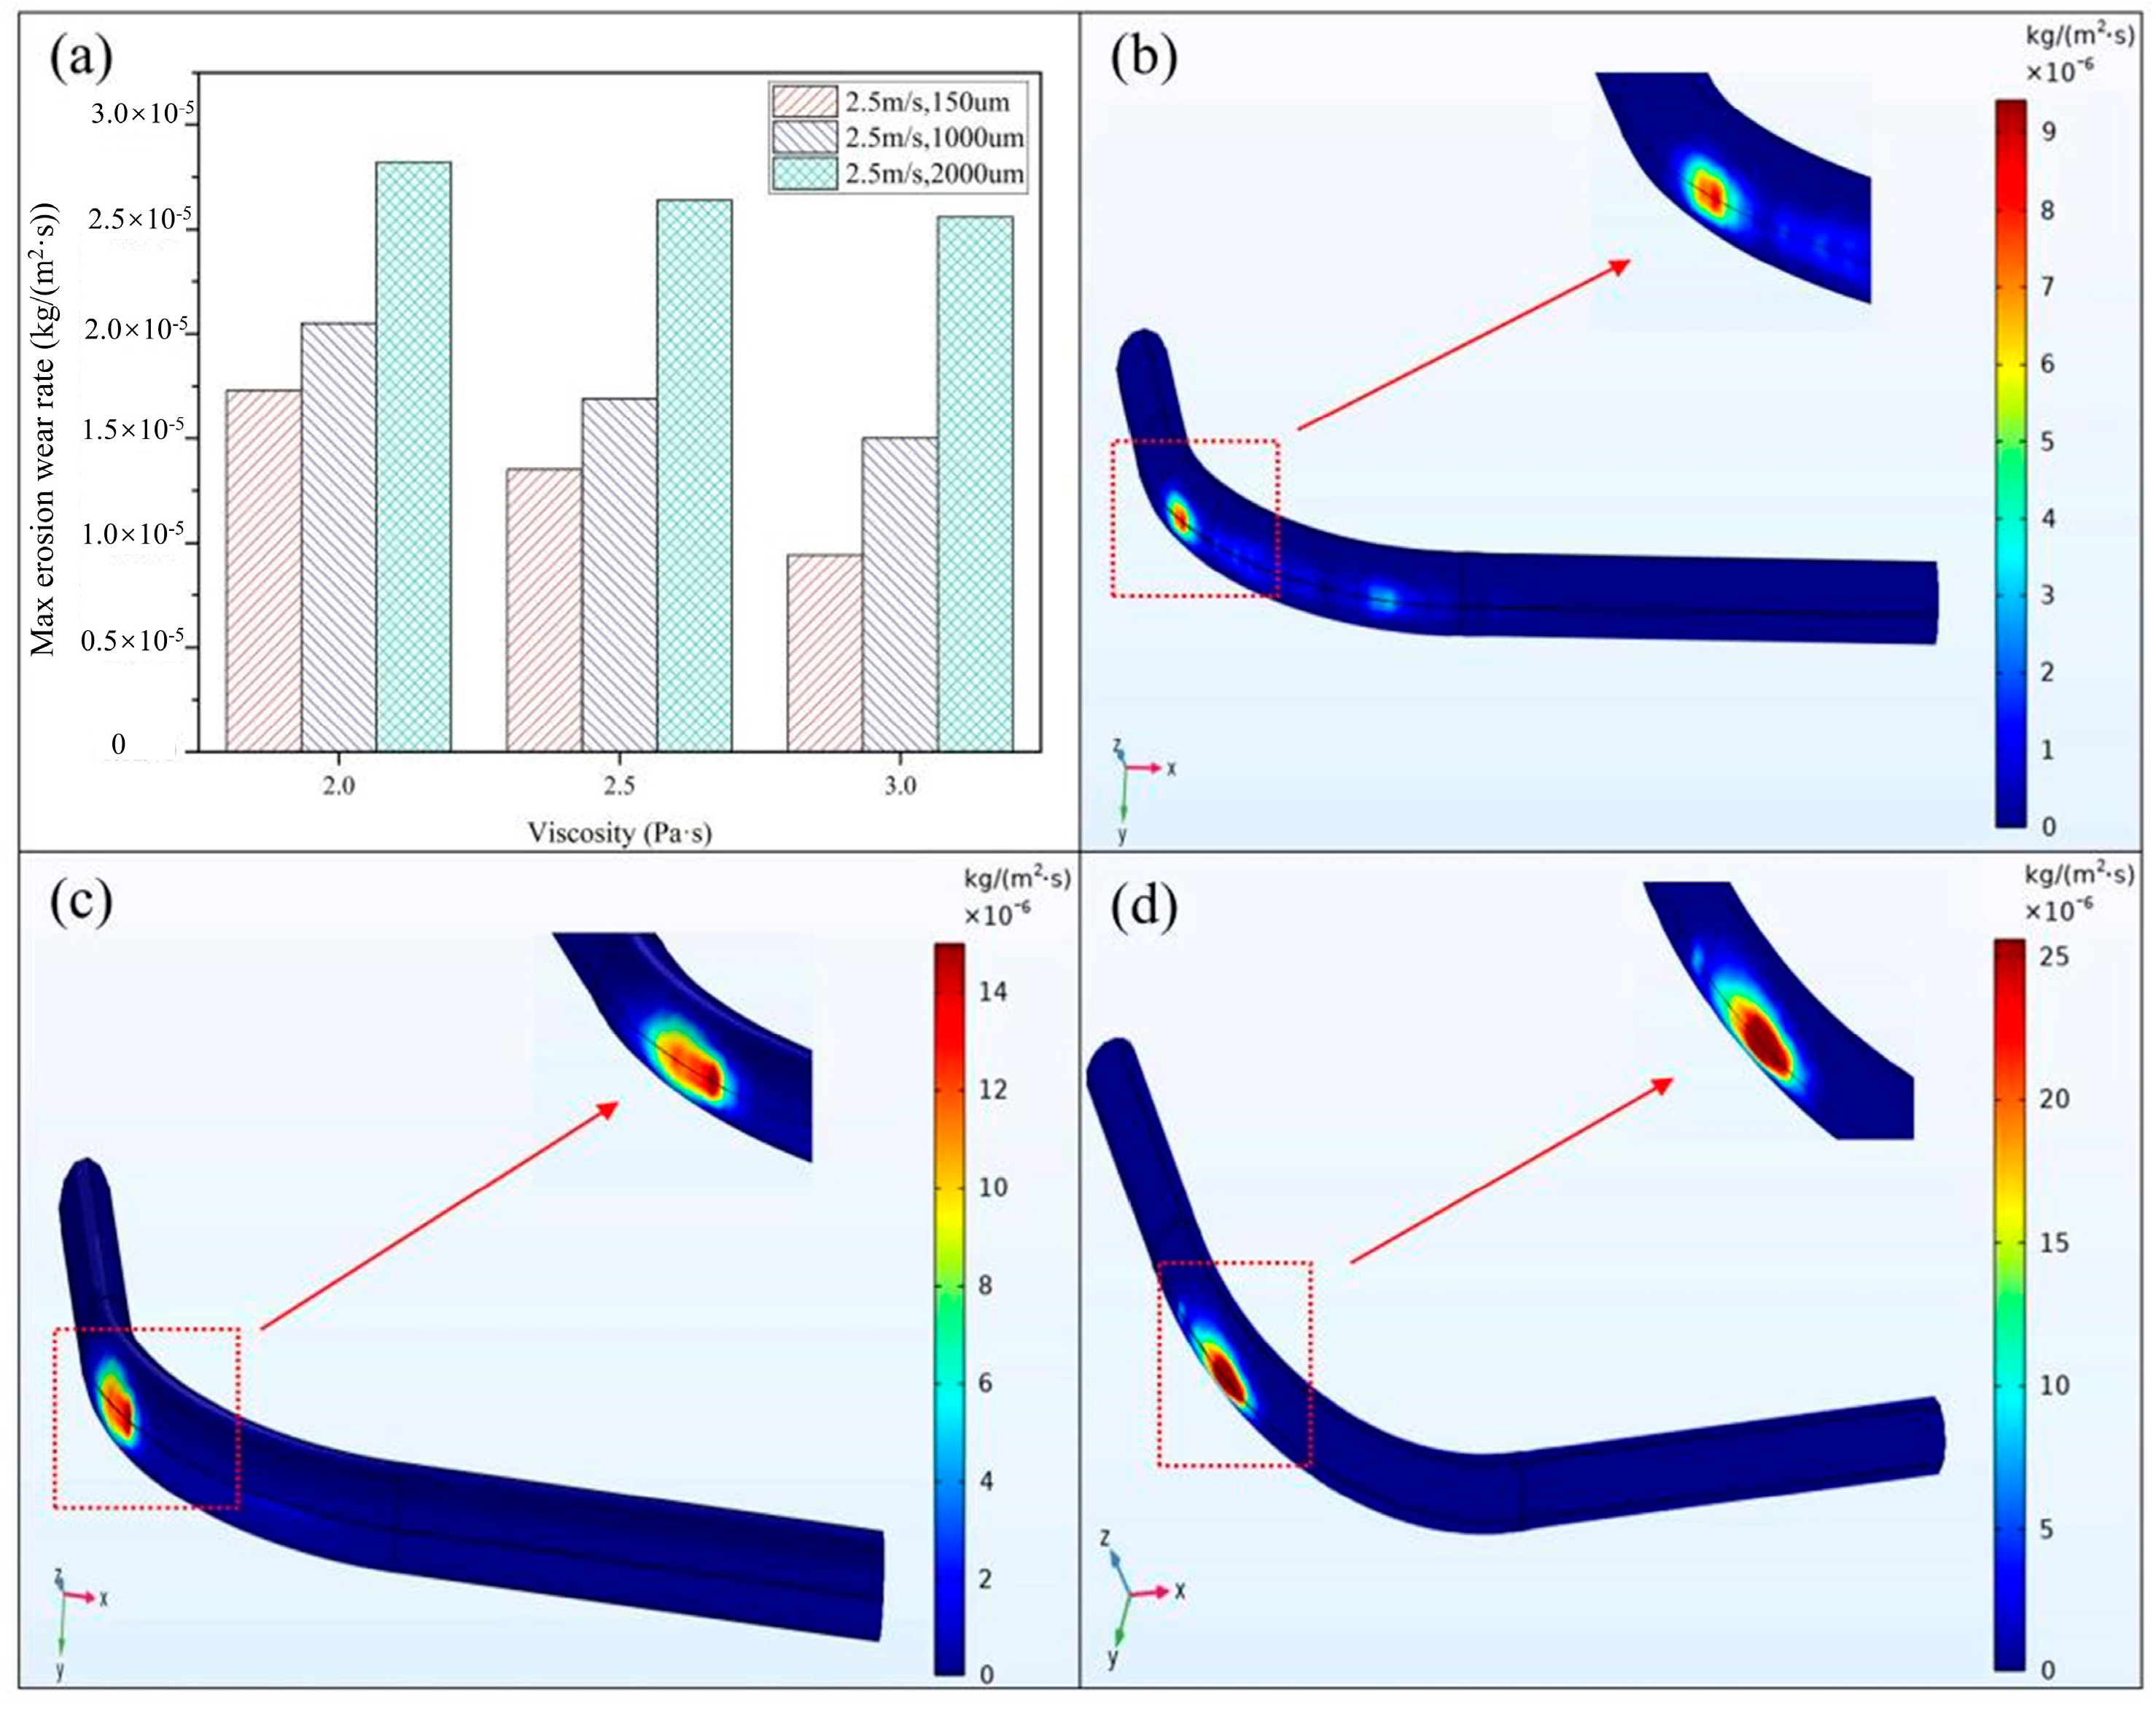
Figure 10a illustrates that the maximum erosion wear rate of the pipe wall increases with the particle size of the CPB slurry. To give an example, Figure 10b–d indicates the distribution of the erosion and wear rate of the CPB slurry on the pipe wall at the bend with an inlet velocity of 2.5 m/s and a viscosity of 3.0 Pa·s. The results demonstrate that the CPB slurry with a particle size of 150 μm shows significant signs of erosion and abrasion on the pipe wall at the bend, with a maximum erosion and abrasion rate of 9.43 × 10⁻⁶ kg/(m2·s). As the particle sizes of the CPB slurry increased to 1000 μm and 2000 μm, the maximum erosion wear rates of the pipe wall increased significantly to 1.50 × 10⁻⁵ kg/(m2·s) and 2.56 × 10⁻⁵ kg/(m2·s), respectively, as did the erosion wear area at the bend wall.

3.3. Calculation Model of Resistance Loss and Erosion Wear

3.3.1. The Regression Function of Resistance Loss

In order to establish a correlation between the inlet velocity, particle size, and viscosity of the backfill slurry during transportation, and the resistance loss (i) encountered along the transportation path, modifications were made to the global optimization algorithm within the 1stOpt software package. These modifications were essential for accurately capturing and optimizing the relationship between these variables, thereby enhancing the overall effectiveness of the analysis. The following is an expression for the equation:
i = b 1 + b 2 x 1 x 2 + b 3 x 1 x 3 + b 4 x 2 x 3 + b 5 x 1 + b 6 x 2 + b 7 x 1 2 + b 8 x 2 2
where b 1 b 8 are constant coefficients (with values of −4.5177, 0.0665, 9.4554 × 10⁻⁶, −3.8001 × 10⁻⁶, 3.7463, 0.1756, −0.58159, and −0.02882, respectively), x 1 is the viscosity, x 2 is the inlet velocity, and x 3 is the particle size in μm.
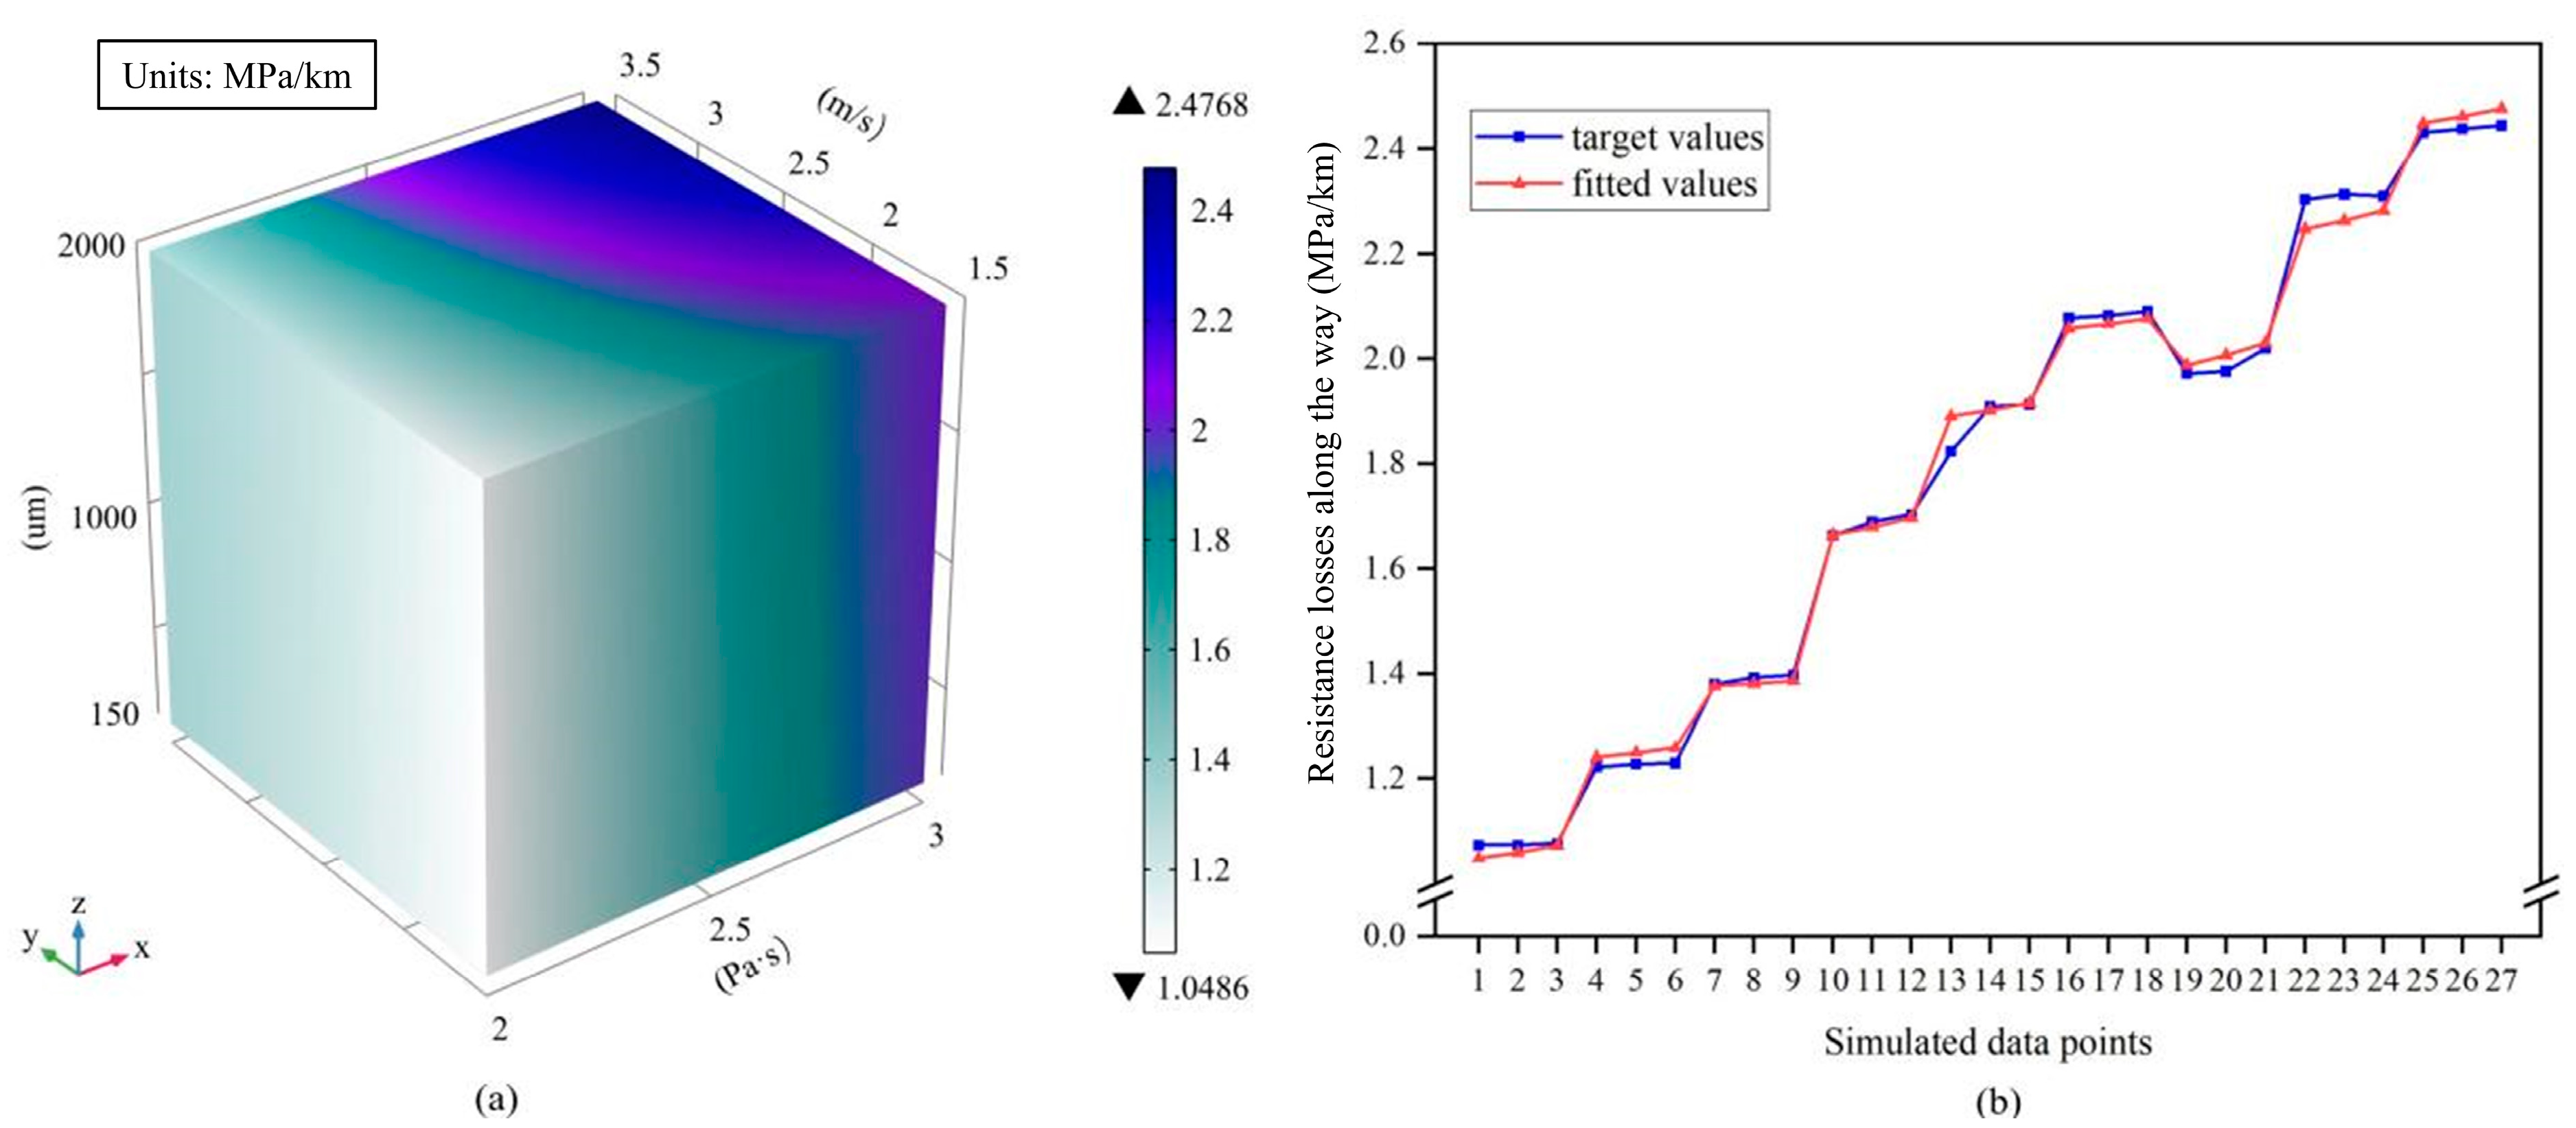
Figure 11a displays the image of the fitted function, with the x, y, and z axes representing [ x 1 , x 2 , x 3 ]. Figure 11b provides a comparison between the target values obtained from the COMSOL simulation and the values obtained from Equation (4). The results reveal a fitted correlation coefficient of 0.998371 and a goodness of fit of 0.996746, indicating a highly satisfactory fit. As a result, Equation (4) can be effectively utilized for predicting the pipeline transportation of the CPB slurry.

3.3.2. The Regression Function of Maximum Erosion Wear Rate

Using the 1stOpt software package to fit the equation for the maximum erosion and wear rate of the CPB slurry, ymax, in relation to the pipe wall during transportation under the influence of the inlet velocity, particle size, and viscosity, as follows:
y m a x = b 1 + b 2 x 1 + b 3 x 2 + b 4 x 3
where b 1 b 4 are constant coefficients (with values of 1.5085 × 10⁻⁶, 7.7717 × 10⁻⁶, −3.9644 × 10⁻⁶, and 7.5140 × 10⁻⁹, respectively, x 1 is the inlet velocity, x 2 is the viscosity, and x 3 is the particle size in μm.
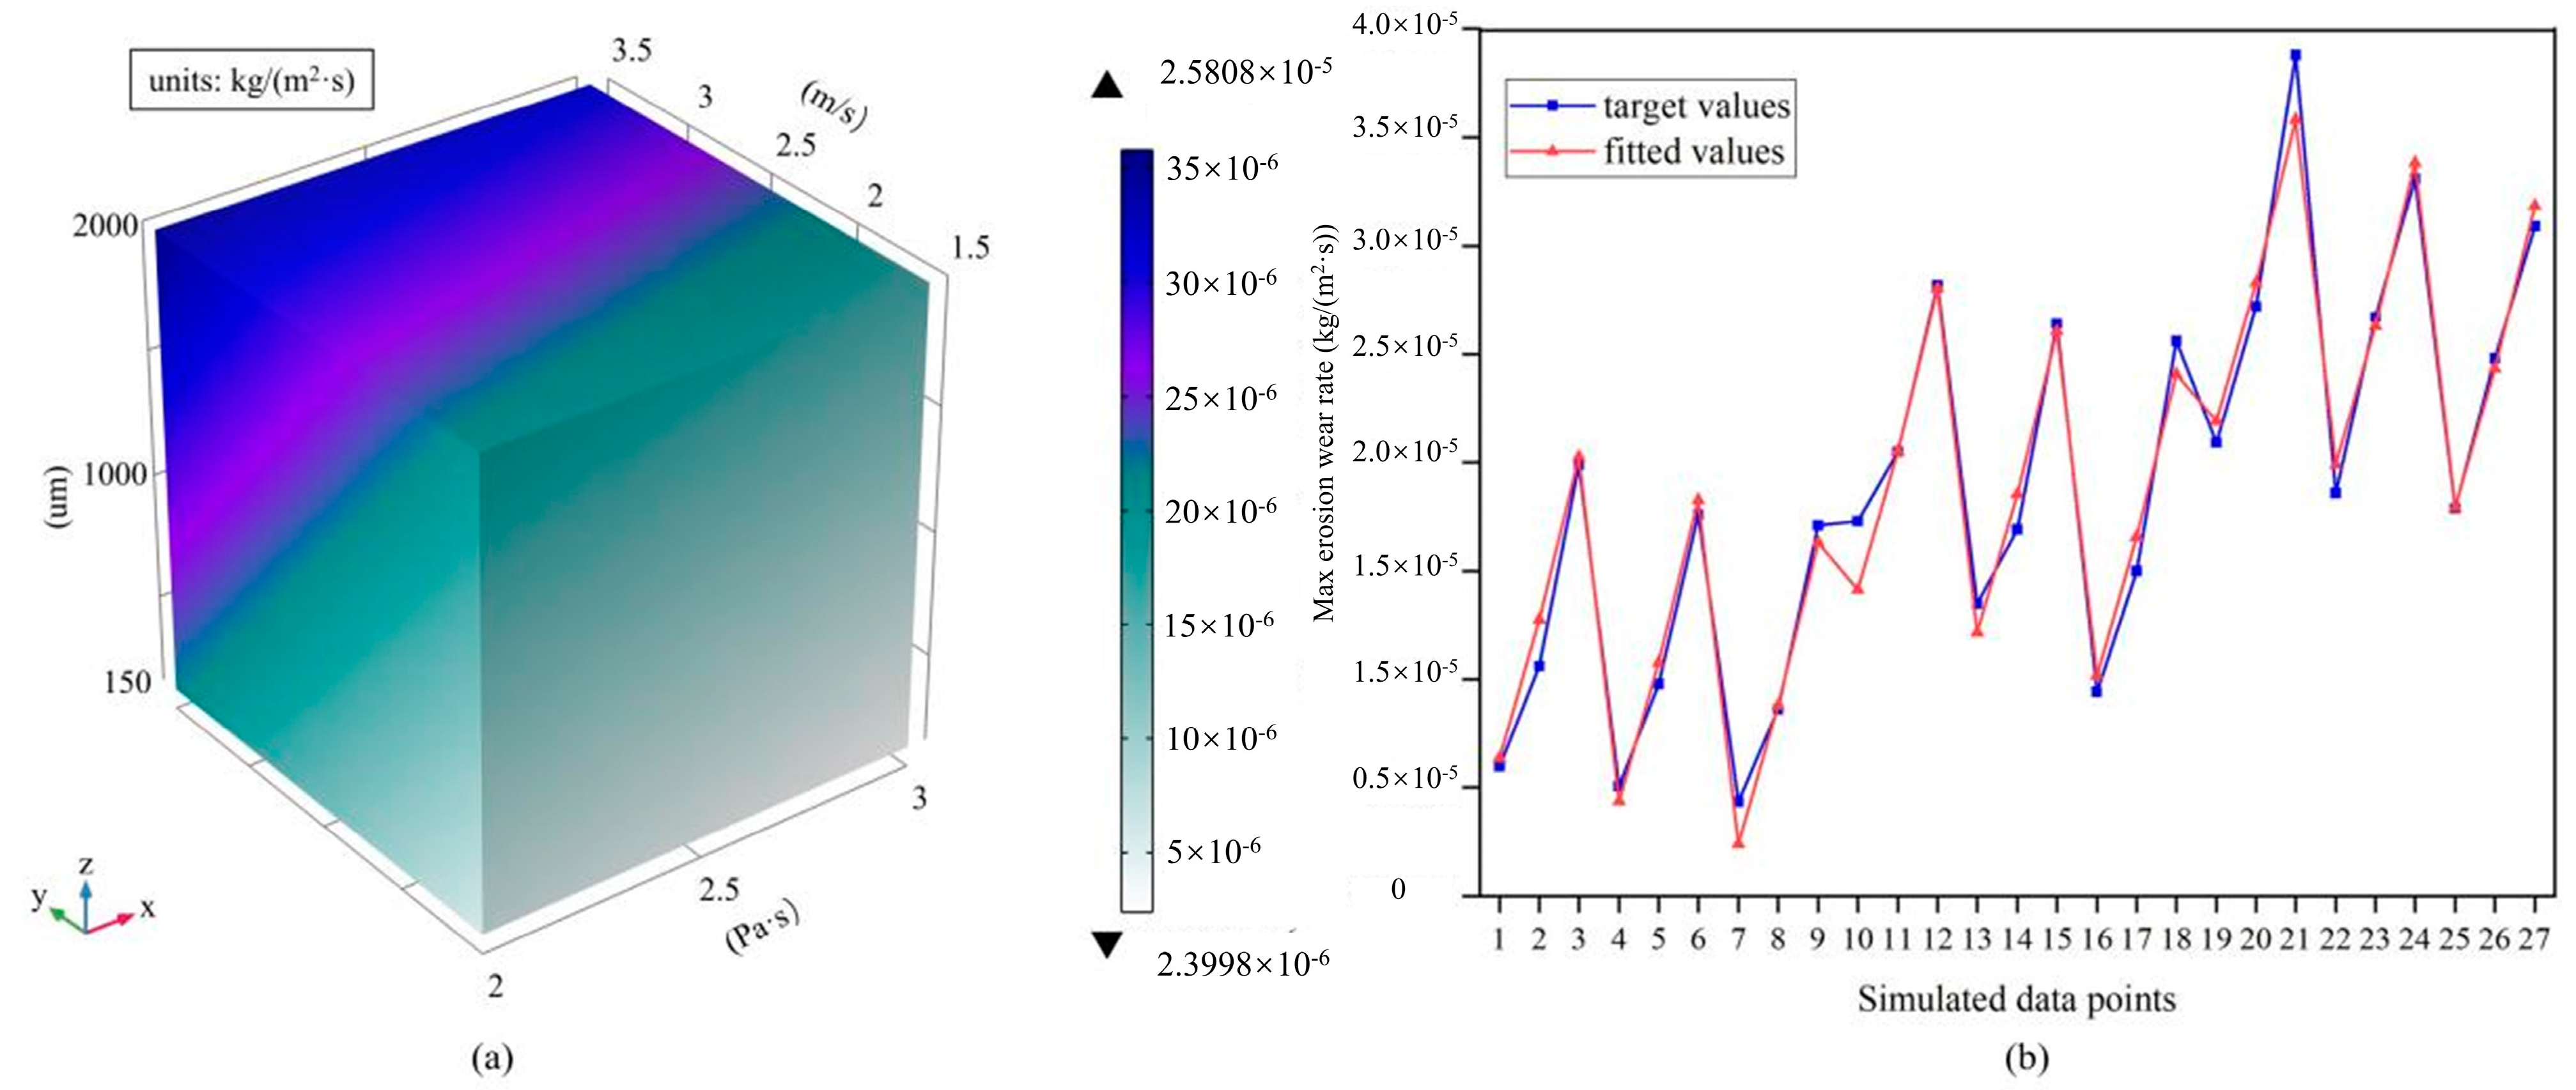
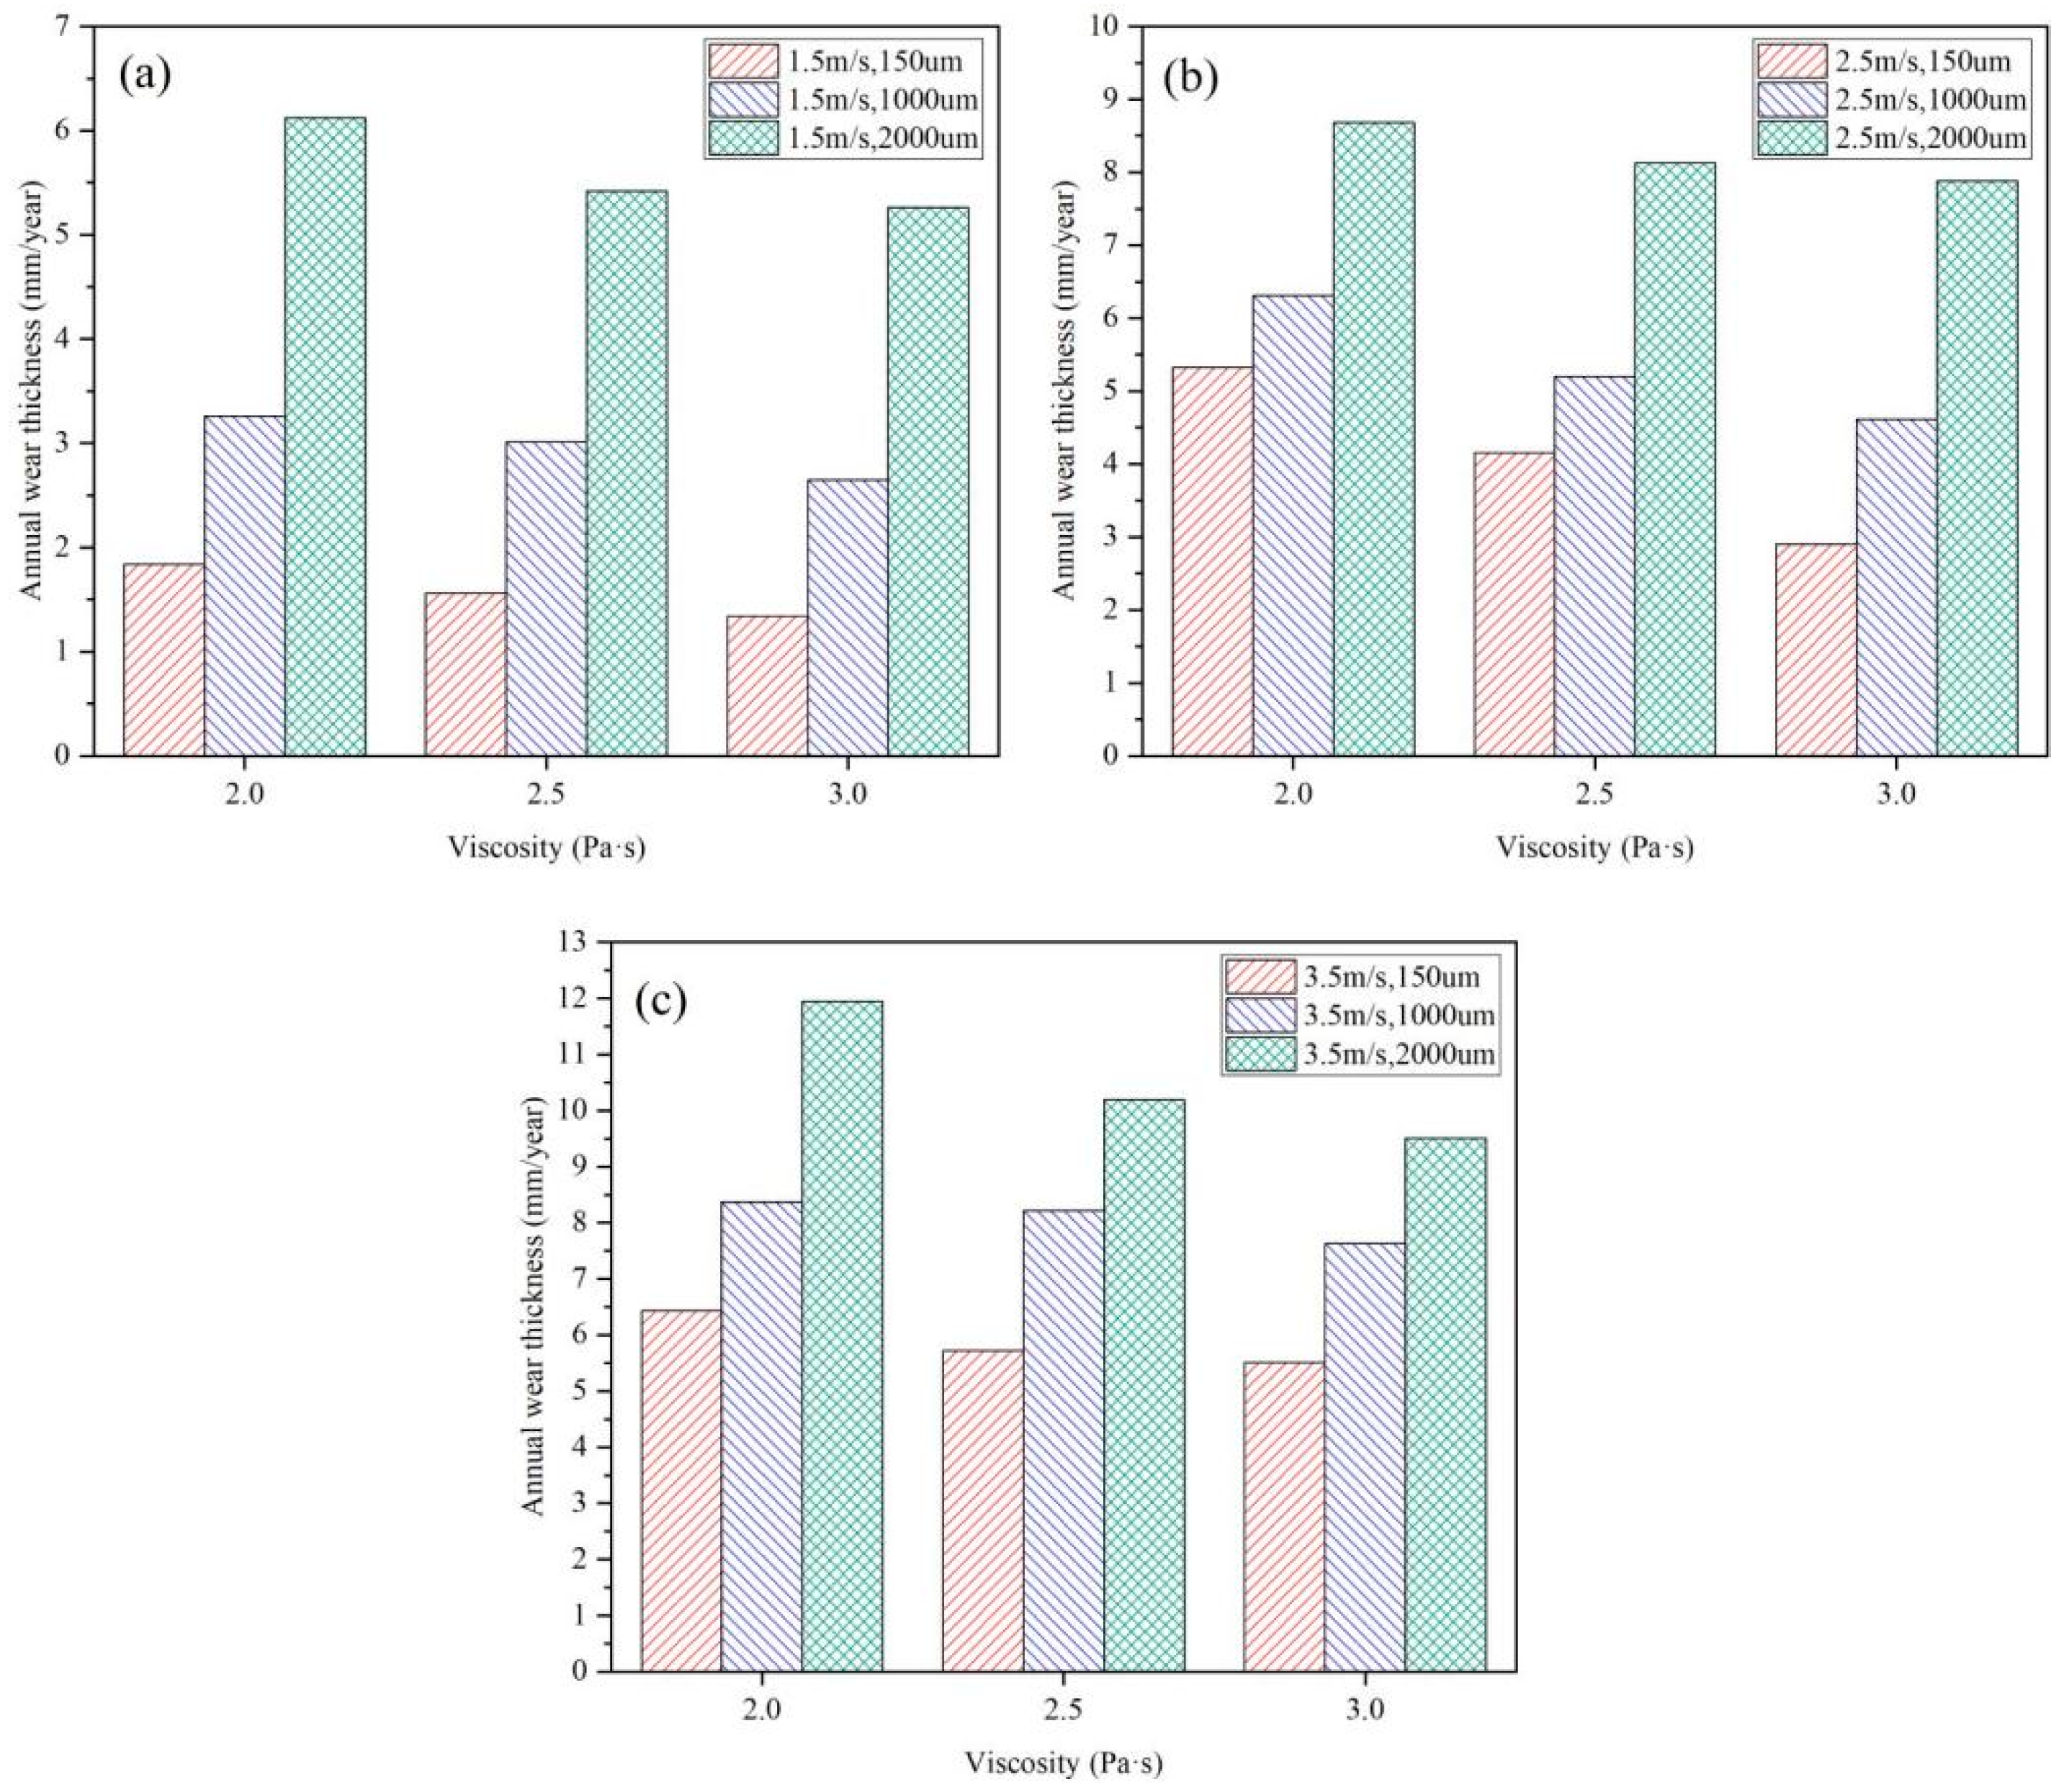
Figure 12a shows the image of the fitted function, where the x, y and z axes represent x 2 , x 1 , x 3 respectively. The fitted correlation coefficient for Equation (5) was 0.988855 and the goodness of fit was 0.977834, indicating a good fit. Figure 12b shows a comparison between the target values obtained from the simulation and the fitted values obtained using Equation (5). Figure 13 shows the annual erosion wear thickness of the pipe wall at the different simulation parameter values, calculated as follows:
D loss = y m a x × ρ s 1 × t × 100
where D loss is annual erosion wear thickness (units: mm/year), y m a x is the maximum erosion wear rate (units: kg/(m2·s)), t is wear time (units: s), 12 months of work a year, 28 days a month, 20 h a day, and ρ s is tube wall density (units: kg/m3). The results show that at an inlet velocity of 1.5 m/s, a viscosity of 3.0 Pa·s and a particle size of 150 μm, the minimum wall wear thickness is 1.34 mm, whereas at an inlet velocity of 3.5 m/s, a viscosity of 2.0 Pa·s and a particle size of 2000 μm, the maximum wall wear thickness is 11.94 mm. Consequently, Equation (5) can be employed to estimate pipe wear in real engineering situations.

4. Conclusions

In this research, a CFD approach combining mixture laminar flow and particle flow tracking models was adopted to investigate the transportation of CPB slurry in pipelines, specifically the variation of pipe resistance losses and the wall erosion wear at different slurry inlet velocities, particle sizes, and viscosities. The main conclusions which may be drawn from the results obtained herein are as follows:
  • The resistance loss of CPB slurry during pipeline transportation is positively correlated with the inlet velocity, particle size, and viscosity. The resistance losses of the CPB slurry were minimized at an inlet velocity of 1.5 m/s, a particle size of 150 μm, and a slurry viscosity of 2.0 Pa·s.
  • The resistance loss of CPB slurry at pipeline bends is high, therefore the number of bends should be minimized when designing mine backfill piping systems.
  • In the process of transporting the CPB slurry, the outer wall of the bend is the most severely eroded and worn part of the pipe; therefore, it is important to focus on regular care of the bend, as well as to strengthen it through thickening the inner wall of the pipe and using better quality materials. In addition, the pipe should be replaced periodically to prevent it from failing.
  • The maximum erosion wear rate at the outer wall of the bend is positively correlated with the slurry inlet velocity and particle size and negatively correlated with viscosity. Here, the maximum erosion wear rate was lowest at an inlet velocity of 1.5 m/s, a particle size of 150 μm, and a slurry viscosity of 3.0 Pa·s.
  • Based on the data obtained from the simulations, formulae for the resistance losses and the maximum erosion wear rate of the pipe wall as functions of slurry inlet velocity, particle size, and viscosity were fitted, which may be of guidance for real-world mining applications.
  • The CPB slurry’s particle size was assumed to be homogenous, and the effects of cement hydration, temperature, and chemical degradation of the pipe wall by the CPB slurry were not considered. Thus, the model will be expanded in subsequent studies to consider the pipeline transit of CPB slurry for unclassified tailing sand.

Author Contributions

Conceptualization: J.Q. and C.X.; methodology: M.T.; software: D.Z.; validation: H.C. and F.B.; formal analysis: B.W.; investigation: D.W.; data curation: J.Q.; writing—original draft preparation: J.Q.; writing—review and editing: M.T.; visualization: C.X.; project administration: C.X.; funding acquisition: M.T. All authors have read and agreed to the published version of the manuscript.

Funding

This research received no external funding.

Institutional Review Board Statement

Not applicable.

Informed Consent Statement

Not applicable.

Data Availability Statement

Not applicable.

Conflicts of Interest

The authors declare no conflict of interest.

Abbreviations

CBRMCreep behavior of the rock mass
CVISCBurger-creep visco-plastic model
CPBCemented paste backfill
FITFilling interval time
VCLVertical central line
MCMohr–Coulomb model
ρDensity
GShear modulus
ηViscosity
KBulk modulus
EYoung’s modulus
φInterface friction angle
μPoisson’s ratio
cCohesion
ψDilation angle

References

  1. Ma, D.; Zhang, J.; Duan, H.; Huang, Y.; Li, M.; Sun, Q.; Zhou, N. Reutilization of gangue wastes in underground backfilling mining: Overburden aquifer protection. Chemosphere 2021, 264, 128400. [Google Scholar] [CrossRef] [PubMed]
  2. Han, B.; Ji, K.; Wang, J.; Wang, S.; Zhang, P.; Hu, Y. Determination of the Required Strength of Artificial Roof for the Underhand Cut-and-Fill Mine Using Field Measurements and Theoretical Analysis. Sustainability 2023, 15, 189. [Google Scholar] [CrossRef]
  3. Li, H.; Ji, K.; Tao, Y.; Tang, C. Modelling a Novel Scheme of Mining Geothermal Energy from Hot Dry Rocks. Appl. Sci. 2022, 12, 11257. [Google Scholar] [CrossRef]
  4. Worlanyo, A.S.; Jiangfeng, L. Evaluating the environmental and economic impact of mining for post-mined land restoration and land-use: A review. J. Environ. Manag. 2021, 279, 111623. [Google Scholar] [CrossRef] [PubMed]
  5. Zhang, X.; Zhang, S.; Liu, H.; Zhao, Y. Disposal of mine tailings via geopolymerization. J. Clean. Prod. 2021, 284, 124756. [Google Scholar] [CrossRef]
  6. Qiu, J.; Zhao, Y.; Long, H.; Guo, Z.; Xing, J.; Sun, X. Low-Carbon Binder for Cemented Paste Backfill: Flowability, Strength and Leaching Characteristics. Minerals 2019, 9, 707. [Google Scholar] [CrossRef] [Green Version]
  7. Bull, A.J.; Fall, M. Curing temperature dependency of the release of arsenic from cemented paste backfill made with Portland cement. J. Environ. Manag. 2020, 269, 13. [Google Scholar] [CrossRef]
  8. Belem, T.; Benzaazoua, M. Design and application of underground mine paste backfill technology. Geotech. Geol. Eng. 2008, 26, 147–174. [Google Scholar] [CrossRef]
  9. Abdul-Hussain, N.; Fall, M. Thermo-hydro-mechanical behaviour of sodium silicate-cemented paste tailings in column experiments. Tunn. Undergr. Space Technol. 2012, 29, 85–93. [Google Scholar] [CrossRef]
  10. Ercikdi, B.; Kuekci, G.; Yilmaz, T. Utilization of granulated marble wastes and waste bricks as mineral admixture in cemented paste backfill of sulphide-rich tailings. Constr. Build Mater. 2015, 93, 573–583. [Google Scholar] [CrossRef]
  11. Behera, S.K.; Mishra, D.P.; Singh, P.; Mishra, K.; Mandal, S.K.; Ghosh, C.N.; Kumar, R.; Mandal, P.K. Utilization of mill tailings, fly ash and slag as mine paste backfill material: Review and future perspective. Constr. Build Mater. 2021, 309, 125120. [Google Scholar] [CrossRef]
  12. Chen, Q.; Tao, Y.; Zhang, Q.; Qi, C. The rheological, mechanical and heavy metal leaching properties of cemented paste backfill under the influence of anionic polyacrylamide. Chemosphere 2022, 286, 131630. [Google Scholar] [CrossRef] [PubMed]
  13. Qi, C.; Fourie, A. Cemented paste backfill for mineral tailings management: Review and future perspectives. Miner Eng. 2019, 144, 106025. [Google Scholar] [CrossRef]
  14. Wang, D.; Zhang, Q.; Feng, Y.; Chen, Q.; Xiao, C.; Li, H.; Xiang, Y.; Qi, C. Hydration and Mechanical Properties of Blended Cement with Copper Slag Pretreated by Thermochemical Modification. Materials 2022, 15, 3477. [Google Scholar] [CrossRef] [PubMed]
  15. Cui, L.; Fall, M. A coupled thermo–hydro-mechanical–chemical model for underground cemented tailings backfill. Tunn. Undergr. Space Technol. 2015, 50, 396–414. [Google Scholar] [CrossRef]
  16. Yin, S.; Shao, Y.; Wu, A.; Wang, H.; Liu, X.; Wang, Y. A systematic review of paste technology in metal mines for cleaner production in China. J. Clean. Prod. 2020, 247, 119590. [Google Scholar] [CrossRef]
  17. Zhang, Q.; Hu, G.; Wang, X. Hydraulic calculation of gravity transportation pipeline system for backfill slurry. J. Cent. South Univ. Technol. 2008, 15, 645–649. [Google Scholar] [CrossRef]
  18. Wang, D.; Zhang, Q.; Chen, Q.; Qi, C.; Feng, Y.; Xiao, C. Temperature variation characteristics in flocculation settlement of tailings and its mechanism. Int. J. Miner. Metall. Mater. 2020, 27, 1438–1448. [Google Scholar] [CrossRef]
  19. Singh, G.; Kumar, S.; Mohapatra, S.K. Erosion Wear in A Slurry Pipe With Multisized Coal And Bottom-Ash Slurries. Mater. Today Proc. 2017, 4, 3565–3571. [Google Scholar] [CrossRef]
  20. Li, M.; He, Y.; Liu, W.; Liu, Y.; Huang, C.; Jiang, R. Effect of adding finer particles on the transport characteristics of updates coarse-particle slurries in pipelines. Ocean Eng. 2020, 218, 108160. [Google Scholar] [CrossRef]
  21. More, S.R.; Bhatt, D.V.; Menghani, J.V. Failure analysis of coal bottom ash slurry pipeline in thermal power plant. Eng. Fail. Anal. 2018, 90, 489–496. [Google Scholar] [CrossRef]
  22. More, S.R.; Bhatt, D.V.; Menghani, J.V.; Jagtap, R.K. CFD Simulation and Experimental Results Validation of Slurry Erosion Wear using Slurry Pot Test Rig. Trends Sci. 2022, 19, 4524. [Google Scholar] [CrossRef]
  23. Kaushal, D.R.; Thinglas, T.; Tomita, Y.; Kuchii, S.; Tsukamoto, H. CFD modeling for pipeline flow of fine particles at high concentration. Int. J. Multiph Flow 2012, 43, 85–100. [Google Scholar] [CrossRef]
  24. Wang, X.; Zhang, D.; Zhang, Q.; Zhao, B. Pipeline self-flowing transportation property of paste based on FLOW-3D software in deep mine. J. Cent. South Univ. Sci. Technol. 2011, 25, 141–150. [Google Scholar]
  25. Wu, D.; Yang, B.; Liu, Y. Pressure drop in loop pipe flow of fresh cemented coal gangue–fly ash slurry: Experiment and simulation. Adv. Powder Technol. 2015, 26, 920–927. [Google Scholar] [CrossRef]
  26. Bandyopadhyay, T.K.; Das, S.K. Non-Newtonian Liquid Flow through Small Diameter Piping Components: CFD Analysis. J. Inst. Eng. Ser. E 2016, 97, 131–141. [Google Scholar] [CrossRef]
  27. Yang, D.; Xia, Y.; Wu, D.; Chen, P.; Zeng, G.; Zhao, X. Numerical investigation of pipeline transport characteristics of slurry shield under gravel stratum. Tunn. Undergr. Space Technol. 2018, 71, 223–230. [Google Scholar] [CrossRef]
  28. Bansal, A.; Goyal, D.K.; Singh, P.; Singla, A.K.; Gupta, M.K.; Bala, N.; Kolte, J.; Setia, G. Erosive wear behaviour of HVOF-sprayed Ni-20Cr2O3 coating on pipeline materials. Int. J. Refract. Met. Hard Mater. 2020, 92, 105332. [Google Scholar] [CrossRef]
  29. Zhang, J.; Kang, J.; Fan, J.; Gao, J. Study on erosion wear of fracturing pipeline under the action of multiphase flow in oil & gas industry. J. Nat. Gas Sci. Eng. 2016, 32, 334–346. [Google Scholar] [CrossRef]
  30. Parsi, M.; Agrawal, M.; Srinivasan, V.; Vieira, R.E.; Torres, C.F.; McLaury, B.S.; Shirazi, S.A. CFD simulation of sand particle erosion in gas-dominant multiphase flow. J. Nat. Gas Sci. Eng. 2015, 27, 706–718. [Google Scholar] [CrossRef]
  31. Calderon-Hernandez, J.W.; Sinatora, A.; de Melo, H.G.; Chaves, A.P.; Mano, E.S.; Filho, L.S.L.; Paiva, J.L.; Braga, A.S.; Pinto, T.C.S. Hydraulic convey of iron ore slurry: Pipeline wear and ore particle degradation in function of pumping time. Wear 2020, 450–451, 203272. [Google Scholar] [CrossRef]
  32. Hewitt, D.; Allard, S.; Radziszewski, P. Pipe lining abrasion testing for paste backfill operations. Miner. Eng. 2009, 22, 1088–1090. [Google Scholar] [CrossRef]
  33. Hunacek, M. An invitation to applied mathematics. Math. Gaz. 2018, 102, 571–572. [Google Scholar] [CrossRef]
  34. Liu, L.; Fang, Z.; Qi, C.; Zhang, B.; Guo, L.; Song, K.I.-I.L. Numerical study on the pipe flow characteristics of the cemented paste backfill slurry considering hydration effects. Powder Technol. 2019, 343, 454–464. [Google Scholar] [CrossRef]
  35. Chhabra, R.; Shankar, V. Chapter 5—Flow of Multiphase Mixtures. In Coulson Richardson’s Chemical Engineering, 7th ed.; Chhabra, R., Shankar, V., Eds.; Butterworth-Heinemann: Oxford, UK, 2018; pp. 215–284. [Google Scholar] [CrossRef]
  36. Chen, Q.; Zhou, H.; Wang, Y.; Li, X.; Zhang, Q.; Feng, Y.; Qi, C. Resistance Loss in Cemented Paste Backfill Pipelines: Effect of Inlet Velocity, Particle Mass Concentration, and Particle Size. Materials 2022, 15, 3339. [Google Scholar] [CrossRef] [PubMed]
  37. Song, H. Engineering Fluid Mechanics; Springer: Berlin/Heidelberg, Germany, 2012; pp. 192–193. [Google Scholar]
  38. Zhang, Y.; Reuterfors, E.P.; McLaury, B.S.; Shirazi, S.A.; Rybicki, E.F. Comparison of computed and measured particle velocities and erosion in water and air flows. Wear 2007, 263, 330–338. [Google Scholar] [CrossRef]
  39. Kaushal, D.R.; Sato, K.; Toyota, T.; Funatsu, K.; Tomita, Y. Effect of particle size distribution on pressure drop and concentration profile in pipeline flow of highly concentrated slurry. Int. J. Multiph. Flow 2005, 31, 809–823. [Google Scholar] [CrossRef]
  40. Wichterle, K.; Večeř, M. The balance of mass and of mechanical energy in a flow tube. In Transport and Surface Phenomena; Wichterle, K., Večeř, M., Eds.; Elsevier: Amsterdam, The Netherlands, 2020; pp. 121–126. [Google Scholar] [CrossRef]
  41. Li, M.; He, Y.; Liu, Y.; Huang, C. Hydrodynamic simulation of multi-sized high concentration slurry transport in pipelines. Ocean Eng. 2018, 163, 691–705. [Google Scholar] [CrossRef]
  42. Gupta, P.K.; San, N.A.; Bhramara, P. Numerical prediction of near-wall flow field of dense slurry flow in pipe bends. Mater. Today Proc. 2021, 45, 3201–3206. [Google Scholar] [CrossRef]
  43. Wu, A.; Ruan, Z.; Wang, Y.; Yin, S.; Wang, S.; Wang, J. Simulation of long-distance pipeline transportation properties of whole-tailings paste with high sliming. J. Cent. South Univ. 2018, 25, 141–150. [Google Scholar] [CrossRef]
  44. Wang, X.; Li, J.; Xiao, Z.; Xiao, W. Rheological properties of tailing paste slurry. J. Cent. South Univ. Technol. Ed. 2004, 11, 75–79. [Google Scholar] [CrossRef]
  45. Gao, R.G.; Zhou, K.P.; Zhou, Y.L.; Yang, C. Research on the fluid characteristics of cemented backfill pipeline transportation of mineral processing tailings. Alex. Eng. J. 2020, 59, 4409–4426. [Google Scholar] [CrossRef]
  46. Li, G.; Sun, Y.; Qi, C. Machine learning-based constitutive models for cement-grouted coal specimens under shearing. Int. J. Min. Sci. Technol. 2021, 31, 813–823. [Google Scholar] [CrossRef]
  47. Wang, W.; Cheng, W.; Li, K.; Lou, C.; Gong, J. Flow Patterns Transition Law of Oil-Water Two-Phase Flow under a Wide Range of Oil Phase Viscosity Condition. J. Appl. Math. 2013, 8, 291217. [Google Scholar] [CrossRef] [Green Version]
  48. Al-Dogail, A.S.; Gajbhiye, R.N. Effects of density, viscosity and surface tension on flow regimes and pressure drop of two-phase flow in horizontal pipes. J. Pet. Sci. Eng. 2021, 205, 108719. [Google Scholar] [CrossRef]
  49. Liu, M.; Chen, L.; Duan, Y. A Study of Resistance Characteristics of Coal-water Slurry Passing Through a Tube Bend with a Small Curvature Radius. J. Eng. Therm. Energy Power 2008, 4, 425–428+445–446. [Google Scholar]
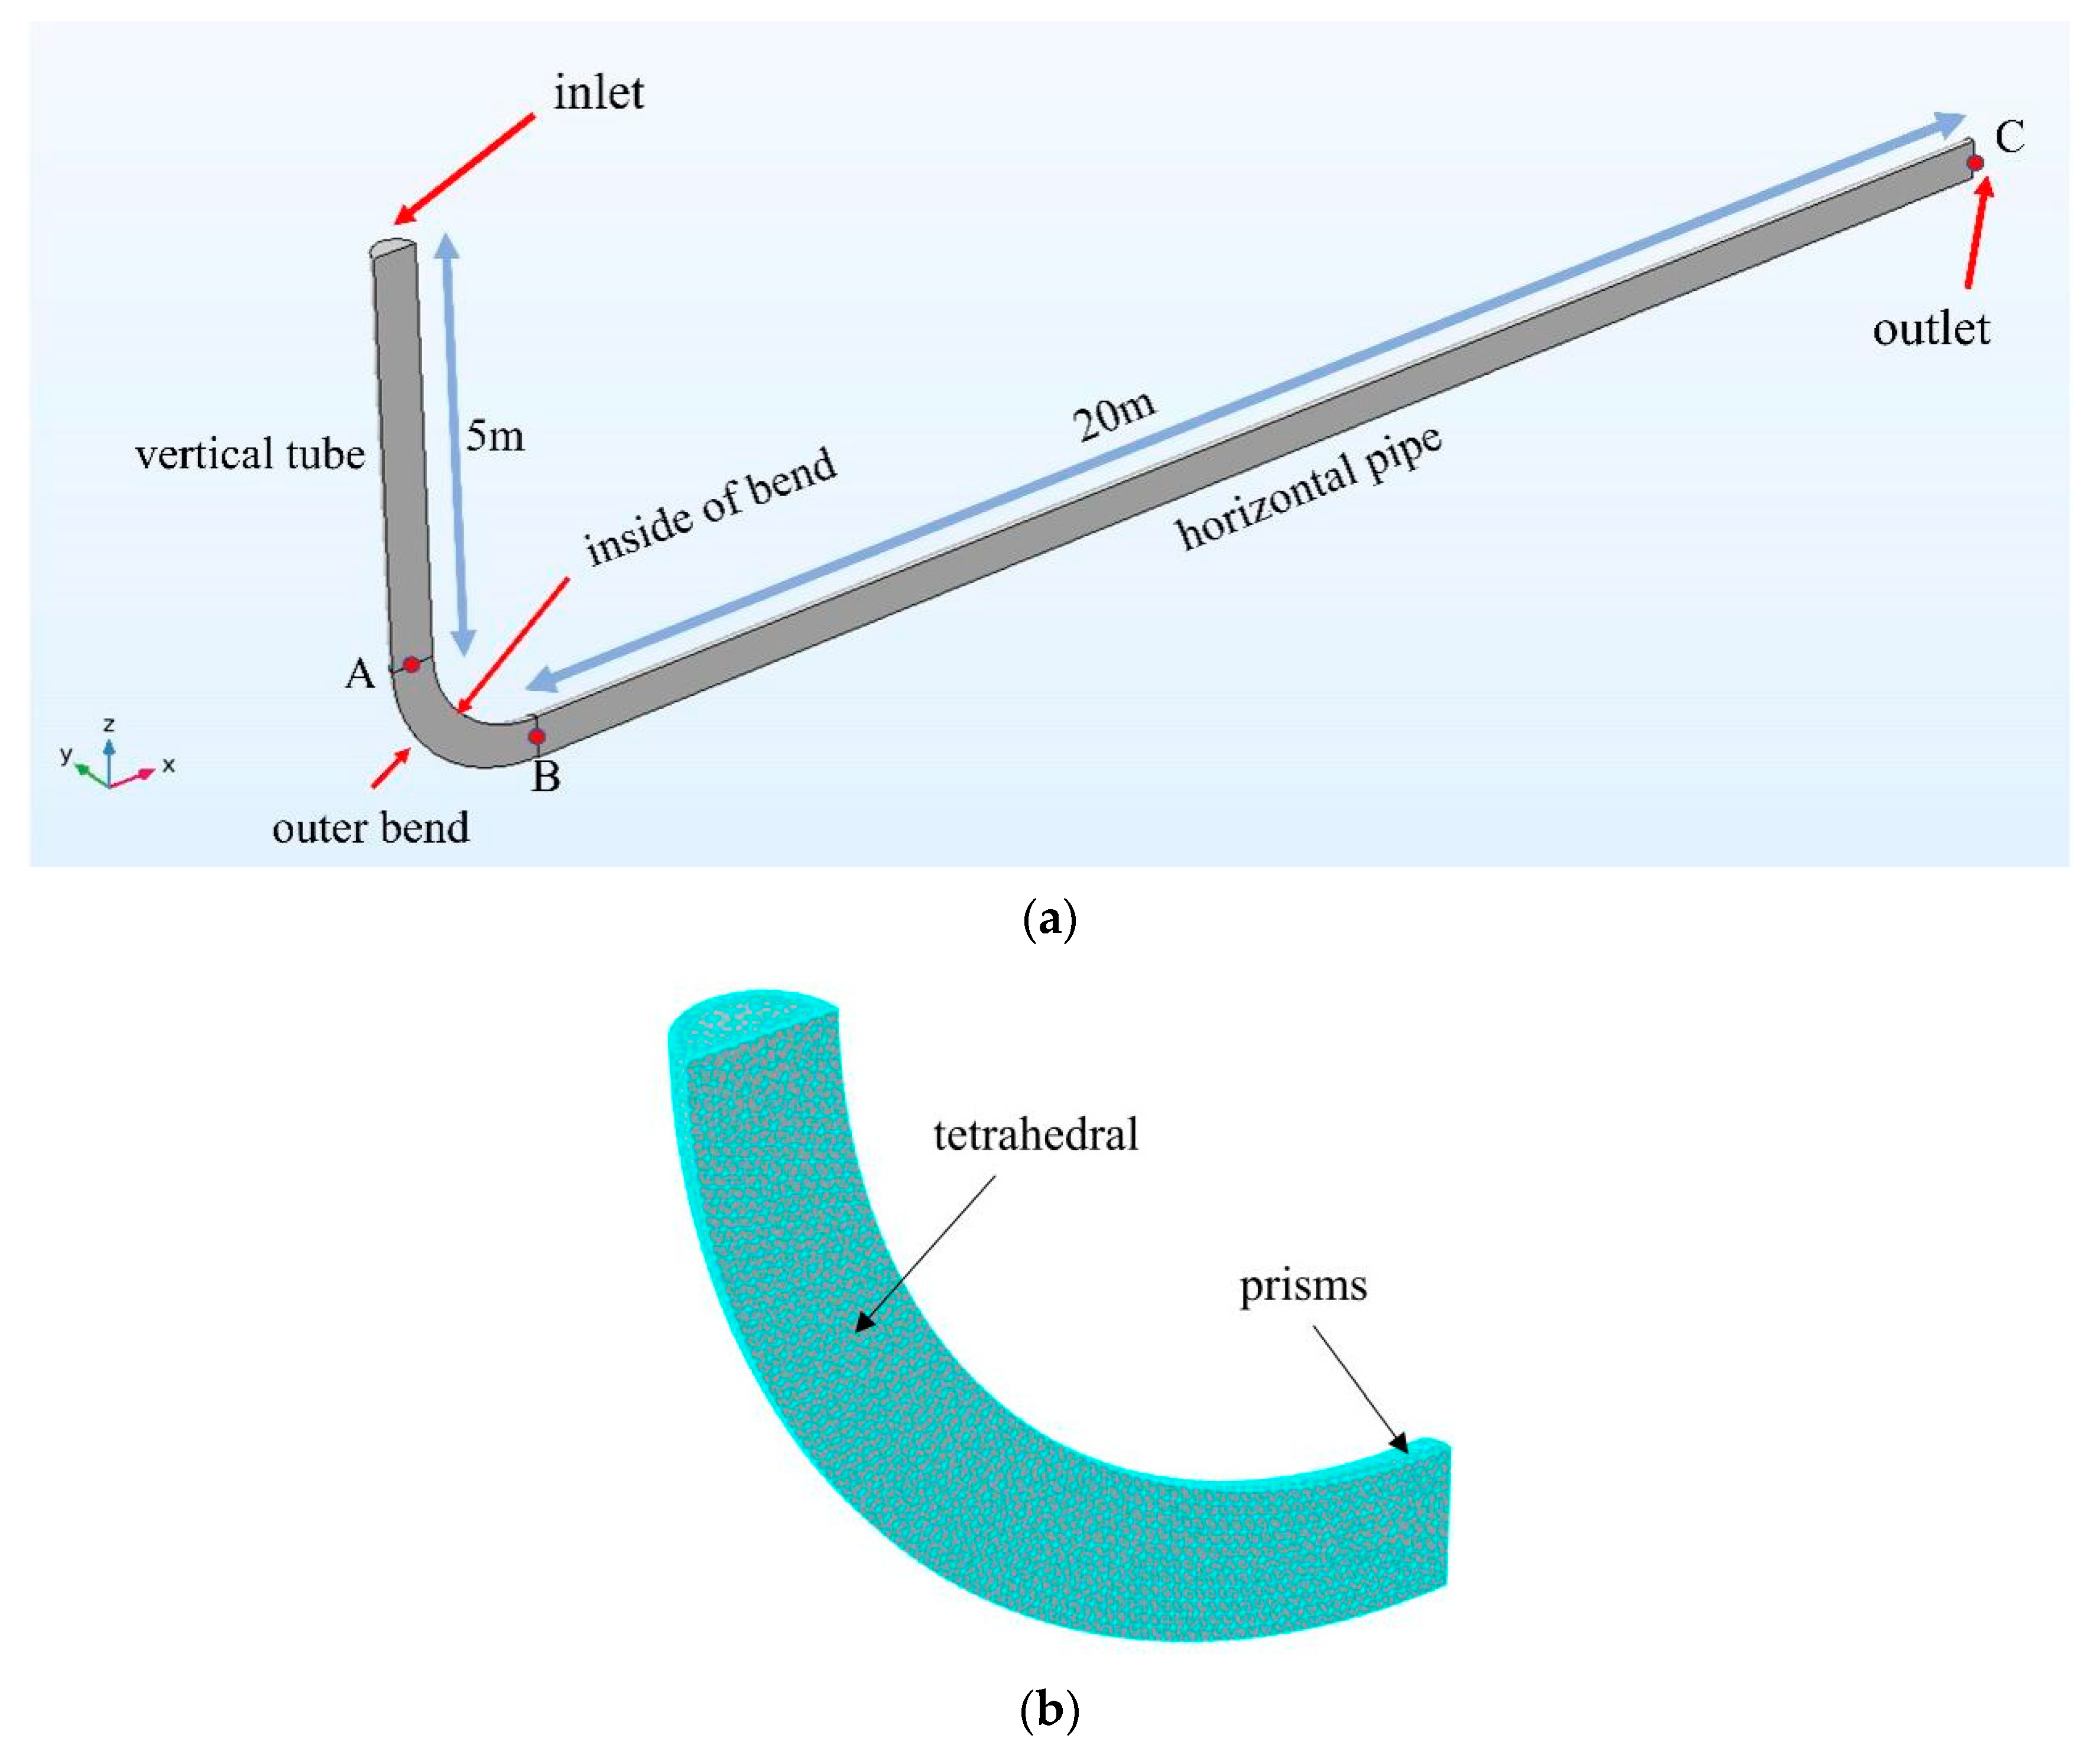
Figure 1. (a) Geometric model of the pipe bend. (b) Local mesh division of the pipe.
Sustainability 15 11890 g001
Figure 2. Comparison of numerical simulation results with experimental data.
Sustainability 15 11890 g002
Figure 3. Velocity distribution of the filling slurry flow in the pipe.
Sustainability 15 11890 g003
Figure 4. Pressure distribution of the CPB slurry flowing in the pipe.
Sustainability 15 11890 g004
Figure 5. The CPB slurry resistance loss for particle sizes of (a) 150 μm, (b) 1000 μm.
Sustainability 15 11890 g005
Figure 6. The CPB slurry resistance loss at viscosities of (a) 2.0 Pa·s, (b) 2.5 Pa·s.
Sustainability 15 11890 g006
Figure 7. Resistance loss at the bend. (a) The particle size of 150 μm, (b) The particle size of 1000 μm, (c) The particle size of 2000 μm.
Sustainability 15 11890 g007
Figure 8. (a) Wall erosion wear rate for CPB slurry with a viscosity of 2.0 Pa·s; Erosion wear clouds at the bend for particle size of 1000 μm and viscosity of 2.0 Pa·s with velocities of (b)1.5 m/s, (c) 2.5 m/s, and (d) 3.5 m/s.
Sustainability 15 11890 g008
Figure 9. (a) Wall erosion wear rate for CPB slurry with a velocity of 1.5 m/s; Erosion wear clouds at the bend for particle size of 1000 μm and velocity of 1.5 m/s with viscosities of (b) 2.0 Pa·s, (c) 2.5 Pa·s, and (d) 3.0 Pa·s.
Sustainability 15 11890 g009
Figure 10. (a) Wall erosion wear rate for CPB slurry with a velocity of 2.5 m/s; Erosion wear clouds at the bend for the viscosity of 3.0 Pa·s and velocity of 2.5 m/s with viscosities of (b) 150 μm, (c) 1000 μm, and (d) 2000 μm.
Sustainability 15 11890 g010
Figure 11. (a) The fitted function image, (b) Comparison of target and fitted values.
Sustainability 15 11890 g011
Figure 12. (a) The fitted function image, (b) Comparison of target and fitted values.
Sustainability 15 11890 g012
Figure 13. Annual wear thickness at inlet velocities of (a) 1.5 m/s, (b) 2.5 m/s, and (c) 3.5 m/s.
Sustainability 15 11890 g013
Table 1. Grid sensitivity convergence test.
Total Number of GridsBend Center Point Speed(m/s)
grid 1608,1722.813
grid 2883,8682.854
grid 31,380,6732.967
grid 41,439,2103.041
grid 51,553,9383.042
Table 2. Material property values used in simulations.
CPB slurry concentration (%)70
Fluid density (kg/m3)1850
Particle density (kg/m3)2879
Iron wall surface density (kg/m3)7860
Disclaimer/Publisher’s Note: The statements, opinions and data contained in all publications are solely those of the individual author(s) and contributor(s) and not of MDPI and/or the editor(s). MDPI and/or the editor(s) disclaim responsibility for any injury to people or property resulting from any ideas, methods, instructions or products referred to in the content.