Article

Environmental Impact of PV Power Systems

1
Technical Department, University of Slavonski Brod, Trg Ivane Brlić Mažuranić 2, 35000 Slavonski Brod, Croatia
2
Department of Mechanical Engineering and Material Sciences, Institute of Engineering Sciences, The University of Dunaújváros, Tancsics Mihaly 1/A, 2400 Dunaujvaros, Hungary
3
Technical School, E. Kumičića 55, 35000 Slavonski Brod, Croatia
4
Inženjering Gradnja, d.o.o., Ulica 108, brigade ZNG 40, 35000 Slavonski Brod, Croatia
*
Author to whom correspondence should be addressed.
Sustainability 2023, 15(15), 11888; https://doi.org/10.3390/su151511888
Submission received: 24 June 2023 / Revised: 27 July 2023 / Accepted: 28 July 2023 / Published: 2 August 2023
(This article belongs to the Special Issue Solar Energy Utilization and Sustainable Development)

Abstract

:
In response to the problem of increasing climate change and energy security, investment in renewable energy sources has increased significantly both in Europe and globally. Wind and solar power plants are expected to be the largest contributors to global decarbonization, ranking first and second in projected capacity by 2050. As all power plants have a certain impact on the environment, so do PV power plants, and due to their planned large capacities, it is necessary to assess their impact on the environment. Improving the manufacturing technology of PV system components, increasing the efficiency of solar cells, and using materials that are less harmful to the environment will reduce these impacts. Manufacturing PV system components is a highly energy-intensive process that involves greenhouse gas emissions. As new renewable energy capacity is built, the amount of “green” electricity on the grid increases, reducing CO2 emissions per kWh consumed. The objective of this paper is to analyze the current status of the environmental impact of PV power plants under these changing conditions in terms of CO2 emissions, land use, pollutant and noise emissions, and water consumption. The capacity installed to date will reach the end of its lifetime by 2050, which means that the amount of waste associated with it will increase over time. This can have a significant impact on the environment, which is why part of the work is dedicated to this problem. In addition to the available information from the literature, the authors also made their own estimates of land use based on data on newly installed PV power plants and PV modules available on the market. The results of the analysis show that there is enough land both in Europe and worldwide to install the planned capacities of rooftop and ground-mounted PV power plants. CO2 emissions are at the same level as for concentrated solar power, with a decreasing trend. Pollutant emissions, noise, and water consumption are not major problems compared to other types of power plants. Overall, it can be concluded that the expansion of PV capacity has a very positive impact on the environment.

1. Introduction

Today, the focus is on renewable energy-based power generation systems as a basis for achieving the Sustainable Development Goals (procuring cheap clean energy and mitigating climate change). Solar and wind energy dominate the renewable energy market, while biomass and geothermal energy make insignificant contributions [1].
Photovoltaic (PV) solar power plants are a promising technology for generating clean and renewable electricity from solar energy. However, like any other power plant, PV solar power plants can have environmental impacts that need to be carefully assessed and mitigated.
The environmental impacts of solar energy vary widely depending on the technology, which is divided into two basic categories: PV solar power plants and concentrating solar thermal plants (CSP) [2]. In this study, the impacts of PV solar power plants on the environment will be investigated.
Some of the most significant environmental impacts of PV solar power plants are related to land use, greenhouse gas emissions (GHG), water consumption, hazardous materials, visual impact, and noise [3].
Land use refers to the amount and type of land occupied by a PV solar power plant, which can affect the natural habitat and biodiversity of the area. Depending on the location, size, and design of the PV power plant, land use impacts can vary significantly. For example, some PV power plants can be integrated into existing buildings or structures, while others require clearing or grading large areas of land. Some PV solar power plants may also share land with other uses, such as agriculture or grazing, while others may displace or fragment wildlife habitat.
Greenhouse gas emissions refer to the amount of carbon dioxide and other gases released into the atmosphere by PV power plant activities that can contribute to global warming and climate change. The impact of GHG mainly depends on the life cycle stages of PV power plants, such as manufacturing, transportation, installation, operation, and decommissioning. For example, the manufacturing of some PV cells is very energy- and material-intensive, which can increase their carbon footprint. However, the greenhouse gas emissions of PV solar power plants during operation are much lower compared to conventional fossil fuel power plants because they do not burn fuel or emit pollutants.
Water use refers to the quantity and quality of water consumed or discharged by a PV power plant, which can affect the availability and sustainability of water resources in the region. The impact on water use is largely dependent on the type of PV technology and the place where the PV plant is located. For example, PV solar cells do not consume water to generate electricity, but they may require water for cleaning and maintenance.
Hazardous materials refer to the substances used or generated during the manufacture, installation, operation, or disposal of PV power plants that could be dangerous to the environment and human health if improperly handled or disposed of. The effects of hazardous materials depend on the type and composition of the PV cells and modules used. For example, some PV cells contain toxic metals such as cadmium or lead that can leach into soil or groundwater if damaged or disposed of. Some PV modules also use chemicals such as hydrofluoric acid or sulfuric acid for cleaning or etching, which can cause air or water pollution if released.
The production of PV system components is energy-intensive, so the associated CO2 emissions are high. Globally, the share of renewable energy in the power grid is steadily increasing, leading to a decrease in CO2 emissions per unit of electricity consumed. As the transportation sector is also striving to generate as little CO2 emissions as possible through the use of electric and hydrogen vehicles, the CO2 and particulate emissions generated during the transportation of PV solar power plant components are decreasing, as are the total CO2 emissions during the lifetime of the PV solar power plant. Therefore, CO2 emissions for PV power plant component production will continue to decrease over time. Assuming that the production technology of each component is also improved so that less energy is consumed in its production, this will further reduce CO2 emissions as well as emissions of other pollutants. In addition, the area required for the installation of PV power plants will be reduced by increasing the efficiency of PV cells as well as by applying BIPV technology. Thus, it is important to reevaluate the impact of each renewable energy source on the environment from time to time.

Literature Review

Various gases that are considered GHG include carbon dioxide (CO2), which is frequently used to measure the effects of global warming and other environmental impacts. Because these impacts are severe, much work addresses CO2 emissions from PV systems over their lifetime.
Tawalbeh et al. [3] discuss the environmental impacts of PV systems from manufacture to disposal, presenting a comprehensive analysis of these impacts and proposing novel design solutions to mitigate them. Their study also compares the greenhouse gas emissions of PV solar systems with those of fossil fuels and suggests ways to further reduce the carbon footprint of PV systems. According to the authors, the harmful effects of PV solar plants on the environment can be significantly reduced through careful siting, recycling, the development of new materials, and optimized design.
In their paper, Louwen et al. [4] discuss how installed photovoltaic capacity increased worldwide in the 1970s and how this affected energy consumption and greenhouse gas emissions. They show that experience curve legislation has led to a significant decrease in the environmental impact of photovoltaic electricity generation.
In their study, Reichel et al. [5] present a life cycle assessment (LCA) of CO2 emissions for two different solar module designs produced at three different locations. They show that glass-glass modules have lower environmental impacts than glass-back-sheet modules and that production in the EU and Germany has lower environmental impacts than production in China. The text also highlights the importance of up-to-date inventories, differentiated electricity yield calculations, and up-to-date electricity mix models to incentivize sustainable module designs.
Feng Liu et al. [6] discuss the assumption that renewable energy sources have low-carbon emissions and the need to consider the CO2 emissions that occur throughout their life cycle. The text also highlights the importance of introducing systemic policy instruments such as carbon pricing to incentivize low-carbon production of renewable energy systems and facilitate the transition to a low-carbon economy.
Biswas et al. [7] concluded in their study that photovoltaic power generation systems are land intensive, but a comprehensive assessment would include bioproductive land for total resource use. In this study, the life cycle ecological footprint method is used to evaluate a rooftop photovoltaic system connected to the power grid in a tropical climate.
Analyzing land use for PV power plants in light of the large capacity planned by 2050 is important because it can help reduce environmental impacts and optimize solar energy efficiency. Land use for PV power plants can compete with other land uses such as agriculture, forestry, or urbanization, so coordinated planning for the installation of new capacity for PV solar energy is needed. It is not surprising, therefore, that much of the work on solar energy use also addresses the issue of land use.
According to the van de Ven et al. [8] study, solar power systems could occupy 0.5–5% of all land by 2050, with a net carbon release of 0–50 g CO2/kWh. To avoid carbon release, new solar energy infrastructure needs to be jointly planned and regulated.
Maharshi Vyas et al. [9] discuss the problem of land scarcity for renewables such as solar PV plants. They propose new models of photovoltaic trees that can generate the same amount of electricity as conventional plants while consuming less land. They also compare different models of photovoltaic trees based on their power and land-use efficiency. The text suggests that photovoltaic trees can be a good solution for urban landscapes and smart cities that require more renewable energy.
M. Bolinger and G. Bolinger [10] present updated estimates of land requirements for PV systems in the United States based on empirical analysis of satellite imagery. They show that the power and energy density of these systems have increased substantially over time, especially for fixed and tracked systems. It is argued that previous benchmarks are outdated and overestimate the land requirements of industrial-scale PV systems.
Shum [11] analyzes the land use implications of a switch to a solar-based energy system in the United States. He asks how much land would be needed for solar energy and how this compares to historical episodes of rural settlement. He suggests that policies that enabled earlier land use changes could be adopted for the transition to solar energy as well.
Wang et al. [12] evaluates the future PV power generation potential in China based on land resource and power consumption projections. It shows that some provinces will have no PV potential in 2030 due to land changes and that the PV electricity supply-demand ratio will decrease over time. The study serves as a foundation for future evaluations and shows how terrain changes affect PV potential.
Trondle [13] examines the impact of different renewable electricity options on land requirements and the price of decarbonizing Europe’s electricity supply. The minimum cost of a fully renewable electricity mix can be determined by a dynamic model, but solar and wind energy require a lot of land. The study also shows how switching from onshore wind to offshore wind or solar PV can significantly reduce land requirements at a low cost. This means that different trade-offs between land use and cost can lead to fully renewable electricity.
Sukumaran et al. [14] present an analysis of land footprints and a thorough plan for a 5 MW grid-connected solar farm. The solar farm consists of 13,490 PV modules, five inverters, a transformer, cables, and protection devices. The land requirement is estimated to be ~43,768 m2. The paper is intended to provide energy professionals and policymakers with a general approach to solar farm design.
Nimay Chandra Giri et al. [15] discuss the benefits of agrivoltaic systems that combine solar energy generation and agriculture on the same land. The paper argues that agrivoltaic systems can reduce problems caused by fossil fuels and save land area. The paper also describes the design and components of a 5 MW solar farm in India and its impact on crop production and water harvesting. The paper aims to provide a new approach to solar farm design in developing countries.
Zhang et al. [16] discuss the benefits and possible environmental impacts of deploying PV technology and provide recommendations to improve its sustainability. Although PV technology significantly reduces emissions of pollutants and greenhouse gases, it also has negative environmental impacts. These include biodiversity and habitat loss, climatic impacts, resource consumption, and PV module disposal.
The manufacturing of PV system components and the recycling of their parts at the end of the power plant’s life may use or generate toxic substances that pose a potential risk to the environment and human health. This issue has also been adequately addressed in the literature.
Nain et al. [17] studied the potential fate and transport of leached metal contents from photovoltaic systems and estimated the risks to the environment and human health via dermal exposure and ingestion for subgroups of children and adults. Results showed that children were most at risk from lead. Children and adults are more at danger from exposure to metals like cadmium, lead, indium, molybdenum, and tellurium through the skin and soil ingestion. Exposure to contaminated soil results in an overall hazard index >1. In every case, lead poses a serious cancer risk, while other metals pose an acceptable non-cancer risk through groundwater exposure.
Kwak et al. [18] examine the potential hazards of solar cell leachate, compile the available data, review the difficulties, and evaluate the scientific literature on toxicity and leachate potential. The main materials used in solar cells, including lead, tin, cadmium, silicon and copper, are hazardous to human health if released into the environment. To reduce the environmental hazards of PV technology, new avenues of research and policy are being proposed.
In order to identify issues with the environment and public health, Bakhiyi, et al. [19] review life cycle assessments of PV systems. To find the best possible balance between sustainability and occupational health and safety, they advise taking a holistic approach. Manufacturers should collaborate with workers, researchers, and government agencies to improve research, regulations, preventive risk management, and accountability.
Based on the LCA method, Piasecka et al. [20] performed an environmental and energy assessment of the materials used in PV power plants. Solar modules that are disposed of in landfills after use have the greatest negative impact on the environment.
The most harmful metals for health and environmental quality are PA6, cadmium, nickel, copper, lead, and silver. Processes for recycling materials could reduce their negative impact on the environment. Guidelines for environmentally sound reuse of components and materials from solar power plants have been proposed.
Stamford and Azapagic’s [21] apply LCA to calculate the environmental impact of Si-based PV power plants installed at two sites in 2005 and 2015. Although technological advances have reduced environmental impacts, the industry’s migration to China has resulted in an average increase in environmental impacts of 9–13% compared to production in Europe.
The six ground-mounted solar power plants in western India were the subject of a study by Roy and Ghosh [22] on land-use effectiveness. The components of the PV modules were cadmium telluride, amorphous silicon, and poly c-Si. The results showed that the small-capacity mono c-Si PV system has a greater electrical yield than its larger version and that the agricultural yield of a-Si and CdTe systems is superior to that of mono c-Si systems.
At the end of the power plant’s life, the question is how to dispose of its parts with the least possible environmental impact, the lowest possible energy consumption, and the highest possible recycling rate. This issue will become increasingly important in the coming period as the number of PV power plants at the end of their life will increase, and with it the amount of waste. This topic is also analyzed in a number of articles.
Farreli et al. [23] investigated and proposed the most efficient ways to recycle end-of-life modules. They focused on maximizing the recovery of components from the module, taking into account current design constraints. They reported on some of the latest recycling methods at the industry and laboratory levels. Challenges, opportunities, models, and arguments for a critical analysis of closed-loop recycling are presented, as well as alternative cascade options for open-loop recycling.
Sica et al. [24] discuss the technological and environmental impacts of PV power generation and recycling options for PV modules. They argue for a circular economy approach that increases resource efficiency and reduces waste.
Jing Tao et al. [25] examines three ways of recycling PV modules: recycling of production waste, reprocessing and reuse of disposed modules, and recycling of end-of-life modules. It examines the existing technologies for each route and their advantages and disadvantages. It also discusses the environmental and economic benefits and challenges of recycling PV modules.
Teknetzi et al. [26] studied the recovery of silver and indium from used CIGS solar cells using different concentrations of nitric acid. They also studied the effects of acid concentration on the purity of the leached metals and the possibility of removing zinc as an impurity. They found that a higher acid concentration and surface liquid ratio increased the recovery of silver and indium, but also increased the impurity. They suggested that a low acid concentration can be used to selectively leach zinc and improve the purity of silver.
Gahlot et al. [27] gave an overview of recycling techniques and the challenges of recycling solar waste from first and second generation PV modules. They focused on the recovery of metals and critical elements from different types of solar cells using various pretreatment and extraction techniques. They also evaluated the economic value, environmental impact, and global trends in PV module recycling. They proposed a holistic approach to metal recovery and provided an outlook on the future of the recycling industry.
According to Peplow [28], more than 90% of PV modules are built of c-Si and have a lifespan of roughly 30 years. It is expected that 8 million tons of these modules will reach end-of-life by 2030 and 80 million tons by 2050. However, current recycling practices for these devices are inadequate and underutilized.
Recycling PV modules is important for both economic and environmental reasons, according to Wang [29], who pointed out that solar energy can generate a significant amount of waste. PV module materials can be recycled through physical and chemical processes, and there are differences between PV module recycling and electronics recycling.
Dias and Veit [30] consider that the recycling of photovoltaic modules is of paramount importance to reduce production costs and environmental impacts. The great number of photovoltaic modules on the market are made of c-Si, which includes all three types of materials. They describe the components of first-generation modules, evaluate their technical feasibility, and propose recycling techniques to recover valuable elements.
Dias et al. [31] have proposed a new technology for recycling silicon photovoltaic modules that includes deframing, shredding, and electrostatic separation. The technology produces a valuable mixture of metals and silicon and a less valuable mixture of glass, silicon, and polymers. The paper compares the technical, environmental and economic aspects of the proposed technology with a full recycling process and landfilling. They conclude that the proposed technology is better than landfilling and can be more profitable than full recycling in some scenarios.
D’Adamo et al. [32] evaluated the profitability of a PV module recycling under various market conditions and costs. They found that the plant is not profitable without avoided landfill costs, but it becomes profitable when a sufficiently high value is applied. They suggested that policy makers should link the disposal fee for PV modules to the circular benefits of recycling.
According to Isherwood [33], since the market for photovoltaic modules is growing rapidly, it is essential to prepare for the thorough recycling of old PV modules. Semiconductor materials can be separated and extracted manually, mechanically, chemically (wet or dry), or by a mixture of these methods.
At the end of this literature review, recent studies are listed that complement or clarify the main theme of this article.
Brunet et al. [34] evaluated how well a grid-connected PV solar power plant in Madagascar serves as a vehicle for sustainable development. The paper challenges the endogenous development paradigm and provides a framework for qualitative, multi-criteria sustainability assessment. It emphasizes that collaboration among parties is necessary for the power plant to act as a vehicle for sustainable development. The sustainability of solar PV plants should be assessed using a qualitative methodology, dissociated indicators, and potential negative interactions between spheres of influence.
Subramaniyan et al. [35] present a method for predicting the degradation rate of PV modules based on physical models and statistical data modeling. Their study examines the effects of dynamic environmental stresses on module performance degradation, including temperature, UV radiation, and relative humidity. The module degradation pathway and environmental variables are linked in their study through a cumulative exposure model. It is expected that their work will lead to a better understanding of PV degradation to improve module design and performance.
To enhance the performance and lifetime of the module, it is essential to recognize to the factors that directly affect it throughout its lifetime, according to Jathar et al. [36]. These factors are temperature, humidity, wind direction, light intensity, altitude, and barometric pressure. It is vital to consider environmental elements, intrinsic characteristics, and other intermediary factors while optimizing the performance of solar energy systems. The performance of a PV system can be greatly affected by environmental factors. Continuous inspection and maintenance are required to achieve maximum effectiveness and performance.
Pouran et al. [37] emphasize the many benefits of floating PV systems, including fewer land use conflicts, water conservation, and higher efficiency than ground-mounted PV systems. However, the lack of government policies and development plans may hinder their long-term reliability and sustainable growth.
According to Haas et al. [38], floating photovoltaic power plants are becoming increasingly popular due to advantages such as lower evaporation losses and higher efficiency. In this study, the effects of floating photovoltaic modules on reservoir water quality and hydropower generation are investigated. The comparison between situations with and without solar modules is performed using a three-dimensional numerical model of hydrodynamic water quality. To consider alternative water and electricity price situations, an optimal hydropower scheduling method is used for Rapel Reservoir in central Chile. Different solar panel covers were found to offer a trade-off between cost and environmental safety.
In their review, Allouhi et al. [39] present recent data on the development of photovoltaics in terms of materials, markets, and technology. Pollution reduction approaches are discussed to improve power output and thermal management in PV systems. Challenges and opportunities are also discussed.
Although not directly related to environmental impact, hosting capacity is one of the most important aspects related to PV power. It is usually defined as the total PV capacity that can be accommodated at a given grid connection without compromising voltage, power quality, and protection, and without need to upgrade the grid.
To address the challenges of increasing PV penetration beyond the hosting capacity, it may be necessary to modify communications and controls, change protection systems, upgrade distribution circuit equipment, and/or improve distribution equipment. It has been shown that smart inverter controls can help to significantly increase PV penetration, as can energy storage systems, which is a large separate topic.
There are numerous studies that deal with the technical or practical assessment of PV penetration in the existing power system, e.g., [40,41,42]. Estimating hosting capacity on a large scale requires a large number of power flow simulations, and this requires large computational resources.

2. Materials and Methods

The goal of this study is to show the current status of the environmental impact of PV solar power plants based on the latest available data. Based on the established objective of the study, the content units and boundaries of the study were defined. For each content unit, key questions were defined, i.e., keywords based on which the database search was launched to obtain answers to the desired questions. In the first step, scientific databases such as Web of Science, Scopus, PubMed, Wiley Online Library, Google Academic were searched. Much of the information came from articles published in journals of academic publishers such as Taylor and Francis, Elsevier, MDPI, charters of related books, articles presented at international conferences, articles from IEEE, and specific scientific literature. A certain amount of information was found in reports and studies of the International Renewable Energy Agency, the European Environment Agency, and in official documents of the European Union (EU Directives and EU Solar Strategy).
The analysis primarily used information from documents published in the last five years, and missing information was taken from other available documents that are slightly older. A calculation method was also used in the part of the work that refers to the required area for installing the planned capacities of PV power plants and amount of waste generated up to 2050. In addition, a process known as “snowballing” was used to identify additional articles based on the reference list of research studies found.
Generally, the research results are carried out and analyzed by the current literature data, which help the reader clearly determine the outcome. In this study, it was assumed that the average lifetime of PV modules is 30 years and that of inverters is 10 to 15 years [43]. It should be noted, however, that advances in photovoltaic technology are extending the life of photovoltaic modules and reducing module degradation over time. For example, from 2023, only gallium will be used as a doping element (instead of boron) because it significantly reduces the light-induced degradation of p-type materials [44], which extends the life of the module. For this reason, some manufacturers already offer a 40-year warranty on modules (e.g., Sunpower).
The LCA methodology used in most studies is the “cradle-to-gate” approach. Although the methodology for some impacts is dictated by the ISO regulations (e.g., the methodology for determining CO2 emissions), it should be noted that there are some differences in the methodologies used by individual authors and thus differences in the data obtained.

3. Results and Discussion

The European Green Plan states that it is critical to decarbonize the European Union’s energy system to meet the climate targets set for 2030 and 2050. According to the REPowerEU plan, photovoltaic systems will play a crucial role in this process. Therefore, it is important to understand the impact of PV installations on the environment. In order to reduce these impacts as much as possible, it is necessary to understand in which phases of the life cycle of a PV plant they occur and which factors influence their intensity. In this way, land use, greenhouse gas emissions, hazardous substances, water consumption, visual impacts, noise, and waste generated at the end of the life cycle of a PV plant are analyzed as the main environmental impacts in the rest of the paper.

3.1. Land Use

PV solar power plants are a key technology for the transition to a low-carbon energy system in world. However, the deployment of PV systems requires a significant amount of land area [1], which can pose challenges for land use planning, environmental protection, and social acceptance. This chapter aims to analyze the land requirements for PV solar power plants (rooftop and ground-mounted) in Europe and the world until 2030 and potential issues in this context. This is a difficult task in regard to obtaining precise information, as different scenarios and assumptions may lead to different projections.
The worldwide installed cumulative module power by the end of 2022 will be 1198 GW [44]. According to the “Net Zero Emissions by 2050” scenario [45], the global installed PV capacity is estimated to reach 4400 GW by 2030 and 14 TW by 2050. The share of rooftop PV capacity will be about 1800 GW, and the share of land-based PV capacity will be about 2600 GW. For Europe, the same report estimates rooftop PV capacity at about 300 GW and land-based PV capacity at about 300 GW by 2030.
According to the Solar Energy Strategy [46], Europe aims to bring nearly 600 GW by 2030. The strategy calls for at least 40% of the potential to be installed on rooftops by 2030.
Based on the IEA’s Renewables 2020 report [47], the global share of distributed PV (including rooftop and other small-scale systems) in total PV capacity was about 40% in 2019, and it is expected to increase slightly to 41% by 2025. For Europe, the same report states that the share of distributed PV was about 47% in 2019, and it is projected to increase to 49% by 2025. The assumption is that these shares will remain constant until 2030. Of course, these are rough estimates and they may vary depending on the actual definitions and data sources of rooftop and land-based PV systems.
The essential key to achieving these goals is the implementation of a solar directive on all new public and commercial buildings with floor areas greater than 250 m2 by 2026, on all existing public and commercial buildings with floor areas greater than 250 m2 by 2027, and on all new residential buildings by 2029 [46]. It can be said that both residential and commercial electricity consumers are increasingly becoming producer-consumers, solar panels are being integrated as part of the building, and smart cities are planning to take advantage of small-scale distributed solar power combined with energy storage. To analyze the area needed for the planned capacities, the authors evaluated the area occupied by newer rooftop PV systems (m2/kW) (Table 1) and the area of utility-scale PV systems (Table 2).
If we add 10% to the average net area of 4.53 m2/kW for installation reasons, we can obtain five m2/kW. The area needed per kW of installed utility-scale power varies depending on the module type (efficiency), and the distance between rows of modules needed to prevent significant shading of the modules, which depends on the latitude of the power plant location.
Table 2 shows that the average value for utility-scale PV systems is 19 km2/GW, and the same value is reported by [51].
A plant with thin-film CdTe modules with lower efficiency requires about 20 to 50% more area than a plant with c-Si modules. Based on the above data on planned capacity through 2030 and occupancy of area per MW of installed capacity, Table 3 shows the area needed for this capacity calculated by authors.
To continue the analysis, it is necessary to investigate whether there is enough area to realize the installation of PV solar capacity. For this purpose, the theoretical, technical, economic, and practical potential should be distinguished.
The theoretical potential of PV power plants is the maximum amount of solar energy that can be converted into electricity by PV systems under ideal conditions. This depends on the solar radiation, the theoretical area available for PV installation, and the efficiency of PV technology.
The technical potential of PV power plants is the amount of solar energy that can be converted into electricity by PV systems under realistic conditions. The technical potential considers technical constraints, such as the area suitable and accessible for PV installation, roof orientation, slope, shading, etc., but does not consider any economic, environmental, or social constraints.
The economic potential of PV power plants is the amount of solar energy that PV systems can convert into electricity under profitable conditions. The economic potential considers some economic constraints, such as capital cost, operation, and maintenance cost, electricity price, policy incentives, etc., but does not consider any environmental or social constraints.
The practical potential of PV power plants is the amount of solar energy that can be converted into electricity by PV systems under acceptable conditions. This depends on the solar radiation, the area desirable and acceptable for PV installation, and the impact and benefit of PV technology. The practical potential considers some environmental and social constraints, such as land use competition, ecological impact, public acceptance, etc.
To date, national or regional data on roof areas are not available at the EU level. For this reason, estimated data are used, which of course vary widely due to the method used to obtain them. There are generally three techniques for identifying and assessing rooftop PV potential: low-level, medium-level, and high-level. Low-level techniques use, for example, population density data to calculate rooftop area. The data is assumed to be homogeneous throughout the area, resulting in a relatively large error. Medium-level techniques combine statistical data with spatial information from geographic information systems and light detection and ranging (LiDAR) methods. High-level techniques include high-level analyzes that use advanced rooftop digitization methods and detailed spatial information and solar radiation analyzes. These methods typically include sophisticated tools to evaluate the influence of roof pitch, appearance, and building shading, and provide results of greater accuracy and reliability [52].
According to the analysis of Kumar et al. [53], the theoretically available roof area for PV systems worldwide is 0.2 million km2. Based on satellite imagery and a combination of Big Data, machine learning, and geospatial data analysis, the study determined the available rooftop area. According to a study by Bódis et al. [52], the theoretically available roof area for PV systems in the European Union is 0.14 million km2 and the technically available roof area is 7935 km2. The estimated economic potential is 68.7% of the technical potential. The study used an innovative method combining geospatial and statistical data to determine the technical potential of roofs in the EU for PV installations.
Additionally, it should be mentioned that there are about 131 million buildings in the member states of the European Union [54]. Assuming that, on average, about 1% of new buildings are built per year in Europe, and that each project can add 20 m2 of roof area, this would potentially add 26 km2/year of available roof area, e.g., 208 km2, until 2030.
When mentioning the available area for installing PV power plants on the roofs of buildings, it is also necessary to mention building integrated photovoltaics (BIPV), which increases the available area for installing PV power plants on other parts of the building, such as the walls of the building. The capacities of currently installed BIPV in Europe are not yet large enough, as this technology still faces major obstacles [55].
From all the information so far, it can be concluded that there is enough space for PV capacity installation in the EU and worldwide, even though it has been announced that the planned capacity in the EU will increase from 600 GW to 900 GW in 2030. However, the available space is not evenly distributed among all EU member states. For example, Belgium, Luxembourg, and the Netherlands will use most of the available space, while the other member states will use less than 50% of the available capacity [52].
The technically available areas for utility scale PV systems vary greatly from country to country. There are no numerical data on these areas in the literature. According to rough estimates by the authors, large PV plants would take up on average 0.3 to 2% of the technically available land, so there is no problem in this respect.
The most important issues related to land use for PV power plants should also be mentioned:
  • Land use conflicts: ground-mounted PV plants may compete with other land uses, such as agriculture, forestry, conservation, or urban development. This can lead to trade-offs between different environmental, economic, and social goals, such as food security, biodiversity protection, or local employment. Therefore, careful site selection and land use planning are essential to avoid or minimize negative impacts and maximize positive synergies.
  • Environmental impacts: Both rooftop and ground-mounted PV systems can have direct or indirect impacts on the environment, such as habitat loss or fragmentation, soil erosion or pollution, water use and pollution, visual impacts, or glare. Therefore, environmental impact assessments and mitigation measures are required to ensure compliance with relevant standards and regulations and improve environmental sustainability.
A comparison of the area occupied by the installation of PV power plants and other energy facilities (Table 4) shows that PV power plants occupy a larger area than other energy facilities, except biomass power plants.

3.2. Greenhouse Gas Emissions

When analyzing the life cycle of a solar system, it is clear that during the production of components, handling and transportation of materials, installation of the plant, decommissioning, and disassembly, GHG emissions occur, while during the operation of the PV power plant, there are no emissions (if we ignore the cleaning of the panels). For the production of poly c-Si used in the manufacture of PV modules, the Siemens process is used, which is represented by about 83% and will retain its main position in the future, although the use of the fluidized bed reactor (FBR) process is gradually increasing [44]. The process is responsible for more than 35% of total energy consumption and total greenhouse gas emissions [6,57].
In the study [58], greenhouse gas emissions were analyzed based on the installed capacity of the power plant. For this purpose, the power plants were divided into four groups (see Figure 1).
Figure 1 shows that the CO2 eq./kWh emissions range from 12.5 to 126. Variability is caused by different energy requirements during the manufacturing and assembly processes as well as the energy mixtures used to manufacture PV modules [59]. Additionally, variations in module technology (efficiency), and device lifetime, varying from 15 to 30 years, can also be important factors [60]. According to the IEA tracking report in 2022 [61] the CO2 emissions for the production of PV systems ranged from 14 to 73 g CO2-eq/kWh, depending on the PV technology, the location of the power plant, and the electricity mix used for the production. The reported values for CO2 emissions are roughly in the same range as for concentrated solar power technologies (8 to 90 g CO2 eq./kWh) [2].
Photovoltaic cells are made from different types of semiconductor materials. In 2021, Si wafer-based PV technology will represent more than 95% of total production. of which monocrystalline technology accounted for about 84% and thin film cells for the remaining 5% [62]. Most studies in the literature have evaluated the greenhouse gas emissions of c-Si cells (monocrystalline and polycrystalline), while thin film technology has been analyzed to a much lesser extent.
According to [58], the mean value of greenhouse gas emissions for monocrystalline, polycrystalline, and thin film was estimated to be 61.8, 52.2, and 35.5 g CO2-eq./kWh, respectively.
Chen et al. [63] performed LCA for the production of mono-c-Si PV cells in China. Interesting, they reported 5.60 to 12.07 g CO2 eq./kWh for monocrystalline silicon, which is less than the findings of studies conducted in Europe, America, and Asia.
Commercially, thin film modules can be seen in many different technologies, such as cadmium telluride (CdTe), copper indium gallium selenide (CIGS), and amorphous thin film silicon (a-Si).
The average greenhouse gas emission is 30 g for a-Si technology, 27 g for CdTe technology, and 53 g CO2 eq./kWh for CIGS technology. CdTe thin-film technology has the lowest average value for greenhouse gas emissions because the production of CdTe thin-film modules requires a lower amount compared to other technologies [59,64].
Polverini et al. [65] have developed a customized methodology for estimating the carbon footprint of PV modules, with particular attention to the production and transport phases, following a cradle-to-gate approach. Their results, shown in Table 5, are similar to the previously mentioned IEA results.
The aforementioned studies demonstrate that, with contributions ranging from 93% to 99.9%, the infrastructure phase of the life cycle is the one that contributes the most to overall greenhouse gas emissions. This phase includes the production and processing of materials, transport, assembly, and disassembly, and decommissioning. The production of materials contributes the most to emissions, although according to [65], reducing the aluminum frame weight by 50% does not significantly contribute to reducing the carbon footprint compared to other factors.
The efficiency of PV power plants is directly related to solar radiation and sunshine duration. As a result, CO2 eq./kWh emissions are higher in regions with low solar irradiance. For example, PV power plants in Northern Europe have higher GHG emissions (80–130 g CO2 eq./kWh) compared to power plants in Southern and Western Europe (16–106 g CO2 eq./kWh) and North America (16–60 g CO2 eq./kWh) [58].
So far, the analysis of GHG emissions has focused on PV modules. However, the question arises about the contribution of other components of the PV power plant to GHG emissions. Although there is not much research in this regard, the study [66] provides some information for one system in Sweden.
Table 6 shows that the second largest source of carbon emissions is the mounting structure. The use of galvanized steel can reduce this contribution by about 40%, and the use of wood can reduce it by up to 75% compared to a conventional aluminum structure. The inverter has a significantly lower impact, and the contribution of the cable can be neglected.
Total global emissions from electricity and heat generation reached a record 14,600 MtCO2eq in 2022, lower than expected, as some countries suffering from gas shortages switched to coal for fuel. Among them, PV systems played an important role in reducing CO2 emissions in 2022 by avoiding about 1399 Mt of annual CO2 emissions (an increase of 30% compared to 2021). This is calculated as the emissions that would occur for the same amount of electricity generated in all countries with a different energy mix in the grid, and taking into account the emissions from solar PV systems during their life cycle. This amount of avoided CO2 emissions is equivalent to about 10% of the total emissions in the electricity and heating sectors [67].
In general, the following can be stated with regard to CO2 emissions:
  • The largest share of emissions comes from the manufacturing phase of the PV system components (80% to 95%), followed by the end-of-life disposal phase (5% to 20%), and negligible amounts of GHGs are emitted during the operation of the PV power plant (0.3% to 1%). For comparison, most GHG emissions from non-renewable energy sources occur during the operation phase of the power plant (about 98%), with the remainder occurring during the construction and decommissioning phases of the power plant. (Author’s estimation).
  • GHG emissions for the production of PV power plants decrease over time as PV modules become more efficient, the production of solar cells becomes less energy intensive, and the share of renewable energy in the power grid increases [68].
  • The carbon footprint of PV solar systems is estimated in the range (14–130 g CO2-eq/kWh) [58], which is lower than for gas (608 CO2-eq/kWh), oil (742 CO2-eq/kWh), and coal-fired (975 g CO2-eq/kWh) power plants [69]. However, the carbon footprint of PV solar is larger than that of CSP (14–32 CO2-eq/kWh) [2], wind power (8–23 CO2-eq/kWh), geothermal power plants (38 CO2-eq/kWh), nuclear power plants (24–66 CO2-eq/kWh), and hydroelectric power plants (10–13 CO2-eq/kWh) [64].

3.2.1. The Energy Payback Time (EPBT)

The life cycle CO2 emissions of PV power plants are largely influenced by the energy consumed to manufacture the system components. Today’s solar cells are primarily composed of c-Si. Large wafers of purified silicon are used for the production of both mono-c-Si and poly c-Si. The most energy-intensive part of the production process of solar cells is the purification and crystallization of the silicon. Other operations of silicon cell and module production that contribute to energy consumption include cutting silicon into wafers, making cells from these wafers and then assembling cells into modules (including encapsulation), as well as energy consumption for production equipment.
Since energy consumption is high, information on the energy payback time (EPB) is useful. The EPBT of a solar PV system is the time it takes for that system to generate the equivalent amount of energy needed to produce that system. The energy payback time is influenced by the following factors:
  • The materials used to manufacture the PV system and the technology used
  • The efficiency of the solar cells
  • The irradiation related to the location of the PV solar system
Over the past two decades, solar cell manufacturers have succeeded in reducing the thickness of wafers, thereby significantly reducing the material consumption and cost of the solar cell. Wafer thickness has been reduced from 300 µm in 2004 to 150 µm in 2023, with the potential to reduce wafer thickness to less than 100 µm. The efficiency of solar cells is constantly increasing, so mono and poly c-Si solar cells will have an efficiency of about 21% in 2021 [51]. If we look at the energy payback period of the PV solar system depending on the irradiation at a specific location in Europe, it is between 1 and 2.5 years (Figure 2).
To sum up, we can say that to build a photovoltaic system, we have to spend energy to get the environmental benefits of solar energy. But the investment in energy is small. Assuming a 30-year lifetime of the photovoltaic system, the net gain is 27 to 29 years of electricity production without greenhouse gas emissions.

3.2.2. Other Pollutant Emissions

Certain pollutants may be emitted during the production of PV system components and during end-of-life disposal. In addition to GHG gases (such as CO2, CH4, N2O, SF6), there are possible emissions of gases that create acid compounds (such as SO2, NOx), particles (such as dust), heavy metals (such as Cd, Pb), and organic compounds such as solvents. Perfluorocarbons (PFCs) are widely used in the electronics industry, for example, in silicon wafer plasma cleaning.
Cleaning processes are mandatory for high-efficiency cell production lines. H2O2-based cleaning was most commonly used in the past, but ozone-based cleaning processes will become mainstream within the next few years [44]. During the production of thin film PV modules and flat panel displays, nitrogen trifluoride (NF3) is still partially used to clean the coating system. The remains of this gas can escape into the atmosphere, which is very dangerous because NF3 is more than 17,000 times more harmful to the environment than CO2.
Edge isolation is required to separate the pn junction from the bulk. In the past, inline processing with HF/HNO3 was the predominant technology for wet chemical edge isolation, but as of 2023, HNO3-free processing will be the predominant technology, despite the required combination of inline HF oxide etching and KOH (alkaline) silicon removal [44]. The advantages of KOH-based edge isolation are the replacement of expensive HNO3 and the less costly treatment of process off-gases due to the elimination of nitrogen vapors.

3.3. Hazardous Materials

The extraction of quartz and its conversion into poly c-Si require high-temperature equipment, i.e., energy-intensive systems. However, the use of this material to make solar cells is neither toxic nor dangerous to production workers and public safety.
When we talk about harmful substances for the environment, our attention is focused on cadmium and lead, which are known as toxic heavy metals. However, for PV cell manufacturing, cadmium is used in compounds that are chemically more stable and therefore safer than pure cadmium. Cadmium telluride is non-volatile, so it cannot be inhaled, and is not soluble in water. The use of this extremely safe compound for PV cells is not dangerous to humans or the environment.
It should be noted that when coal and gasoline are burned, 300 times the amount of this type of substance is released. Poly c-Si production is responsible for more than 30% of the impact on human health, followed by wafer cutting with about 25% and photovoltaic module production with about 20%. To reduce potential risks to the environment and human health during the use and recycling of PV modules, the possibility of reducing the content of hazardous substances in PV modules is being investigated. Some projections indicate that the content of lead (lead-free metallization pastes) and fluorine will decrease in the future [71,72].

3.4. Water Use

Despite the low water consumption of PV power plants during operation, manufacturing and disposing of PV modules and other system parts might still demand a significant quantity of water.
In addition to direct water consumption during PV module manufacturing, significant amounts of water are indirectly consumed by nuclear and fossil fuel power stations that generate the electricity used to make PV modules. Additionally significant is the use of purified water in the production of crystalline silicon and CdTe PV modules.
The amount of water required to clean the module during operation depends on the expected degree of soiling of the module (soling depend of module tilt, presence of birds etc.), the extent of natural cleaning by precipitation, and the frequency of cleaning. The location of the PV system in relation to local sources of air pollution must be considered. Local industrial pollution of the atmosphere and vehicular traffic can reduce the received radiation and also could have a significant soiling effect on the PV modules [73]. The amount of water required varies depending on the cleaning technologies available.
The use of repellent coatings on the glass of the module can reduce the accumulation of dust and dirt on the surface, which reduces the need for cleaning and water consumption, which can be important in some areas [74].
Therefore, the water consumption of PV systems should be evaluated based on their entire life cycle. When evaluating water consumption, a distinction is made between water withdrawal and water consumption. After being withdrawn from nature, a sizable portion of water is quickly returned to the same catchment region. In contrast, water that evaporates or is contained in products is consumed and is therefore no longer available in the catchment area under consideration.
The water consumption of European rooftop PV systems is 1.5 L/kWh and 0.25 L/kWh for electricity from mono-Si and CdTe PV systems, respectively. Life-cycle water withdrawals for mono-Si and CdTe PV systems are 7.2 L/kWh and 0.73 L/kWh, respectively. When the amount of water consumed is divided by the amount of water withdrawn, the proportion of water consumed is 20% for the energy generated by the mono-Si PV system and 34% for the CdTe PV system. About 70% of the total water withdrawal in the supply chain of mono-Si PV systems is used for cooling the silicon ingots and the produced silicon for electronic applications [75]. It is usually assumed that 5% of the cooling water volume is evaporated.
According to [2,3], the lifetime water consumption of PV power plants is lower than most other energy plants, ranging from 0.15 to 0.35 m3/MWh. For comparison, the water consumption of coal-fired power plants ranges from 1.0 to 5.4 m3/MWh, CSP consumes about 3.8 m3/MWh, nuclear power plants about 2.3 m3/MWh, biomass power plants 0.85 to 2.20 m3/MWh, geothermal power plants (binary) between 0.5 and 1.0 m3/MWh, while wind power plants have the lowest consumption of about 0.04 m3/MWh.

3.5. The Impact on Biodiversity

Little research has been conducted on the impact of solar farms on biodiversity. The construction of utility-scale photovoltaic plants and associated facilities usually requires the removal of vegetation and the leveling of large areas. This can result in habitat loss, degradation, and fragmentation, reducing species richness and density and displacing wildlife populations. Shadow effects from solar panels can alter the species composition and diversity of underlying habitats due to changes in air and soil microclimates.
Biodiversity impacts vary by geographic location and can be positive in certain circumstances. For example, in the UK, solar farms have been found to host a greater diversity of vegetation, invertebrates, and birds than the surrounding agricultural land or other brownfield sites where they are often located [76]. Solar farms performed significantly better than other types of power plants in terms of bird diversity and abundance. However, the greater number of birds near PV power plants leads to problems with contamination of panels by bird droppings. Large numbers of brown hares have also been observed in solar farms at several sites.
During the operation of PV power plants, vegetation on the power plant site is significantly lost or altered. Solar farms typically require some type of vegetation control under and in the gaps between solar panels and behind roads and power lines. Unwanted vegetation is sometimes controlled with herbicides or the ground is covered with gravel. In other cases, some type of vegetation cover is grown, but it is mowed frequently to keep it short.
In summary, solar farms can lead to greater diversity and abundance of broadleaf plants, grasses, butterflies, bumblebees, and birds. The extent of biodiversity benefits depends largely on how the area is managed. Areas of particular value to wildlife can be seeded with a variety of seed mixes after construction is complete to limit the use of herbicides. Providing good marginal wildlife habitat and using a conservation grazing or mowing system will have a positive impact.

3.6. Noise

Noise pollution is one of the environmental aspects that must be considered when installing a PV solar power plant. Like any other energy-generating or industrial facility, a solar plant must be designed and run in accordance with national and local noise regulations. Noise can be generated during the construction, operation, and maintenance phases of a PV system. The main sources of noise are the inverters, transformers, cooling fans, and trackers [3]. The noise level and frequency depend on the type, size, and location of the PV system.
PV cells generate direct current (DC). However, to transmit this current to the local power grid, the DC current must be converted to AC current (AC). This conversion is performed by an inverter. The conversion from direct current to alternating current is achieved by very fast switches that change polarity. Since the AC current changes 50 times per second (50 hz) for EU countries and 60 hz for the USA, the switches must be activated twice per electrical cycle. This process generates noise at twice the frequency of the electrical grid (100 hz) and its harmonics (200, 300 hz and higher) (for EU countries). Noise emissions from inverters can be reduced by a combination of shielding, noise cancellation, filtering, and noise suppression. Inverters and other equipment frequently have metal casings. Twisted pairs with shields are a well-known and efficient method of wiring. Filtering is a typical component of almost all electronics.
Electrical interference is a problem that can be encountered in solar system electronics. All digital electronic equipment produces at least some noise, including equipment in PV systems. The most common problems arise from charge controllers and many inverters (especially modified sine wave inverters). Almost all charge controllers charge batteries in pulses, and these high-power pulses are one of the worst sources of interference.
To facilitate transmission to the nearby power grid, the solar system uses transformers to raise the voltage. There are three sources of noise inside the transformer: core, coil and fan. The core and coil noise is caused by electromagnetic forces that occur twice during each cycle of AC. This results in a primary noise source of 100 hz. Quiet transformers and inverters are available, but because of the high cost, this is not usually a specification item that solar system designers want to consider. Therefore, the second option for noise lowering can be noise barriers.
Because of the heat generated by inverters and transformers, a forced ventilation system (fan) is almost always required. One advantage of solar panels is that most of them operate only during the day, when higher noise levels are acceptable.
The noise exposure from a PV solar power plant can be analyzed by measuring the sound pressure level (SPL) and the sound power level (SWL) of the system components and comparing them with the ambient noise level and regulatory standards. The SPL is the sound intensity at a specific point in space, while the SWL is the total sound energy radiated from a source. The SPL decreases with distance from the source, while the SWL remains constant. SPL and SWL are usually expressed in decibels (dB) or A-weighted decibels (dBA), which take into account human perception of sound frequency.
According to a study by Tawalbeh et al. [3], the average SPL of a PV inverter ranges from 40 to 70 dBA at 1 m distance, depending on the power and cooling method. The average SPL of a transformer is between 50 and 80 dBA at 1 m distance, depending on the size and type. The average SPL of a cooling fan is between 40 and 60 dBA at 1 m distance, depending on speed and type.

3.7. End of Life

Like many other durable products, PV systems can last for decades, especially if properly maintained. After about 30 years of operation, PV modules can, in some cases, be reused or refurbished to have a “second life” as power generators. Nevertheless, every PV system will one day reach the end of its useful life. While most end-of-life problems are due to weather damage and installation errors, some consumers and system operators choose to upgrade their panels before the warranty expires or take advantage of technical improvements. End-of-life management for PV solar system refers to the processes that take place when solar modules and all other systems components are retired. These processes include decommissioning, disassembly, and disposal or recycling of PV modules, inverters, and other components.
Both recycling and reuse have environmental and economic advantages over disposal in landfills or incinerators. Recycling can reduce the need for new materials and the associated energy consumption and emissions. This is particularly important given the fear of potential material shortages to achieve decarburization and electrification on a global scale [77,78,79,80,81]. Reuse involves reusing modules or parts of modules for other purposes, such as building materials, art projects, or educational materials [82]. In addition, both recycling and reuse can create new jobs and industries in the circular economy. However, it should be noted that module reuse generates more revenue with fewer processing steps, while recycling has many more processing steps and generates low revenue [83]. The biggest challenge for module reuse is finding a large and sustainable market for the large volume of modules that are being retired.
The prediction for 2050 states that the recoverable value could cumulatively exceed 2 billion modules or 630 GW [84]. According to Table 1, the average mass of the c-Si module is about 51.0 kg/kW. At the stated capacity of 630 GW, the mass of the module is 32.1 million tons. If we add the mass of the inverter and cables, the amount of waste is much higher. This can release an estimated 78 million tons of raw materials and other valuable components worldwide by 2050, which can ensure the sustainability of the long-term supply chain [85], increase the recovery of energy and embedded materials, and also reduce CO2 emissions and energy payback times associated with this industry.
PV waste as a percentage of new installations will increase from 0.1% in 2016 to over 80% in 2050, indicating a growing need for effective EOL solutions [84].
Recycling processes for all the different PV technologies are not yet well developed. Processes are well developed for mono- or poly c-Si, and a recycling process has been established for CdTe solar panels, but for other thin films, there is still room for improvement [82].
In the context of end-of-life environmental impacts, solar modules and inverters have the greatest importance. Therefore, the rest of the text analyzes the issue of their recycling and the impact on the environment during recycling. First, it is necessary to show the parts that make up a typical solar panel (Figure 3).
To get a complete picture of solar module recycling, information is needed on the type of material, quantity, and ratio of the individual components that make up the solar module (see Table 7).
After disassembly and extraction, the mass fraction of the various resources from a typical solar panel is as follows: glass 54.7%, Al 12.7%, adhesive sealant 10%, silicon 3.1%, and other 19.5% [87].
It should be noted that aluminum, which is used in metallizing pastes in addition to silver, has not yet been mentioned. In this context, it should be said that bifacial cells have much less backside aluminum, since the backside grid pattern requires only ≈25% of the corresponding monofacial cell with full-surface aluminum metallization. Approximately 750 mg of aluminum is required for a monofacial cell of 166 × 166 mm2 [44].
There are different methods to recycle solar panels, which can include some or all of the following steps [89]:
  • Removal of the frame and junction box;
  • Removing the encapsulant from the laminated structure;
  • Separation of the glass and silicon wafer by thermal, mechanical, or chemical processes;
  • Separation and purification of silicon cells and special metals (e.g., silver, tin, lead, copper, Al) by chemical and electrical processes.
From the preceding information, it can be concluded that the recycling process requires the use of a certain amount of mechanical, thermal, or electrical energy to separate the components of the module and that certain chemicals and water must be used, resulting in certain gas emissions. However, the incineration of certain parts that are not recycled not only releases a certain amount of energy but also harmful gases. The main problem in recycling PV modules is the removal of ethylene vinyl acetate (EVA) and the extraction of metals with minimal development of toxic gases and waste water [90].
Today, the recycling rate of PV modules is not precisely known because there is no global standard or regulation for PV module recycling, and different countries and regions may have different policies and practices. However, some estimates and examples can be found in the literature. One estimate is that the global average recycling rate of PV modules was about 14% in 2019 and that the global recycling rate of PV modules could reach 35% by 2030 and 70% by 2050, assuming a high recycling scenario [91].
The inverter is the second-most important part of the solar system. The recycling of inverters for PV power plants is a complex and challenging process that involves several technical, economic, and environmental aspects. One of the problems related to inverter recycling is the lack of standardized design and labeling of inverters, which makes it difficult to identify and separate the different components and materials.
Recycling inverters can help recover valuable materials such as copper, aluminum, steel, and plastics and reduce the environmental impact of mining and manufacturing new materials. Metals make up 60% of the weight of the inverter, and 90% of the metal is recyclable, while printed circuit boards (PCBs) make up 40% of the weight of the inverter, and 65% of PCBs are recyclable [92].
However, these estimates are based on some assumptions and uncertainties and may vary depending on the type and age of PV modules, the availability and cost of recycling facilities, and the demand and price of recycled materials.
Below is a summary of the main environmental impacts of recycling PV systems.

3.7.1. Land Use

The disposal of PV modules in landfills can occupy large areas of land and reduce its availability for other purposes. Landfilling can also cause soil contamination and the leaching of toxic substances from the PV materials, such as cadmium, lead, and selenium. Recycling can reduce the land use impact by recovering valuable materials and reducing the need for raw material extraction.

3.7.2. Water Use

The recycling of PV modules can require significant amounts of water for washing, rinsing, and separating the materials. Water use can affect the availability and quality of water resources, especially in water-scarce regions. Water use can be minimized by using closed-loop systems, water-efficient technologies, and alternative solvents.

3.7.3. Gas Emissions

The recycling or landfilling of PV modules can generate various types of pollution, such as gas emissions, wastewater effluents, solid wastes, and noise. Gas emissions include carbon dioxide, methane, nitrogen oxides, sulfur oxides, and volatile organic compounds. Particulate matter also occurs. Wastewater effluents can contain metals, acids, bases, organic solvents, and other pollutants.
The recycling or landfilling of PV modules can also affect the greenhouse gas emissions associated with the PV systems. Recycling can reduce emissions by saving energy and materials that would otherwise be required for producing new PV modules. Landfilling can increase emissions by releasing methane from the decomposition of organic materials in the PV modules. CO2 emissions from PV panel recycling depend on the type of panel and are relatively low compared to other end-of-life options. They can be further reduced if renewable electricity sources are used for recycling. Greenhouse gas emissions can be quantified by using life cycle assessment (LCA) methods that account for all the stages of PV systems.

3.7.4. Solid Wastes

Solid wastes can include glass, metals, plastics, and other materials that are not recovered or reused.

3.7.5. Hazardous Materials

The PV modules can contain hazardous materials that pose risks to human health and the environment if not handled properly. Some examples are cadmium telluride (CdTe), copper indium gallium selenide (CIGS), lead (Pb), and antimony (Sb). These materials can be toxic, carcinogenic, mutagenic, or teratogenic if ingested, inhaled, or absorbed through the skin. Hazardous materials can be avoided by using alternative materials or technologies that are less harmful or more recyclable.
PV panels typically contain lead, cadmium, and other toxic metals that can leach into the soil and water if they are landfilled or incinerated. These metals pose risks to the workers who handle the panels during recycling, especially if they are exposed to dust or fumes.

3.7.6. Noise Pollution

Noise can be generated by the transportation, crushing, shredding, and separation processes. Pollution can be reduced by using proper waste management practices pollution control technologies.

3.7.7. Challenges and Barriers in PV Recycling

In addition, we must note that there are certain challenges and problems with recycling PV modules. Some of them are:
  • The lack of a standardized and efficient collection system for PV modules. There is no global regulation or incentive for the owners of PV modules to return them to the recyclers. This leads to a low recycling rate and a high risk of illegal landfilling of PV modules.
  • Lack of recycling facilities and technologies.
  • Lack of market demand for recycled or reused PV modules.
  • Lack of awareness and education among stakeholders and consumers.
  • The complexity and diversity of PV module materials and designs. Each material has different properties and requires different recycling methods. This makes it difficult to separate and recover the valuable materials from the PV modules.
  • The high cost and low profitability of PV module recycling. The recycling process of PV modules is often labor-intensive, energy-consuming, and technically demanding. The cost of recycling may exceed the value of the recovered materials.
Several actions are recommended to overcome these barriers:
  • Develop and harmonize regulations and standards for the EOL treatment of PV modules.
  • Establish extended producer responsibility (EPR) systems that hold manufacturers accountable for the EOL management of their products.
  • Support research and development of innovative recycling and reuse technologies and methods.
  • Promote market development and value creation for recycled or reused PV modules
  • Raise public awareness of the benefits and opportunities of EOL management of PV modules.
  • Develop better technologies to improve PV panel recycling. Designing for Recycling, for example, is one such technology.
Through these actions, the global community can ensure that PV modules are not only a source of clean energy during their lifetime but also a source of value and sustainability after their retirement.

4. Conclusions

This paper analyzes the impact of PV power plants on the environment, taking into account the technological progress of PV power plant components as well as the existing and planned capacities of PV power plants until 2030, i.e., until 2050. Based on data from numerous studies in the literature and on the basis of our own calculations, we can conclude:
  • An average area of 4.53 km2/GW is required for the installation of rooftop PV power plants, and 19 km2/GW for large-scale power plants (Table 1 and Table 2). Based on the planned capacities for 2030 and the assumed share of rooftop PV power plants in these capacities, the required area in Europe and worldwide was calculated (Table 3).
  • Based on the data on the available area (rooftops and vacant land), it can be concluded that this area is much larger than needed and that there should be no problem reaching the planned PV power plant capacities.
  • Possible land use conflicts, e.g., with agriculture and forestry, should be considered.
  • There are large differences in the amount of CO2 emissions depending on where the PV system components are manufactured (greedy energy mix) [5], the type of modules (Table 4), and the lifetime of the PV power components.
  • In general, emissions range from 12.5 to 126 CO2 eq./kWh, which is far below fossil fuel power plant emissions but higher than emissions from other renewable energy plants
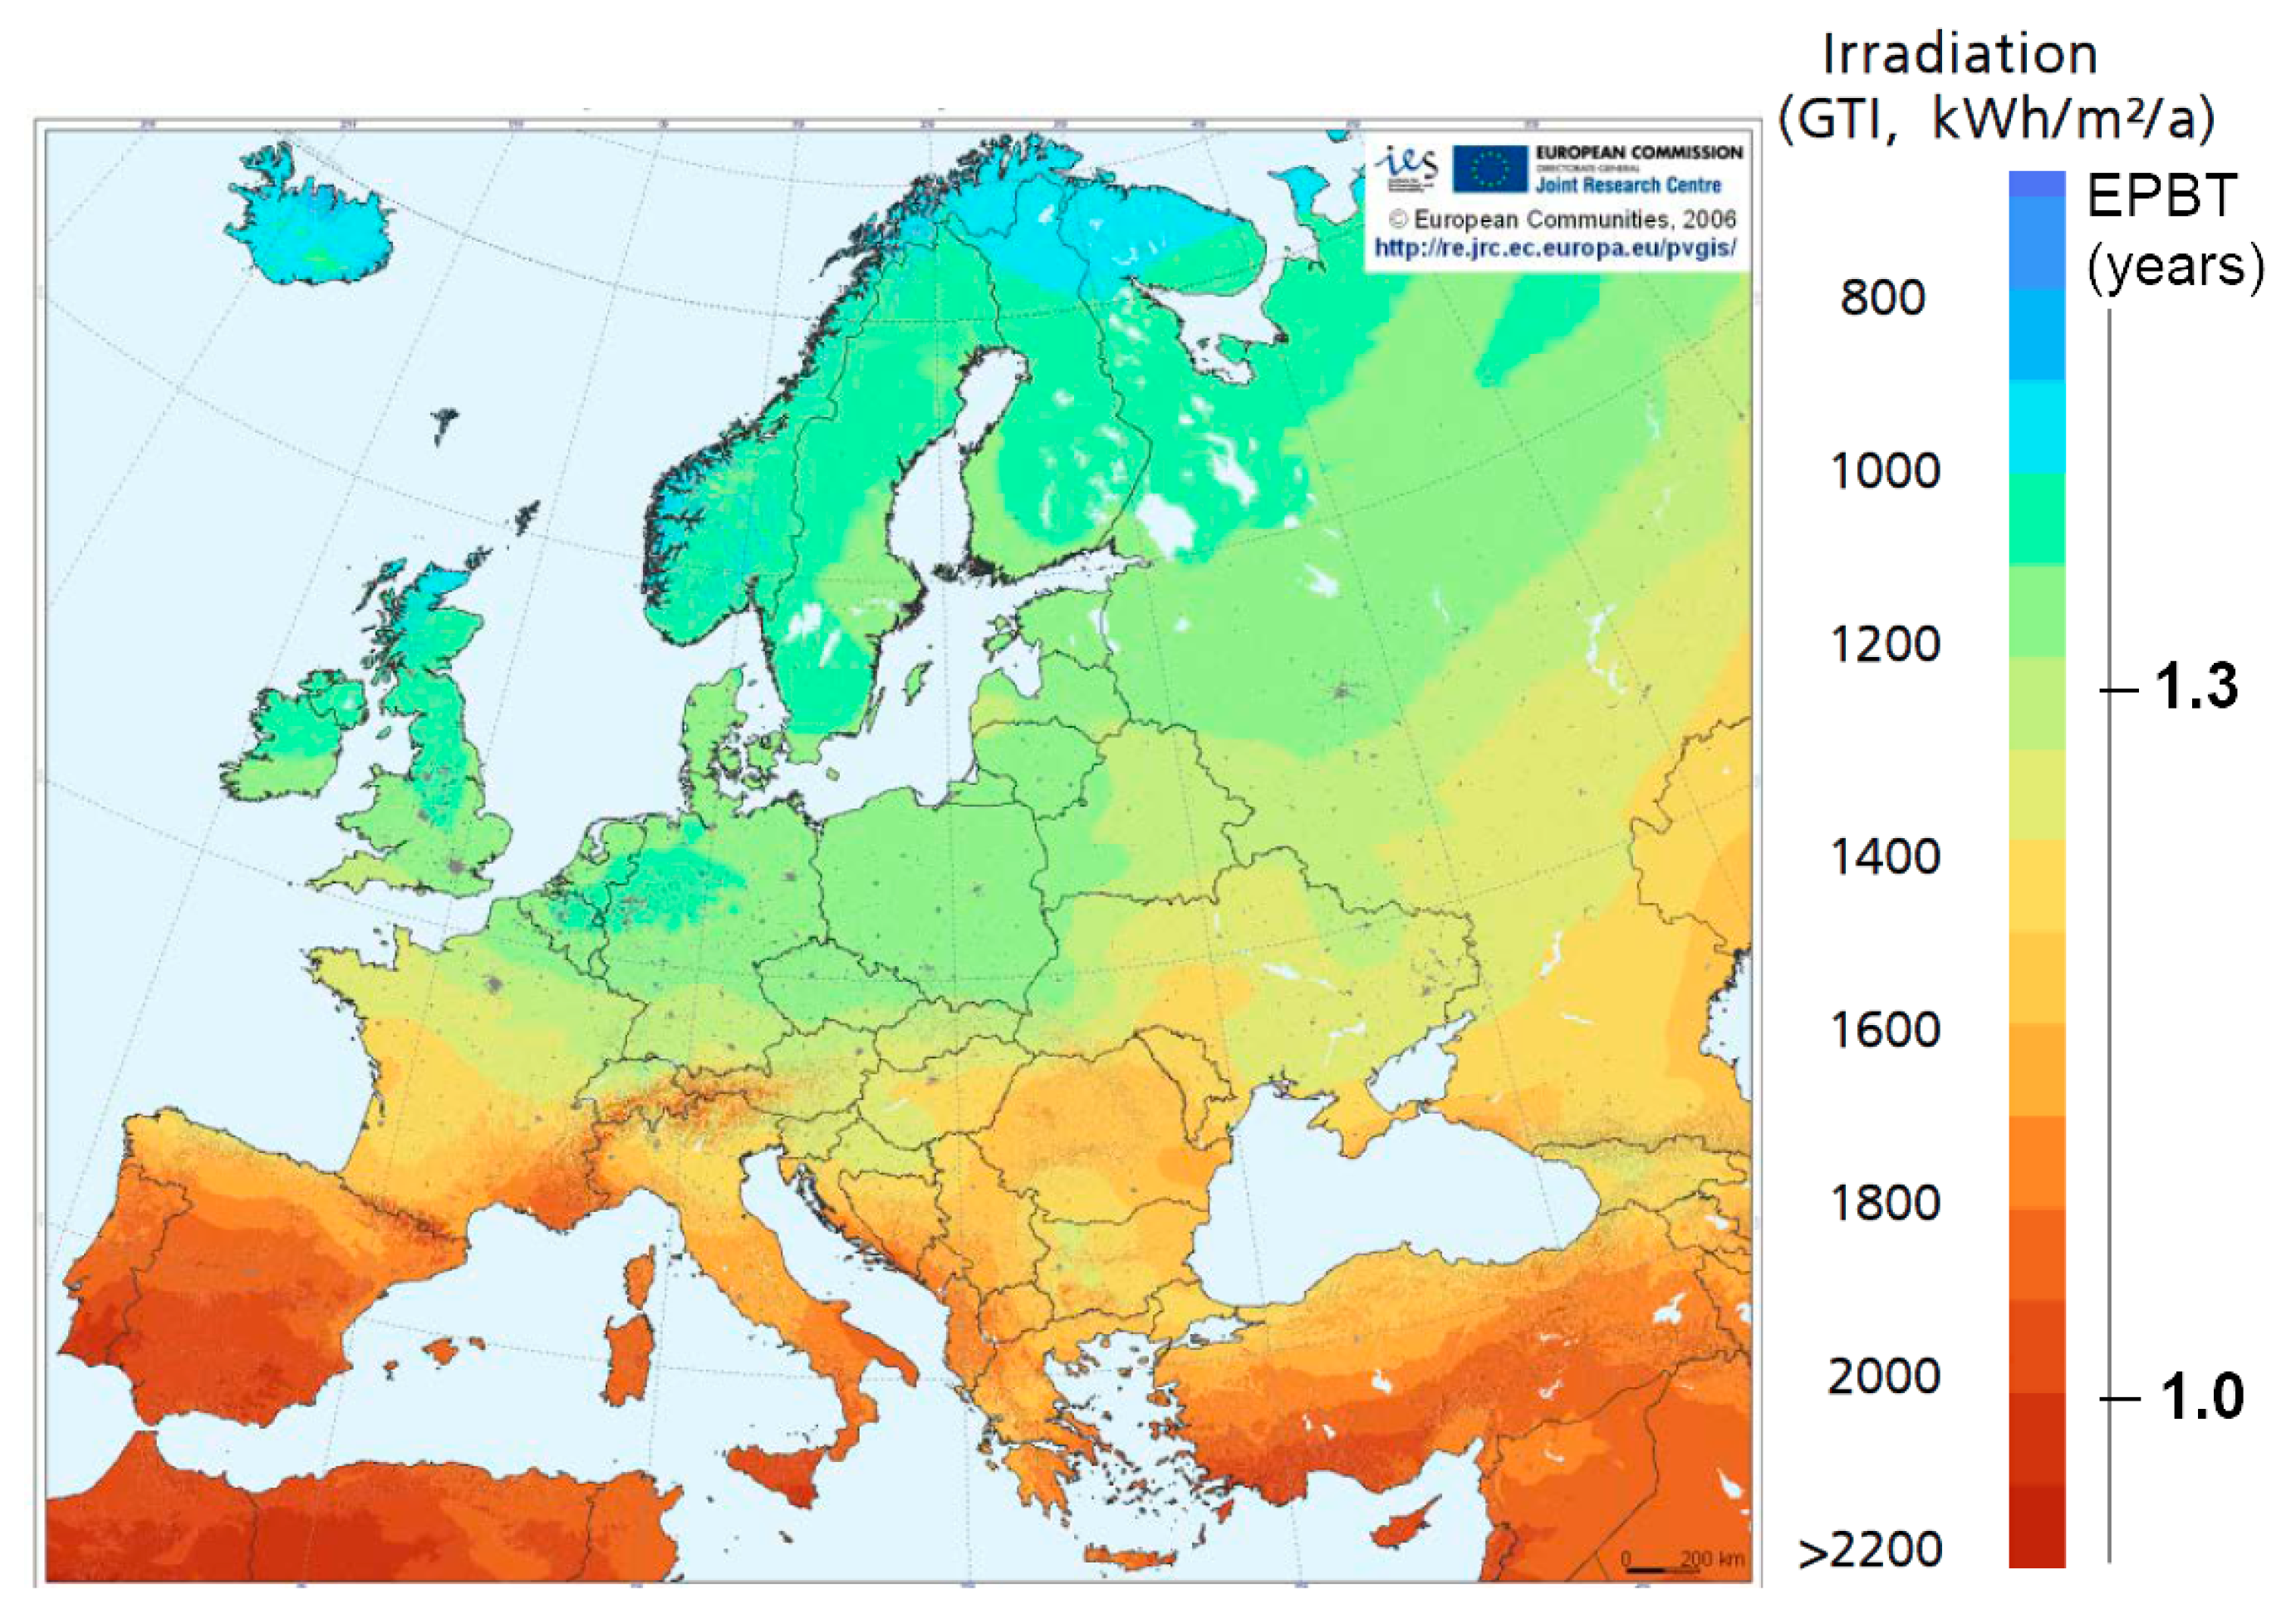
  • Most of the CO2 emissions come from the production phase of the PV system components, as this is an energy-intensive process. The energy payback time for Europe is between 1 and 2.5 years (Figure 2).
  • Hazardous substances (heavy metals) are also used in the production of PV system components. They can only pose a significant environmental problem if the modules are not recycled at the end of the power plant’s life but are landfilled, and in this way they can significantly pollute the soil and drinking water.
  • Water consumption in the life cycle of the PV power plant is not large and does not represent a significant problem; the same applies to noise emissions.
  • At the end of the life cycle, recycling can reduce the need for new materials and the associated energy consumption and emissions. This is particularly important given concerns about potential material shortages to achieve decarburization and electrification on a global scale.
  • The recycling process requires the use of a certain amount of mechanical, thermal, or electrical energy to separate the components of the module, and that certain chemicals and water must be used, resulting in certain gas emissions
  • The forecast for 2050 assumes a recyclable value of 630 GW of modules, which corresponds to a mass of 32.1 million tons of waste.
  • The recycling processes for the various PV technologies are not yet fully developed
  • After disassembly and extraction, the mass fraction of the various resources in a typical solar module breaks down as follows: Glass 54.7%, aluminum 12.7%, adhesive 10%, silicon 3.1%, and others 19.5%
  • The main problems in recycling modules are the removal of ethylene vinyl acetate and the extraction of metals with minimal development of toxic gases and effluents.
  • Globally, there are no regulations or incentives for owners of PV modules to return them to recyclers. This results in a low recycling rate and a high risk of illegal disposal of PV modules.
  • The big problem is the high cost and low profitability of recycling PV modules
The end-of-life of a photovoltaic system is an important aspect of its environmental impact that should not be ignored. By implementing appropriate waste management and recycling strategies and measures, the environmental impact at this stage can be minimized and the benefits of photovoltaic systems maximized.
In summary, PV energy is a clean energy source and its impact on air quality, soil, water, and climate change is significantly less than any other conventional power generation system.

Author Contributions

Conceptualization, M.B.; methodology, M.B.; software, Z.C.; validation, R.S.; formal analysis, T.B.; investigation, M.B.; resources, M.B.; data curation, R.S.; writing—original draft preparation, M.B.; writing—review and editing, M.B., Z.C. and T.B.; visualization, M.B. All authors have read and agreed to the published version of the manuscript.

Funding

This research received no external funding.

Institutional Review Board Statement

Not applicable.

Informed Consent Statement

Not applicable.

Data Availability Statement

Data is available on request.

Conflicts of Interest

The authors declare no conflict of interest.

References

  1. Hemeida, M.G.; Hemeida, A.M.; Senjyu, T.; Osheba, D. Renewable Energy Resources Technologies and Life Cycle Assessment: Review. Energies 2022, 15, 9417. [Google Scholar] [CrossRef]
  2. Bošnjaković, M.; Tadijanović, V. Environment Impact of a Concentrated Solar Power Plant. Teh. Bull. 2019, 13, 68–74. [Google Scholar] [CrossRef] [Green Version]
  3. Tawalbeh, M.; Al-Othman, A.; Kafiah, F.; Abdelsalam, E.; Almomani, F.; Alkasrawi, M. Environmental Impacts of Solar Photovoltaic Systems: A Critical Review of Recent Progress and Future Outlook. Sci. Total Environ. 2021, 759, 143528. [Google Scholar] [CrossRef]
  4. Louwen, A.; Van Sark, W.G.J.H.M.; Faaij, A.P.C.; Schropp, R.E.I. Re-Assessment of Net Energy Production and Greenhouse Gas Emissions Avoidance after 40 Years of Photovoltaics Development. Nat. Commun. 2016, 7, 13728. [Google Scholar] [CrossRef] [PubMed] [Green Version]
  5. Reichel, C.; Müller, A.; Friedrich, L.; Herceg, S.; Mittag, M.; Protti, A.; Neuhaus, D.H. CO2 Emissions of Silicon Photovoltaic Modules—Impact of Module Design and Production Location. In Proceedings of the 8th World Conference on Photovoltaic Energy Conversion, Milan, Italy, 26–30 September 2022; EU PVSEC: Milano, Italy, 2022; pp. 1617–1619. [Google Scholar]
  6. Liu, F.; van den Bergh, J.C.J.M. Differences in CO2 Emissions of Solar PV Production among Technologies and Regions: Application to China, EU and USA. Energy Policy 2020, 138, 111234. [Google Scholar] [CrossRef]
  7. Biswas, A.; Husain, D.; Prakash, R. Life-Cycle Ecological Footprint Assessment of Grid-Connected Rooftop Solar PV System. Int. J. Sustain. Eng. 2021, 14, 529–538. [Google Scholar] [CrossRef]
  8. van de Ven, D.J.; Capellan-Peréz, I.; Arto, I.; Cazcarro, I.; de Castro, C.; Patel, P.; Gonzalez-Eguino, M. The Potential Land Requirements and Related Land Use Change Emissions of Solar Energy. Sci. Rep. 2021, 11, 2907. [Google Scholar] [CrossRef]
  9. Vyas, M.; Chowdhury, S.; Verma, A.; Jain, V.K. Solar Photovoltaic Tree: Urban PV Power Plants to Increase Power to Land Occupancy Ratio. Renew. Energy 2022, 190, 283–293. [Google Scholar] [CrossRef]
  10. Bolinger, M.; Bolinger, G. Land Requirements for Utility-Scale PV: An Empirical Update on Power and Energy Density. IEEE J. Photovolt. 2022, 12, 589–594. [Google Scholar] [CrossRef]
  11. Shum, R.Y. A Comparison of Land-Use Requirements in Solar-Based Decarbonization Scenarios. Energy Policy 2017, 109, 460–462. [Google Scholar] [CrossRef]
  12. Wang, P.; Zhang, S.; Pu, Y.; Cao, S.; Zhang, Y. Estimation of Photovoltaic Power Generation Potential in 2020 and 2030 Using Land Resource Changes: An Empirical Study from China. Energy 2021, 219, 119611. [Google Scholar] [CrossRef]
  13. Trondle, T. Supply-Side Options to Reduce Land Requirements of Fully Renewable Electricity in Europe. PLoS ONE 2020, 15, e0236958. [Google Scholar] [CrossRef] [PubMed]
  14. Sukumaran, S.; Sudhakar, K.; Yusop, A.F.; Kirpichnikova, I.; Cuce, E. Solar Farm: Siting, Design and Land Footprint Analysis. Int. J. Low-Carbon Technol. 2022, 17, 1478–1491. [Google Scholar] [CrossRef]
  15. Giri, N.C.; Mohanty, R.C.; Mishra, S.P. Smart Shift from Photovoltaic to Agrivoltaic System for Land-Use Footprint. Ambient Sci. 2021, 8, 12–18. [Google Scholar] [CrossRef]
  16. Zhang, H.; Yu, Z.; Zhu, C.; Yang, R.; Yan, B.; Jiang, G. Green or Not? Environmental Challenges from Photovoltaic Technology. Environ. Pollut. 2023, 320, 121066. [Google Scholar] [CrossRef]
  17. Nain, P.; Kumar, A. Metal Dissolution from End-of-Life Solar Photovoltaics in Real Landfill Leachate versus Synthetic Solutions: One-Year Study. Waste Manag. 2020, 114, 351–361. [Google Scholar] [CrossRef]
  18. Kwak, J.I.; Nam, S.H.; Kim, L.; An, Y.J. Potential Environmental Risk of Solar Cells: Current Knowledge and Future Challenges. J. Hazard. Mater. 2020, 392, 122297. [Google Scholar] [CrossRef]
  19. Bakhiyi, B.; Labrèche, F.; Zayed, J. The Photovoltaic Industry on the Path to a Sustainable Future—Environmental and Occupational Health Issues. Environ. Int. 2014, 73, 224–234. [Google Scholar] [CrossRef]
  20. Piasecka, I.; Bałdowska-witos, P.; Piotrowska, K.; Tomporowski, A. Eco-Energetical Life Cycle Assessment of Materials. Energies 2020, 13, 1385. [Google Scholar] [CrossRef] [Green Version]
  21. Stamford, L.; Azapagic, A. Environmental Impacts of Photovoltaics: The Effects of Technological Improvements and Transfer of Manufacturing from Europe to China. Energy Technol. 2018, 6, 1148–1160. [Google Scholar] [CrossRef] [Green Version]
  22. Roy, S.; Ghosh, B. Land Utilization Performance of Ground Mounted Photovoltaic Power Plants: A Case Study. Renew. Energy 2017, 114, 1238–1246. [Google Scholar] [CrossRef]
  23. Farrell, C.C.; Osman, A.I.; Doherty, R.; Saad, M.; Zhang, X.; Murphy, A.; Harrison, J.; Vennard, A.S.M.; Kumaravel, V.; Al-Muhtaseb, A.H.; et al. Technical Challenges and Opportunities in Realising a Circular Economy for Waste Photovoltaic Modules. Renew. Sustain. Energy Rev. 2020, 128, 109911. [Google Scholar] [CrossRef]
  24. Sica, D.; Malandrino, O.; Supino, S.; Testa, M.; Lucchetti, M.C. Management of End-of-Life Photovoltaic Panels as a Step towards a Circular Economy. Renew. Sustain. Energy Rev. 2018, 82, 2934–2945. [Google Scholar] [CrossRef]
  25. Tao, J.; Yu, S. Review on Feasible Recycling Pathways and Technologies of Solar Photovoltaic Modules. Sol. Energy Mater. Sol. Cells 2015, 141, 108–124. [Google Scholar] [CrossRef]
  26. Teknetzi, I.; Holgersson, S.; Ebin, B. Valuable Metal Recycling from Thin Film CIGS Solar Cells by Leaching under Mild Conditions. Sol. Energy Mater. Sol. Cells 2023, 252, 112178. [Google Scholar] [CrossRef]
  27. Gahlot, R.; Mir, S.; Dhawan, N. Recycling of Discarded Photovoltaic Solar Modules for Metal Recovery: A Review and Outlook for the Future. Energy Fuels 2022, 36, 14554–14572. [Google Scholar] [CrossRef]
  28. Peplow, M. Solar Panels Face Recycling Challenge. ACS Cent. Sci. 2022, 8, 299–302. [Google Scholar] [CrossRef] [PubMed]
  29. Wang, T.-Y. Recycling of Solar Cell Materials at the End of Life. In Advances in Solar Photovoltaic Power Plants; Islam, M.R., Rahman, F., Xu, W., Eds.; Springer: Berlin/Heidelberg, Germany, 2016; pp. 287–317. ISBN 978-3-662-50521-2. [Google Scholar]
  30. Dias, P.; Veit, H. Recycling Crystalline Silicon Photovoltaic Modules. In Emerging Photovoltaic Materials Silicon & Beyond; John Wiley & Sons: Hoboken, NJ, USA, 2018; pp. 61–102. [Google Scholar] [CrossRef]
  31. Dias, P.R.; Schmidt, L.; Chang, N.L.; Monteiro Lunardi, M.; Deng, R.; Trigger, B.; Bonan Gomes, L.; Egan, R.; Veit, H. High Yield, Low Cost, Environmentally Friendly Process to Recycle Silicon Solar Panels: Technical, Economic and Environmental Feasibility Assessment. Renew. Sustain. Energy Rev. 2022, 169, 112900. [Google Scholar] [CrossRef]
  32. D’Adamo, I.; Ferella, F.; Gastaldi, M.; Ippolito, N.M.; Rosa, P. Circular Solar: Evaluating the Profitability of a Photovoltaic Panel Recycling Plant. Waste Manag. Res. J. Int. Solid Wastes Public Clean. Assoc. ISWA 2023, 41, 1144–1154. [Google Scholar] [CrossRef]
  33. Isherwood, P.J.M. Reshaping the Module: The Path to Comprehensive Photovoltaic Panel Recycling. Sustainability 2022, 14, 1676. [Google Scholar] [CrossRef]
  34. Brunet, C.; Savadogo, O.; Baptiste, P.; Bouchard, M.A.; Rakotoary, J.C.; Ravoninjatovo, A.; Cholez, C.; Gendron, C.; Merveille, N. Impacts Generated by a Large-Scale Solar Photovoltaic Power Plant Can Lead to Conflicts between Sustainable Development Goals: A Review of Key Lessons Learned in Madagascar. Sustainability 2020, 12, 7471. [Google Scholar] [CrossRef]
  35. Bala Subramaniyan, A.; Pan, R.; Kuitche, J.; TamizhMani, G. Quantification of Environmental Effects on PV Module Degradation: A Physics-Based Data-Driven Modeling Method. IEEE J. Photovolt. 2018, 8, 1289–1296. [Google Scholar] [CrossRef]
  36. Jathar, L.D.; Ganesan, S.; Awasarmol, U.; Nikam, K.; Shahapurkar, K.; Soudagar, M.E.M.; Fayaz, H.; El-Shafay, A.S.; Kalam, M.A.; Bouadila, S.; et al. Comprehensive Review of Environmental Factors Influencing the Performance of Photovoltaic Panels: Concern over Emissions at Various Phases throughout the Lifecycle. Environ. Pollut. 2023, 326, 121474. [Google Scholar] [CrossRef]
  37. Pouran, H.M.; Padilha Campos Lopes, M.; Nogueira, T.; Alves Castelo Branco, D.; Sheng, Y. Environmental and Technical Impacts of Floating Photovoltaic Plants as an Emerging Clean Energy Technology. iScience 2022, 25, 105253. [Google Scholar] [CrossRef]
  38. Haas, J.; Khalighi, J.; de la Fuente, A.; Gerbersdorf, S.U.; Nowak, W.; Chen, P.-J. Floating Photovoltaic Plants: Ecological Impacts versus Hydropower Operation Flexibility. Energy Convers. Manag. 2020, 206, 112414. [Google Scholar] [CrossRef]
  39. Allouhi, A.; Rehman, S.; Buker, M.S.; Said, Z. Up-to-Date Literature Review on Solar PV Systems: Technology Progress, Market Status and R&D. J. Clean. Prod. 2022, 362, 132339. [Google Scholar] [CrossRef]
  40. Ismael, S.M.; Abdel Aleem, S.H.E.; Abdelaziz, A.Y.; Zobaa, A.F. State-of-the-Art of Hosting Capacity in Modern Power Systems with Distributed Generation. Renew. Energy 2019, 130, 1002–1020. [Google Scholar] [CrossRef]
  41. Ding, F.; Horowitz, K.; Mather, B.; Palmintier, B. Sequential Mitigation Solutions to Enable Distributed PV Grid Integration. In Proceedings of the 2018 IEEE Power & Energy Society General Meeting (PESGM), Portland, OR, USA, 5–10 August 2018; pp. 1–5. [Google Scholar]
  42. Wang, W.; Thom, D.; Sedzro, K.S.; Abraham, S.A.; Yao, Y.; Gu, J.; Ghosh, S. PV Hosting Capacity Estimation: Experiences with Scalable Framework. In Proceedings of the 2022 IEEE 49th Photovoltaics Specialists Conference (PVSC), Philadelphia, PA, USA, 5–10 June 2022; pp. 967–971. [Google Scholar]
  43. Hou, G.; Sun, H.; Jiang, Z.; Pan, Z.; Wang, Y.; Zhang, X.; Zhao, Y.; Yao, Q. Life Cycle Assessment of Grid-Connected Photovoltaic Power Generation from Crystalline Silicon Solar Modules in China. Appl. Energy 2016, 164, 882–890. [Google Scholar] [CrossRef]
  44. ITRPV. International Technology Roadmap for Photovoltaic; ITRPV: Frankfurt am Main, Germany, 2022; Volume 14. [Google Scholar]
  45. International Energy Agency (IEA). Net Zero by 2050: A Roadmap for the Global Energy Sector; International Energy Agency: Paris, France, 2021; Volume 224. [Google Scholar]
  46. European Commission (EU). Solar Energy Strategy; COM(2022) 221 Final; European Commission: Brussels, Belgium, 2022; pp. 1–21. [Google Scholar]
  47. Abdelilah, Y.; Bahar, H.; Criswell, T.; Feuvre, P.B.; Briens, F.; Pharoah, L.F. Renewables 2020—Analysis and Forecast to 2025; International Energy Agency: Paris, France, 2020. [Google Scholar]
  48. IFC. A Project Developer’s Guide to Utility-Scale Solar Photovoltaic Power Plants; Lumby, B., Ed.; International Finance Corporation: Washington, DC, USA, 2015. [Google Scholar]
  49. HEP Group. Unintegrated Solar Power Plants. Available online: https://www.hep.hr/projects/renewable-energy-sources/unintegrated-solar-power-plants/3423 (accessed on 13 June 2023).
  50. Power-technology.com. Nunez de Balboa Solar Project, Badajoz. Available online: https://www.power-technology.com/projects/nunez-de-balboa-solar-project-badajoz/ (accessed on 15 June 2023).
  51. Chatzipanagi, A.; Jaeger-Waldau, A.; Cleret de Langavant, C.; Letout, S.; Latunussa, C.; Mountraki, A.; Georgakaki, A.; Ince, E.; Kuokkanen, A.; Shtjefni, D. Photovoltaics in the European Union—2022 Status Report on Technology Development, Trends, Value Chains and Markets; Final Report; Publications Office of the European Union: Luxembourg, 2022; pp. 1–89. ISBN 978-92-76-57573-3. JRC130720. [Google Scholar] [CrossRef]
  52. Bódis, K.; Kougias, I.; Jäger-Waldau, A.; Taylor, N.; Szabó, S. A High-Resolution Geospatial Assessment of the Rooftop Solar Photovoltaic Potential in the European Union. Renew. Sustain. Energy Rev. 2019, 114, 109309. [Google Scholar] [CrossRef]
  53. Kumar, A.; Joshi, J.B.; Nayak, A.K.; Vijayan, P.K. A Review on the Thermal Hydraulic Characteristics of the Air-Cooled Heat Exchangers in Forced Convection. Sadhana—Acad. Proc. Eng. Sci. 2015, 40, 673–755. [Google Scholar] [CrossRef]
  54. RICS. Energy Efficiency of the Building Stock in the EU. Available online: https://www.rics.org/news-insights/energy-efficiency-of-the-building-stock-in-the-eu (accessed on 20 June 2023).
  55. Bošnjaković, M.; Katinić, M.; Čikić, A.; Muhič, S. Building Integrated Photovoltaics: Overview of Barriers and Opportunities. Therm. Sci. 2023, 27, 1433–1451. [Google Scholar] [CrossRef]
  56. Fritsche, U.R.; Berndes, G.; Cowie, A.L.; Johnson, F.X.; Dale, V.H.; Kline, K.L. Energy and Land Use; UNCCD and IRENA: Abu Dhabi, United Arab Emirates, 2017. [Google Scholar]
  57. Abuzaid, H.; Samara, F. Environmental and Economic Impact Assessments of a Photovoltaic Rooftop System in the United Arab Emirates. Energies 2022, 15, 8765. [Google Scholar] [CrossRef]
  58. Silva, M.; Raadal, H.L. Life Cycle GHG Emissions of Renewable and Non-Renewable Electricity Generation Technologies Part of the RE-Invest Project; Aalborg University: Aalborg, Denmark, 2019; ISBN 978-82-7520-806-2. [Google Scholar]
  59. Fthenakis, V.M.; Kim, H.C.; Alsema, E. Emissions from Photovoltaic Life Cycles. Environ. Sci. Technol. 2008, 42, 2168–2174. [Google Scholar] [CrossRef] [PubMed] [Green Version]
  60. Sherwani, A.F.; Usmani, J.A. Varun Life Cycle Assessment of Solar PV Based Electricity Generation Systems: A Review. Renew. Sustain. Energy Rev. 2010, 14, 540–544. [Google Scholar] [CrossRef]
  61. Bojek, P. Solar PV—Tracking Report—September 2022; IEA: Paris, France, 2022. [Google Scholar]
  62. Fraunhofer Institute for Solar Energy Systems ISE. Photovoltaics Report; Fraunhofer Institute for Solar Energy Systems: Freiburg, Germany, 2023; pp. 1–53. [Google Scholar]
  63. Chen, W.; Hong, J.; Yuan, X.; Liu, J. Environmental Impact Assessment of Monocrystalline Silicon Solar Photovoltaic Cell Production: A Case Study in China. J. Clean. Prod. 2016, 112, 1025–1032. [Google Scholar] [CrossRef]
  64. Fthenakis, V.M.; Kim, H.C. Photovoltaics: Life-Cycle Analyses. Sol. Energy 2011, 85, 1609–1628. [Google Scholar] [CrossRef]
  65. Polverini, D.; Espinosa, N.; Eynard, U.; Leccisi, E.; Ardente, F.; Mathieux, F. Assessing the Carbon Footprint of Photovoltaic Modules through the EU Ecodesign Directive. Solar Energy 2023, 257, 1–9. [Google Scholar] [CrossRef]
  66. Brüstle, F. Carbon Footprint Optimization for a Large-Scale PV on-Grid System in Borlänge, Sweden; Dalarna University: Falun, Sweden, 2022. [Google Scholar]
  67. International Energy Agency. Snapshot of Global PV Markets 2023 Task 1 Strategic PV Analysis and Outreach PVPS; IEA: Paris, France, 2023. [Google Scholar]
  68. International Energy Agency. CO2 Emissions in 2022; IEA: Paris, France, 2022. [Google Scholar]
  69. Hamed, T.A.; Alshare, A. Environmental Impact of Solar and Wind Energy—A Review. J. Sustain. Dev. Energy Water Environ. Syst. 2022, 10, 1–23. [Google Scholar] [CrossRef]
  70. Philipps, S.; Warmuth, W. Photovoltaics Report (Updated 24 February 2022); Fraunhofer Institute for Solar Energy Systems ISE: Freiburg, Germany, 2022; pp. 1–52. [Google Scholar]
  71. Norgren, A.; Carpenter, A.; Heath, G. Design for Recycling Principles Applicable to Selected Clean Energy Technologies: Crystalline-Silicon Photovoltaic Modules, Electric Vehicle Batteries, and Wind Turbine Blades. J. Sustain. Metall. 2020, 6, 761–774. [Google Scholar] [CrossRef]
  72. ITRPV. International Technology Roadmap for Photovoltaic (ITRPV)—Results 2018; ITRPV: Frankfurt am Main, Germany, 2019. [Google Scholar]
  73. Bošnjaković, M.; Stojkov, M.; Zlatunić, B. Experimental Testing of PV Module Performance. Tech. Bull. 2021, 15, 127–132. [Google Scholar] [CrossRef]
  74. Hossain, M.I.; Ali, A.; Bermudez Benito, V.; Figgis, B.; Aïssa, B. Anti-Soiling Coatings for Enhancement of PV Panel Performance in Desert Environment: A Critical Review and Market Overview. Materials 2022, 15, 7139. [Google Scholar] [CrossRef] [PubMed]
  75. Stolz, P.; Frischknecht, R.; Heath, G.; Komoto, K.; Macknick, J.; Sinha, P.; Wade, A. Water Footprint of European Rooftop Photovoltaic Electricity Based on Regionalised Life Cycle Inventories; Clarkson and Woods and Wychwood Biodiversity: Blackford, UK, 2017. [Google Scholar]
  76. Montag, H.; Parker, G.; Clarkson, T. The Effects of Solar Farms on Local Biodiversity: A Comparative Study; Clarkson and Woods and Wychwood Biodiversity: Blackford, UK, 2016; ISBN 9781526202239. [Google Scholar]
  77. Heidari, S.M.; Anctil, A. Material Requirement and Resource Availability for Silicon Photovoltaic Laminate Manufacturing in the Next 10 Years. In Proceedings of the 2021 IEEE 48th Photovoltaic Specialists Conference (PVSC), Lauderdale, FL, USA, 20–25 June 2021; pp. 1768–1772. [Google Scholar]
  78. Gervais, E.; Shammugam, S.; Friedrich, L.; Schlegl, T. Raw Material Needs for the Large-Scale Deployment of Photovoltaics—Effects of Innovation-Driven Roadmaps on Material Constraints until 2050. Renew. Sustain. Energy Rev. 2021, 137, 110589. [Google Scholar] [CrossRef]
  79. IEA. The Role of Critical Minerals in Clean Energy Transitions; IEA: Paris, France, 2021. [Google Scholar]
  80. Burrows, K.; Fthenakis, V. Glass Needs for a Growing Photovoltaics Industry. Sol. Energy Mater. Sol. Cells 2015, 132, 455–459. [Google Scholar] [CrossRef]
  81. Mirletz, H.; Ovaitt, S.; Sridhar, S.; Barnes, T.M. Circular Economy Priorities for Photovoltaics in the Energy Transition. PLoS ONE 2022, 17, e0274351. [Google Scholar] [CrossRef] [PubMed]
  82. Lunardi, M.M.; Alvarez-Gaitan, J.P.; Bilbao, J.I.; Corkish, R. A Review of Recycling Processes for Photovoltaic Modules. In Solar Panels and Photovoltaic Materials; Zaidi, B., Ed.; IntechOpen: Rijeka, Croatia, 2018. [Google Scholar]
  83. Tao, M.; Fthenakis, V.; Ebin, B.; Steenari, B.-M.; Butler, E.; Sinha, P.; Corkish, R.; Wambach, K.; Simon, E.S. Major Challenges and Opportunities in Silicon Solar Module Recycling. Prog. Photovolt. Res. Appl. 2020, 28, 1077–1088. [Google Scholar] [CrossRef]
  84. Weckend, S.; Wade, A.; Heath, G. End-Of-Life Management: Solar Photovoltaic Panels; IRENA and IEA-PVPS: Abu Dhabi, United Arab Emirates, 2016. [Google Scholar]
  85. Bustamante, M.L.; Gaustad, G. Challenges in Assessment of Clean Energy Supply-Chains Based on Byproduct Minerals: A Case Study of Tellurium Use in Thin Film Photovoltaics. Appl. Energy 2014, 123, 397–414. [Google Scholar] [CrossRef]
  86. U.S. Environmental Protection Agency (EPA). Solar Panel Recycling. Available online: https://www.epa.gov/hw/solar-panel-recycling (accessed on 12 June 2023).
  87. Xu, Y.; Li, J.; Tan, Q.; Peters, A.L.; Yang, C. Global Status of Recycling Waste Solar Panels: A Review. Waste Manag. 2018, 75, 450–458. [Google Scholar] [CrossRef]
  88. Ziemińska-stolarska, A.; Pietrzak, M.; Zbiciński, I. Application of LCA to Determine Environmental Impact of Concentrated Photovoltaic Solar Panels—State-of-the-Art. Energies 2021, 14, 3143. [Google Scholar] [CrossRef]
  89. Chowdhury, M.S.; Rahman, K.S.; Chowdhury, T.; Nuthammachot, N.; Techato, K.; Akhtaruzzaman, M.; Tiong, S.K.; Sopian, K.; Amin, N. An Overview of Solar Photovoltaic Panels’ End-of-Life Material Recycling. Energy Strategy Rev. 2020, 27, 100431. [Google Scholar] [CrossRef]
  90. Trivedi, H.; Meshram, A.; Gupta, R. Recycling of Photovoltaic Modules for Recovery and Repurposing of Materials. J. Environ. Chem. Eng. 2023, 11, 109501. [Google Scholar] [CrossRef]
  91. Divya, A.; Adish, T.; Kaustubh, P.; Zade, P.S. Review on Recycling of Solar Modules/Panels. Sol. Energy Mater. Sol. Cells 2023, 253, 112151. [Google Scholar] [CrossRef]
  92. Huawei Technologies Co., Ltd. Solar Inverter—Product Carbon Footprint Report. Available online: https://ske-solar.com/wp-content/uploads/2021/01/Zertifikat-Product-Carbon-Footprint-Report-für-Huawei-SUN2000-12KTL-M0-Wechselrichter.pdf (accessed on 15 June 2023).
Figure 1. CO2 eq./kWh emissions from PV power [58].
Sustainability 15 11888 g001
Figure 2. The energy payback period of the PV solar system sin Europe [70]. (Data: Lorenz Friedrich, Fraunhofer ISE. Image: JRC European Commission. Graph: PSE 2020 (Modified scale with updated data from Fraunhofer ISE).
Sustainability 15 11888 g002
Figure 3. Assembly view of Solar PV module [86].
Sustainability 15 11888 g003
Table 1. Required net land area for rooftop PV power plants.
CompanySolar Panel ModelPower (W)Hight
(m)
Width
(m)
Area (m2)Area (m2/kW)Weight
(kg/kW)
JinkoTiger Neo N-type 72HL45752.2781.1342.584.4948.7
LongiHI-MO-55502.2561.1332.564.6558.7
Q CellsQ.tron G1+ Series3951.7171.0451.794.5450.4
JA Solar72-cell MBB Half-cell Module5652.2781.1342.584.5755,9
AIKOAIKO-A-MAH72Mb6152.2781.1342.584.2045.9
SOLVISSV144 E HC9B4552.0941.0382.624.6354.9
Project SolarEvolution Titan 4454151.7241.1341.964.7148.2
RISENRSM108-9-415N-440N4401.7221.1341.954.4450.0
REC SolarAlpha Pure-R4201.7291.1181.934.6051.2
SunpowerMAXEON 6 AC4351.8721.0321.934.4450.1
Average 4922.0081.1122.264.5351.0
Table 2. Required land area for utility-scale PV power plants.
PV Power Plant Capacity,
Year of Start of Work
Required Land Area (km2/GW)Source
PV < 10 kW13Tawalbeth [3]
PV < 10 MW22Tawalbeth [3]
PV > 100 MW25–32Tawalbeth [3]
1 MW10–20IFC [48]
Examples of installed utility-scale PV power plants:
PV power plant Kaštelir 2, Croatia, 2 MW, 202120HEP Group [49]
PV power plant Marići, Croaria, 1 MW, 202118HEP Group [49]
PV power plant Stankovci, Croatia, 2.5 MW, 202226HEP Group [49]
PV power plant Obrovac, Croatia, 8.7 MW, 202213HEP Group [49]
PV power plant Nunez de Balboa, Spain, 202020Iberdrola [50]
Table 3. Required area for rooftop and utility scale PV power until 2030.
EuropeGlobal
TotalRooftopUtility ScaleTotalRooftopUtility Scale
Planned capacity (GW)600282318440018042596
Share (%)100%47%53%100%41%59%
Area (km2/GW) 519 519
Required area (km2)74521410604258,344902049,324
Table 4. Required area for different power plants [56].
Power Plant TypeRequired Area (m2/MWh)
PV power plant0.3–15
Solar concentrated (CSP)7.8–19
Coal-fired power plants0.2–5.1
Wind turbine power plants0.3–1.3
Nuclear power plants0.1–1.0
Natural gas power plants0.1–1.0
Hydropower plants3.3–16.9
Power plants on oil derivatives0.1–0.6
Biomass power plant (from crops)450
Table 5. Carbon footprint for different PV technologies [65].
PV TechnologiesLife Cycle Excl. Use StageUse StageTotal
(gCO2 eq/kWh)(gCO2 eq/kWh)(gCO2 eq/kWh)
Micromorphous silicon 43.00.01543.02
Polycrystalline silicon 48.80.01048.81
Monocrystalline silicon 80.40.01080.41
CdTe 19.90.01119.91
CIGS 35.90.01435.91
Table 6. Carbon footprint g CO2 eq./kWh for components of PV system [66].
PV System PartMin.Max.Median
PV module9.1314.411.6
Mounting structure1.497.661.71
Inverter0.391.110.69
Cabling0.040.050.04
Total11.123.314.0
Table 7. Composition of c-Si solar panels [87,88].
Component/MaterialContent (kg/kWp)Share in Panel (%)Remark
Frame—Al12.77118Al scrap suitable for producing secondary Al
Poly c-Si chips3.1014Recovery rate of silicon ~95%
Silver bar line—Ag0.030.05Recovered through electrolysis or precipitation in leaching solution
Cu Bushbar and tabbing 0.4512Recovery from cable scrap (~97%)
Top surface—tempered glass54.72170Glass cullet for glass production
Back-sheet layer—Polyvinyl fluoride17.0911.5Energy recovery from incineration process
Encapsulation layer—EVA 5Energy recovery from incineration process
Disclaimer/Publisher’s Note: The statements, opinions and data contained in all publications are solely those of the individual author(s) and contributor(s) and not of MDPI and/or the editor(s). MDPI and/or the editor(s) disclaim responsibility for any injury to people or property resulting from any ideas, methods, instructions or products referred to in the content.

