Abstract
Deep tight-gas carbonate reservoirs have huge reserves, with the advantages of having clean and low-carbon characteristics in addition to being a sustainable and stable supply which leads to very high-quality green energy, despite its difficult extraction. The reservoirs are usually modified using acid fracturing before exploitation, but due to acid erosion, the continuous alteration of the mechanical properties of the reservoir rocks complicates the process of predicting the crack initiation pressure. This paper aims to address the difficulties in predicting the crack initiation pressure by conducting a series of acid-etching experiments on carbonate rock samples subjected to splitting and uniaxial compression tests. By examining the variations in the elastic modulus, Poisson’s ratio, tensile strength under distinct acid systems, and acid-etching durations and temperatures, a quantified mathematical model was developed. This model was integrated into a fracture-initiation pressure prediction framework, resulting in a practical and user-friendly tool for the acid fracture-initiation pressure prediction model, which was further demonstrated through field engineering validation. The findings reveal that the elastic modulus, Poisson’s ratio, and tensile strength of carbonate rocks exhibit an inverse relationship with acid-etching time and temperature. Extended acid fracturing durations and high reservoir temperatures are conducive to acid-fracturing transformations. The fracture-initiation pressure-prediction-model analysis disclosed that, compared to the gelled acid, the diverting acid demonstrates a more pronounced reduction in the reservoir fracture pressure under high-temperature and short-duration conditions. An acid system preference diagram was constructed to provide a theoretical foundation for practical engineering applications, delivering valuable insights for optimizing acid fracturing treatments in carbonate reservoirs to provide a boost for the green energy extraction of tight gas.
1. Introduction
The proposition of the “Carbon Peaking and Carbon Neutrality” goals has reinforced the merits of natural gas with its clean, low-carbon characteristics and the capacity to ensure a sustainable and steady supply. Deep tight-gas carbonate, abundant in reserves and noted for its clean, low-carbon footprint, is a superior-quality green energy source and has emerged as a pivotal arena for future oil and gas exploration and development []. However, these rock formations are typically characterized by low permeability, abundant fractures, and vugs. The remediation of these reservoirs often necessitates hydraulic fracturing to establish diversion channels, with acid fracturing being particularly suitable for carbonate reservoirs and hence, widely utilized in practice [,,,]. The acid fracturing of carbonate rocks diverges significantly from conventional hydraulic fracturing in terms of crack initiation, with the most notable mechanistic disparity being the impact of acid erosion on the rocks’ mechanical properties. Acid fracturing involves not only a fluid–solid coupling process but also a chemical dissolution interaction between the carbonate rocks and acid. This alters the internal structural features of the reservoir rock matrix, affecting the rock’s mechanical parameters, thereby reducing the fracture pressure []. If these issues are overlooked in the fracturing construction design, it can lead to a marked deviation between the planned and the actual fracturing environments [], culminating in unreasonable construction parameter design, resulting in fracturing failure and barring safe, sustainable oil and gas extraction []. Thus, while predicting the initiation pressure of acid fracturing, it is crucial to account for the deterioration of the reservoir rock’s mechanical properties induced by acid corrosion. The mechanistic contrast between acid fracturing and conventional fracturing is further elucidated.
Numerous studies have been carried out to understand the transformations in the mechanical properties of reservoirs as a result of acid fracturing []. For instance, Zhang et al. (2020) executed triaxial compression experiments on carbonate rocks post-acid etching, scrutinizing the impact of acid-etching duration on rock mechanical parameters, including compressive strength, elastic modulus, Poisson’s ratio, and brittleness index []. Zhou et al. (2007) suggested temperature as a significant variable and conducted acid etching on rocks at 90 °C to analyze the effect of acid etching on rock mechanical parameters at elevated temperatures []. Building on this, He et al. (2013) utilized a scanning electron microscope to observe the microscopic alterations in carbonate rocks under acid etching []. While these researchers have pursued experimental studies on the variations in rock mechanical properties under acid etching, their studies have only qualitatively analyzed the relationship between acid-etching conditions and rock mechanical properties without formulating a model for quantitative depiction. Moreover, the studied rock mechanical property parameters are not comprehensive. To remedy these shortcomings, this paper scrutinizes the impacts of elastic modulus, Poisson’s ratio, and tensile strength of carbonate rocks under different acid systems, etching durations and temperatures via numerous experiments and constructs a data model for quantitative description.
During acid fracturing, the rocks’ mechanical properties change as the acid reacts with the rocks, making it challenging to predict the initiation pressure []. Some researchers have employed commercial software to simulate acid fracturing, which holds practical engineering significance [,]. Hou et al. (2022) simulated acid fractures connecting to fracture holes using the phase-field method, analyzing the influence of the hole structure on the initiation pressure of acid fractures under varied hole sizes and distributions []. Xue et al. (2019) considered the effect of acid leak-off on the dissolution of the carbonate matrix and analyzed the influence of different injection rates of fracturing fluid on the acid fracturing-initiation pressure in carbonate rock []. However, these researchers did not focus intensively on the degradation of reservoir mechanical properties under acid etching, which affects prediction outcomes. Furthermore, the calculation process is excessively complicated, setting high standards for engineering designers and impeding broad application. To mitigate these issues, this paper presents a method for predicting initiation pressure that incorporates the degradation model of rock mechanical properties due to acid etching. This method is an analytical model with a simplified calculation process, capable of swiftly predicting initiation pressures and exhibiting high applicability.
In conclusion, for the efficient and sustainable extraction of tight gas, this study formulates a comprehensive mathematical model that correlates acid-etching temperature and time with rock elastic modulus, Poisson’s ratio, and tensile strength, as determined by uniaxial compression and splitting experiments. This model is amalgamated with a fracture-initiation calculation model to form a method for predicting acid-fracturing initiation pressure, which has been authenticated by real-field data. Lastly, the influence of the acid system and acid-etching time and temperature on the initiation pressure was analyzed using this calculation method, thereby providing a theoretical foundation for the design of acid-fracturing engineering parameters. This comprehensive approach significantly contributes to the understanding and application of acid fracturing in carbonate reservoirs.
2. Acid-Etching Rock Mechanics Experiment
2.1. Materials and Equipment
2.1.1. Experimental Sample
Elastic modulus, Poisson’s ratio, and rock tensile strength are the most crucial mechanical parameters in reservoir fracturing simulations [,,]. The determination and estimation of elastic behaviors are essential in the practice of engineering. The elastic modulus and Poisson’s ratio are the most significant characteristics describing the deformability of rock material []. Tensile strength is an important factor to consider when determining whether or not the rock has been fractured, as acid fracturing mainly causes tensile stress damage. This has a significant effect on the fracturing process’s results. This paper focuses on the study of acid-fracturing initiation pressure, so only the three mechanical parameters above are discussed in this paper.
The carbonate rock samples used in this study were obtained from the Dengying section of the Penglai Gas Field in the Sichuan Province. The mineral group of the sample is divided into 99.2% dolomite and 0.8% quartz. According to the corresponding ASTM standards of various experiments, the rocks are processed into φ25 mm 50 mm uniaxial compression samples and φ50 mm 25 mm splitting test samples, respectively. The experimental samples were taken from the same rock in order to minimize the errors brought on by variations in the initial state of the rocks. The specific original mechanical parameters can be seen in Table 1.

Table 1.
Original rock mechanics parameters.
2.1.2. Experimental Equipment
The elastic model, Poisson’s ratio, and tensile strength were the primary focus of this paper. By using the uniaxial compression experiment, it is possible to determine the elastic modulus and Poisson’s ratio of rocks under various acid-etching conditions. The splitting experiment can be used to determine the tensile strength. Both the uniaxial compression and the splitting experiments in the laboratory experiment used the RTR series high-pressure rock-test system made by the GCTS Company. As shown in Figure 1, this system is a closed-loop digital servo control device that can effectively complete rock splitting and uniaxial experiments and obtain a variety of rock mechanical parameters.
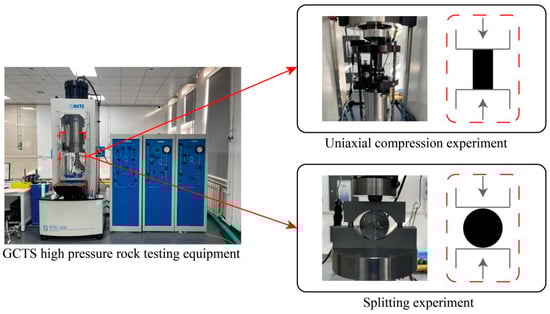
Figure 1.
GCTS high-pressure rock-testing equipment.
2.2. Experimental Design
The uniaxial compression experiments and splitting experiments make up the mechanical experiments in this paper. Uniaxial compression experiments are numbered in the form of 1-x, and the splitting experiments are numbered in the form of 2-x.
In the experiment of the mechanical characteristics of acid-etching evolution, the processed rock samples were first soaked in the acidizing fluid under different conditions of acid etching. After meeting the design requirements, the samples were taken out and cooled to air-dry naturally. Finally, the mechanical properties were tested. The specific experimental process can be seen in Figure 2. The acid-etching conditions included the type of acidizing working liquid and the acid-etching time and temperature. A variety of acidizing working fluids have been developed since the development of acid fracturing [], but gelling acid and diverting acid are the most commonly used in practical engineering. Therefore, gelling acid and diverting acid are the working fluids used in this study. The reaction time is necessary for the rock acid-etching process. Controlling the etching time of the fracturing working fluid in the formation is also necessary in engineering [,]. The length of the acid-etching time process has a significant impact on how the mechanical properties of the rocks are modified []. Since the acid-etching time is typically controlled between 30 and 90 min in actual acid-fracturing engineering, the experimental acid-etching times in this paper were set to 30, 60, and 90 min, respectively. Due to the geothermal effect, in actual engineering, the reservoir temperature in the target area is typically higher than the surface temperature []. In an environment with high temperatures, acid activity rises, molecular thermal movement quickens, and the rate at which rocks are etched by acids also increases. Therefore, it is important to investigate the relationship between the acid-etching temperature and the mechanical properties of the rock in order to obtain the mechanical properties of the target reservoir rock under the action of the acid-fracturing fluid. The effect of acid-etching temperature was carefully considered in this experiment, and the temperature range from the surface to the deep reservoir was represented by the variables of 20 °C, 60 °C, and 100 °C. As mentioned above, Table 2 shows the precise design plan for the mechanical characteristics experiment.
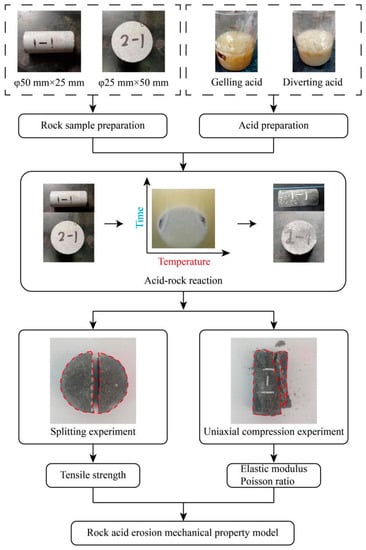
Figure 2.
Experimental flow chart.
Table 2.
Experimental parameters of the mechanical features.
The acid formulation used in the experiments was specified as follows:
Gelling acid: 20.0% hydrochloric acid + 3.5% gelling agent + 3.5% corrosion inhibitor + 1.0% iron ion stabilizer + 1.5% corrosion inhibitor synergist + 1.0% cleanup additive + 1.0% compound multi-effect agent.
Diverting acid: 20.0% hydrochloric acid + 5.0% diverting agent + 3.5% corrosion inhibitor + 1.0% iron ion stabilizer + 1.5% corrosion inhibitor synergist + 1.0% gelling agent.
2.3. Analysis of Experimental Results
The elastic model, Poisson’s ratio, and tensile strength of the rocks were extracted from the experimental results, and the three mechanical parameters above were calculated using the following equations.
The modulus of elasticity and Poisson’s ratio can be obtained by uniaxial compression experiments, calculated as follows:
where is the modulus of elasticity, GPa; is Poisson’s ratio; is the axial stress, GPa; is the axial strain; is the radial strain.
Tensile strength is obtained by splitting the experiments with the following formula:
where is the rock tensile strength, MPa; is Maximum load for the splitting experiments, kN; D is the rock sample diameter, mm; is the rock sample thickness, mm. It should be noted that the experiments are primarily intended to provide an evolution model for predicting the fracturing pressure in field engineering, whereas acid-etching time in actual engineering is typically controlled in 30–90 min. As a result, the experimental results and the mechanical-parameter evolution model are only considered during the 30–90 min acid-etching time period to avoid non-critical parameters from affecting the parameters of the overall mechanical-parameter evolution model. Table 3 shows the specific experimental results.
Table 3.
The experimental results.
In acid etching, both time and temperature have an effect on the structure of the acid rock. The acid does not react with the rock immediately but rather gradually. The corrosion inhibitor injection slows the reaction rate to a manageable level. Through rock acid-etching experiments, Zhang et al. (2020) discovered that the longer the acid-etching time, the greater the etching degrees of the rock and the more serious the structural damage; the acid-etching time affects the progress, and the acid-etching temperature affects the rate []. Through rock acid-etching experiments at various temperatures, Zhou et al. (2007) discovered that the acid-corrosion temperature is higher, the molecular thermal motion is faster, and the rock acid-reaction rate is improved, which aggravates the rock acid etching []. It can be seen that both long acid-etching time and high acid etching temperature will aggravate the degree of rock acid-etching damage, which is reflected in the macroscopic changes of the overall rock mechanical parameters, and each mechanical parameter was described as follows.
2.3.1. Elastic Modulus Evolution of Acid Etching Rocks
The experiments revealed that the time and temperature of acid etching are inversely proportional to the elastic modulus of rocks. The longer the acid-etching time and temperature, the higher the degree of damage to the internal structure of the acid-etching rock [,]. Microscopically, the rock porosity increases, the rock deforms more under the same pressure, the bearing capacity decreases, and finally, the elastic modulus decreases, as shown in Figure 3.
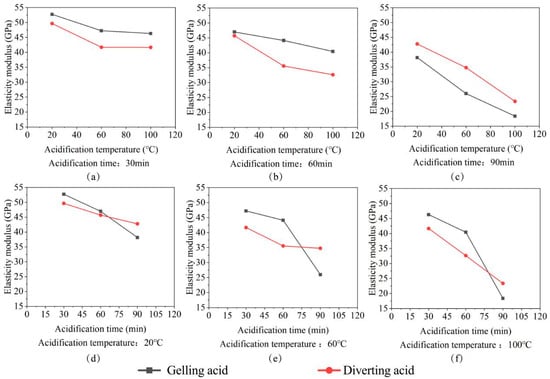
Figure 3.
The plot of the elastic modulus change. (a) Elastic modulus change with acidification temperature for 30 min acidification time; (b) Elastic modulus change with acidification temperature for 60 min acidification time; (c) Elastic modulus change with acidification temperature for 90 min acidification time; (d) Elastic modulus change with acidification time for 20 °C acidification temperature; (e) Elastic modulus change with acidification time for 60 °C acidification temperature; (f) Elastic modulus change with acidification time for 100 °C acidification temperature.
As shown in Figure 3, the deterioration range of elastic modulus under the action of gelling acid ranges from 7.41% to 67.72%. The deterioration range of elastic modulus under the action of the diverting acid is 12.8–58.96%. Under the same etching temperature, the gelling acid transformation has an initial slow and then fast tendency. At 30 min and 60 min, the deterioration range of the diverting acid was 2.23–15.04% higher than that of gelling acid. However, when the reaction reached 90 min, the deterioration range of the diverting acid was less than that of gelling acid 8.06–15.4%, indicating that at short acid-etching times, the effect of the diverting acid on the elastic modulus of the rock is bigger, whereas, at longer acid-etching times, the effect of the gelling acid on the elastic modulus is higher. The diverting acid reaction is relatively smooth and nearly linear in time. To summarize, the plane mathematical model was used to divert acid, while the surface mathematical model was used to gel acid. Figure 4 and Equations (4) and (5) show the specific fitted image and results. When the pumping pressure is fixed, the more severe the elastic modulus deterioration, the more prone the rock is to large strains and crack openings [].
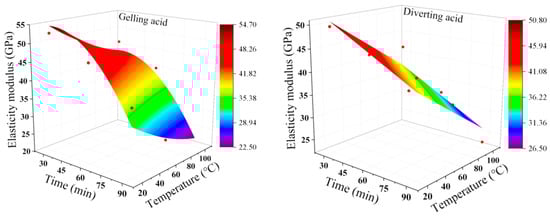
Figure 4.
Acid-etching condition. Elastic modulus fitting diagram. The red dots are experimental data.
Elastic modulus deterioration model under gelling acid conditions: R2: 0.93673
The elastic modulus deterioration model under diverting acid conditions: R2: 0.8884
where H is the acid-etching temperature, °C, with the range being 20–100 °C; T is the acid-etching time in min, with the range being 30–90 min.
2.3.2. Poisson’s Ratio Evolution of Acid-Etching Rocks
Experiments revealed that etching time and temperature are proportional to Poisson’s ratio. The acid-etching time and temperature are longer, the rock corrosion is more severe, and the holes inside are larger. When the rock matrix is compressed, lateral strain is produced, whereas when the hole is compressed, no lateral strain is produced. When a portion of the rock is compressed, the deformation of the rock skeleton preferentially compresses the hole, the Poisson effect of rock is weakened, and Poisson’s ratio decreases macroscopically, as shown in Figure 5.
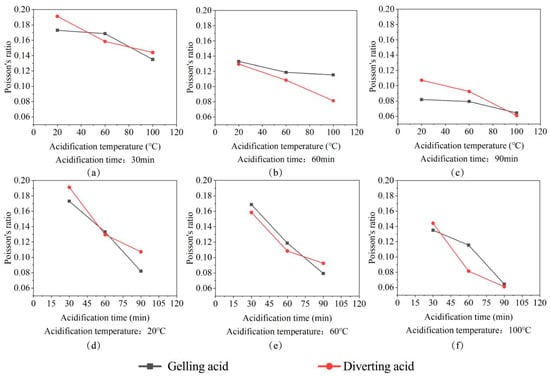
Figure 5.
The plot of the change in Poisson’s ratio. (a) Poisson’s ratio change with acidification temperature for 30 min acidification time; (b) Poisson’s ratio change with acidification temperature for 60 min acidification time; (c) Poisson’s ratio change with acidification temperature for 90 min acidification time; (d) Poisson’s ratio change with acidification time for 20 °C acidification temperature; (e) Poisson’s ratio change with acidification time for 60 °C acidification temperature; (f) Poisson’s ratio change with acidification time for 100 °C acidification temperature.
As shown in Figure 5, the gelling acid reduced Poisson’s ratio from 17.26% to 69.21%. The action of the diverting acid reduced Poisson’s ratio from 8.57% to 70.81%. The deterioration effect of the diverting acid and gelling acid on Poisson’s ratio is synchronous, making differentiation difficult. The deterioration of Poisson’s ratio by the gelling acid has an almost linear relationship with etching time and temperature. The deterioration rate of Poisson’s ratio increased with acid-etching time, showing a trend of first fast, then slow. As a result, gelling acid is used in the plane mathematical model and diverting acid is used in the surface mathematical model when building mathematical models.
Figure 6 and Equations (6) and (7) show the specific fitting image and formula. Generally, the lower the formation Poisson’s ratio, the lower the formation fracture pressure. Therefore, acid treatment of the reservoir with a long etching time and high-formation temperature can significantly reduce the difficulty of reservoir reconstruction.
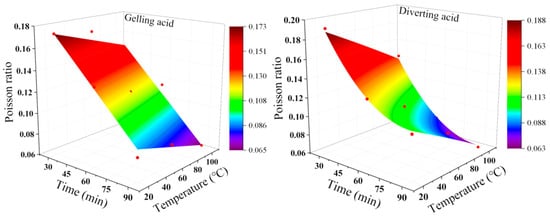
Figure 6.
Acid-etching condition. Poisson’s ratio fitting diagram. The red dots are experimental data.
Poisson’s ratio deterioration model under gelling acid conditions: R2: 0.96739
Poisson’s ratio deterioration model under diverting acid conditions: R2: 0.99178
2.3.3. Evolution of Tensile Strength of Acid-Etching Rocks
The results of the experiments revealed that etching time and temperature are inversely proportional to tensile strength. Long periods of acid etching at high temperatures will exacerbate rock dissolution by acid etching. The more serious the internal failure of the rocks, the more holes are formed, the smaller the area of connection between the rock matrices, and the correlation strength between minerals decreases, as shown in Figure 7.
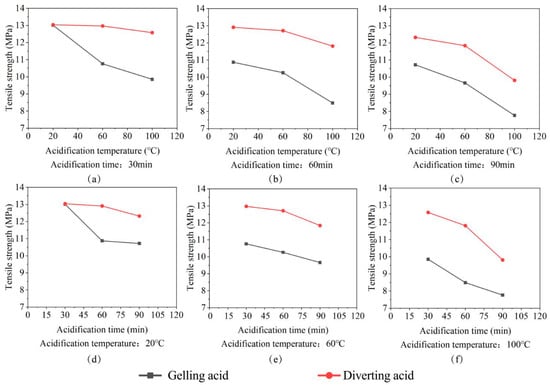
Figure 7.
The plot of the change in tensile strength. (a) Tensile strength change with acidification temperature for 30 min acidification time; (b) Tensile strength change with acidification temperature for 60 min acidification time; (c) Tensile strength change with acidification temperature for 90 min acidification time; (d) Tensile strength change with acidification time for 20 °C acidification temperature; (e) Tensile strength change with acidification time for 60 °C acidification temperature; (f) Tensile strength change with acidification time for 100 °C acidification temperature.
As shown in Figure 7, the tensile strength deterioration range under the action of gelling acid is 2.84–42.05%. The tensile strength deterioration range under the action of diverting acid is 2.61–26.74%. Under the same conditions, the deterioration degree of rock tensile strength caused by gelling acid is bigger than that caused by diverting acid. The degree of tensile strength deterioration and the etching time and temperature have an almost linear relationship. As a result, when developing the mathematical model, the plane mathematical model was used to account for both gelling and diverting acid. Figure 8 and Equations (8) and (9) show the specific fitting image and mathematical model. The majority of hydraulic fractures are type I fractures with tensile failure [,,]. Rock fracturing is facilitated by the lowering of the tensile strength of the rock.
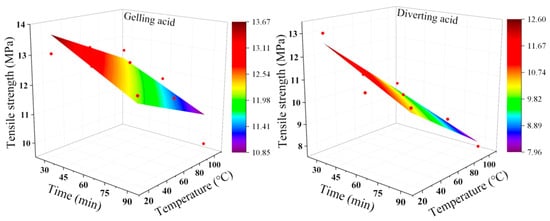
Figure 8.
Acid-etching condition. Tensile strength fitting diagram. The red dots are experimental data.
Tensile strength deterioration model under gelling acid conditions: R2: 0.74791
Tensile strength deterioration model under diverting acid conditions: R2: 0.93564
3. Acidizing-Initiation Pressure Model
3.1. Model Building
For the fracturing, the effective stress at the initiation point on the shaft wall is:
where is the effective stress at the initiation point, MPa; is the injection pressure, MPa; is the formation pressure, MPa; is biot coefficient; is the horizontal maximum principal stress, MPa; is the horizontal minimum principal stress, MPa.
Since the initiation of acid fracturing is due to tensile failure [,,], the formation fracture condition is:
where is the tensile strength, MPa.
Through Equations (10) and (11), the following formula is obtained:
where is the fracture pressure, MPa.
According to Huang’s method:
where and are the structural coefficients; is the vertical stress, MPa.
According to Equations (12) and (13), the following formula is obtained:
The equation above is an initiation pressure prediction model that does not take into account the deterioration of the mechanical effect of acid-etching rocks [,]. It includes a fixed elastic modulus, Poisson’s ratio, and tensile strength []. In acid fracturing, reservoir rock properties have an important effect on fracturing pressure prediction, and acid etching has a significant impact on reservoir rock mechanical properties. Therefore, it is necessary to include the deterioration model of rock acid-etching mechanical properties in the prediction model of acid-fracturing initiation pressure. Based on the experimental results in Section 3, we established the deterioration model of rock mechanical properties. By combining Equations (4)–(9) with Equation (14), we obtained the prediction model of acid fracturing initiation pressure by combining Equations (4)–(9) with Equation (14). The following is the formula:
Gelling acid:
Diverting acid:
Equations (15) and (16) incorporate the deterioration process of rock acid-etching mechanical properties into fracture pressure prediction. According to the actual standards, the acid-etching conditions will affect the initiation pressure. It can improve the accuracy of acid fracturing-initiation pressure predictions.
3.2. Model Verification
The acid fracturing-initiation pressure model is validated using field data in this paper. Field data were used for the XX well of the PetroChina Southwest Oil and Gas Field, which is located in the same geographical area as the samples used in the mechanical deterioration experiment. The vertical depth of the target reservoir is 5905 m. The overburden pressure is 155.3 MPa. The structural coefficients are 0.7742 and 0.5538. The formation temperature is 100 °C, the formation pressure is 60.18 MPa, and the biot coefficient is 0.8. The reservoir modification can be divided into a two-step process. First, the target reservoir is acidified by injecting gelling acid for 45 min. The slickwater is then used to fracture until the fracturing process is finished. Figure 9 shows the specific data, with an initiation pressure of 93.4 MPa.
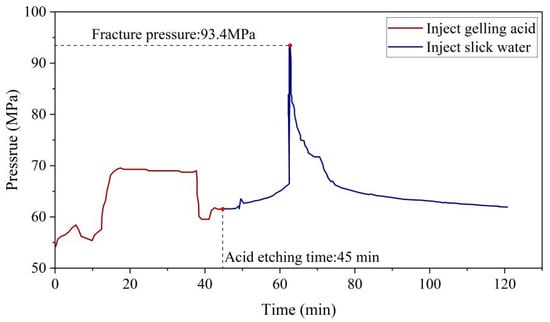
Figure 9.
Pressure curve of acidification fracturing data.
We put the above parameters into Equation (12). According to the calculations, the predicted initiation pressure is 87.8 MPa. The error is 6% since the difference with the true initiation pressure is 5.6 MPa. When the formation parameters are substituted into Equation (11), the predicted initiation pressure is 119.2 MPa, which is about 25.8 MPa higher than the actual initiation pressure; the error is 27.6%. The error has been reduced by 20.2 MPa, and the accuracy has been improved by 21.6%. It can be seen that the fracture-initiation-model prediction results with acid-etching deterioration are more accurate.
Figure 10 shows the fracture-initiation pressure at various acid-etching times and formation temperatures calculated by Equations (11)–(13). Figure 10a–c show that when the acid-etching time is constant, the formation temperature and the fracture-initiation pressure are linearly related, with a higher formation temperature resulting in a larger difference between the fracture-initiation pressure calculated by Equations (12) and (13). When predicting the fracture-initiation pressure of acid fracturing in high-temperature formations, the change in reservoir-rock mechanical properties must be considered; in comparison to the effects of natural conditions in the formation-temperature reservoir, the acid-etching time is artificially controlled and requires more attention. As shown in Figure 10d–f, the longer the acid-etching time, the bigger the difference between the fracture-initiation pressure calculated by Equations (12) and (13). The gelling acid etching time has a linear effect on the fracture-initiation pressure. However, the diverting acid has a non-linear relationship; when the acid etching time is short, the fracture initiation pressure drops quickly. The longer the acid etching time, the gentler the fracture initiation pressure drops; thus, the diverting acid is more suitable for short acid-etching time operation. To summarize, it is necessary to consider the change in rock mechanical properties to predict the initiation pressure under the conditions of high temperature and long acid etching time and to use Equations (12) and (13) to make a prediction; otherwise, an extreme error will result.
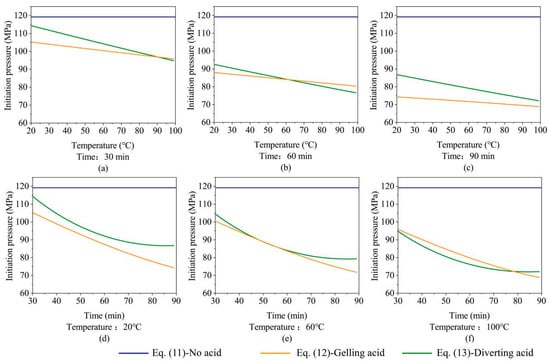
Figure 10.
Fracture initiation pressure under different formation temperatures and acid-etching times. (a) Initiation pressure change with reservoir temperature for 30 min acid-etching time; (b) Initiation pressure change with reservoir temperature for 60 min acid-etching time; (c) Initiation pressure change with reservoir temperature for 90 min acid-etching time; (d) Initiation pressure change with acid-etching time for 20 °C reservoir temperature; (e) Initiation pressure change with acid-etching time for 60 °C reservoir temperature; (f) Initiation pressure change with acid-etching time for 100 °C reservoir temperature.
4. Discussion
The initiation pressure is affected by the acid-etching time, formation temperature, and acid system. This chapter examines the sensitivity of initiation pressure using the fracturing construction reservoir in Section 3.2 as an example. The acid-etching-time-formation temperature-initiation pressure contour diagram was drawn using Equations (12) and (13), as shown in Figure 11.
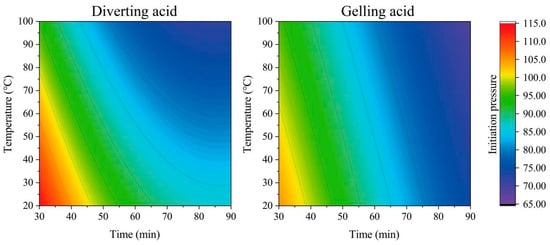
Figure 11.
Acid-etching-time formation-temperature fracture-initiation-pressure contour map.
It can be seen from the above figure that the formation temperature and acid-etching time have a uniform influence on the fracture pressure under the action of gelling acid. Overall, the higher the formation temperature, the longer the etching time and the lower the fracture pressure. However, as the etching time increases, the decreasing rate of fracture pressure becomes slower due to the action of diverting acid. This phenomenon becomes more pronounced as the temperature rises. The higher the temperature is during the short etching time, the faster the fracture pressure drops. On this basis, the priority engineering diagram of an acid system is drawn, as shown in Figure 12. Specific formation temperatures and acid-etching times correspond to colors that indicate lower fracture-initiation pressures with a particular acid. The blue color indicates that using diverting acid for fracturing will have a lower fracture-initiation pressure. The darker the color, the better the effect, and it is recommended to use diverting acid for fracturing in the first place; conversely, the red color indicates that gelling acid is preferred. When the formation temperature is higher and the acid etching time is shorter, the diverting acid obtains a lower fracture pressure and is preferred; conversely, the gelling acid is preferred. For practical engineering, the plate can assist in quickly selecting the acid.
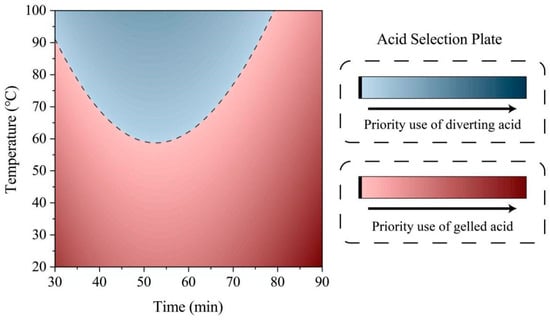
Figure 12.
Plate for selecting the optimal acid based on formation temperature and acid-etching time.
This study highlights a significant flaw in the current acid fracturing design, namely that insufficient consideration of the deleterious effects of rock acidification frequently results in a significant discrepancy between the designed and actual fracture-initiation pressures. This mismatch may inadvertently cause excessive fracture propagation, resulting in fracture cross strata [,,,], a far more damaging outcome than what is typically seen in conventional hydraulic fracturing []. The fracturing fluid in acid fracturing contains acids, causing significant changes in the physical properties of non-target reservoirs [], resulting in contamination. Furthermore, this process may unintentionally transport oil and gas from target reservoirs to non-target reservoirs, complicating extraction. If fractures penetrate the groundwater strata, acid and gas ingress could severely contaminate these water sources []. As groundwater flow is difficult to control, such pollution could endanger the health of plant and animal life that rely on these resources [,]. For a sustainable and safe extraction of oil and gas resources, the implications of acid fracturing on rock properties within the reservoir must be thoroughly considered. The fracture-pressure prediction model proposed in this study should thus be incorporated into the design to improve fracture-pressure precision.
While the proposed model, based on acid erosion mechanics experiments of carbonate rocks, offers simplicity and usability, it is not without limitations.
- The model was created with a specific goal in mind. The sample pool is limited to a single block. Since the pore structure of the mineral fraction of rocks differs in different blocks, and the mechanical properties exhibited after acid etching differ, while the predictive capability for this block is promising, its wider applicability is limited. To apply this model to other blocks, necessary adjustments should be made through experimental revisions of the rock mechanical deterioration model.
- Although the prediction model’s accuracy outperforms those that ignore the rock’s mechanical evolution, there is still room for improvement. One area for improvement is the inclusion of the acid wave area, which is not currently included in the model. So continued refinement and optimization will be critical in the future.
5. Conclusions
Tight-gas carbonate reserves are vast and low in carbon, representing a significant avenue to achieve the goals of carbon peaking and carbon neutrality. To facilitate the efficient and sustainable extraction of carbonate tight gas, this paper tackles the challenge of predicting the initiation pressure of acid fracturing. A considerable number of acid-etching mechanical experiments were conducted on carbonate rocks, and based on these empirical results, mathematical models correlating acid-etching time, acid-etching temperature, and mechanical properties were established. Coupled with the evolution model of rock mechanical properties under acid etching, a model was devised for the initiation pressure of acid fracturing in the reservoir. Subsequently, a sensitivity analysis was conducted based on this model to examine the factors influencing the initiation pressure of acid fracturing.
- The relationship between rock etching temperature and time, elastic modulus, Poisson’s ratio, and tensile strength is inversely proportional, and the evolution model of rock mechanical properties of acid etching is established according to the experimental data to quantify it.
- In the prediction of the fracture pressure of acid fracturing, the influence of acid etching on the mechanical properties of reservoir rocks should be fully considered. The model is simple, easy to apply, and suitable for promotion. Compared with the model ignoring the mechanical changes of the acid-etching rock, the accuracy of the model is 21.6% higher.
- The formation temperature and etching time in acid fracturing are inversely proportional to their fracture pressure. Compared with gelling acid, diverting acid has a more significant decrease in reservoir fracture pressure under the condition of high temperature and short time.
Author Contributions
Methodology, J.T.; software, H.W.; validation, L.H.; formal analysis, L.H.; data curation, W.C., L.L. and Q.H.; writing—original draft, X.J.; supervision, W.C. and J.Y.; project administration, Y.J. All authors have read and agreed to the published version of the manuscript.
Funding
This research received no external funding.
Data Availability Statement
Data is unavailable due to privacy.
Conflicts of Interest
The authors declare no conflict of interest.
Nomenclature
| T | acid etching time, min |
| H | acid etching temperature, °C |
| the injection pressure, MPa | |
| the formation pressure, MPa | |
| biot coefficient | |
| the horizontal maximum principal stress, MPa | |
| the horizontal minimum principal stress, MPa | |
| the tensile strength, MPa | |
| the fracture pressure, MPa | |
| the structural coefficient | |
| E | elastic modulus, GPa |
| Poisson’s ratio | |
| the vertical stress, MPa | |
| the effective stress at the initiation point, MPa |
References
- Schwalbert, M.P.; Aljawad, M.S.; Hill, A.D.; Zhu, D. Decision Criterion for Acid-Stimulation Method in Carbonate Reservoirs: Matrix Acidizing or Acid Fracturing? SPE J. 2020, 25, 2296–2318. [Google Scholar] [CrossRef]
- Tang, J.; Wu, K.; Li, Y.; Hu, X.; Liu, Q.; Christine, E.E. Numerical investigation of the interactions between hydraulic fracture and bedding planes with non-orthogonal approach angle. Eng. Fract. Mech. 2018, 200, 1–16. [Google Scholar]
- Liu, H.; Huang, Y.; Cai, M.; Meng, S.; Tao, J. Practice and development suggestions of hydraulic fracturing technology in the Gulong shale oil reservoirs of Songliao Basin, NE China. Pet. Explor. Dev. 2023, 50, 688–698. [Google Scholar]
- Li, Y.; Yang, S.; Zhao, W.; Li, W.; Zhang, J. Experimental of hydraulic fracture propagation using fixed-point multistage fracturing in a vertical well in tight sandstone reservoir. J. Pet. Sci. Eng. 2018, 171, 704–713. [Google Scholar]
- Meng, S.; Li, D.; Liu, X.; Zhang, Z.; Tao, J.; Yang, L.; Rui, Z. Study on dynamic fracture growth mechanism of continental shale under compression failure. Gas Sci. Eng. 2023, 114, 204983. [Google Scholar] [CrossRef]
- You, J.; Lee, K.J. Analyzing the Dynamics of Mineral Dissolution during Acid Fracturing by Pore-Scale Modeling of Acid-Rock Interaction. SPE J. 2021, 26, 639–652. [Google Scholar]
- Stevens, R.B.; Torell, G.L. Exceptional drought and unconventional energy production. Sustainability 2018, 10, 1218. [Google Scholar] [CrossRef]
- Briševac, Z.; Pollak, D.; Maričić, A.; Vlahek, A. Modulus of Elasticity for Grain-Supported Carbonates—Determination and Estimation for Preliminary Engineering Purposes. Appl. Sci. 2021, 11, 6148. [Google Scholar]
- Pandey, V. Pressure Interpretations in Acid Fracturing Treatments. SPE Prod. Oper. 2022, 37, 346–361. [Google Scholar] [CrossRef]
- Zhang, K.; Chen, M.; Dai, Y.; Li, J.; Wang, S.; Lou, R. Experiments on the Deterioration Effects of Carbonate During Acid Fracturing. Res. Explor. Lab. 2020, 39, 30–34. [Google Scholar]
- Zhou, J.; Chen, M.; Jin, Y.; Zhang, G.; Jiang, X. Experimental study on strength reduction effects of limestone near fracture area during acid fracturing. Chin. J. Rock Mech. Eng. 2007, 26, 206–210. [Google Scholar]
- He, C.; Gou, J. Mechanism study of acid on mechanical properties of limestone. Chin. J. Rock Mech. Eng. 2013, 32, 3016–3021. [Google Scholar]
- Mahdiyar, H.A.M.S.; Salari, A.A.; Qajar, J.A.; Kalantariasl, A.A. New correlations for etched fracture width and half-length of acid-fractured wells. J. Pet. Sci. Eng. 2019, 182, 106286. [Google Scholar]
- Kasiri Bidhendi, M.R.; Khorsand Movaghar, M.R.; Humand, M.; Bazargan, M. Enhancing acid fracture design in carbonate formation using a dynamic up-scaling procedure to convert discrete fracture network to dual continuum. Pet. Sci. Technol. 2022, 40, 2284–2304. [Google Scholar]
- Aljawad, M.S.A.M.; Schwalbert, M.P.A.; Zhu, D.A.; Hill, A.D.A. Improving acid fracture design in dolomite formations utilizing a fully integrated acid fracture model. J. Pet. Sci. Eng. 2020, 184, 106481. [Google Scholar] [CrossRef]
- Hou, B.; Dai, Y.; Fan, M.; Zhang, K.; Wick, T.; Lee, S. Numerical simulation of pores connection by acid fracturing based on phase field method. Acta Pet. Sin. 2022, 43, 849–859. [Google Scholar]
- Xue, H.; Huang, Z.; Liu, F.; Liu, P.; Wang, H.; Zhang, B.; Liu, F.; Cheng, Y.; He, B.; Chen, X. 3D acid fracturing simulation and application in the upper sinian dengying fm gas reservoirs in china. In Proceedings of the International Petroleum Technology Conference, Beijing, China, 22 March 2019. [Google Scholar]
- Li, Y.; Long, M.; Zuo, L.; Li, W.; Zhao, W. Brittleness evaluation of coal based on statistical damage and energy evolution theory. J. Pet. Sci. Eng. 2019, 172, 753–763. [Google Scholar] [CrossRef]
- Cong, Z.; Li, Y.; Pan, Y.; Liu, B.; Shi, Y.; Wei, J.; Li, W. Study on CO2 foam fracturing model and fracture propagation simulation. Energy 2022, 238, 121778. [Google Scholar]
- Li, N.; Xie, H.; Gao, Z.; Li, C. Study on the Hydraulic Fracturing Failure Behaviour of Granite and Its Comparison with Gas Fracturing. Sustainability 2022, 14, 14593. [Google Scholar] [CrossRef]
- Jatykov, T.; Sagindykov, B.; Bimuratkyzy, K. Hydraulic fracturing design improvements by proppant flowback mitigation method application during hydrocarbon production. Rud. Geološko-Naft. Zb. 2021, 36, 99–109. [Google Scholar]
- Xin, L.; Meng, S.W.; Liang, Z.; Tang, C.; Tao, J.; Tang, J. Microscale crack propagation in shale samples using focused ion beam scanning electron microscopy and three-dimensional numerical modeling. Pet. Sci. 2022, 20, 1488–1512. [Google Scholar]
- Mehrjoo, H.; Norouzi Apourvari, S.; Jalalifar, H.; Shajart, M. Experimental study and modeling of final fracture conductivity during acid fracturing. J. Pet. Sci. Eng. 2021, 208, 109192. [Google Scholar] [CrossRef]
- Li, P.; Wang, J.; Liang, W.; Sun, R. An Analytical and Numerical Analysis for Hydraulic Fracture Propagation through Reservoir Interface in Coal-Measure Superimposed Reservoirs. Sustainability 2023, 15, 4597. [Google Scholar] [CrossRef]
- Tan, X.; Zhang, J.; Wang, Y.; Li, M.; Liu, J.; Zhu, Z. Application of a Salt-resistant in-situ Crosslinked Terpolymer Gel for Daqing Oilfield. ACS Omega 2023, 8, 22223–22229. [Google Scholar] [CrossRef]
- Li, Y.; Peng, G.; Chen, M.; Zhang, J.; Wei, J.; Yang, C. Gas-liquid-solid three phase flow model of CO2 foam fracturing in wellbore. Acta Pet. Sin. 2022, 43, 386–398. [Google Scholar]
- Li, H.; Shi, Y. Triaxial experimental investigation into the characteristics of acid-etched fractures and acid fracturing. J. Pet. Sci. Eng. 2021, 202, 108431. [Google Scholar]
- Jin, S.; Wang, X.; Wang, Z.; Mo, S.; Zhang, F.; Tang, J. Evaluation Approach of Rock Brittleness Index for Fracturing Acidizing Based on Energy Evolution Theory and Damage Constitutive Relation. Lithosphere 2021, 2021, 2864940. [Google Scholar]
- Li, Y.; Jia, D.; Rui, Z.; Peng, J.; Fu, C.; Zhang, J. Evaluation method of rock brittleness based on statistical constitutive relations for rock damage. J. Pet. Sci. Eng. 2017, 153, 123–132. [Google Scholar]
- Zhang, J.; Li, Y.; Pan, Y.; Wang, X.; Yan, M.; Shi, X.; Zhou, X.; Li, H. Experiments and analysis on the influence of multiple closed cemented natural fractures on hydraulic fracture propagation in a tight sandstone reservoir. Eng. Geol. 2021, 281, 105981. [Google Scholar]
- Li, Y.; Long, M.; Tang, J.; Chen, M.; Fu, X. A hydraulic fracture height mathematical model considering the influence of plastic region at fracture tip. Pet. Explor. Dev. 2020, 47, 184–195. [Google Scholar]
- Huang, R. Exploration of the prediction model of formation rupture pressure. J. East China Pet. Inst. 1984, 26, 335–347. [Google Scholar]
- Zhang, F.; Zhu, H.; Zhou, H.; Gou, J.; Bo, H. Discrete-Element-Method/Computational-Fluid-Dynamics coupling simulation of proppant embedment and fracture conductivity after hydraulic fracturing. SPE J. 2017, 22, 632–644. [Google Scholar] [CrossRef]
- Tang, J.; Wang, X.; Du, X.; Ma, B.; Zhang, F. Optimization of Integrated Geological-engineering Design of Volume Fracturing with Fan-shaped Well Pattern. Pet. Explor. Dev. 2023, 50, 1–8. [Google Scholar]
- Fan, Y.; Tang, J.; Chen, W.; Zhang, Z.; Tang, B.; Yang, W. Fracturing Optimization Design of Spiral Perforation Completion in Tight Sandstone Channel. Well Logging Technol. 2021, 45, 646–656. [Google Scholar]
- Wu, F.; Meng, P.; Ding, Q.; Li, D.; Yang, W. Hydraulic fracturing fracture pressure calculation model. Daqing Pet. Geol. Dev. 2020, 39, 59–68. [Google Scholar]
- Huang, R. Fracture initiation and expansion of hydraulic fractures. Pet. Explor. Dev. 1981, 8, 65–77. [Google Scholar]
- Zhao, X.; Jin, F.; Liu, X.; Zhang, Z.; Cong, Z.; Li, Z.; Tang, J. Numerical study of fracture dynamics in different shale fabric facies by integrating machine learning and 3-D lattice method: A case from Cangdong Sag, Bohai Bay basin, China. J. Pet. Sci. Eng. 2022, 218, 110861. [Google Scholar]
- Fu, S.; Hou, B.; Xia, Y.; Chen, M.; Wang, S.; Tan, P. The study of hydraulic fracture height growth in coal measure shale strata with complex geologic characteristics. J. Pet. Sci. Eng. 2022, 211, 110164. [Google Scholar] [CrossRef]
- Cong, Z.; Li, Y.; Liu, Y.; Xiao, Y. New Method for Calculating the Direction of Fracture Propagation by Stress Numerical Search Based on the Displacement Discontinuity Method. Comput. Geotech. 2021, 140, 104482. [Google Scholar] [CrossRef]
- Lu, C.; Lu, Y.; Guo, J.; Liu, L. Stability of the formation interface under the impact of hydraulic fracture propagation in the vicinity of the formation interface. Pet. Sci. 2020, 17, 1101–1118. [Google Scholar] [CrossRef]
- Sima, L.; Wen, D.; Yan, J.; Tan, M.; Deng, H. Fracturing Hierarchy Analysis and Fracturing Height Prediction Method in Shale Reservoirs. Well Logging Technol. 2015, 39, 622–627. [Google Scholar]
- Reinicke, A.; Rybacki, E.; Stanchits, S.; Huenges, E. Hydraulic fracturing stimulation techniques and formation damage mechanisms—Implications from laboratory testing of tight sandstone–proppant systems. Chem. Erde–Geochem. 2010, 70, 107–117. [Google Scholar] [CrossRef]
- Tariq Almubarak, J.H.C.N. Insights on Potential Formation Damage Mechanisms Associated with the Use of Gel Breakers in Hydraulic Fracturing. Polymers 2020, 12, 2722. [Google Scholar] [CrossRef]
- Dakheel Almaliki, J.; Bashir, M.J.K.; Llamas Borrajo, J.F. Appraisal of groundwater contamination from surface spills of fluids associated with hydraulic fracturing operations. Sci. Total Environ. 2022, 815, 152949. [Google Scholar] [CrossRef]
- Milton-Thompson, O.; Javadi, A.A.; Kapelan, Z.; Cahill, A.G.; Welch, L. Developing a fuzzy logic-based risk assessment for groundwater contamination from well integrity failure during hydraulic fracturing. Sci. Total Environ. 2021, 769, 145051. [Google Scholar] [CrossRef]
- Li, Y.; Qin, H.; Wu, J.; Zhang, J.; Yang, H.; Zeng, B.; Xiao, Y.; Liu, J. Optimization Method of Oriented Perforation Parameters Improving Uneven Fractures Initiation for Horizontal Well Fracturing. Fuel 2023, 349, 128754. [Google Scholar] [CrossRef]
Disclaimer/Publisher’s Note: The statements, opinions and data contained in all publications are solely those of the individual author(s) and contributor(s) and not of MDPI and/or the editor(s). MDPI and/or the editor(s) disclaim responsibility for any injury to people or property resulting from any ideas, methods, instructions or products referred to in the content. |
© 2023 by the authors. Licensee MDPI, Basel, Switzerland. This article is an open access article distributed under the terms and conditions of the Creative Commons Attribution (CC BY) license (https://creativecommons.org/licenses/by/4.0/).