
Environmental Effects of Driver Distraction at Traffic Lights: Mobile Phone Use


Abstract
:1. Introduction
Literature Review
- Unnecessary fuel consumption, greenhouse gas emissions, and time losses due to mobile phone use were analyzed for the first time in a study.
- Measurements were made taking into account the peak hours at different intersections selected in the study area, and this was the first time a study with such broad participation was put forward.
- Cell phone use was evaluated in three different categories as “Talking”, “Touchscreen”, and “Take Picture”, and roadside observations were made accordingly.
- Separate observations were made for each phase duration at signalized intersections, taking into account the phase durations.
2. Materials and Methods
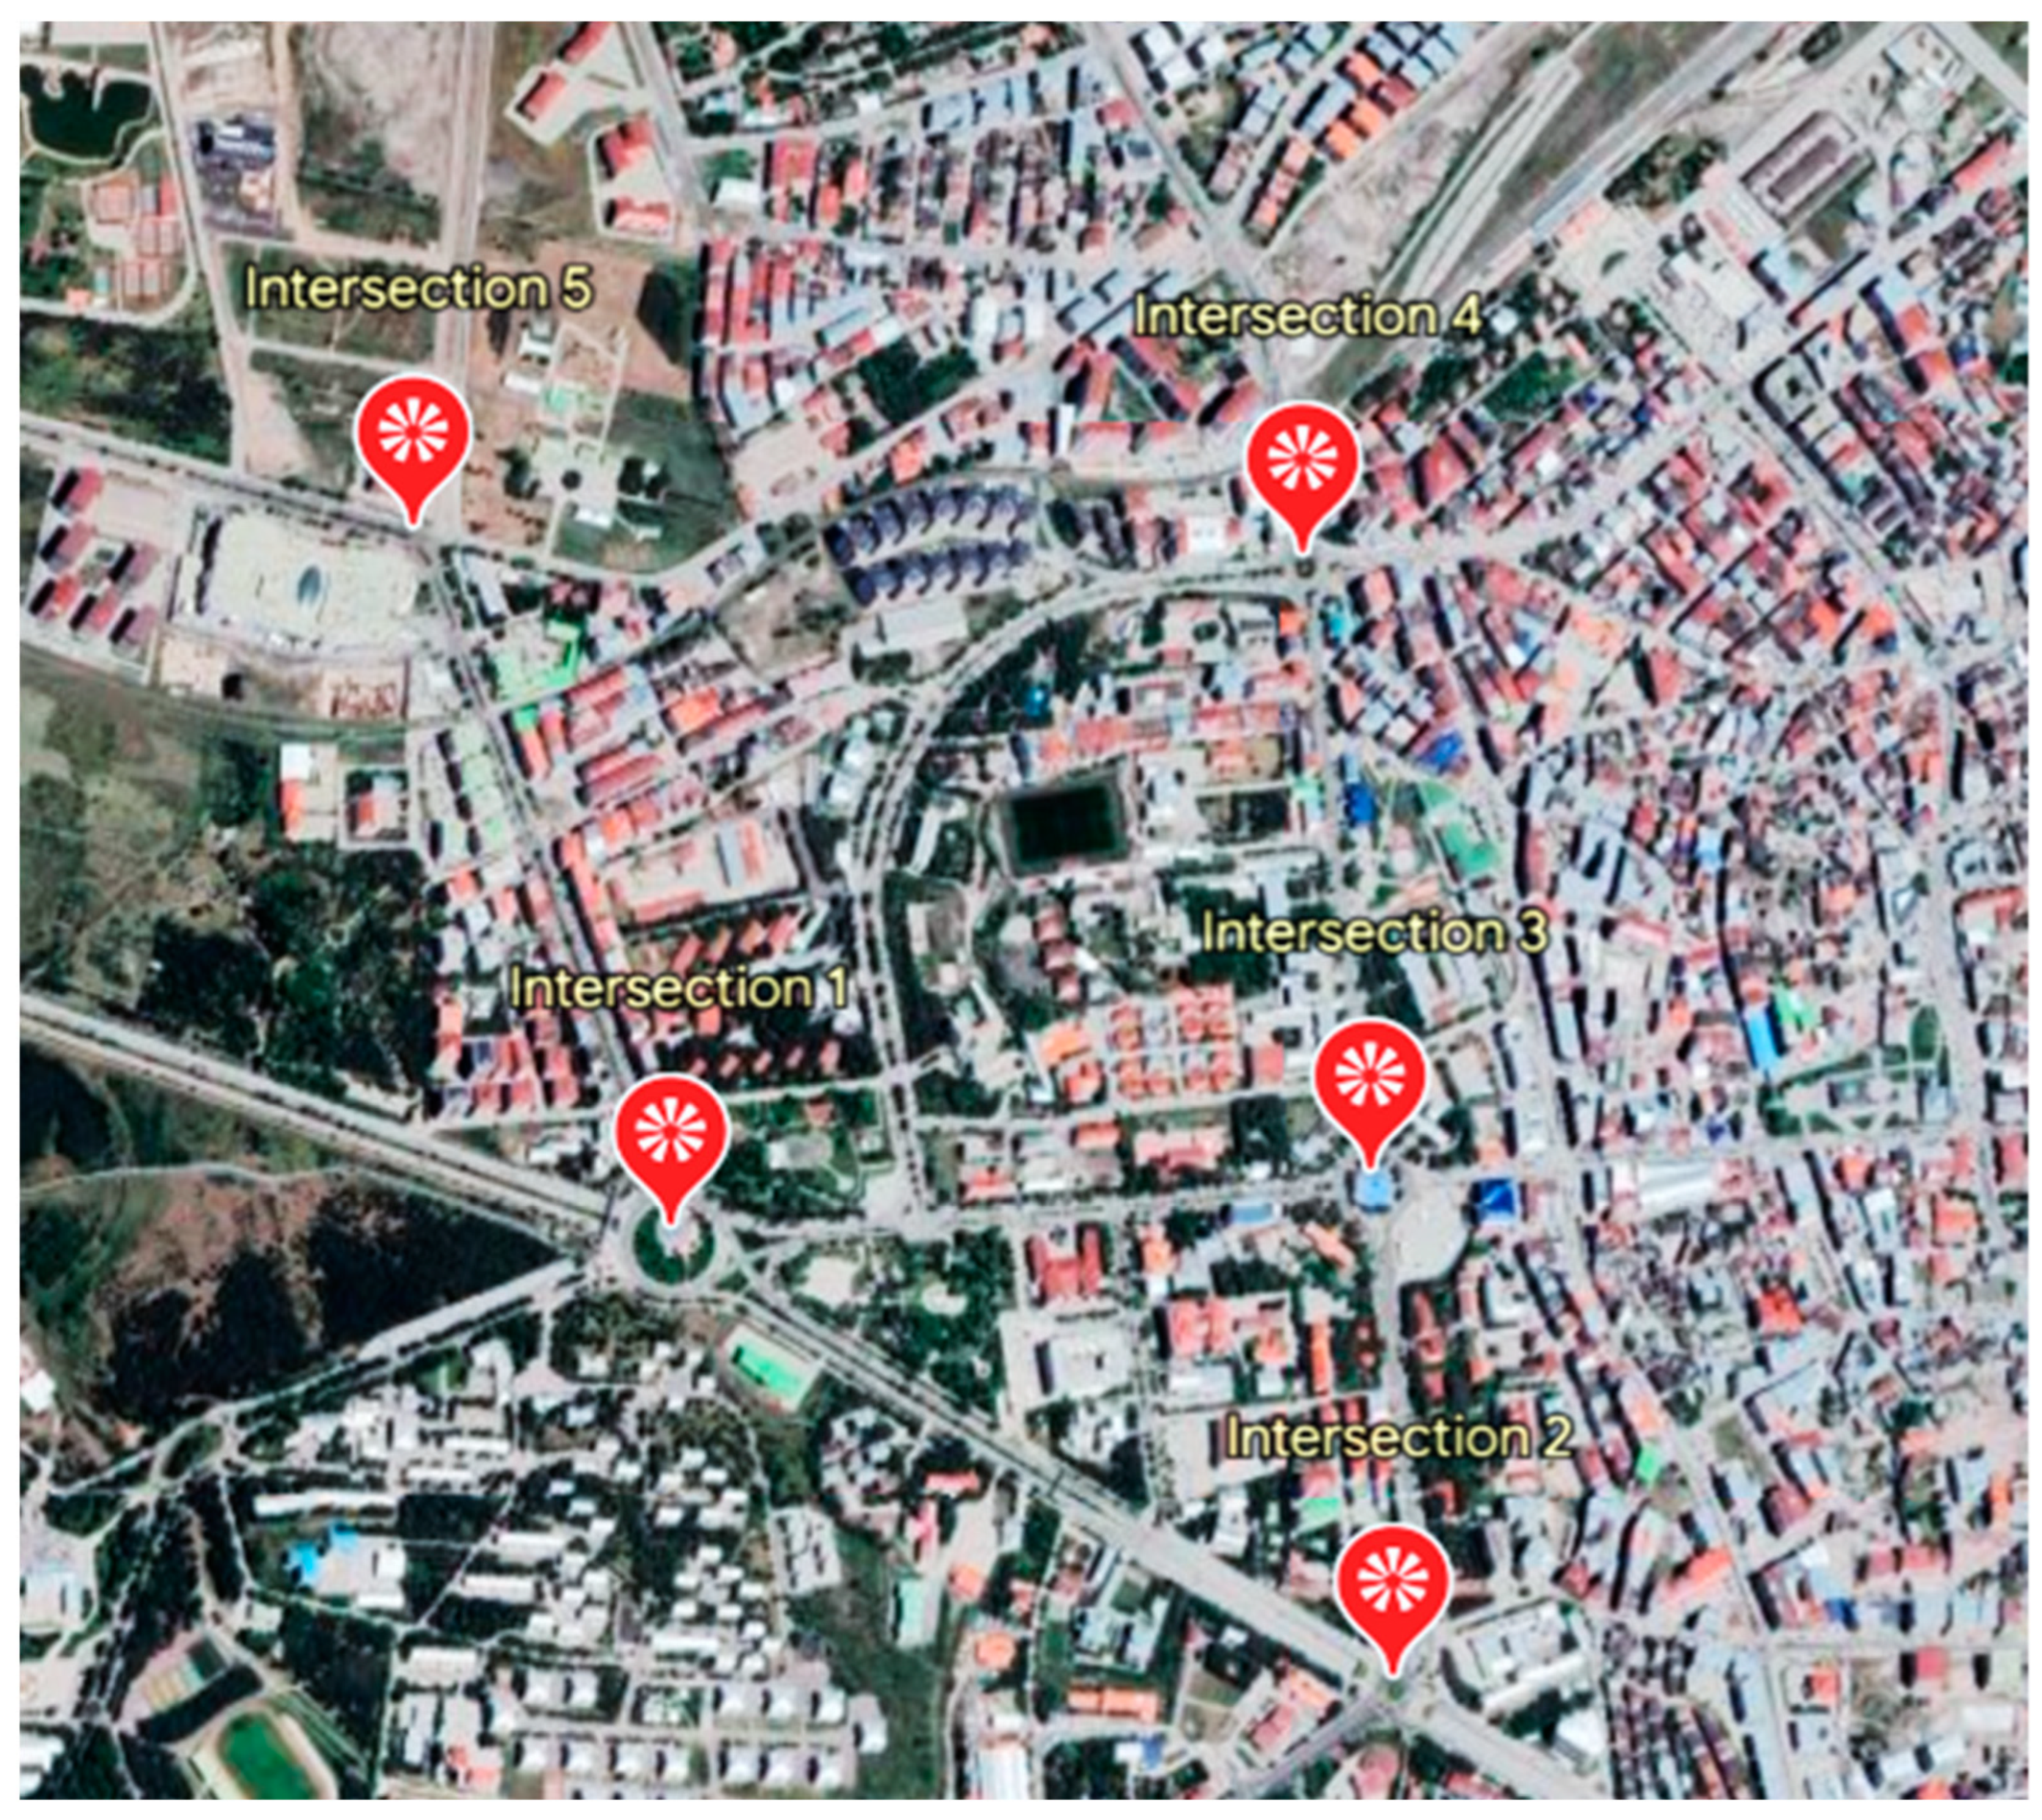
2.1. Study Area
2.2. Observations and Method
3. Results and Discussion
4. Conclusions
Author Contributions
Funding
Institutional Review Board Statement
Informed Consent Statement
Data Availability Statement
Conflicts of Interest
References
- Parasuraman, S.; Sam, A.; Yee, S.K.; Chuon, B.C.; Ren, L. Smartphone Usage and Increased Risk of Mobile Phone Addiction: A Concurrent Study. Int. J. Pharm. Investig. 2017, 7, 125. [Google Scholar] [CrossRef] [PubMed]
- Turner, A. How Many Smartphones Are in the World? Available online: https://www.bankmycell.com/blog/how-many-phones-are-in-the-world (accessed on 6 April 2023).
- Taylor, P. Forecast Number of Mobile Users Worldwide 2020–2025 | Statista. Available online: https://www.statista.com/statistics/218984/number-of-global-mobile-users-since-2010/ (accessed on 27 May 2023).
- Catalina Ortega, C.A.; Mariscal, M.A.; Boulagouas, W.; Herrera, S.; Espinosa, J.M.; García-Herrero, S. Effects of Mobile Phone Use on Driving Performance: An Experimental Study of Workload and Traffic Violations. Int. J. Environ. Res. Public Health 2021, 18, 7101. [Google Scholar] [CrossRef]
- Fraschetti, A.; Cordellieri, P.; Lausi, G.; Mari, E.; Paoli, E.; Burrai, J.; Quaglieri, A.; Baldi, M.; Pizzo, A.; Giannini, A.M. Mobile Phone Use “on the Road”: A Self-Report Study on Young Drivers. Front. Psychol. 2021, 12, 620653. [Google Scholar] [CrossRef]
- Gjorgjievski, M.; Khanna, V.; Petrisor, B.; Li, C.S.; Ristevski, B. Roadside Evaluation of Distracted Driving—Driver Limitations in Recognizing Traffic Light Transitions (REDD—LIGHT). J. Transp. Health 2021, 21, 101059. [Google Scholar] [CrossRef]
- Radjawane, L.E. Effect of Mobile Phone Use of Driver to Vehicle Operating Costs. J. Phys. Conf. Ser. 2020, 1464, 012055. [Google Scholar] [CrossRef]
- Bakhtari Aghdam, F.; Shaheian, K.; Sadeghi-Bazargani, H.; Kousha, A.; Ponnet, K.; Abbasalizad Farhangi, M.; Jahangiry, L. Drivers’ Unsafe Behaviors in Iran: An Investigation in West Azerbaijan. Front. Public Health 2022, 10, 815380. [Google Scholar] [CrossRef]
- Dingus, T.A.; Guo, F.; Lee, S.; Antin, J.F.; Perez, M.; Buchanan-King, M.; Hankey, J.; Designed, J.H. Driver Crash Risk Factors and Prevalence Evaluation Using Naturalistic Driving Data. Proc. Natl. Acad. Sci. USA 2016, 113, 2636–2641. [Google Scholar] [CrossRef]
- Onald, D.; Edelmeier, A.R.; Ibshirani, O.J.T. Association between cellular-telephone calls and motor vehicle collisions abstract. J. Med. 1997, 336, 453–458. [Google Scholar]
- Rothman, L.; Pike, I.; Belton, K.; Olsen, L.; Fuselli, P.; Macpherson, A. Barriers and Enablers to Enacting Child and Youth Related Injury Prevention Legislation in Canada. Int. J. Environ. Res. Public Health 2016, 13, 656. [Google Scholar] [CrossRef]
- Violanti’, J.M.; Marshall, J.R. Cellular phones and traffic accidents: An epidemiological approach. Accid. Anal. Prev. 1996, 28, 265–270. [Google Scholar] [CrossRef]
- Zhu, M.; Rudisill, T.M.; Rauscher, K.J.; Davidov, D.M.; Feng, J. Risk Perceptions of Cellphone Use While Driving: Results from a Delphi Survey. Int. J. Environ. Res. Public Health 2018, 15, 1074. [Google Scholar] [CrossRef] [PubMed]
- Mazloomi, S.; Moradi, M.; Fallahzade, H.; Zare, A.; Khoshakhlagh, A.; Barzegarpur, V. The Study of Dangerous Behavior of Drivers in the Yazd City in 2013. Tolooebehdasht 2016, 14, 14–23. [Google Scholar]
- World Health Organization Road Traffic Injuries. Available online: https://www.who.int/news-room/fact-sheets/detail/road-traffic-injuries (accessed on 27 May 2023).
- NHTSA’s National Center for Statistics and Analysis. Distracted Driving 2020; NHTSA: Washington, DC, USA, 2022.
- Edgar Snyder & Associates Texting and Driving Accident Statistics. Available online: https://www.edgarsnyder.com/resources/texting-and-driving-accident-statistics#:~:text=The%20National%20Safety%20Council%20reports,caused%20by%20texting%20anddriving (accessed on 5 May 2023).
- Ibrahim, J.K.; Anderson, E.D.; Burris, S.C.; Wagenaar, A.C. State Laws Restricting Driver Use of Mobile Communications Devices: Distracted-Driving Provisions, 19922010. Am. J. Prev. Med. 2011, 40, 659–665. [Google Scholar] [CrossRef] [PubMed]
- Zhang, L.; Cui, B.; Yang, M.; Guo, F.; Wang, J. Effect of Using Mobile Phones on Driver’s Control Behavior Based on Naturalistic Driving Data. Int. J. Environ. Res. Public Health 2019, 16, 1464. [Google Scholar] [CrossRef] [PubMed]
- Atchley, P.; Atwood, S.; Boulton, A. The Choice to Text and Drive in Younger Drivers: Behavior May Shape Attitude. Accid. Anal. Prev. 2011, 43, 134–142. [Google Scholar] [CrossRef] [PubMed]
- Li, W.; Gkritza, K.; Albrecht, C. The Culture of Distracted Driving: Evidence from a Public Opinion Survey in Iowa. Transp. Res. Part F Traffic Psychol. Behav. 2014, 26, 337–347. [Google Scholar] [CrossRef]
- Nelson, E.; Atchley, P.; Little, T.D. The Effects of Perception of Risk and Importance of Answering and Initiating a Cellular Phone Call While Driving. Accid. Anal. Prev. 2009, 41, 438–444. [Google Scholar] [CrossRef]
- McKeever, J.D.; Schultheis, M.T.; Padmanaban, V.; Blasco, A. Driver Performance While Texting: Even a Little Is Too Much. Traffic Inj. Prev. 2013, 14, 132–137. [Google Scholar] [CrossRef]
- Reimer, B.; Mehler, B.; Donmez, B. A Study of Young Adults Examining Phone Dialing While Driving Using a Touchscreen vs. a Button Style Flip-Phone. Transp. Res. Part F Traffic Psychol. Behav. 2014, 23, 57–68. [Google Scholar] [CrossRef]
- Huth, V.; Sanchez, Y.; Brusque, C. Drivers’ Phone Use at Red Traffic Lights: A Roadside Observation Study Comparing Calls and Visual–Manual Interactions. Accid. Anal. Prev. 2015, 74, 42–48. [Google Scholar] [CrossRef]
- Albuquerque, F.D.B.; Maraqa, M.A.; Chowdhury, R.; Mauga, T.; Alzard, M. Greenhouse Gas Emissions Associated with Road Transport Projects: Current Status, Benchmarking, and Assessment Tools. Transp. Res. Procedia 2020, 48, 2018–2030. [Google Scholar] [CrossRef]
- Hussain, I.; Wang, H.; Safdar, M.; Ho, Q.B.; Wemegah, T.D.; Noor, S. Estimation of Shipping Emissions in Developing Country: A Case Study of Mohammad Bin Qasim Port, Pakistan. Int. J. Environ. Res. Public Health 2022, 19, 11868. [Google Scholar] [CrossRef] [PubMed]
- Ogunkunle, O.; Ahmed, N.A. Overview of Biodiesel Combustion in Mitigating the Adverse Impacts of Engine Emissions on the Sustainable Human–Environment Scenario. Sustainability 2021, 13, 5465. [Google Scholar] [CrossRef]
- Camargo-Caicedo, Y.; Mantilla-Romo, L.C.; Bolaño-Ortiz, T.R. Emissions Reduction of Greenhouse Gases, Ozone Precursors, Aerosols and Acidifying Gases from Road Transportation during the COVID-19 Lockdown in Colombia. Appl. Sci. 2021, 11, 1458. [Google Scholar] [CrossRef]
- Lee, J.H.; Lim, S. The Selection of Compact City Policy Instruments and Their Effects on Energy Consumption and Greenhouse Gas Emissions in the Transportation Sector: The Case of South Korea. Sustain. Cities Soc. 2018, 37, 116–124. [Google Scholar] [CrossRef]
- Roca-Puigròs, M.; Marmy, C.; Wäger, P.; Beat Müller, D. Modeling the Transition toward a Zero Emission Car Fleet: Integrating Electrification, Shared Mobility, and Automation. Transp. Res. D Transp. Environ. 2023, 115, 103576. [Google Scholar] [CrossRef]
- Zhu, Y.; Ma, H.; Sha, C.; Yang, Y.; Sun, H.; Ming, F. Which Strategy among Avoid, Shift, or Improve Is the Best to Reduce CO2 Emissions from Sand and Gravel Aggregate Transportation? J. Clean. Prod. 2023, 391, 136089. [Google Scholar] [CrossRef]
- Zou, J.; Yang, B. Evaluation of Alternative Marine Fuels from Dual Perspectives Considering Multiple Vessel Sizes. Transp. Res. D Transp. Environ. 2023, 115, 103583. [Google Scholar] [CrossRef]
- Kalita, N.; Xu, Z.; Kumar, A. Application of Software to Study the Impact of Transportation Sectors’ Greenhouse Gas Emissions Reduction on Climate Change. Environ. Prog. Sustain. Energy 2016, 35, 1559–1565. [Google Scholar] [CrossRef]
- Güzel, T.D.; Alp, K. Modeling of Greenhouse Gas Emissions from the Transportation Sector in Istanbul by 2050. Atmos. Pollut. Res. 2020, 11, 2190–2201. [Google Scholar] [CrossRef]
- Sieklicka, A.; Chądzyńska, P.; Iwanowicz, D. Analysis of the Behavior of Vehicle Drivers at Signal-Controlled Intersection Approach While Waiting for a Green Signal—A Case Study in Poland. Appl. Sci. 2022, 12, 133. [Google Scholar] [CrossRef]
- Sharma, N.; Kumar, P.; Dhyani, R.; Ravisekhar, C.; Ravinder, K. Idling Fuel Consumption and Emissions of Air Pollutants at Selected Signalized Intersections in Delhi. J. Clean. Prod. 2019, 212, 8–21. [Google Scholar] [CrossRef]
- Sharma, N.; Advani, M.; Dhyani, R.; Nagar, S.; Chaudhary, H. Reduction in Idling Fuel Losses and Corresponding Emissions Due to Awareness Campaign at the Signalized Intersections in Delhi. Transp. Dev. Econ. 2022, 8, 11. [Google Scholar] [CrossRef]
- García-Herrero, S.; Febres, J.D.; Boulagouas, W.; Gutiérrez, J.M.; Saldaña, M.Á.M. Assessment of the Influence of Technology-Based Distracted Driving on Drivers’ Infractions and Their Subsequent Impact on Traffic Accidents Severity. Int. J. Environ. Res. Public Health 2021, 18, 7155. [Google Scholar] [CrossRef]
- Pope, C.N.; Nwosu, A.; Rudisill, T.M.; Zhu, M. Support for Distracted Driving Laws: An Analysis of Adolescent Drivers from the Traffic Safety Culture Index from 2011 to 2017. Transp. Res. Part F Traffic Psychol. Behav. 2021, 78, 424–432. [Google Scholar] [CrossRef] [PubMed]
- Ezzati Amini, R.; Al Haddad, C.; Batabyal, D.; Gkena, I.; De Vos, B.; Cuenen, A.; Brijs, T.; Antoniou, C. Driver Distraction and In-Vehicle Interventions: A Driving Simulator Study on Visual Attention and Driving Performance. Accid. Anal. Prev. 2023, 191, 107195. [Google Scholar] [CrossRef]
- Benedetti, M.H.; Li, L.; Shen, S.; Kinnear, N.; Delgado, M.K.; Zhu, M. Talking on Hands-Free and Handheld Cellphones While Driving in Association with Handheld Phone Bans. J. Saf. Res. 2022, 83, 204–209. [Google Scholar] [CrossRef]
- Turkish Statistical Institute Address Based Population Registration System Results. 2022. Available online: https://data.tuik.gov.tr/Bulten/Index?p=Adrese-Dayali-Nufus-Kayit-Sistemi-Sonuclari-2022-49685 (accessed on 27 May 2023).
- Turkish Statistical Institute Motor Vehicles Statistics. April 2023. Available online: https://data.tuik.gov.tr/Bulten/Index?p=Motorlu-Kara-Tasitlari-Nisan-2023-49434 (accessed on 27 May 2023).
- Eby, D.W. Chapter 5—Naturalistic Observational Field Techniques for Traffic Psychology Research. In Handbook of Traffic Psychology; Porter, B.E., Ed.; Academic Press: San Diego, CA, USA, 2011; pp. 61–72. ISBN 978-0-12-381984-0. [Google Scholar]
- National Center for Statistics and Analysis. Driver Electronic Device Use in 2021; NHTSA: Washington, DC, USA, 2022.
- Rahman, S.M.A.; Masjuki, H.H.; Kalam, M.A.; Abedin, M.J.; Sanjid, A.; Sajjad, H. Impact of Idling on Fuel Consumption and Exhaust Emissions and Available Idle-Reduction Technologies for Diesel Vehicles—A Review. Energy Convers. Manag. 2013, 74, 171–182. [Google Scholar] [CrossRef]
- Barlow, T.; Cairns, O. Idling Action Research-Review of Emissions Data Report Details; The National Academies of Sciences, Engineering, and Medicine: Washington, DC, USA, 2020. [Google Scholar]


| CO2 (g/min) | CO2 (L/min) | NOX (g/min) | NOX (L/min) | Consumption (L/min) | |
|---|---|---|---|---|---|
| Small Car (1.0 TSI—Petrol) | 19.13 | 10.39 | 0.01 | 0.007 | 0.00835 |
| Family/Estate Car (1.6 TDI—Diesel) | 16.61 | 9.02 | 0.045 | 0.030 | 0.0067 |
| Van Car (1.5—Diesel) | 27.77 | 15.08 | 0.021 | 0.014 | 0.0261 |
| Intersection | Number of Drivers | Number of Drivers Using Mobile Phones | Mobile Phone Usage Percentage (%) | Lost Time Due to Mobile Phone Usage (s) |
|---|---|---|---|---|
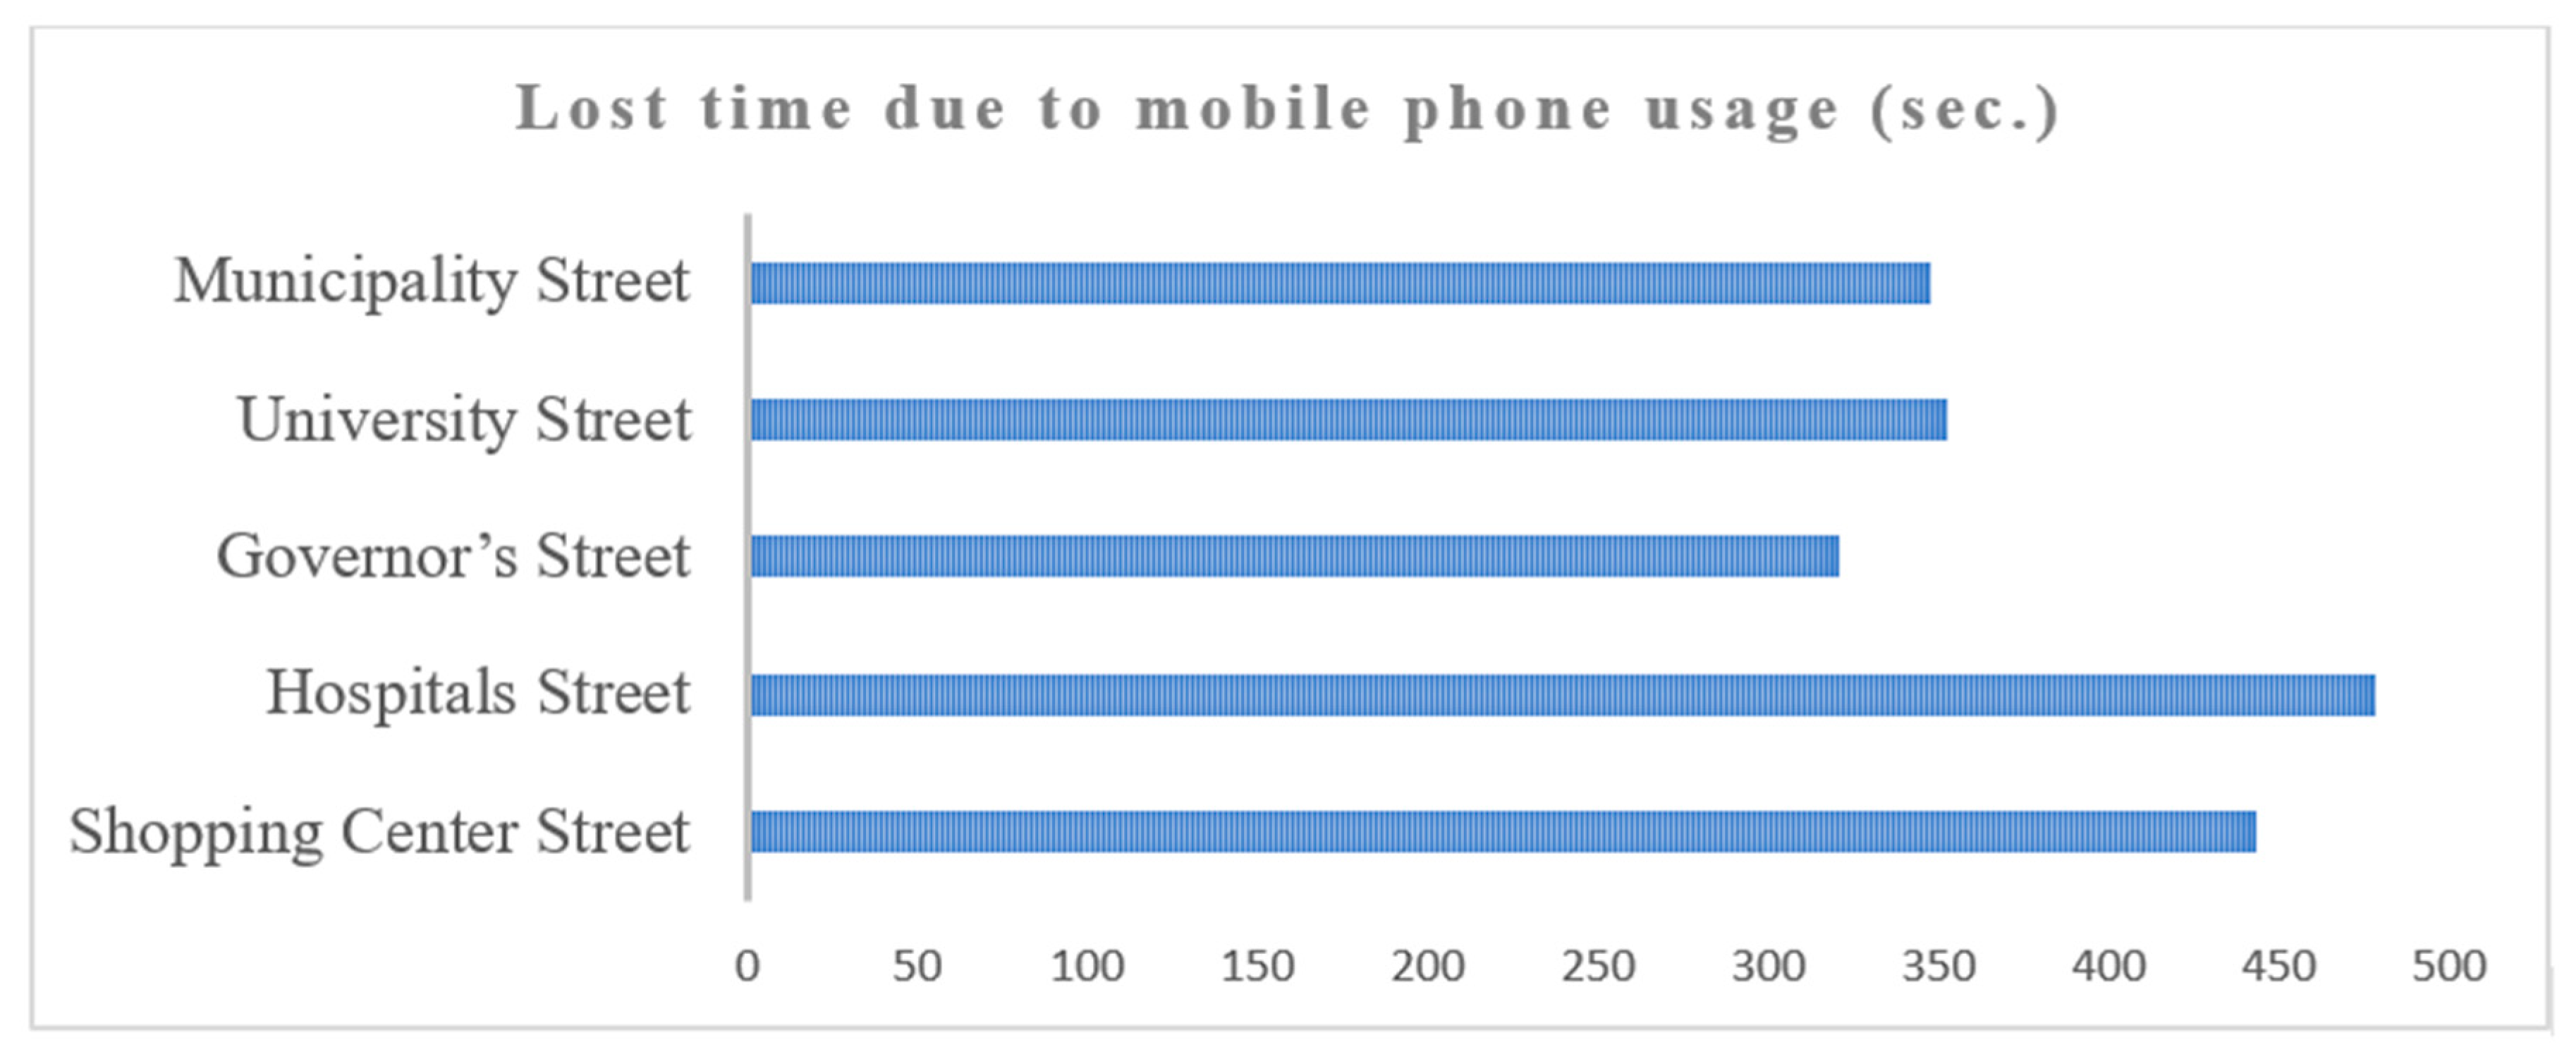
| Shopping Center Street | 692 | 119 | 17.20 | 443.4 |
| Hospitals Street | 984 | 195 | 19.81 | 478.5 |
| Governor’s Street | 723 | 108 | 14.94 | 320.8 |
| University Street | 684 | 123 | 17.98 | 352.2 |
| Municipality Street | 806 | 124 | 15.38 | 347.5 |
| Total | 3889 | 669 | 17.20 | 1942.4 |
| 17.00–17.15 | 17.15–17.30 | 17.30–17.45 | 17.45–18.00 | Total | Total Observation Mean | |||
|---|---|---|---|---|---|---|---|---|
| (s) | (s) | (s) | (s) | (s) | (s) | n Sample Size | SD | |
| Shopping Center Street | 107.86 | 130.57 | 111.82 | 93.25 | 443.5 | 7.39 | 692 | 1.553 |
| Hospitals Street | 122.74 | 109.67 | 108.74 | 137.34 | 478.49 | 7.97 | 984 | 1.022 |
| Governor’s Street | 89.97 | 67.23 | 76.5 | 87.08 | 320.78 | 5.35 | 723 | 1.243 |
| University Street | 103.99 | 87.28 | 83.39 | 77.76 | 352.42 | 5.87 | 684 | 1.192 |
| Municipality Street | 89.25 | 79.92 | 86.47 | 91.88 | 347.52 | 5.79 | 806 | 1.152 |
| Type of Violation | |||||
|---|---|---|---|---|---|
| Talking | Touchscreen | Take Picture | Total Violation | No Violation | |
| Hospitals Street | 16 | 17 | 6 | 39 | 168 |
| Governor’s Street | 15 | 14 | 4 | 33 | 153 |
| University Street | 16 | 18 | 4 | 38 | 154 |
| Shopping Center Street | 13 | 16 | 4 | 33 | 126 |
| Municipality Street | 14 | 15 | 3 | 32 | 140 |
| Total | 74 | 80 | 21 | 175 | 741 |
| Number of Vehicles | Talking (%) | Touchscreen (%) | Take Picture (%) | Total Violation (%) | |
|---|---|---|---|---|---|
| Hospitals Street | 207 | 7.73 | 8.21 | 2.90 | 18.84 |
| Governor’s Street | 186 | 8.06 | 7.53 | 2.15 | 17.74 |
| University Street | 192 | 8.33 | 9.38 | 2.08 | 19.79 |
| Shopping Center Street | 159 | 8.18 | 10.06 | 2.52 | 20.75 |
| Municipality Street | 172 | 8.14 | 8.72 | 1.74 | 18.60 |
| Total | 916 | 8.08 | 8.73 | 2.29 | 19.10 |
| Intersection | Number of Drivers | Lost Time Due to Mobile Phone Usage (s) | Fuel Consumption (L) |
|---|---|---|---|
| Shopping Center Street | 692 | 443.4 | 0.111 |
| Hospitals Street | 984 | 478.5 | 0.119 |
| Governor’s Street | 723 | 320.8 | 0.080 |
| University Street | 684 | 352.2 | 0.088 |
| Municipality Street | 806 | 347.5 | 0.087 |
| Total | 3889 | 1942.4 | 0.485 |
| Intersection | Number of Drivers | Lost Time Due to Mobile Phone Usage (s) | NOX (g) | CO2 (g) |
|---|---|---|---|---|
| Shopping Center Street | 692 | 443.4 | 0.184 | 157.41 |
| Hospitals Street | 984 | 478.5 | 0.199 | 169.83 |
| Governor’s Street | 723 | 320.8 | 0.133 | 113.86 |
| University Street | 684 | 352.2 | 0.146 | 125.09 |
| Municipality Street | 806 | 347.5 | 0.144 | 123.35 |
| Total | 3889 | 1942.4 | 0.806 | 689.54 |
Disclaimer/Publisher’s Note: The statements, opinions and data contained in all publications are solely those of the individual author(s) and contributor(s) and not of MDPI and/or the editor(s). MDPI and/or the editor(s) disclaim responsibility for any injury to people or property resulting from any ideas, methods, instructions or products referred to in the content. |
© 2023 by the authors. Licensee MDPI, Basel, Switzerland. This article is an open access article distributed under the terms and conditions of the Creative Commons Attribution (CC BY) license (https://creativecommons.org/licenses/by/4.0/).
Share and Cite
Alemdar, K.D.; Kayacı Çodur, M.; Codur, M.Y.; Uysal, F. Environmental Effects of Driver Distraction at Traffic Lights: Mobile Phone Use. Sustainability 2023, 15, 15056. https://doi.org/10.3390/su152015056
Alemdar KD, Kayacı Çodur M, Codur MY, Uysal F. Environmental Effects of Driver Distraction at Traffic Lights: Mobile Phone Use. Sustainability. 2023; 15(20):15056. https://doi.org/10.3390/su152015056
Chicago/Turabian StyleAlemdar, Kadir Diler, Merve Kayacı Çodur, Muhammed Yasin Codur, and Furkan Uysal. 2023. "Environmental Effects of Driver Distraction at Traffic Lights: Mobile Phone Use" Sustainability 15, no. 20: 15056. https://doi.org/10.3390/su152015056
APA StyleAlemdar, K. D., Kayacı Çodur, M., Codur, M. Y., & Uysal, F. (2023). Environmental Effects of Driver Distraction at Traffic Lights: Mobile Phone Use. Sustainability, 15(20), 15056. https://doi.org/10.3390/su152015056