Article

Implications of Changing Urban Land Use on the Livelihoods of Local People in Northwestern Bangladesh

1
Department of Environment and Development Studies, United International University, Dhaka 1212, Bangladesh
2
Institute of Development Studies and Sustainability, United International University, Dhaka 1212, Bangladesh
3
School of Science, Technology and Engineering, University of the Sunshine Coast, Maroochydore DC, QLD 4556, Australia
4
Department of Earth and Environment, Florida International University, Miami, FL 33199, USA
*
Author to whom correspondence should be addressed.
Sustainability 2023, 15(15), 11769; https://doi.org/10.3390/su151511769
Submission received: 20 May 2023 / Revised: 24 July 2023 / Accepted: 28 July 2023 / Published: 31 July 2023
(This article belongs to the Special Issue Urban Sprawl and Sustainable Land Use Planning)

Abstract

:
Bangladesh is one of the emerging economies in the Global South, and rapid urbanization is the driving force behind its economic development. Urban growth and development are closely associated with land use/land cover changes in any area, which sometimes negatively affect the livelihood and wellbeing of local people. We investigated the impacts of urban land use changes on the local people of northwestern Bangladesh using Nilphamari Sadar as a case study site. In order to identify land use patterns and variations in land cover, a 10-year period of land use/land cover changes from 2000 to 2020 was monitored using satellite imagery and the supervised classification method. Primary data were collected through household surveys and focus group discussions. Our analysis suggests that land use has changed over the past 20 years in the study area. As a result, the land area under settlements has substantially increased from 19 square kilometers in 2000 to 48 square kilometers in 2020. Waterbodies were 24 square kilometers in 2010, dropping to 4 square kilometers in 2020, whereas croplands decreased to 218 square kilometers in 2020 from 259 square kilometers in 2000. These changes have proportionately and adversely affected the lives and livelihoods of the local people by altering their longstanding traditional livelihood options, limiting their access to common resources, failing to adapt to new environmental arrangements and economic structures, and creating new forms of vulnerability. We suggest that urban planning processes should consider local people’s interests with the entitlement of local and marginalized people to the benefits generated by urbanization.

1. Introduction

The current era could be labeled as ‘‘the age of the city’’ and urban growth is a seemingly unstoppable process [1]. Urbanization has been a widely recognized catalyst of development in modern days, where it is defined as the expansion of cities with proportional modification of the urban and rural population as well as the transformation of traditional rural economies to industrial ones [2]. On the other hand, it is also known as an economic, social, and environmental process that generally occurs in developing countries [3]. More than half of the world’s population now lives in urban areas, and it is expected that by 2050, this percentage will exceed 60 percent, with the majority of growth occurring in Asia and Africa [4].
Bangladesh has been experiencing a rapidly growing urban population in recent decades. Since gaining its independence, the urban population has increased at an average annual rate of 6 percent [5]. In 1971, only 8 percent of the total population lived in cities, but this had increased to 31 percent in 2011, and as of 2021, it reached 39 percent [6]. By 2050, urban areas are expected to host 58 percent of the country’s total population [7]. Bangladesh is focusing on building more and more urban centers and industrial hubs across the country, as urban centers are considered the engine of a country’s economic development [8]. While urbanization offers employment, better housing and education, the transfer of knowledge and technology, and ready markets for agricultural products, the strain on the environment as well as on the existing social services and infrastructure in densely populated areas is also a significant concern [9]. These processes lead to modifications in local land use patterns owing to the rapid urban population growth resulting in an increased demand for urban land for infrastructure development, housing facilities, and other commercial uses [10]. Scholars such as D’Odorico et al. (2018) argue that urbanization historically has a close association with industrialization which introduces industrial-oriented economic growth by transforming agriculture-based livelihood options into non-agriculture-centered livelihood opportunities [11]. However, others have criticized the rapid settlement on open land, particularly agricultural land, during the peak of industrialization in the nineteenth century [12].
Urbanization impacts not only agriculture, but also other livelihood options, such as fishing and livestock farming. In this study, local people refer to people who have lived in the area from generation to generation, while livelihoods encompass various sources of earnings, including agriculture, fishing, and livestock rearing, among others. Numerous studies have been conducted in relation to urbanization and land use changes in major cities of Bangladesh. For example, the study of Arifeen et al. [13] determined the land use and land cover changes in Gazipur near central Bangladesh, and the study of Moniruzzaman et al. [14] analyzed the impacts of urbanization on the land use and land cover changes in Khulna city in southwestern Bangladesh [14]. The study of Kafy et al. [15] identified future land use/land cover changes and their impacts on land surface temperatures in Rajshahi Division, Bangladesh. The study of Hassan and Nazem [16] focused on the land use changes in Port City Chittagong, and the study of Dewan and Yamaguchi [17] on Greater Dhaka, which found that a significant growth of built-up areas from 1975 to 2003 resulted in a significant decrease in the extent of waterbodies, cultivated land, vegetation, as well as wetlands.
Though Nilphamari Sadar is a rapidly growing urban area and the commercial hub of northwestern Bangladesh, no previous studies examined this region. Additionally, the impacts of urbanization on the local population have received limited scholarly attention, despite being adversely affected agents. As current trends of urbanization affect the local people by losing cultivable land and longstanding traditional livelihood sources, failing to adapt to new environmental arrangements and economic structures, and competing for limited resources or having limited access to the common resources, which is referred to as freely available resources without restrictions by Park (2001) [18], this paper attempted to investigate how urbanization affects the land use changes and how those changes impact the livelihoods of local people. Currently, up-to-date empirical insights regarding the impacts of urbanization on the local people are scarce in Bangladesh, particularly in the current forms of development of the urban areas. In order to gain a clear picture of the prevailing challenges of urbanization on the livelihoods of local people, our study employed a mixed method approach in Nilphamari Sadar, located in Northwestern Bangladesh.
Bangladesh is officially expected to depart from the group of least developed countries (LDCs) by 2024 as a testimony to its consistent economic progress over the last decades [19]. As a result, the country concentrates on expanding its urban centers to accelerate its economic progress. The overemphasis on economic aspects of urbanization often overlooks its environmental and social dimensions. Furthermore, despite Nilphamari being an emerging urban area, the impacts of urbanization on the local people have yet to be assessed. Consequently, our study attempted to fill that gap, first by evaluating the land use changes caused by urbanization between 2000 and 2020 using satellite data, and afterward by assessing how those changes affected the livelihoods of the local people in the study area. We believe our study will provide critical insights into urban development and its impact on local land use and livelihoods in Global South, which will be useful for relevant government agencies and urban planners for sustainable urban planning and development.

2. Materials and Methods
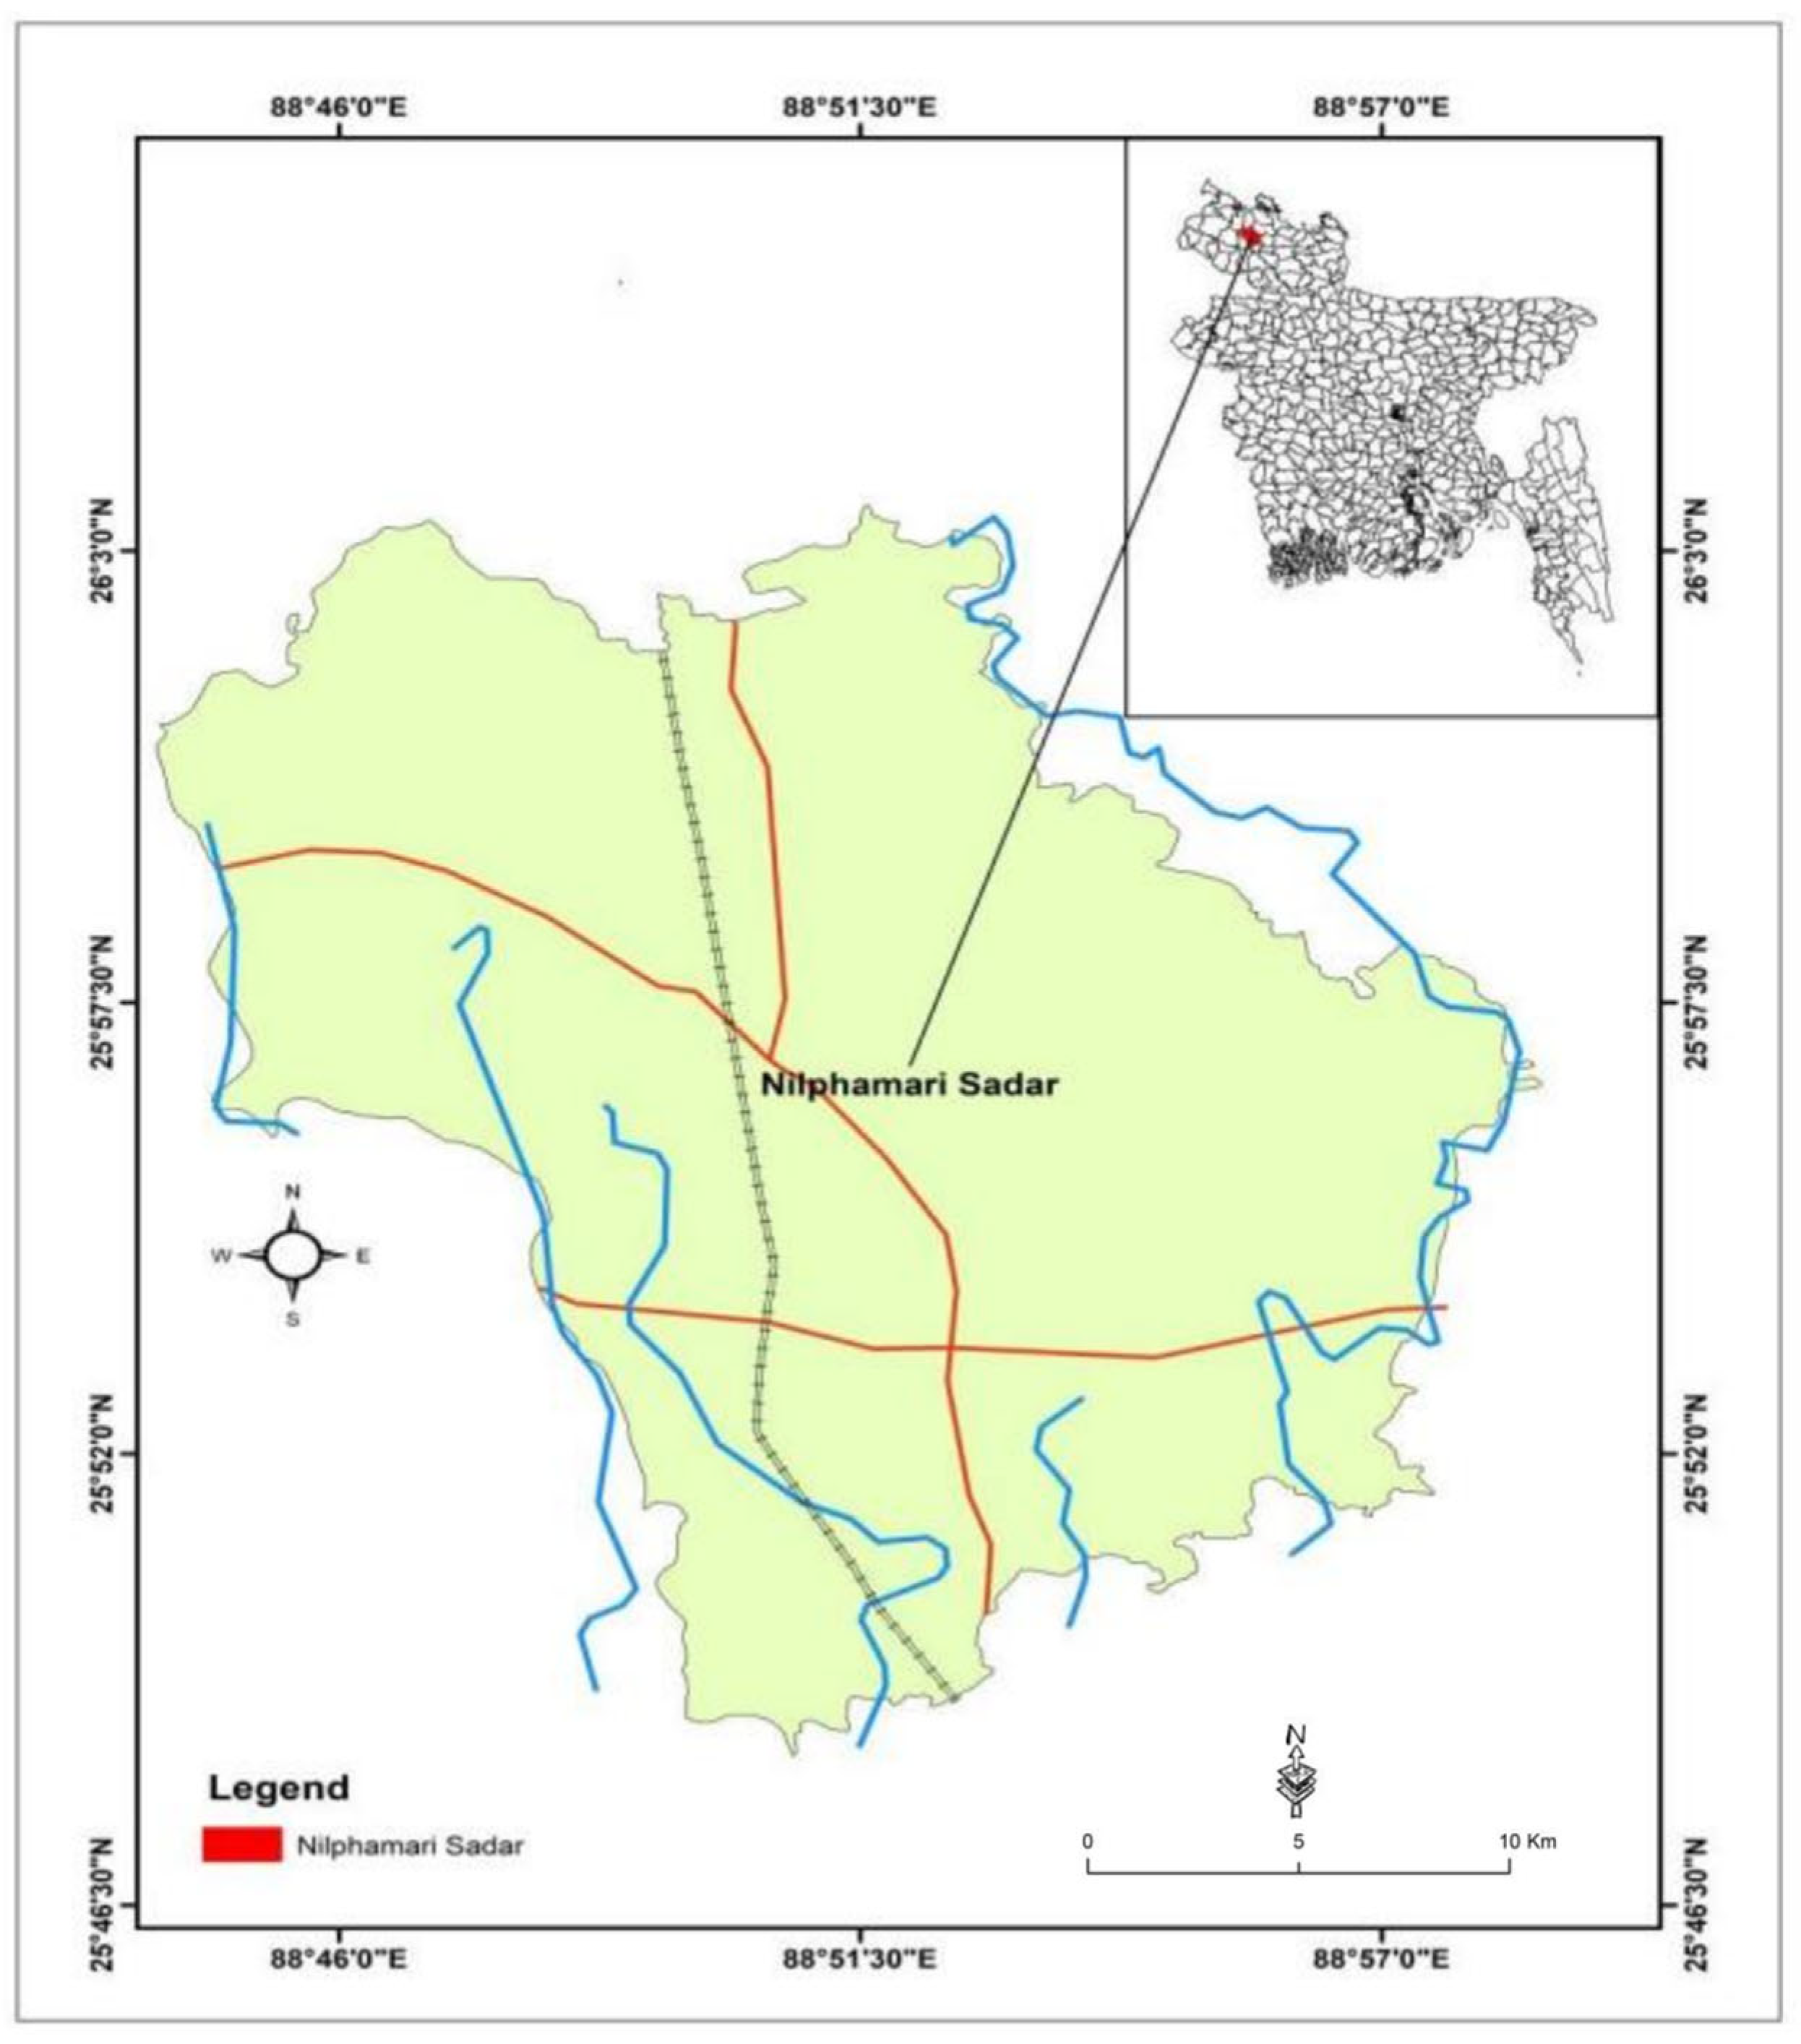
2.1. The Study Area

Nilphamari Sadar is one of Bangladesh’s fastest-growing urban areas in Northwestern Bangladesh, and we purposively selected the area for the present study. Geographically, Nilphamari Sadar is located between 25°48′ and 26°03′ north latitudes and between 88°44′ and 88°59′ east longitudes (see Figure 1). It is bounded by Domar and Jaldhaka upazilas on the north, Saidpur upazila on the south, Kishoreganj and Jaldhaka upazilas on the east, Khansama and Debiganj upazilas on the west. The total area of the study area is approximately 373.09 square kilometers [20]. The total population of this area is approximately 435,162, and it has been increasing rapidly [21]. The city, established in 1972 as a municipality, serves as the regional commercial hub for the nearby areas and is regarded for its long history and culture [22]. The 2001-established Uttara Export Processing Zone (EPZ) has made a significant contribution to the unceasing growth of the urban population in the area. Before the establishment of EPZ, people were economically lagged behind due to the lack of diversified economic activities. The EPZ has been significantly contributing by accelerating the diversification of livelihood opportunities for the populace [23]. The gathering of outsiders (either from different parts of the district or from different parts of the country) is a visible scenario in recent years, especially with the establishment of EPZ. Therefore, the urban population is increasing in this area.

2.2. Data Collection Method

A mixed research approach, referring to the use of two or more methods in a single research, including qualitative and quantitative approaches [24,25], was employed in this study to explore urban land use change and its impact on local livelihoods. This approach has been utilized to increase the accuracy and level of confidence of our research [25,26]. To identify land use change in Nilphamari Sadar in 2000, 2010 and 2020, we primarily used satellite imagery and supervised classification methods. In order to understand the impacts of land use changes on livelihoods, peoples’ perception is required [27]. For this reason, we conducted a stakeholders’ consultation with different professional and occupational groups where we tried to get a preliminary picture of the land use changes and their impacts on the local livelihoods in the area. After obtaining a primary understanding of the effects of land use changes on the livelihoods of local people, we finalized the household survey questionnaire, which included socioeconomic characteristics, land ownership status, and land use patterns of the respondents, as well as respondents’ experiences of the land use change over the past two decades. In line of our research objectives, it also included the respondents’ perspectives on occupational changes resulting from land use changes and the reasons for the changes to tackle the research question. After finalizing the questionnaire, we conducted household surveys among 200 (n = 200) households with men or women, whoever were available in the households during the survey and who were aged above 35 years. Finally, focus group discussion (FGD) was utilized in this study with an open-ended questionnaire to investigate the dimensions and diversity of changes in the livelihoods of local people and validate the data obtained from household surveys.
We collected quantitative data to get a clear picture of the situation, while qualitative data helped us to clarify the prevailing situations in the area. We surveyed 200 respondents (n = 200) using a semi-structured questionnaire between February 2022 and November 2022. Due to time and budget constraint, we limited our sample size to 200 respondents. Apart from that, we interviewed only one respondent from each household who was aged above 35 years and resided in the area for generations. Nevertheless, for a population of 435,162 persons, a sample size of 208 is ideal (with a confidence level of 85% and a margin of error of 5%), which is close to our sample size of 200. Additionally, we conducted two focus group discussions (one with male respondents and the other with female respondents) in the area consisting of 12 respondents each. The participants in the focus group discussion (FGD) were selected based on their age groups, particularly targeting individuals who were aged above 50 years. This age group was chosen due to their presumed higher level of experience and knowledge regarding land use change. Professions and occupations of the respondents were also taken into consideration, encompassing individuals from government agencies, semi-governmental organizations, non-governmental organizations, community leaders, farming communities, day laborers, and auto van pullers. This diverse range of respondents was chosen to capture a comprehensive understanding of their viewpoints regarding local land use changes and the resulting effects on the local population. The FGD respondents were not selected from the household survey respondent. However, each FGD was conducted by a facilitator with an assistant for collecting notes and recording the FGD sessions, which were later transcribed into text form. All the quantitative data which were collected from the field were processed using a computer application IBM SPSS 25. We followed standard ethical protocol, and all the respondents were up-to-date about the study objectives. We also took the verbal and written consent of the respondents before interviewing them, and the findings of the study were verified by the respondents after analyzing the data.

2.3. Land Use/Land Cover (LULC) Changes Analysis

For land use/land cover classification and change analysis of Nilphamari Sadar, satellite images were used using supervised classification applying the random forest classifier algorithm on Google Earth Engine (GEE) platform. A 10-year interval of land use and land cover changes was monitored using satellite imagery and the supervised classification method. For the supervised classification, monthly composite images of three specific years (2000, 2010, and 2020) were used. For the year 2020, Harmonized Sentinel-2 MSI: Multispectral Instrument, Level-2A dataset was used. Sentinel-2 is a high-resolution, multi-spectral imaging mission widely used for land monitoring studies (waterbodies, vegetation cover, soil, etc.). The image resolution of Sentinel-2 is 10 m. For the year 2010 and 2000, the USGS Landsat 5 TM Collection 2 Tier 1 Raw Scenes dataset has been used. The resolution of this dataset is 30 m. We used ArcGIS 10.8 for LULC changes analysis and mapping. Table 1 lists the basic characteristics of the major land use/land cover types used in the present study.

2.4. Data Analysis

As mentioned earlier, we collected both qualitative and quantitative data for the present study. Quantitative data mostly include household demographic and land use/land cover information, while qualitative data include their perceptions about urbanization in the area as well as vulnerabilities they have been experiencing. We used descriptive statistics to interpret the data. Data were analyzed using IBM SPSS 25 statistical software, particularly for measuring frequencies, percentage, mean, and standard deviations. The FGD data were collected into text and transcribed forms and analyzed using traditional qualitative data analysis software (N-Vivo, Version 20, Melbourne, Australia) to inductively discover important emergent themes from the data from each FGD. LULC changes classification was performed using the random forest classifier method on the Google Earth Engine (GEE) platform, while for LULC changes analysis and map representation, we used ArcGIS 10.8 GIS software.

3. Results

3.1. Socio-Economic Condition of the Respondents

Among the 200 respondents, there were 143 males and 57 females. Most of the female respondents were housewives, with only a few working outside the home. On the other hand, the majority of male respondents were engaged in business, which employed 37.06 percent of all male respondents. Many of them were service workers (22.38 percent) and day laborers (18.88 percent). Only 4.9 percent of the respondents were employed in agriculture and the remaining (11.17 percent) were involved in various activities, particularly agriculture, auto van and rickshaw pulling, construction work, etc. (see Table 2). Only 5.6 percent of the respondents remain unemployed. The average monthly income of respondents is 18,000 taka. Furthermore, 11 percent of the respondents had education up to level 5 (primary education), 41 percent had education from level 6 to level 12 (secondary education and higher secondary education), and 35.5 percent had tertiary education. The remaining 12.5 percent of the respondents did not have formal education or schooling. Additionally, 82 percent of the respondents dwelled in their own houses, and 18 percent of the respondents resided in rental houses. Sixty-four percent of the households were reported to have family members between 2 and 5 individuals, 25.5 percent of the households had family members between 6 and 8 members, and the remaining 10.5 percent of the households had family members of more than 8 individuals. In terms of living standards, 49 percent of respondents stated that they were well off maintaining high living standards, and 31 percent of respondents specified they were not well off. Nevertheless, their living standards were gradually improving, and they had enough wealth for daily survival. On the other hand, 20 percent of the respondents claimed they did not have enough wealth for daily survival and depended on daily earnings. It became quite challenging or uncertain to manage meals for the family if they were unable to manage earnings for a day.

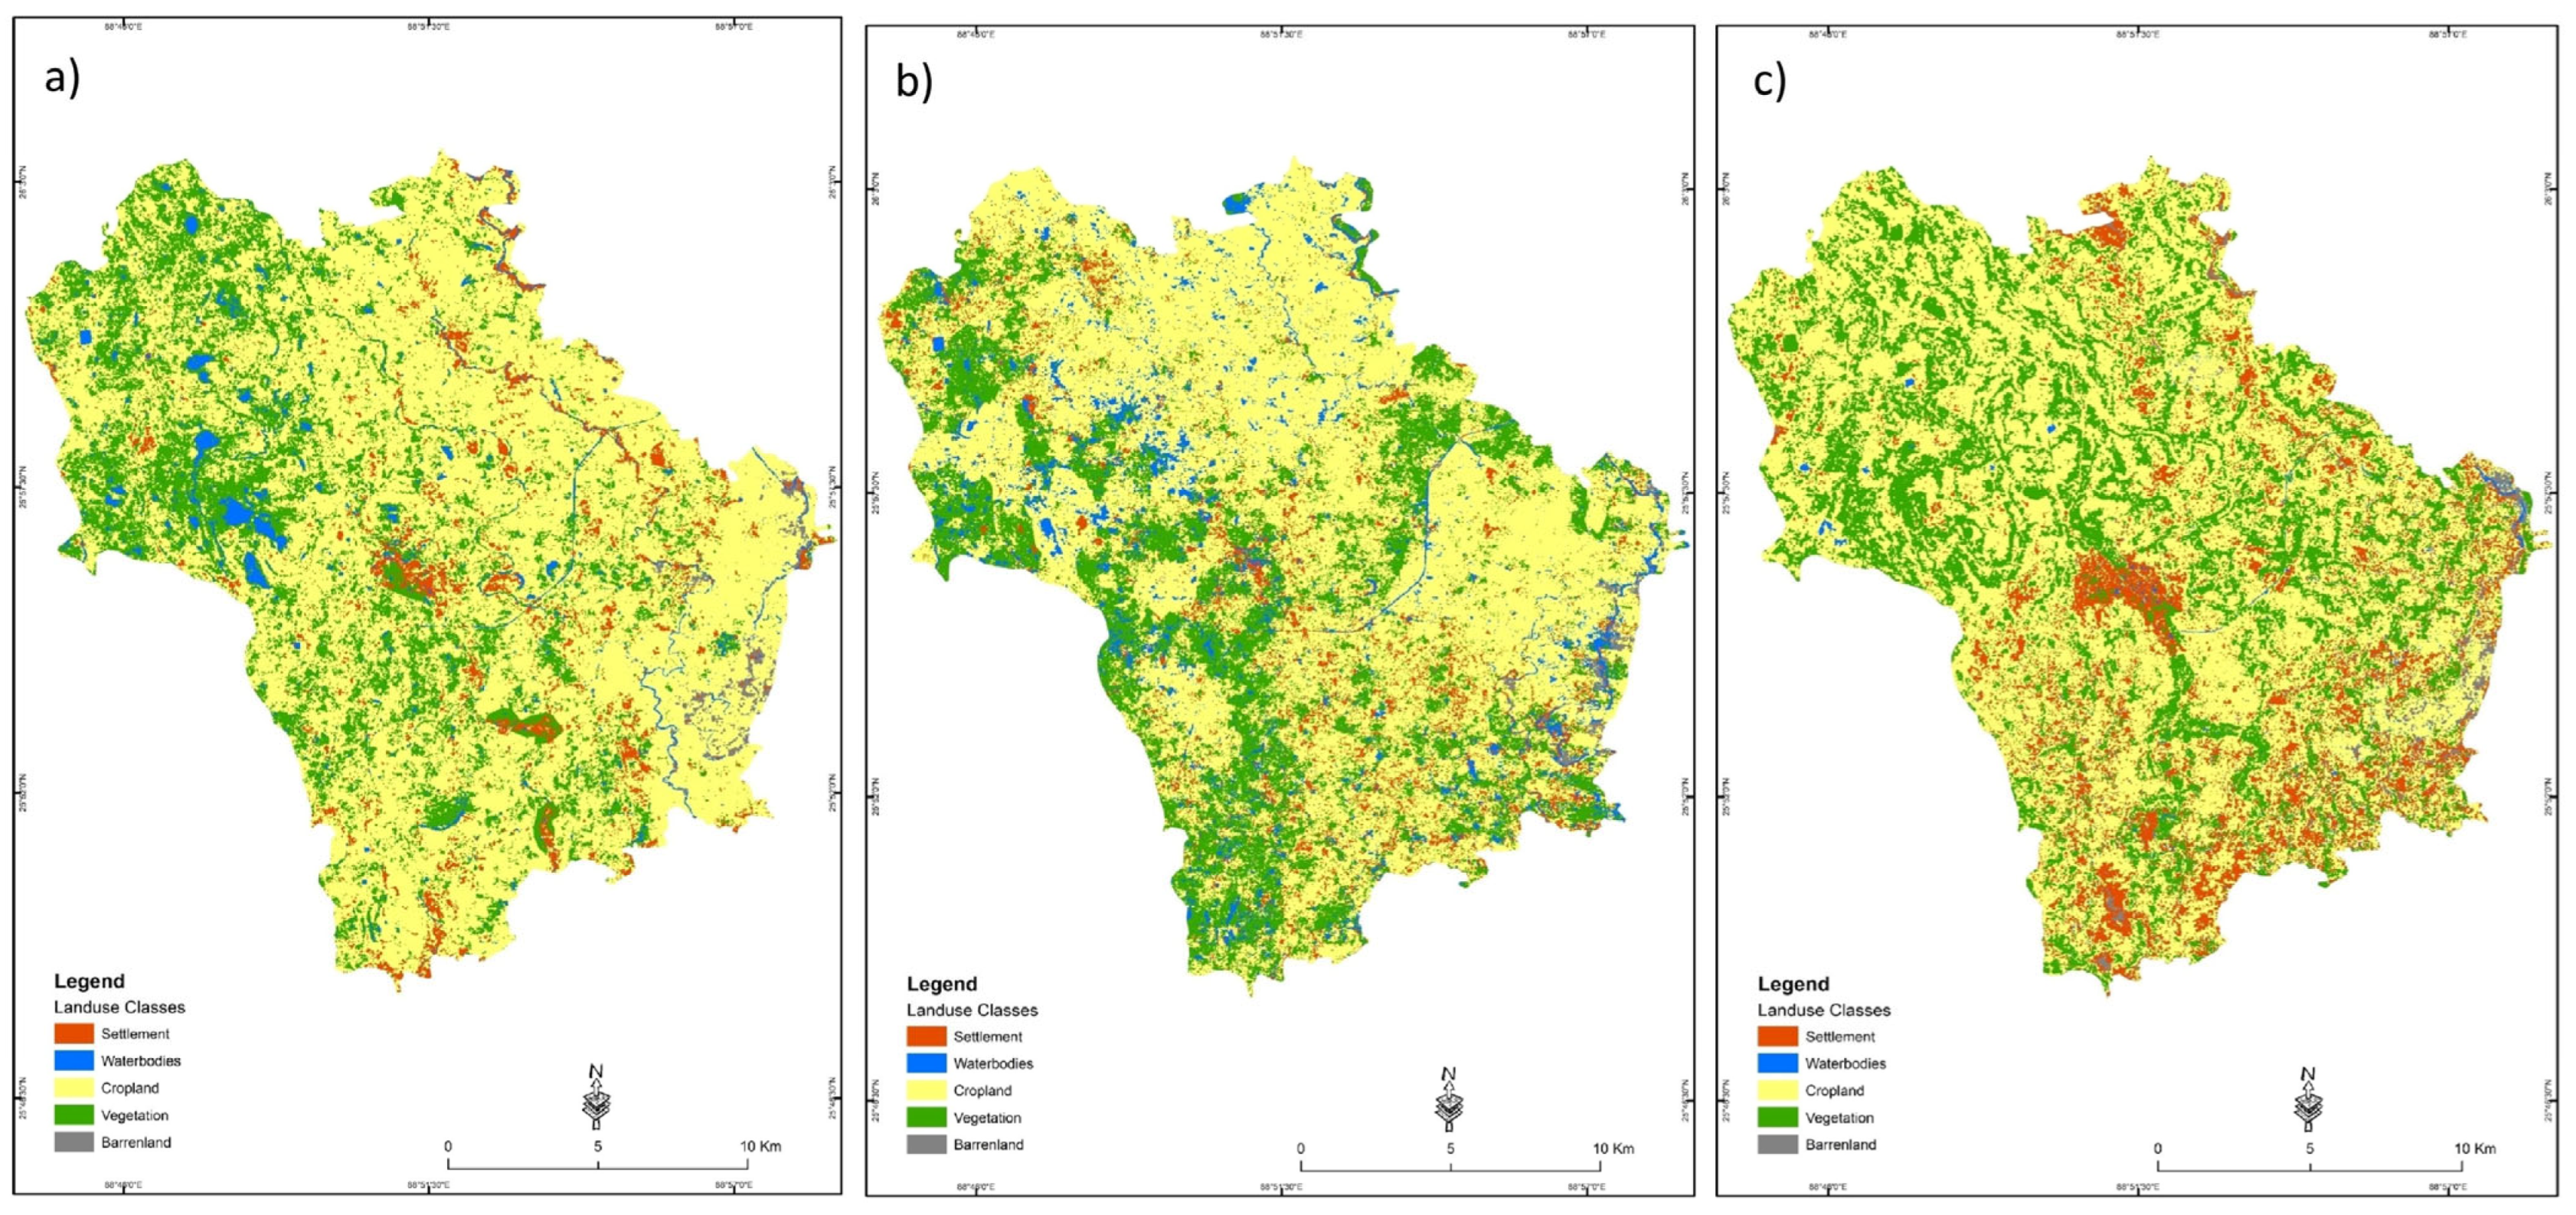
3.2. Land Use and Land Cover Changes in Nilphamari Sadar

In 2000, cropland and vegetation were the predominant land use/land cover in Nilphamari Sadar. The cropland area was 259 square kilometers, comprising 68.88 percent of the total area, and the vegetation cover was about 83 square kilometers (approximately 22 percent). On the other hand, the area covered by waterbodies (i.e., ponds, rivers, and other wetlands) was 11 square kilometers (2.93 percent), and settlements were approximately 20 (5 percent) square kilometers. A trivial amount of barren land was also present in 2000 in Nilphamari Sadar, about 2 square kilometers (approximately 1 percent) (see Figure 2).
In 2010, cropland still comprised the predominant land use in our study area, with a total area of about 238 square kilometers (63 percent). The vegetations were the second highest land use in the district, 87 square kilometers (23.37 percent), and waterbodies increased significantly in 2010, which was 24 square kilometers (6.38 percent). The settlement area also increased in 2010, and total settlement areas were about 24 square kilometers (6.38 percent). On the other hand, barren land has decreased in the area, nearly 0.45 percent of the total land compared to 1 percent in 2000 (see Figure 2).
Though major land use, croplands gradually reduced from 2000 to 2010 and 2020. In 2020, the total cropland area was 219 square kilometers (58.78 percent). Settlement or built-up areas have significantly increased to 48 square kilometers (12.77 percent). The vegetation was 99 (22.07 percent) square kilometers. The number of waterbodies has significantly decreased, and waterbodies comprised only 4 square kilometers (approximately 1 percent) in 2020, which was 24 square kilometers in 2010. The barren area increased to 4 square kilometers (see Figure 2).
Over the years, the croplands and waterbodies have decreased substantially (see Figure 3). Quite interestingly, the vegetation coverage increased over the same period. In 2000, total waterbodies were approximately 11 square kilometers, which increased to around 24 square kilometers in 2010. In 2020, the number of waterbodies decreased 6 times less than it was in 2010. Again, the croplands were 68.88 percent of the overall area in 2000 which has reduced to 58 percent in 2020. There has been a significant increase in the settlements or built-up areas over the last 20 years. In 2000, 5.32 percent of the total area was settlement, which increased to 6.38 percent in 2010, and 12.77 percent in 2020 (see Figure 3).

3.3. Household Ownership and Land Use of the Respondents between 2000 and 2022

This study identified a substantial transformation in the land ownership status of the respondents over the past two decades. The average land ownership of the respondents in 2000 was 0.99 (standard deviation, SD ± 1.44) acres which has been reduced to 0.26 (SD ± 1.87) acres in 2022. Furthermore, Table 3 shows that the majority of respondents (78.79%) identified agriculture as their primary land use in 2000, whereas 15.15 percent of the land was used for dwellings. Table 3 also reveals that in 2022, the majority of respondents (40.38%) stated dwelling as the predominant land use, followed by agricultural usage (23.07%) and rental use (19.75%). The results of our study indicate that most of the land owned by households in 2000 was utilized for agricultural purposes. In contrast, it is observed that the respondents possessed a relatively smaller quantity of land in 2022 compared to the year 2000, where most lands were primarily utilized for dwelling purposes.

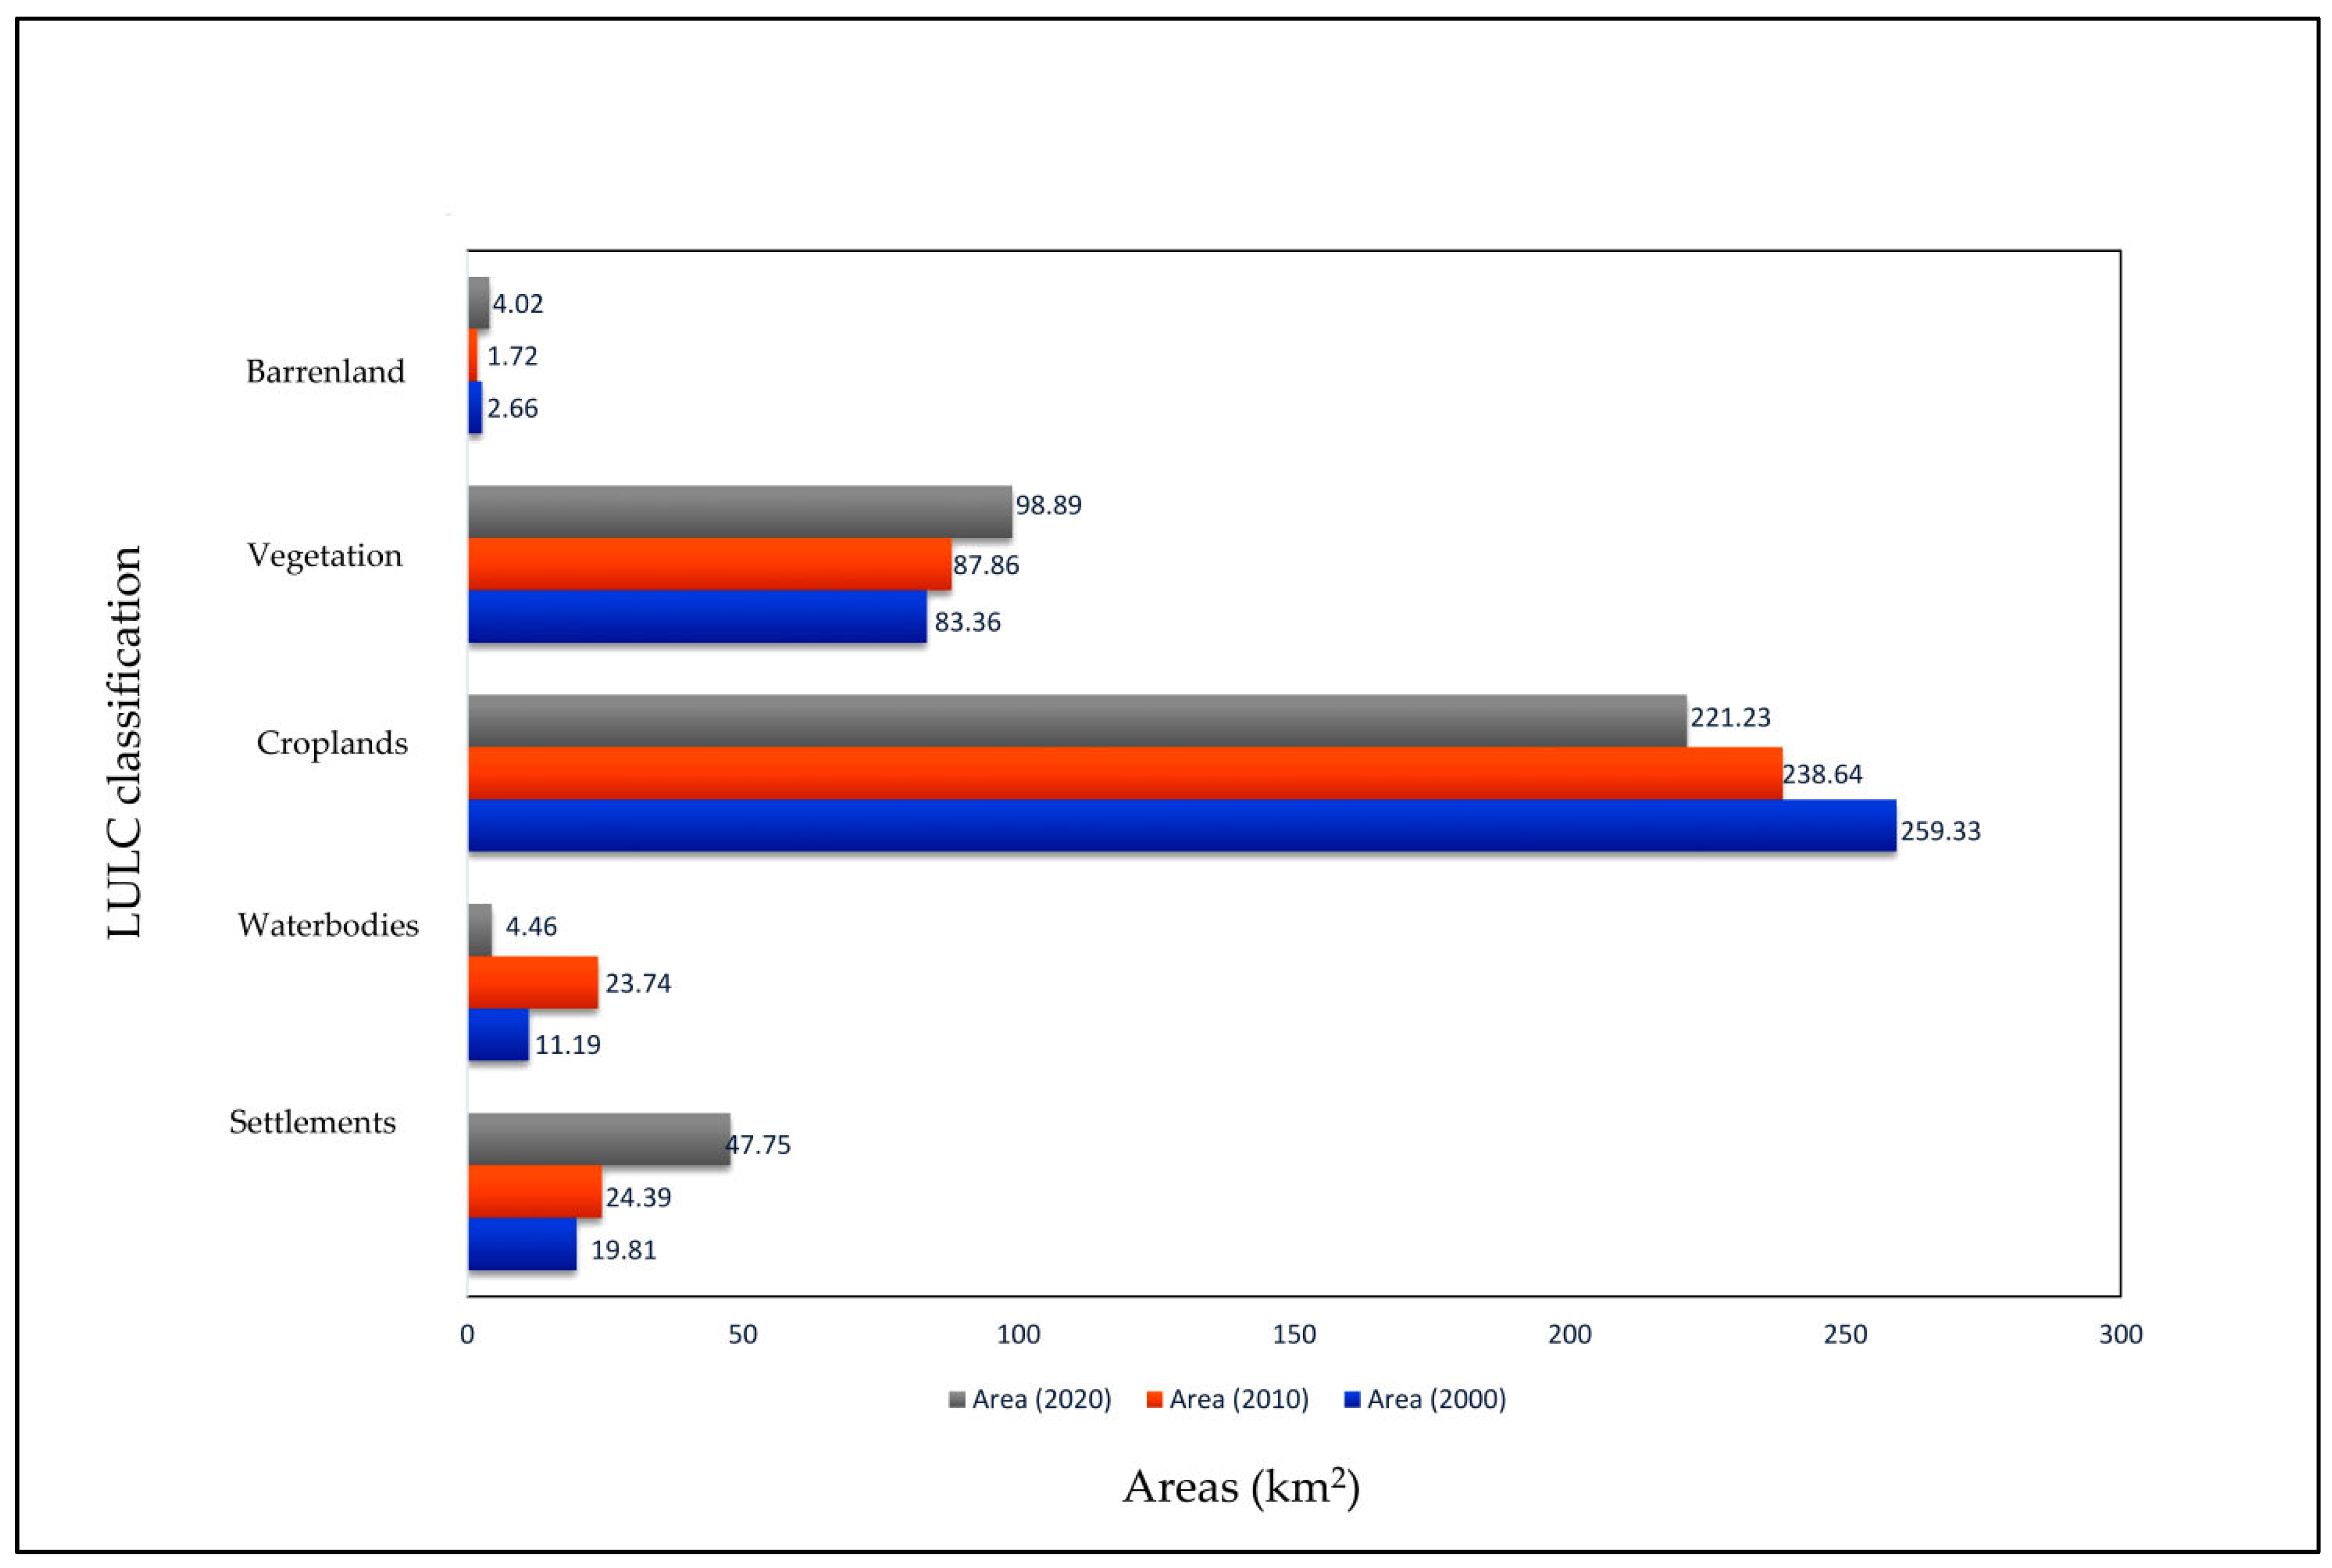
3.4. Relationship between Settlement, Croplands, and Waterbodies Changes in 2000, 2010, and 2020

Table 4 shows the results of correlation analysis for settlements, agricultural land, and waterbodies. The table shows that there are significant negative correlations between settlements and croplands (r = −0.9) and between settlements and waterbodies (r = −0.66). It indicates that an increase in settlements leads to a commensurately large decrease in croplands. Similarly, increased settlements lead to significant decreases in waterbodies.

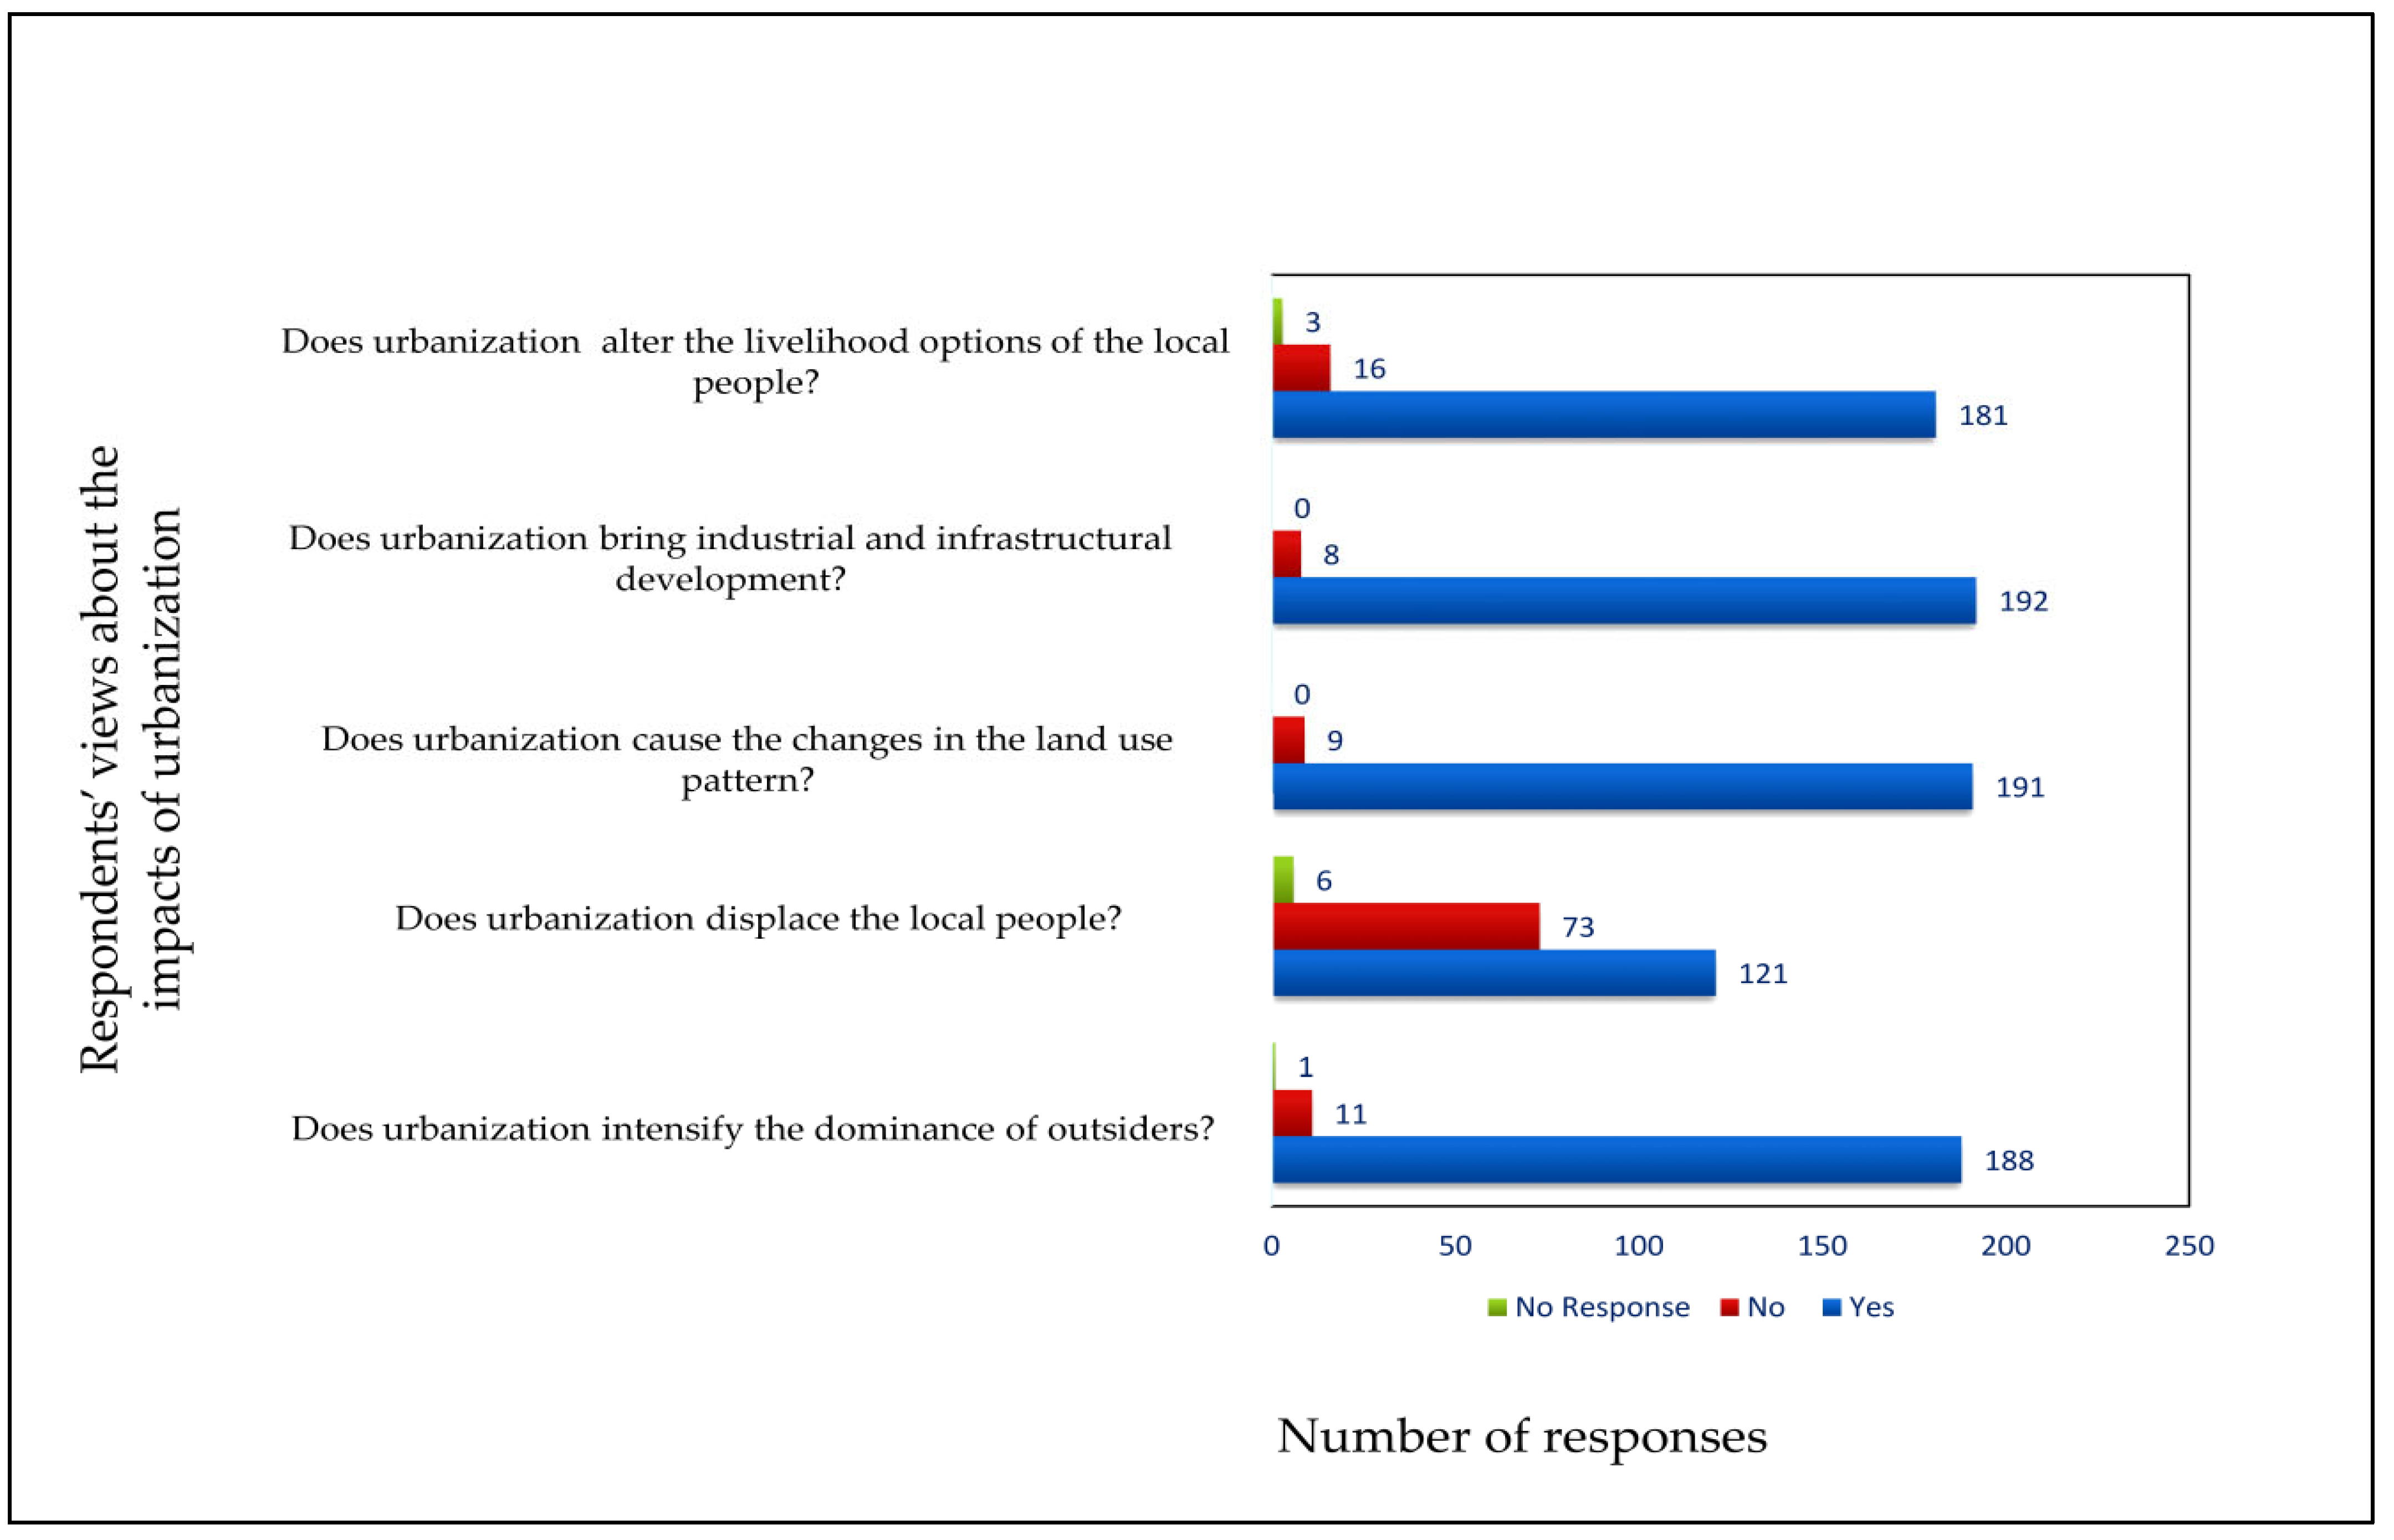
3.5. Implications of Changing Urban Land Use on Local Livelihood

To explore the study objective, we identified the amount of land owned by individual households, land use patterns, and occupations of the respondents in 2000 and 2022. We also demonstrated respondents’ views about the impacts of urbanization on the local people and respondents’ views regarding “how does urban land use change instigate displacement of the local people?”.

3.5.1. Occupational Interchanges and Livelihood Displacements of the Local People Caused by Land Use Transformation

As mentioned earlier, business accounted for the majority of respondents’ employment in 2022, followed by services and day laboring, with agriculture employed by only 4.9% of respondents. Agriculture, on the other hand, was occupied by 43.36 percent of respondents in 2000, followed by service (13.99%), business (10.49%), and fishing (9.09%). The findings of the study indicate that land use change in the study area resulted in occupational changes over the last two decades. In 2000, people were able to engage in fishing and agriculture, which is no longer feasible in 2022 due to a lack of arable land and water resources.
Furthermore, among the 200 respondents we interviewed, 191 claimed that the land use patterns have changed in the last 20 years in the study area primarily through the development of settlements and commercial areas, which signifies the findings of LULC changes from satellite imagery data (see Figure 2, Figure 3 and Figure 4). The data collected from focus group discussions are consistent with the findings derived from the analysis of satellite imagery and household surveys. Nevertheless, the rapid transformation of croplands and waterbodies into settlement areas and commercial uses has substantially altered the labor market scenario. Two decades back, the people’s livelihoods were agriculture dominant, e.g., people used to produce agricultural crops, catch fish, and rear cattle and livestock (see Table 5). Our field data show that 181 respondents claimed that urbanization and urban land use change have adversely affected the livelihoods of the local people. For instance, a fisherman community in Nilphamari Sadar depended primarily on the local waterbodies. However, as there is now limited opportunity for fishing due to waterbody shrinkage, this community has disappeared from the study area. They either left their longstanding traditional occupations for new ones, such as hawkering, shopkeeping, tea selling, servants, and construction workers or they moved to other areas of the district where fishing was available. Furthermore, due to the transformation of croplands into settlement areas, many farmers had to leave agricultural practices and related activities, such as cow rearing and livestock farming. They were either engaged in different activities, e.g., rickshaw pulling, hawkering, shopkeeper, tea selling, servants, and construction workers or they moved to the urban peripheries or rural areas where they can continue agriculture.
To understand the impacts of urbanization on the local people, when asked, “How does urbanization impact the local people?” one FGD participant stated,
“Urbanization affects the local people negatively. It transformed the land use patterns of the locality. We used to practice agriculture up till the beginning of 21st and it was our generational practice. Many were dependent on fishing for livelihoods. But urbanization changes the arrangements of environments. Agricultural practices have been reducing and fisherman community are disappearing due to the land use changes and commercial land uses.”
Urbanization and land use changes present the prospect of diverse livelihood options with uncertainty by diminishing traditional and certain livelihood opportunities claimed by all the respondents. As reasoned by a FGD respondent,
“Urbanization provided us huge livelihood options with uncertainty. Urbanization provides opportunities to earn money, which is required to purchase sustenance for survival. If there is no means for us to earn money, we must starve. Nonetheless, our previous profession (agriculture) provided food for us for twelve months.”
In 2000, before the convergence of the local people to current urban forms (particularly rapid changes in land use patterns and hasty industrial and infrastructural development), people of the study area were self-reliant. They did not depend on the market for their food, like vegetables and rice, and they were mostly produced at the homestead level. However, as prices of the lands crept up, they built houses by selling their cultivable lands. Since agricultural production in high-priced land is not cost-effective on the one hand, agriculture did not meet the instant gratifications of the money on the other. When they build multistoried houses, they can rent them to other people, which provides a certain amount of money every month. This tendency of the local people brought intensity to the changes in the land use patterns.

3.5.2. Intensification of Industrial and Infrastructural Development and Acceleration of Outsiders’ Migration

The transition from an agricultural-based economy to a manufacturing-based economy in Nilphamari Sadar can be attributed to urban land use changes driven by the high profitability of land. Our research findings indicate that 96 percent (192 out of 200) expressed the belief that urbanization has led to the development of industries and infrastructure in Nilphamari Sadar (see Figure 4). As shown in Table 3, around 17 percent of the lands belonging to the respondents were utilized for industrial purposes in 2022, which was a notable increase from the mere 0.5 percent recorded in the year 2000. Furthermore, 188 respondents claimed that the presence of diverse employment opportunities in industrial sectors, coupled with the availability of infrastructure facilities, serves as a strong incentive for individuals from outside the region to migrate to this area (see Figure 4). The predominant group of migrants comprises individuals originating from adjacent sub-districts within Bangladesh, including Dimla, Domar, Jaldhaka, and others. Moreover, individuals hailing from diverse geographical locations of the country are relocating to this locality with the intention of seeking employment opportunities within the industries, particularly in the Uttara Export Processing Zone (UEPZ) located in Nilphamari Sadar.

3.5.3. Dominance of Outsiders Displaced Local People

As mentioned earlier, there is a growing prevalence of individuals from outside the study area, and their influence is having adverse consequences on the local people. Based on the survey responses of 121 individuals, it has been observed that the existing trends of urbanization have significantly expedited the process of displacing local people through various means (see Figure 4). A total of 33.06 percent of 121 respondents in the survey expressed the view that the decrease in agricultural land has a notable impact on the displacement of local people. Additionally, 21.49 percent of the respondents indicated that the limited opportunities of traditional livelihood options, such as fishing, cattle rearing, and livestock farming, have played a role in the displacement of local populations. Moreover, the amalgamation of local populations with the process of urbanization has led to a rise in expenses related to sustaining one’s livelihood. As a result, a significant proportion of respondents, specifically 17.36 percent, reported that individuals who were unable to sustain themselves due to their high expenses have relocated to the outskirts of urban areas or rural regions. Furthermore, alterations in land use patterns have resulted in the restriction of local communities’ ability to access shared (common) natural resources, particularly waterbodies and open areas. According to the survey finding, 10.74 percent of the participants expressed the belief that the lack of access to shared resources played a role in expediting the displacement of the indigenous (local) people. Moreover, a number of individuals residing in the area exhibit a tendency to engage in the sale of their lands at elevated market values. Following the sale of land at elevated prices, individuals exhibit a tendency to relocate to rural regions, as reported by 13.22 percent of the survey participants (see Figure 5).

4. Discussion

The present study aimed to uncover the land use changes caused by urbanization and their impacts on the livelihoods of local people. It is evident that urban centers often expand over the most productive and agricultural land [29]. However, the waterbodies and cropland in Nilphamari Sadar have decreased significantly due to the great expansion of human settlements and built-up areas between 2000 and 2020. Our study replicated other studies carried out in different parts of Bangladesh, which showed that urbanization leads to changes in the land use pattern, see [13,14,16,17]. Our study also found a significant negative correlation between the changes in settlements and croplands and between settlements and waterbodies, which resulted in the professional interchanges in the local people.
Moreover, the findings of this study reflect the pre-existing literature, e.g., Alam [30], in his study in Dhaka city, showed that the development of housing projects affects livelihoods, and the study of Hasan et al. [31] in coastal Bangladesh identified the impact of land use change on livelihoods. This study, however, is a significant piece of evidence for a comprehensive understanding of the impact of urban land use change on the livelihoods of local people in the study area.
Alemineh [32] found that urban growth and development negatively affect livelihoods. Similarly, our study findings showed that the substantial reduction in the waterbodies between 2010 and 2020 in the study area forced local fishermen to change their livelihood options, and the constraints of croplands restrict farmers from their longstanding and traditional agricultural practices. The study conducted by Alam [30] in Dhaka City found that the development of housing projects caused the loss of agriculture, fishing, and livestock. Our study also signifies the similar findings that urban land use changes limited the opportunities of agricultural practices, fishing, and livestock rearing. We are not arguing that urbanization has not created new employment opportunities in our study areas. Rather, our standpoint is that despite urbanization, new employment opportunities in the Export Processing Zone (EPZ), industries, service sector, educational institutions, and business organizations have been created; these are grabbed by the migrants from different areas as new urban livelihood options require some professional skills.
According to the United Nations [33], urbanization and industrialization have two ways of interaction where urbanization contributes to the industrial growth on the one hand; industrialization increases the gathering of a huge population caused by better social and economic opportunities compared to rural areas [34]. As urban areas are the centers of economic activity [1], people move to urban areas for work-related reasons, such as seeking a new job, better income, or transfer in services [35]. Similarly, Nilphamari Sadar is the district’s capital and major business center [36]. Our research found that job opportunities in the industries, better income, and opportunities to engage in business are the motivating factors for outsiders to migrate to Nilphamari Sadar.
This study revealed that current trends of urbanization are replacing the local population. Owing to a decrease in arable land and traditional sources of livelihood, limited access to common resources, an increase in household expenditure, and the sale of land at attractive prices, local people have been dispossessed from their traditional dwellings, resulting in many locals moving to peri-urban areas or to rural areas, where they can continue their traditional livelihood practices. It was argued by Sassen [37,38] that economic restructuring had played a significant role in reshaping urban spaces, and neoliberal urbanization is characterized by economic restructuring and the relocation of marginalized communities to the urban peripheries. The results of the study signify Sassen’s argument.
However, Bangladesh is focusing on the development of urban centers considering its economic benefits and achievement of the UN Sustainable Development Goal (SDG) 11 of inclusive, safe, resilient, and sustainable cities [39]. If the local people are negatively impacted by urbanization, the achievement of the goal will be severely encountered. Additionally, the relocation of locals resulting from urban land use changes would act as a hindrance to the development of inclusive and sustainable urbanization. Our viewpoint is that urban planning processes must take local people’s interests into account, and the local people should be entitled to share the benefits generated by urbanization. This study also recommends that the government should protect urban croplands and waterbodies in order to sustain the local people’s inter-generational livelihood options.

5. Conclusions

The results of the study showed that urbanization had intensified the settlement areas reducing the croplands and waterbodies. The expansion of urban settlement was found to be negatively affecting croplands and waterbodies in our study, with direct implications for local livelihoods. Furthermore, the reduction in waterbodies and croplands brought professional interchanges in the study area. The results showed that the loss of croplands and the reduction in traditional sources of livelihood like agriculture and fishing, failure to adapt to new economic structures, competition for limited resources, and limited access to open resources are all the negative effects of current forms of urban growth on the local people which relocated them to urban peripheries or rural areas. Despite the fact that urbanization created opportunities for new employment, the utmost benefits are grabbed by outsiders, as those opportunities mostly required specific professional skills. The economic implications of urbanization grew Nilphamari Sadar as a growing urban center, but the local people have yet to reap the full benefits. The overemphasis on the economic aspects for accelerating economic growth intensifies the settlement areas reducing croplands and waterbodies. Government should emphasize the conservation of waterbodies and agricultural lands to keep urban areas in a natural setting and to protect certain occupations, e.g., fishing and farming. Similarly, the urbanization planning process should consider the welfare of local people to build an inclusive and sustainable urban development.

Author Contributions

Conceptualization, M.M.R. and H.H.; methodology, M.M.R., H.H. and S.A.M.; software, M.M.R.; validation, M.M.R. and H.H.; formal analysis, M.M.R., H.H. and S.A.M.; investigation, M.M.R., H.H. and S.A.M.; resources, M.M.R., H.H. and S.A.M.; data curation, M.M.R., H.H. and S.A.M.; writing—original draft preparation, M.M.R.; writing—review and editing, H.H. and S.A.M.; visualization, M.M.R. and S.A.M.; supervision, M.M.R.; project administration, M.M.R. and H.H.; funding acquisition, M.M.R. and H.H. All authors have read and agreed to the published version of the manuscript.

Funding

This project was funded by the Institute for Advanced Research (IAR) of United International University, Bangladesh (research project code: UIU/IAR/02/2021/MD/16).

Institutional Review Board Statement

Not applicable.

Informed Consent Statement

Not applicable.

Acknowledgments

We would like to acknowledge Salma Begum for her constructive comments and suggestion, which have substantially improved the manuscript. We also express our sincere gratitude to the reviewers, whose comments greatly contributed to the finalization of the manuscript. We thank the respondents on the basis of which we were able to conduct this study. We would also like to thank the Institute for Advanced Research (IAR) of United International University (UIU) for providing financial support to carry out this study.

Conflicts of Interest

The authors declare no conflict of interest.

References

  1. Girardet, H. People and Nature in an Urban World. One Earth 2020, 2, 135–137. [Google Scholar] [CrossRef] [Green Version]
  2. Davis, K. The urbanization of the human population. Sci. Am. 1965, 213, 40–53. [Google Scholar] [CrossRef]
  3. Mahfuza, S.H.; Islam, M.S. Impacts of Urbanization on Land Cover Pattern in Bangladesh: A Downscaled Approach for Chuadanga District. J. Environ. Sci. Nat. Res. 2019, 12, 37–42. [Google Scholar] [CrossRef]
  4. Zipperer, W.C.; Northrop, R.B.; Andreu, M.G. Urban Development and Environmental Degradation. Oxf. Res. Encycl. Environ. Sci. 2020. [Google Scholar] [CrossRef]
  5. World Bank. Dhaka: Improving Living Conditions for the Urban Poor: Bangladesh Development Series. 2007. Available online: https://documents1.worldbank.org/curated/en/938981468013830990/pdf/404240BD0Dhaka10ALSO03582401PUBLIC1.pdf (accessed on 20 March 2023).
  6. World Bank. Urban Population (Percent of Total Population)-Bangladesh | Data. Available online: https://data.worldbank.org/indicator/SP.URB.TOTL.IN.ZS?end=2021&locations=BD&start=1971&view=chart (accessed on 20 April 2023).
  7. UN. World Urbanization Prospects 2018. (2017). Available online: https://population.un.org/wup/country-profiles/ (accessed on 5 May 2023).
  8. Girard, L.F. The Human Sustainable City: Challenges and Perspectives from the Habitat Agenda; Ashgate: Farnham, UK, 2003. [Google Scholar]
  9. Rees, W.E. Ecological footprints and appropriated carrying capacity: What urban economics leaves out. Environ. Urban. 2003, 4, 121–130. [Google Scholar] [CrossRef]
  10. Aguilar, A.G. Peri-urbanization, illegal settlements, and environmental impact in Mexico City. In Cities; Elsevier: Amsterdam, The Netherlands, 2008; Volume 25, pp. 133–145. [Google Scholar] [CrossRef]
  11. D’Odorico, P.; Davis, K.F.; Rosa, L.; Carr, J.A.; Chiarelli, D.; Dell’Angelo, J.; Gephart, J.; MacDonald, G.K.; Seekell, D.A.; Suweis, S.; et al. The global food-energy-water nexus. Rev. Geophys. 2008, 56, 456–531. [Google Scholar] [CrossRef]
  12. Nuissl, H.; Siedentop, S. Urbanisation and Land Use Change. In Sustainable Land Management in a European Context; Weith, T., Barkmann, T., Gaasch, N., Rogga, S., Strauß, C., Zscheischler, J., Eds.; Springer: Berlin/Heidelberg, Germany, 2021; pp. 75–99. [Google Scholar] [CrossRef]
  13. Arifeen, H.M.; Phoungthong, K.; Mostafaeipour, A.; Yuangyai, N.; Yuangyai, C.; Techato, K.; Jutidamrongphan, W. Determine the Land-Use Land-Cover Changes, Urban Expansion and Their Driving Factors for Sustainable Development in Gazipur Bangladesh. Atmosphere 2021, 12, 1353. [Google Scholar] [CrossRef]
  14. Moniruzzam, M.; Roy, A.; Bhatt, C.M.; Gupta, A.; An NT, T.; Hassan, M.K. Impact Analysis of Urbanization on Land Use Land Cover Change for Khulna City, Bangladesh Using Temporal Landsat Imagery. Int. Arch. Photogramm. Remote Sens. Spat. Inf. Sci. 2018, XLII-5, 757–760. [Google Scholar] [CrossRef] [Green Version]
  15. Kafy, A.A.; Rahman, M.S.; Faisal, A.; Hasan, M.K.; Islam, M.M. Modelling future land use land cover changes and their impacts on land surface temperatures in Rajshahi, Bangladesh. Remote Sens. Appl. Soc. Environ. 2020, 18, 100314. [Google Scholar] [CrossRef]
  16. Hassan, M.M.; Nazem MN, I. Examination of land use/land cover changes, urban growth dynamics, and environmental sustainability in Chittagong city, Bangladesh. Environ. Dev. Sustain. 2016, 18, 697–716. [Google Scholar] [CrossRef]
  17. Dewan, A.; Yamaguchi, Y. Land use and land cover change in Greater Dhaka, Bangladesh: Using remote sensing to promote sustainable urbanization. Appl. Geogr. 2009, 29, 390–401. [Google Scholar] [CrossRef]
  18. Park, C.C. The Environment: Principles and Applications; Psychology Press: London, UK, 2001. [Google Scholar]
  19. Razzaque, A.M.; Akib, H.; Rahman, J. Bangladesh’s Graduation from the Group of LDCs: Potential Implications and Issues for the Private Sector; Bangladesh Enterprise Institute: Dhaka, Bangladesh, 2020. [Google Scholar]
  20. Banglapedia. Nilphamari Sadar Upazila. Available online: https://en.banglapedia.org/index.php/Nilphamari_Sadar_Upazila (accessed on 5 April 2023).
  21. BBS. Population and Housing Census 2011. Zila Report: Nilphamari. Available online: http://203.112.218.65:8008/WebTestApplication/userfiles/Image/PopCenZilz2011/Zila_Nilphamari.pdf (accessed on 20 March 2023).
  22. SFD. Nilphamari Municipality. 2022. Available online: https://sfd.susana.org/about/worldwide-projects/city/279-nilphamari-municipality (accessed on 20 April 2023).
  23. BEPZA. Glance Tour on Uttara EPZ. Available online: https://www.bepza.gov.bd/public/storage/upload/brochure/211230035312-8963Uttarapercent20EPZ.pdf (accessed on 15 April 2023).
  24. Knappertsbusch, F.; Langfeldt, B.; Kelle, U. Mixed-Methods and Multimethod research. In De Gruyter eBooks; De Gruyter academic publishing: Berlin, Germany, 2021; pp. 261–272. [Google Scholar] [CrossRef]
  25. Alexander, V.D.; Thomas, H.; Cronin, A.; Fielding, J.; Moran-Ellis, J. Mixed methods. Res. Soc. Life 2001, 3, 125–144. [Google Scholar]
  26. Kelle, U. Sociological Explanations between Micro and Macro and the Integration of Qualitative and Quantitative Methods. Hist. Soc. Res. 2001, 2, 17. [Google Scholar] [CrossRef]
  27. Lahai, M.; Kabba, V.T.S.; Mansaray, L.R. Impacts of land-use and land-cover change on rural livelihoods: Evidence from eastern Sierra Leone. Appl. Geogr. 2022, 147, 102784. [Google Scholar] [CrossRef]
  28. Dewan, A.; Yamaguchi, Y. Using remote sensing and GIS to detect and monitor land use and land cover change in Dhaka Metropolitan of Bangladesh during 1960–2005. Environ. Monit. Assess. 2008, 150, 237–249. [Google Scholar] [CrossRef] [PubMed]
  29. Satterthwaite, D.; McGranahan, G.; Tacoli, C. Urbanization and its implications for food and farming. Philos. Trans. R. Soc. B 2010, 365, 2809–2820. [Google Scholar] [CrossRef]
  30. Alam, J. Rapid urbanization and changing land values in mega cities: Implications for housing development projects in Dhaka, Bangladesh. Bdg. J. Glob. South 2018, 5, 1–19. [Google Scholar] [CrossRef] [Green Version]
  31. Hasan, M.H.; Newton, I.H.; Chowdhury, M.A.; Esha, A.A.; Razzaque, S.; Hossain, M.J. Land Use Land Cover Change and Related Drivers have Livelihood Consequences in Coastal Bangladesh. Earth Syst. Environ. 2023, 7, 541–559. [Google Scholar] [CrossRef]
  32. Alemineh, Y.T. Livelihood Changes, and Related Effects of Urban Expansion on Urban Peripheral Communities: The Case of Gondar City: ANRS, Ethiopia. J. Poverty Investig. Dev. 2018, 45, 50–56. Available online: https://www.iiste.org/Journals/index.php/JPID/article/download/43506/44822 (accessed on 5 June 2023).
  33. UN. Urbanization and Industrialization for Africa’s Transformation: Opportunities and Policy Priorities. Available online: https://hdl.handle.net/10855/23996 (accessed on 20 May 2023).
  34. Khan, A.A. Rural-Urban Migration and Urbanization in Bangladesh. Geogr. Rev. 2017, 72, 4. [Google Scholar] [CrossRef]
  35. Biswas, R.K.; Kabir, E.; Khan, H.T.A. Causes of Urban Migration in Bangladesh: Evidence from the Urban Health Survey. Popul. Res. Policy Rev. 2019, 38, 593–614. [Google Scholar] [CrossRef]
  36. GoB. Environmental Impact Assessment Report. Vertical Extention of Shakha Masa Bazar under Nilphamari Municipality (CIP-01). Available online: https://www.google.com.hk/url?sa=t&rct=j&q=&esrc=s&source=web&cd=&cad=rja&uact=8&ved=2ahUKEwiUzfHJ8LeAAxVb82EKHRZaDTQQFnoECAkQAQ&url=https%3A%2F%2Fbmdf.portal.gov.bd%2Fsites%2Fdefault%2Ffiles%2Ffiles%2Fbmdf.portal.gov.bd%2Fpage%2Fecaca1f9_2608_4359_80d3_8ada0f89ce73%2FEnvironmental%2520Assessment%2520Report%2520of%2520Vertical%2520extension%2520of%2520Municipal%2520Market%2520%2528Vertical%2520Extension%2520of%2520Shakha%2520Masa%2520Bazar%2529%2520under%2520Nilphamari.pdf&usg=AOvVaw1_nyhIwZCzhQlbXehRcOB2&opi=89978449 (accessed on 15 April 2023).
  37. Sassen, S. The Global City, 2nd ed.; Princeton University Press: Princeton, NJ, USA, 2001. [Google Scholar]
  38. Sassen, S. Cities in a World Economy, 3rd ed.; Pine Forge Press: Thousand Oaka, CA, USA, 2006. [Google Scholar]
  39. World Bank. Inclusive Cities. Available online: https://www.worldbank.org/en/topic/inclusive-cities (accessed on 15 April 2023).
Figure 1. Location map of the study area in Northwestern Bangladesh.
Sustainability 15 11769 g001
Figure 2. LULC map of Nilphamari Sadar in 2000 (a), 2010 (b), and 2020 (c).
Sustainability 15 11769 g002
Figure 3. Changes in LULC in Nilphamari Sadar between 2000 and 2020.
Sustainability 15 11769 g003
Figure 4. Impacts of urbanization on the lives and livelihoods of local people in Nilphamari Sadar.
Sustainability 15 11769 g004
Figure 5. Reasons for the displacement of local people due to urbanization. Percentage was calculated among 121 individual responses.
Sustainability 15 11769 g005
Table 1. Descriptions of the land use classification.
Land Use TypeDescriptions
Settlement Residential, commercial, and industrial as well as other built areas
Croplands Agricultural area, crop fields, fallow lands, and vegetable lands
VegetationDeciduous forest, mixed forest lands, palms, conifer, scrub, etc.
WaterbodiesRiver, permanent open water, lakes, ponds, and reservoirs
Barren landsLand which has very limited or no trees/plants
Source: Modified from Dewan and Yamaguchi, 2008 [28].
Table 2. Socio-economic characteristics of the respondents.
CategoryAttributeSize
Age (year)30 to 4010.5%
41 to 5026%
51 to 6045%
Above 6018.5%
Occupation (Male)Business37.06%
Service22.38%
Day laborer18.88%
Unemployed5.61%
Agriculture 4.9%
Auto van and rickshaw pulling, construction work, etc.11.17%
Occupation (Female)Housewife 73.68%
Service 22.8%
Business3.52%
Monthly income (BDT)0 to 5000 14.5%
5001 to 10,000 8.5%
10,001 to 15,000 13%
15,001 to 20,000 21%
20,001 to 25,000 29.5%
25,000+13.5%
Level of EducationNo formal education12.5%
Grade 1 to 511%
Grade 6 to 1241%
Tertiary Education 35.5%
Table 3. Household land use of the respondents between 2000 and 2022.
YearAgriculture (%)Dwelling (%)Rental Purpose (%)Industrial (%)Unused (%)
200078.7915.152.530.53.03
202223.0740.3819.7517.300
Table 4. Correlations between settlement, croplands, and waterbodies changes in 2000, 2010, and 2020.
YearSettlementCroplandsWaterbodiesCorrelation between Settlement and Croplands (r)Correlation between Settlement and Waterbodies (r)
200019.81259.3311.19−0.9−0.66
201024.39238.6423.74
202047.75221.234.46
Table 5. Comparison of respondent’s occupational scenario between 2000 and 2022.
Year 2022Year 2000
OccupationPercentageOccupationPercentage
Occupation (Male)Business37.06%Agriculture 43.36%
Service22.38%Agricultural laborer7.69%
Day laborer18.88%Livestock rearing 5.59%
Unemployed5.61%Fishing9.09%
Agriculture4.9%Service 13.99%
Auto van and rickshaw pulling, construction work, etc.11.17%Wage laborer4.2%
Business10.49%
Unemployed 5.59%
Total100Total 100
Occupation (Female)Housewife 73.68%Housewife47.37%
Service 22.8%Agriculture 28.07%
Business3.52%Other (service and business)24.56%
Total 100Total 100
Disclaimer/Publisher’s Note: The statements, opinions and data contained in all publications are solely those of the individual author(s) and contributor(s) and not of MDPI and/or the editor(s). MDPI and/or the editor(s) disclaim responsibility for any injury to people or property resulting from any ideas, methods, instructions or products referred to in the content.

