Article

Correlation of the Effect of Native Bioagents on Soil Properties and Their Influence on Stem Rot Disease of Rice

1
Department of Plant Pathology, Professor Jayashankar Telanagana State Agricultural University, Rajendranagar, Hyderabad 500030, Telanagana, India
2
Department of Pathology, ICAR-Indian Institute of Rice Research, Rajendranagar, Hyderabad 500030, Telangana, India
3
Department of Soil Science, ICAR-Indian Institute of Rice Research, Rajendranagar, Hyderabad 500030, Telangana, India
4
Department of Statistics, ICAR-Indian Institute of Rice Research, Rajendranagar, Hyderabad 500030, Telangana, India
5
Department of Entomology, Professor Jayashankar Telanagana State Agricultural University, Rajendranagar, Hyderabad 500030, Telanagana, India
6
Department of Soil Science, Indira Gandhi Krishi Vishwavidyalaya, Raipur 492012, Chhattisgarh, India
7
Department of Mycology and Plant Pathology, Institute of Agricultural Sciences, Banaras Hindu University, Varanasi 221005, Uttar Pradesh, India
8
Department of Plant Pathology, B.M. College of Agriculture, Khandwa, Rajmata Vijayaraje Scindia Krishi Vishwa Vidyalaya, Gwalior 474002, Madhya Pradesh, India
9
Academy of Biology and Biotechnology, Southern Federal University, Rostov-on-Don 344058, Russia
10
Facultad De Ciencias Químicas, Benemérita Universidad Autónoma De Puebla, Puebla 72590, Pue, Mexico
*
Authors to whom correspondence should be addressed.
Sustainability 2023, 15(15), 11768; https://doi.org/10.3390/su151511768
Submission received: 26 June 2023 / Revised: 19 July 2023 / Accepted: 24 July 2023 / Published: 31 July 2023
(This article belongs to the Section Sustainable Agriculture)

Abstract

:
Soil is a crucial component for plant growth, as it provides water, nutrients, and mechanical support. Various factors, such as crop cultivation, microflora, nutrient addition, and water availability, significantly affect soil properties. Maintaining soil health is important, and one approach is the introduction of native organisms with multifaceted activities. The study evaluates the effects of introducing these microbes (Trichoderma asperellum strain TAIK1, Bacillus cabrialesii strain BIK3, Pseudomonas putida strain PIK1, and Pseudomonas otitidis strain POPS1) and their consortium, a combination of four bioagents, on soil health, plant growth, and the incidence of stem rot disease caused by Sclerotium oryzae in rice. Upon treatment of soil with the consortium of the four native bioagents mentioned above through seed treatment or soil application, variations/increases in the chemical properties of the soil were observed, viz., pH (8.08 to 8.28), electrical conductivity (EC) (0.72 to 0.75 d S m−1), organic carbon (OC) (0.57 to 0.68 %), available soil nitrogen (SN) (155 to 315 kg/ha), soil phosphorus (SP) (7.87 to 24.91 kg/ha), soil potassium (SK) (121.29 to 249.42 kg/ha), and soil enzymes (urease (0.73 to 7.33 µg urea hydrolyzed g−1 soil h−1), acid and alkaline phosphatase (0.09 to 1.39 and 0.90 to 1.78 µg of p-nitrophenol released g−1 soil h−1), and dehydrogenase (0.14 to 16.44 mg triphenyl formazan (TPF) produced g−1 soil h−1)), compared to untreated soil. Treatment of seeds with the consortium of four native bioagents resulted in a significant increase in plant height (39.16%), the number of panicles (30.29%), and average grain yield (41.36%) over control plants. Under controlled conditions, the bioagent-treated plants showed a 69.37% reduction in stem rot disease. The findings of this study indicate a positive correlation between soil properties (pH, EC, OC, SN, SP, SK, and soil enzymes) and plant growth (shoot and root length, fresh and dry weight) as well as a highly negative association of soil properties with stem rot disease severity. The results suggest that using native bioagents as a management strategy can control stem rot disease and enhance crop productivity, while reducing reliance on chemical management. These findings provide valuable insights into the development of sustainable agricultural practices that maximize productivity by minimizing negative environmental impacts, which promotes soil health, plant growth, and disease management.

1. Introduction

Soil is a complex mixture of minerals, organic matter, water, air, and microflora that supports plant growth, water and nutrient storage, and ecosystem processes [1,2,3]. A healthy soil with diverse microflora, a balanced pH, adequate EC, available nutrients, and increased enzymatic activity significantly affects plant health and productivity [4,5]. In order to meet the needs of an increasing population and because of decreasing land availability, intensive agricultural practices with high inputs of fertilizers and pesticides are being adopted [6,7]. As a result of such disproportionate use of chemicals, soil is negatively influenced, leading to unhealthy soil, resulting in reduced microflora [6]. Heavy metal deposition toxicity can cause kidney dysfunction, liver cirrhosis, and brain edema [8]. Thus, in this context, low-input cost materials, like wheat straw, biocompost, rice straw, and green mulch, may be added to the soil to improve the structural, physical, chemical, nutritional, and microbiological quality indices of the soil [9]. The microwave-activated persulfate (PS) system was suggested for the remediation of atrazine-contaminated soil [10]. The use of biochar for stabilization of heavy metals, like Pd and Cd [11], and the use of bioagents in agriculture have the potential to maintain soil health and enhance crop production in a sustainable manner by supplying requisite nutrients to the soil and increasing nutrient availability for plants [12,13,14].
Native bioagents, viz., Trichoderma, Bacillus, and Pseudomonas, present in soil play a crucial role in enhancing various soil properties and plant growth [15,16]. These bioagents contribute to soil pH by participating in biological processes, and acids or bases are released during nutrient cycling and organic matter decomposition that can modify soil pH over time [17,18]. They also regulate EC by facilitating salt leaching and reducing soil salinity, contributing to a more balanced EC [19,20]. In addition, native bioagents aid in enhancing soil OC levels by decomposing organic matter and promoting nutrient availability, contributing to soil fertility and structure [21,22]. These microorganisms also influence soil NPK availability by fixing atmospheric nitrogen, phosphorus being made available in the soil, and mobilizing potassium, enhancing plant growth and development [23,24].
Soil enzymes, such as urease, acid and alkaline phosphatase, and dehydrogenase, are indeed produced by microbes, and these enzymes play a critical role in microbial activity, nutrient cycling, and ecosystem functioning. Monitoring enzyme activities can provide valuable information about soil health and microbial processes. Based on the results of enzyme activity measurements, soil management practices, such as nutrient application, organic matter addition, and crop rotation, can be adjusted or recommended to optimize soil conditions and promote sustainable agricultural practices [23,24]. Plant nutrient analysis reveals the effectiveness of microbes participating in nutrient cycling and is useful for further nutrient management strategies.
These bioagents create less favorable conditions for the growth and development of the soil-borne pathogen S. oryzae, which causes stem rot disease in rice, either directly or indirectly by manipulating the soil nutrients and chemical composition, and such soils are called suppressive soils [25]. Stem rot disease of rice is generally managed by the application of chemical fungicides, and these practices are less preferred due to the awareness of the residual effects of fungicides on the grains, damage to human and animal health by entry into the food chain, and pollution of the environment [26]. Through their combined effects on soil chemical properties and their direct antagonistic activity against stem rot disease Pathogen, these native bioagents create a synergistic effect that ultimately leads to a reduction in the occurrence of stem rot disease in rice. This integrated approach of harnessing the beneficial activities of Trichoderma, Pseudomonas, and Bacillus enhances soil health, may contribute to sustainable disease management of stem rot disease of rice, and promote the overall productivity of rice crops.

2. Materials and Methods

2.1. Fungal Pathogen and Bio-Control Agents

The pathogen responsible for stem rot disease was isolated from samples obtained from infected plants in farmers’ fields. A standard tissue isolation procedure was followed, as described by Bashyal et al. [27]. The pathogenicity of the pathogen in the TN1 rice cultivar has been established through the application of Koch’s postulates. Pure cultures of potential bioagent, viz., TAIK1 (NCBI accession no.: MH825714, whole-genome sequence: JA1AZZ01), BIK3 (NCBI accession no.: MW181668, whole-genome sequence: JAHKKH01), and PIK1 (NCBI accession no.: ON778610), were obtained from culture collections at the ICAR-IIRR, Hyderabad, Telangana, India, reported to have antagonistic properties against stem rot disease [28]. Pseudomonas otitidis strain POPS1 was isolated as part of PhD work, characterized, and submitted (NCBI accession no.: ON782043).

2.2. Antagonism Assay

The bio-efficiency of the four native BCAs against the stem rot disease pathogen was analyzed using a dual-culture assay on PDA plates [29]. For bacterial isolates, their effectiveness was evaluated by streaking a loopful of bacteria on both sides of a pathogen disc positioned at the center of a plate. The plates were then incubated in a biological oxygen demand (BOD) chamber at a temperature of 25 ± 2 °C for a period of 4 days, allowing the pathogen to grow and reach a maximum radial growth of 9 cm on the control plate. The radial growth of the pathogen was measured and recorded. The percentage inhibition was calculated using the formula described by Gangwar and Sinha [30], as given below:
Percentage   inhibition   ( % ) = C T C × 100
where C = colony growth on the control plate (cm) and T = colony growth on the treated plate (cm).

2.3. In Vivo Application of S. oryzae and Its Severity in Plants

The effects of the four bioagents and their consortium on plant-growth-promoting and yield attributes were investigated. Various growth-promoting parameters, including seedling length, seedling fresh weight, and seedling dry weight, were measured at different time intervals, such as 7, 14, 21, 45, 60, 90, and 120 days after sowing (DAS). Yield-attributing traits, viz., panicle length, test weight, number of tillers, grain size, and yield per hill, were evaluated at the harvesting stage of the treated plants.
To study the impact of individual bioagents and a consortium of bioagents on the stem rot disease pathogen S. oryzae, plants were inoculated by placing 5-mm-long dried stem bits with the multiplied pathogen of the TN1 variety at 45 DAS, specifically during the maximum tillering stage [31]. The inoculation process of S. oryzae on rice plants under glasshouse conditions is shown in Figure 1. The infection rate was assessed by recording the percentage of infected tillers at the time of maturity. The experiment was conducted in a completely randomized design (CRD) with three replications. Observations were recorded in terms of the percentage of infected tillers at the time of maturity. The severity of the disease was assessed using a scale ranging from 0 to 9, as defined by the Standard Evaluation System (SES) of the IRRI [32]. Subsequently, the recorded data were transformed into a percentage disease index (PDI) using the following formula:
PDI = Sum   of   the   scores Number   of   Observation   ×   Highest   number   in   rating   scle × 100

2.4. Seed and Soil Treatment

Sterile, pre-soaked seeds of the rice cultivar TN1 (stem rot disease susceptible) were treated with suspensions of bioagents, viz., TAIK1 (22 × 103 spores/mL) and BIK3, PIK1, and POPS1 (2.5 × 10⁸ cfu/mL each), and incubated for 6 h. Distilled-water-treated seeds were considered a negative control. The treated seeds were transferred to pots of size 30 × 25 cm filled with 5–7 kg of autoclaved soil. The bioagent suspension was applied to each pot at 10 mL/kg of soil and mixed thoroughly.

2.5. Sample Collection and Estimation of Defense-Related Enzymes

Fresh leaves were harvested at different time intervals, like 24 h, 48 h, 72 h, 96 h, and 120 h after pathogen inoculation (hapi), representing different treatments. Randomly selected plants were used, with three replicates per treatment. The harvested leaves were placed in sterile polybags. To ensure aseptic conditions, the collected samples were rinsed with sterile distilled water. Subsequently, the samples were stored in a refrigerator at −80 °C until further experimentation.

2.5.1. Phenylalanine Ammonia-Lyase (PAL) Assay

The activity of phenylalanine ammonia-lyase (PAL) was estimated as per the procedure described by Brueske [33]. Fresh leaves (0.5 g) from each replicate were ground in 4 mL of 0.2 M borate buffer containing 1.4 mM β-mercaptoethanol, using a pre-chilled mortar and pestle. The resultant enzyme extract was centrifuged at 16,000 rpm at 4 °C for 15 min. The reaction mixture was prepared by combining 2 mL of 0.2 M borate buffer (pH 8.7), 0.2 mL of 0.1 M L-phenylalanine, and 2 mL of enzyme extract and incubated for 30 min at 32 ± 2 °C. Finally, 0.5 mL of 1M trichloroacetic acid was added to stop the reaction, and the absorbance of the whole reaction mixture was measured with a spectrophotometer at 290 nm (µmoles of TCA/mg leaves/min).

2.5.2. Peroxidase (PO) Assay

Peroxidase (PO) activity, expressed as µmoles/g leaves/min, was determined from the fresh leaves (0.5 g) from each treatment homogenized in 1 mL of 0.1 M potassium phosphate buffer. The reaction mixture consisted of 0.1 M potassium phosphate buffer (pH 7.0), 100 µL of enzyme extract, and 100 µL of 2 Mm H2O2. The change in absorbance was measured at 436 nm for 2 min at 30 s intervals [34].

2.5.3. Polyphenol Oxidase (PPO) Assay

Leaf samples weighing 0.5 g were homogenized in 5.0 mL of 0.1 M sodium phosphate buffer (pH 6.5) using a pre-chilled mortar and pestle. The homogenate was centrifuged at 16,000 rpm for 15 min at 4 °C. The resulting enzyme extract was collected for further analysis. For PPO activity assay, a reaction mixture was prepared by combining 0.4 mL of the enzyme extract, 0.4 mL of 0.01 M catechol, and 3.0 mL of 0.1 M sodium phosphate buffer (pH 6.5). The mixture was incubated at 28 ± 2 °C for 5 min. The absorbance of the reaction mixture was measured at 495 nm. PPO activity was determined by recording the changes in absorbance every 30 s for a total of 3 min. The recorded PPO activity was expressed as µmoles/g leaves/min [35].

2.5.4. Total Phenol Content (TPC) Assay

The total phenol content (TPC) was measured using a modified methodology outlined by Malick and Singh [36]. Leaf samples weighing 0.1 g from each replicate treatment were crushed in 5 mL of 50% methanol. The samples were incubated for 1 h and then further centrifuged at 13,000 rpm for 15 min. From the methanolic enzyme extract obtained, 0.1 mL was taken in a tube, the final volume was adjusted to 1 mL using distilled water, and 0.5 mL of Folin–Ciocalteu reagent was thoroughly mixed in. To this, 1 mL of 20% sodium carbonate was added after 15 min and vortexed. The mixture was left to stand for 1 h at room temperature. The absorbance of the changes in the reaction mixture was recorded at 725 nm and expressed as μg gallic acid (GA)/g fresh weight.

2.6. Soil Analysis

2.6.1. Estimation of Soil Chemical Properties

Changes in the soil pH, EC, and OC were determined according to McLean [37], Rhoades [38], and Walkley and Black [39], respectively. Available nitrogen was estimated using the alkaline permanganate method with the macro-Kjeldahl distillation unit [40]. Soil was alkalified with 2.5% NaOH, and 0.32% KMnO4 was added. Ammonia liberated from the soil was trapped in a standard boric acid solution. The obtained solution was titrated with 0.02 N H2SO4. In the case of available phosphorus, soil samples were extracted with 0.5 M NaHCO3 buffered at pH 8.5, and the phosphorus in the extract was estimated using an ascorbic acid method with a spectrophotometer at 660 nm [41]. The available potassium in the soil was extracted with 1 N neutral ammonium acetate (pH 7.0), and the potassium in the extract was determined using a flame photometer [42].

2.6.2. Estimation of Soil Enzymes

Assay of Dehydrogenase Enzyme

Dehydrogenase activity in the soil was assessed by adding 0.2 mL of 3% triphenyl tetrazolium chloride (TTC) solution and 0.5 mL of 1% glucose to 1 g of soil and incubating for 24 h at 28 ± 0.5 °C. Next, 10 mL of methanol was added, and the mixture was left to stand for 6 h. The amount of dehydrogenase activity was measured and expressed as mg triphenyl formazan (TPF) produced g−1 soil h−1 at 485 nm absorbance [43].

Assay of Phosphatase Enzyme

For detection of acid and alkaline phosphatase activity, 4 mL of Modified Universal Buffer (MUB), phosphate buffer (pH 6.5), and 0.2 mL of toluene were added to a 1 g soil sample, and then, 1 mL of p-nitrophenyl phosphate (disodium salt hexahydrate) solution was added, followed by incubation for 1 h at 37 °C. Next, 1 mL of 0.5 M CaCl2 was added to extract dehydrogenase from the soil sample and 4 mL of 0.5 M NaOH was used to alkalize the soil sample and stabilize the color reaction. The formation of p-nitrophenol (p-NP) was explored spectrophotometrically at 440 nm and expressed as µg of p-nitrophenol released g−1 soil h−1 [44,45].

Assay of Urease Enzyme

To determine urease activity in soil, 1 mL of urea solution, 10 mL of 2M KCI-PMA buffer, and 6 mL of coloring reagent were added to 1 g of soil, and the soil samples were incubated for 5 h at 37 °C. The absorbance of the red color developed at 527 nm was measured using a spectrophotometer and expressed as µg urea hydrolyzed g−1 soil h−1 [46].

2.7. Estimation of Plant Nutrient Analysis

The plant samples collected at various time intervals were initially air-dried in the shade and then further dried in a hot-air oven at 65 °C until a constant weight was achieved. The dried samples were finely ground into a powder using a Willey mill (group of grinding mills). The nitrogen content in the plant samples was determined using the micro-Kjeldahl distillation method for determining the nitrogen (N) content in soil samples. It involves the digestion of the soil sample, followed by distillation and titration to quantify the amount of nitrogen present, as described by Piper [41]. The powdered plant sample was digested using a mixture of three acids (HNO3, H2SO4, and HClO4) in a ratio of 10:4:1. The digested sample was filtered through Whatman No. 42 filter paper, and the residue was washed with double-distilled water until free from chloride, following the method described by Bhargava and Raghupathi [43]. The clear extract obtained from the triacid mixture was used to determine the phosphorus (P) and potassium (K) content using a spectrophotometer at 470 nm [46] and a flame photometer [42,47], respectively.

2.8. Statistical Analysis

The experiments were carried out using a completely randomized design (CRD), and the data obtained were analyzed using one-way analysis of variance (ANOVA). A post hoc test was conducted using Duncan’s multiple range test (DMRT) at a significance level of 5% (p ≤ 0.05) using OPSTAT software (version 6.8). During each experiment, three replications were maintained. Correlation and stepwise regression analyses were performed using SAS version 9.3 software, which is available at the ICAR-IIRR. The regression model, represented in matrix notation, can be expressed as follows:
Y = Xβ + e
In this equation, Y represents the response variable, X denotes the vector of exogenous variables, β represents the vector of regression coefficients, and e represents the residual term assumed to follow a normal distribution with e~N (0, σ2). Principal component analysis (PCA) identifies the variance within a data set and allows us to understand the key variables and spot outliers in the data. PCA was carried out using FactoMineR [48] and Factoextra [49] packages in R.

3. Results

3.1. Antagonism Assay

Native BCAs under in vitro conditions were evaluated for their antagonistic nature against S. oryzae. TAIK1 showed the maximum inhibition percentage of 62.7% over the control, followed by PIK1 (61.56%), and the least inhibition was recorded in POPS1, at 56.38% (Figure 2).

3.2. In Vivo Application of S. oryzae and Its Severity in Plants

In vivo experiments conducted under glasshouse conditions indicated a significantly higher decrease in the PDI of stem rot disease in the consortium-treated plants (55.92%), followed by plants treated with TAIK1 (51.18%), over the control (Table 1 and Figure 3).

3.3. Plant Growth Promotion and Yield Attributes

Plant growth promotion and yield attributes refer to the characteristics and factors that contribute to the growth, development, and productivity of plants. These attributes are essential as they directly influence the overall yield and quality of crops. Plants treated with the consortium of four native BCAs showed 100% seed germination and an increase of 58.08% in shoot length, 74.79% in root length, 56.66% in fresh weight, and 48.62% in dry weight over the control. The maximum growth promotion was exhibited by the consortium of BCAs, followed by TAIK1 and PIK1, and the least was recorded in POPS1-treated plants (Table 1 and Figure 4).
Similar results were recorded in the yield attributes, viz., the bioagent-treated plants showed a significantly increased number of tillers, panicle length, grain size (kernel length (KL) and kernel breadth (KB)), test weight, and yield per hill compared to the control. The consortium-treated plants showed a 34.38% increase in panicle length, followed by TAIK1 (23.96%), PIK1 (18.75%), BIK3 (10.42%), and POPS1 (4.17%), over control plants. An improved grain size was recorded in consortium-treated plants, with KL = 6.2 cm and KB = 2.9 cm, followed by TAIK1 (KL = 6.0 cm and KB = 2.7 cm), PIK1 (KL = 5.8 cm and KB = 2.6 cm), BIK3 (KL = 5.7 cm and KB = 2.4 cm), and POPS1 (KL = 5.6 cm and KB = 2.3 cm). In addition, more test weight (24.1 g) was recorded in consortium-treated plants. Furthermore, more yield/hill (19.1 g) was recorded in consortium-treated plants, followed by TAIK1 (17.1 g), PIK1 (16.1 g), BIK3 (15.0 g), and POPS1 (14.0 g). The least values were recorded in control untreated plants, with a panicle length of 19.2 cm, a grain size of KL = 5.4 cm and KB = 2.1 cm, a test weight of 15.2 g, and a yield per hill of 11.2 g (Table 1). A stacked circular bar plot (used for visual representation of categorical data arranged in a circular form) depicts the changes in plant-growth-promoting parameters and yield attributes over a rice crop period at 7, 14, 21, 45, 60, and 90 DAS regular intervals upon treatment with single bioagents and the consortium of bioagents (Figure 5).

3.4. Biochemical Parameters

The defense-related enzyme activities were assessed in plants treated with individual bioagents and the consortium of bioagents at different time intervals. The activity of defense enzymes showed an increase after 24 hapi of treatment, reached its peak at 72 hapi, and subsequently declined. The highest activity of PAL, PO, PPO, and TPC was observed in the consortium of BCAs + S. oryzae, followed by TAIK1 + S. oryzae. Specifically, the highest PAL activity was recorded in plants treated with the consortium of BCAs + S. oryzae at 24, 74, and 120 hapi (3.387, 5.961, and 5.602 µmoles of TCA/mg leaves/min, respectively). In contrast, the control plants exhibited the lowest PAL activity at the same intervals (1.347, 1.764, and 1.474 µmoles of TCA/mg leaves/min, respectively). The PO activity was highest after the treatment with the consortium of BCAs + S. oryzae at 24, 74, and 120 hapi (0.693, 0.736, and 0.714 µmoles/g leaves/min, respectively), while the control showed the lowest PO activity at all intervals (0.04, 0.07, and 0.05 µmoles/g leaves/min, respectively). Similarly, the PPO activity was highest after the treatment with the consortium of BCAs + S. oryzae at 24, 74, and 120 hapi (0.071, 0.093, and 0.078 µmoles/g leaves/min, respectively), whereas the control exhibited the lowest activity at all intervals (0.005, 0.015, and 0.007 µmoles/g leaves/min, respectively). The maximum activity of TPC was observed with the consortium of BCAs + S. oryzae at 24, 74, and 120 hapi (2.932, 4.932, and 3.932 µg gallic acid (GA)/g fresh weight, respectively), while the control showed the lowest activity at all intervals (0.587, 1.587, and 1.087 µg gallic acid (GA)/g fresh weight, respectively) (Figure 6).

3.5. Soil Chemical Properties
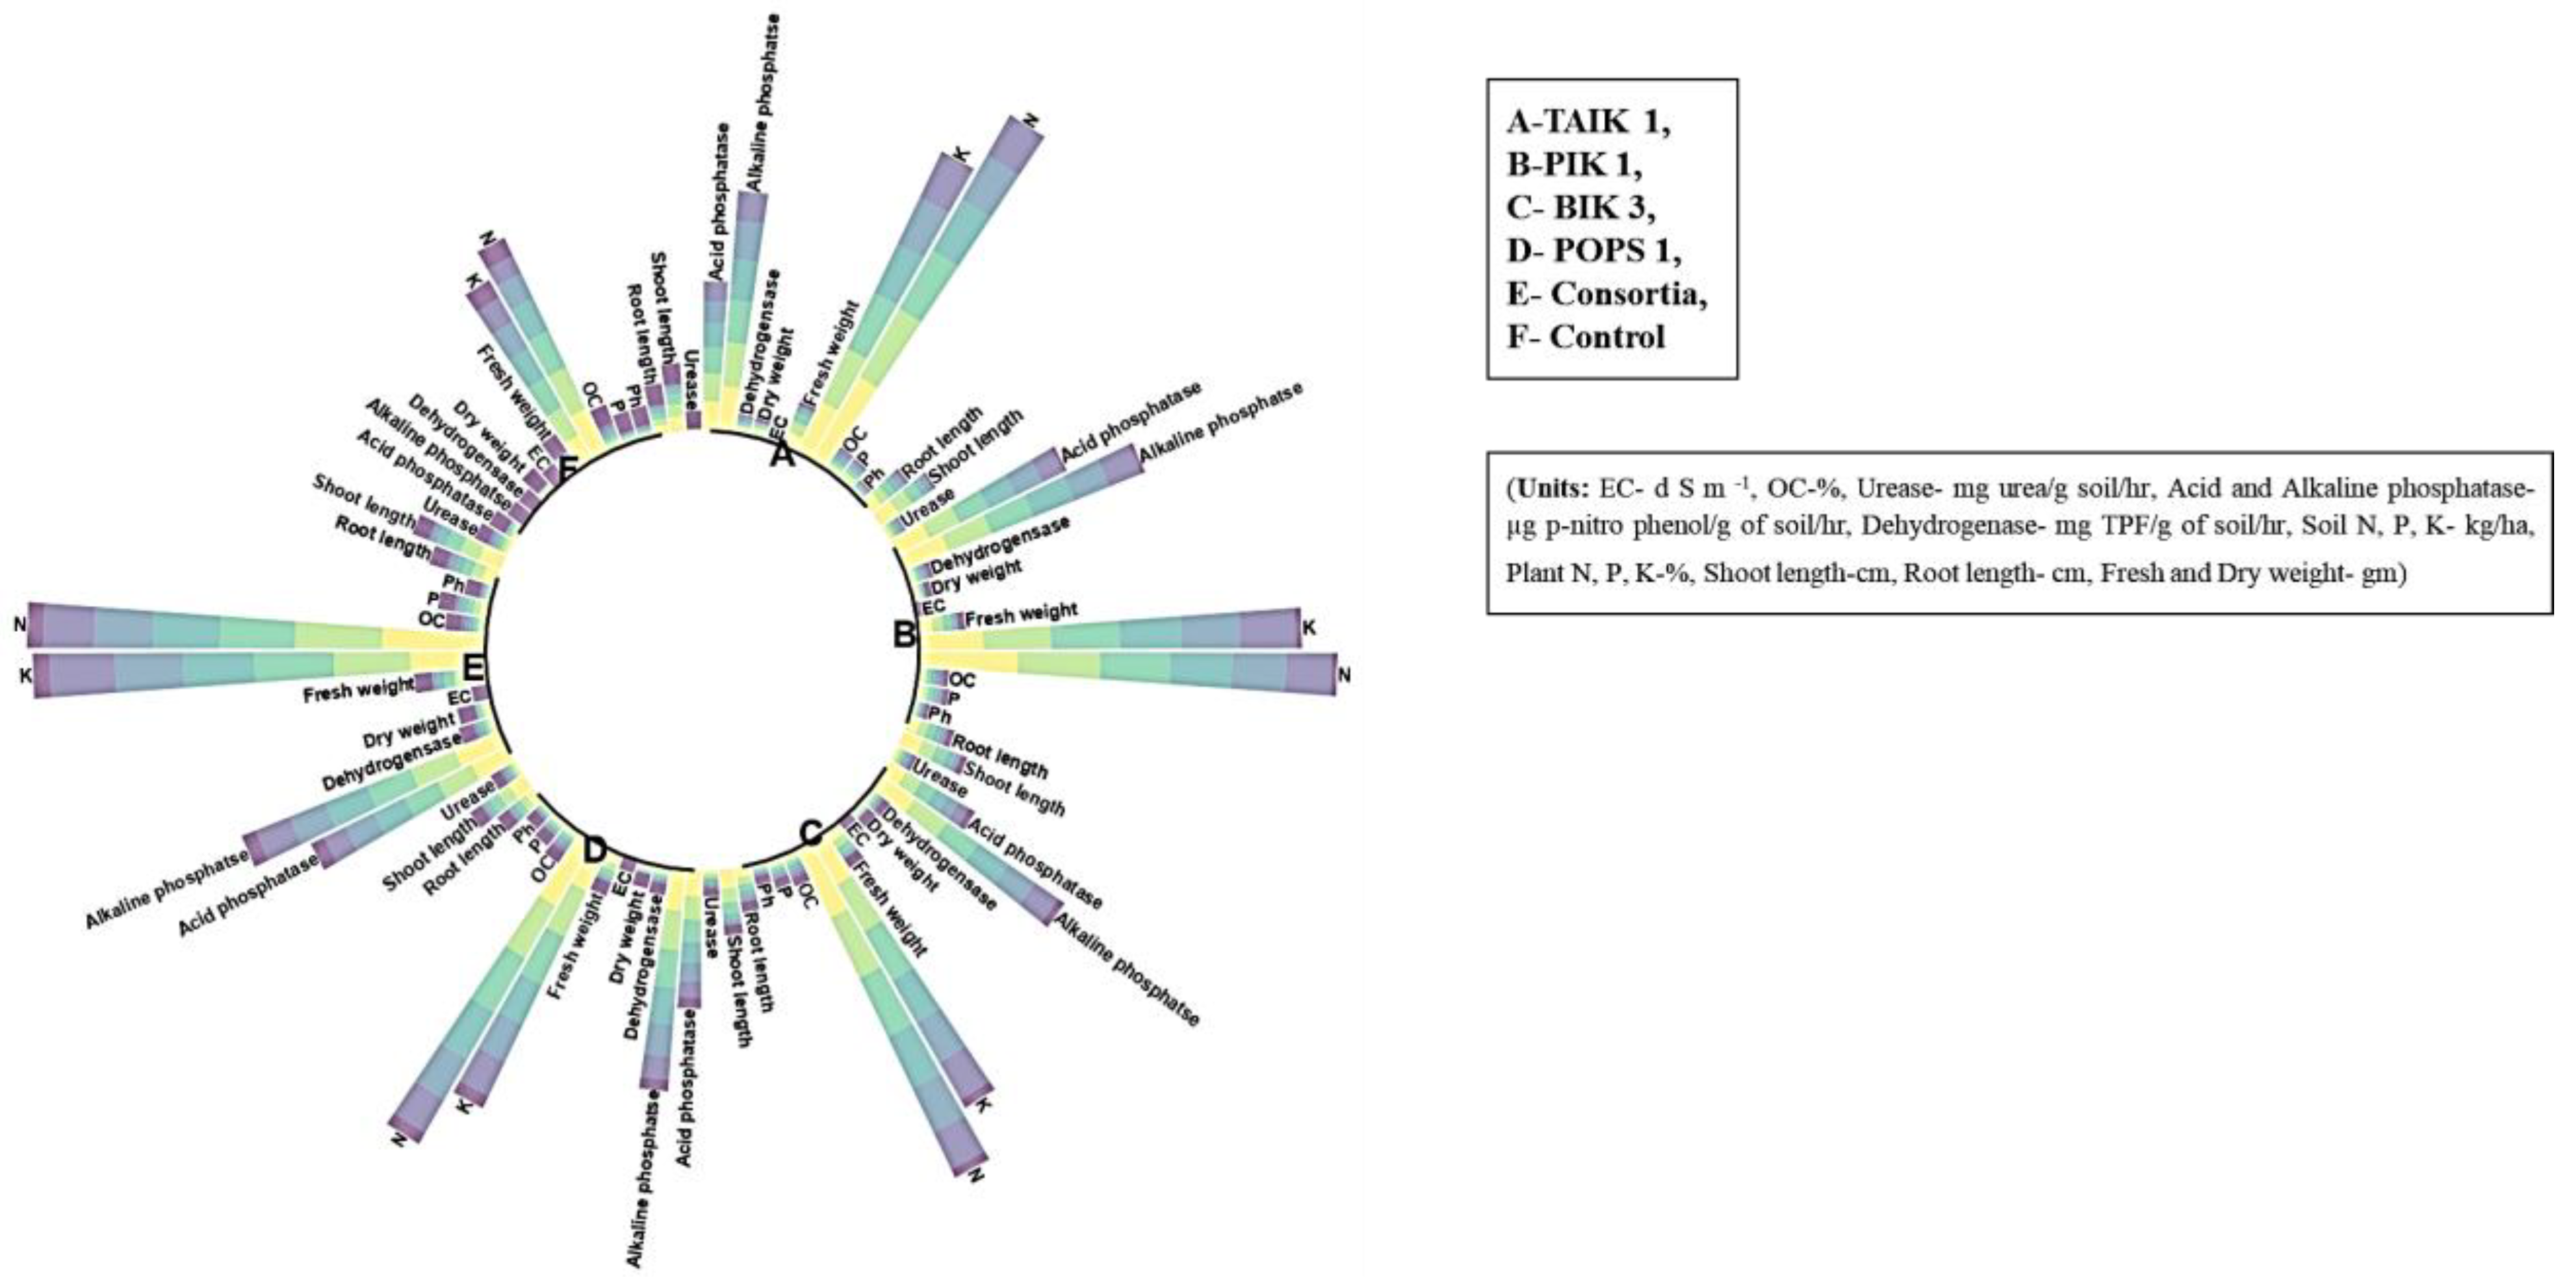
Bioagent-treated soils under glasshouse conditions showed changes in the pH, EC, and OC over untreated soils. Soil analysis showed a significant increase in bioagent-treated soils in comparison with control untreated soils: pH (8.1 to 8.2), EC (0.72 to 0.76 d S m−1), and OC (0.57 to 0.68%) (Table 2).
Availability of soil N, P, and K was found to be increased in consortium-treated soils. Results indicated the consortium of all four bioagents increased N (199.5 to 315.82 kg/ha), P (13.3 to 24.91 kg/ha), and K (256.48 to 288.28 kg/ha) over a period of 120 DAS, followed by TAIK1 treatment, which showed a significant increase in N (179.55 to 297.67 kg/ha), P (11.0 to 19.67 kg/ha), and K (218.74 to 249.42 kg/ha) in comparison with the control untreated soil (N (75.6 to 155.18 kg/ha), P (5.0 to 7.87 kg/ha), and K (107.41 to 121.29 kg/ha)) (Table 2). A stacked circular bar plot depicts the changes in soil chemical properties over a crop period at regular intervals upon treatment with single bioagents and the consortium of bioagents (Figure 6).

3.6. Soil Enzymes

Under glasshouse conditions, the single and combined application of bioagents significantly influenced the activity of soil enzymes, viz., urease, acid phosphatase, alkaline phosphatase, and dehydrogenase, across all time intervals. Urease activity ranged from 0.73 to 7.33 µg urea hydrolyzed g−1 soil h−1, acid phosphatase activity ranged from 0.09 to 1.39 µg of p-nitrophenol released g−1 soil h−1, alkaline phosphatase activity ranged from 0.90 to 1.78 µg of p-nitrophenol released g−1 soil h−1, and dehydrogenase activity ranged from 0.14 to 16.44 mg triphenyl (TPF) produced g−1 soil h−1 in all the treatments. Among the treatments, consortium-treated soils exhibited a significant increase in enzymatic activity, followed by TAIK1- and PIK1-treated soils, while the control soil showed the lowest enzymatic activity (Table 2). A stacked circular bar plot depicts the changes in soil enzyme activities over a crop period at regular intervals upon treatment with single bioagents and the consortium of bioagents (Figure 6).

3.7. Plant Nutrients

Under glasshouse conditions, treatment with bioagents resulted in alterations of plant N, P, and K. Among the treatments, consortium-treated plant samples were found to have significantly higher levels of N (0.58%), P (0.11%), and K (1.58%) in comparison with the control plants, recorded with N (0.21%), P (0.02%), and K (0.76%). However, TAIK1- and PIK1-treated samples also showed significant increases in plant N, P, and K content; the least increase was observed in POPS1-treated samples (Table 2). A stacked circular bar plot depicts the changes in plant nutrients over a crop period at regular intervals upon treatment with single bioagents and the consortium of bioagents (Figure 6).

3.8. Correlation Analysis

Among the variables, plant growth promotion activities (SL, RL, FW, DW, and yield (Y)) were found to have a highly significant positive correlation (Figure 7, dark blue) with the soil chemical properties, viz., pH, EC, OC, and available soil N, P, and K (SN, SP, and SK). Similarly, the yield parameters, viz., panicle length, kernel length and breadth, and test weight, were found to have a moderately significant positive correlation with soil enzymes (urease (U), acid phosphatase (AP), alkaline phosphatase (ALP), and dehydrogenase (D)). However, a highly significant negative correlation was observed between the percentage of disease severity (PDI) and all the other parameters studied (Figure 7).

3.9. Stepwise Regression Analysis
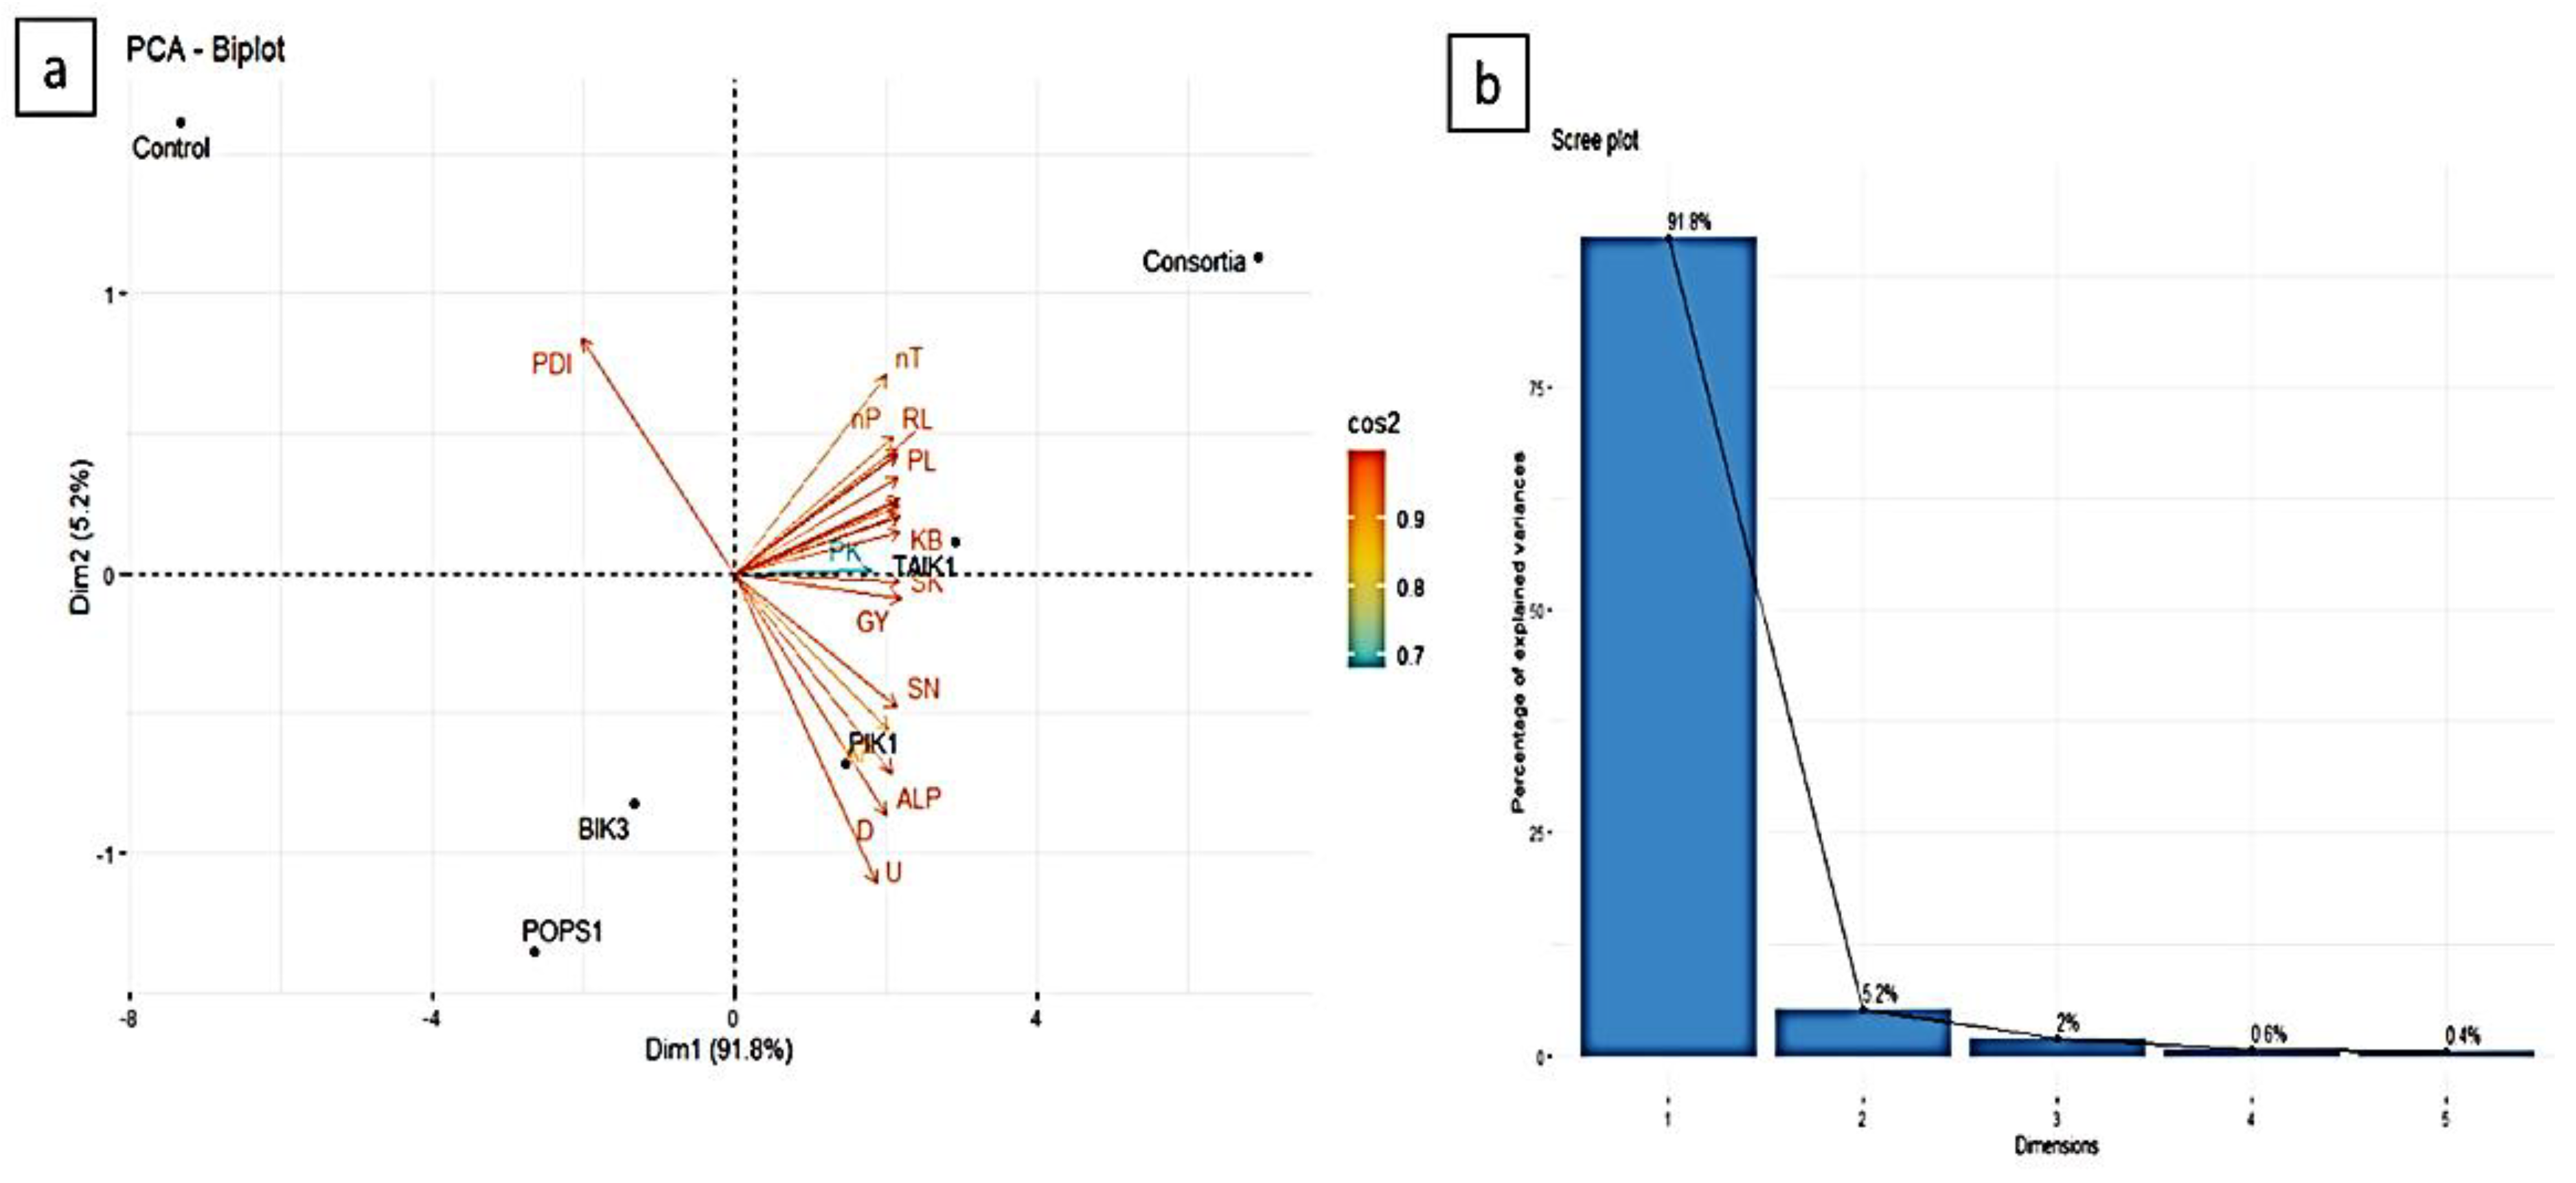
A stepwise regression analysis was carried out to identify the factors influencing the shoot length, root length, fresh weight, and dry weight of the plant (dependent variables) and the effect of the four bioagent treatments, viz., TAIK1, BIK3, PIK1, POPS1, and one consortium (independent variables), on the soil properties. Though the stepwise regression analysis for soil enzymes was carried out with the five independent variables, TAIK1 retained the variability in the SL, RL, FW, and DW in plants for the urease enzyme. This described 95%, 96%, 93%, and 94% variability in each model. These results depict that for each unit increase in the urease enzyme in the soil, there will be a change of 0.90 cm SL, 0.65 cm RL, 0.28 g FW, and 0.13 g DW in plants (Table 3, Table 4, Table 5 and Table 6).
Acid phosphatase analysis revealed that POPS1 and the consortium were responsible for alterations in the SL, RL, FW, and DW of plants. This showed that for every unit increase in the acid phosphatase enzyme in the soil, there will be a change of 0.63 cm SL; 0.12 cm RL; 0.66 g, 0.36 g FW; and 0.13 g, 0.80 g DW in plants. In the case of alkaline phosphatase, variability was retained by POPS1, BIK3, and TAIK1, which explained 97% variation in the SL and RL models, 96% variation in the FW model, and 98% variation in the DW model. The results depict that for a unit increase in alkaline phosphatase activity, there is a 0.4 cm, 0.14 cm, and 0.55 cm variability in the SL by POPS1, BIK3, and TAIK1, respectively; 0.96cm, 0.57 cm, and 0.43cm alterations in the RL by POPS1, BIK3, and TAIK1, respectively; a 0.12 g, 0.67 g, and 0.07 g change in the FW by POPS1, BIK3, and TAIK1, respectively; and a 0.68 g, 0.44 g, and 0.51 g increase in the dry weight by POPS1, BIK3, and TAIK1, respectively (Table 3, Table 4, Table 5 and Table 6).
Similarly, stepwise regression analysis for the dehydrogenase enzyme was influenced by POPS1 and PIK1, which together explained 96%, 97%, 96%, and 96% of the variability in the SL, RL, FW, and DW of plants, respectively. POPS1 and PIK1 had a positive effect on the SL, RL, FW, and DW, and with a unit increase in enzyme activity, there was a change in 0.42 cm SL, 0.68 cm RL, 0.61 g FW, and 0.25 g DW (Table 3, Table 4, Table 5 and Table 6).
Regression analysis of plant nutrients N, P, and K showed a positive effect on changes in the SL, RL, FW, and DW. The variation was retained by BIK3 (76% SL, 52% RL, 51% FW, 70% DW), the consortium (18% SL, 25% RL, 23% FW), and PIK1 (40% DW). For every 1% increase in plant nitrogen, there was a variability of 0.44 cm SL (BIK3), 0.57cm SL (consortium), 0.43 cm RL (BIK3), 0.59 cm RL (consortium), 0.76 g FW (BIK3), 0.80 g FW (consortium), 0.40 g DW (PIK1), and 0.70 g DW (BIK3). For plant P, variation was retained by POPS1 (0.2% SL, 0.2% DW), BIK3 (96% SL, 93% FW, 95% DW), and PIK1 (94% RL). For every 1% increase in plant phosphorus content, there was a change of 0.99 cm SL (POPS1), 0.49 cm SL (BIK3), 0.57 cm RL (PIK1), 0.25 g FW (BIK3), 0.50 g DW (POPS1), and 0.59 g DW (BIK3). For plant K, variation was retained by PIK1 (0.3% SL, 0.3% RL, 0.6% FW, 0.4% DW), POPS1 (0.3% SL, 0.4% POPS1, 0.3% DW), BIK3 (0.1% SL, 0.1% FW, 0.2% DW), TAIK1 (0.2% RL), and the consortium (91% SL, 92% RL, 88% FW, 89% DW). For every 1% increase in plant K, there was an increase of 0.70 cm SL (PIK1), 0.51 cm SL (POPS1), 0.48 cm SL (BIK3), 0.35 cm SL (consortium), 0.55 cm RL (PIK1), 0.70 cm RL (TAIK1), 0.49 cm RL (consortium), 0.45 g FW (PIK1), 0.72 g FW (POPS1), 0.67 g FW (BIK3), 0.72 g FW (consortium), 0.64 g DW (PIK1), 0.86 g DW (POPS1), 0.72 g DW (BIK3), and 0.95 g DW (consortium) (Table 3, Table 4, Table 5 and Table 6). The other soil parameters affected by bioagent treatment (SL, RL, FW, and DW) are mentioned in Table 3, Table 4, Table 5 and Table 6.

3.10. PCA

The effect of individual bioagents and the consortium of bioagents on soil properties, plant growth, and yield parameters compared to the percentage disease index was analyzed using principal component analysis. The principal component was generated to explain the statistical variance of 97.0% (Figure 8). The first principal component (Dim1) had the highest eigenvalue of 20.1, explaining 91.7% of the statistical variance, while the second principal component (Dim2) had an eigenvalue of 1.14, explaining 5.2% of the statistical variance. A small angle indicates a positive correlation, while a large angle shows a negative correlation. However, the angle of 90° indicates no correlation between the given treatments. Based on the statistical analysis of the biplot (Figure 8), it was observed that all the variables with narrow angles (less than 90°) depict a strong correlation and affect each other directly, whereas the PDI lies in another quadrant and depicts a negative correlation. Furthermore, Dim1 on the positive axis was affected by U, AP, ALP, D, SN, SP, SK, PN, PP, PK, SL, RL, FW, DW, nT, nP, KL, KB, PL, TW, and GY, while Dim2 on the positive axis was affected by the PDI.
The PCA biplot (Figure 8) represents differences in the parameters in terms of bioagent treatment. The bioagent consortium and TAIK1 lie in the same quadrant on the upper positive side of the Dim1 axis, indicating the maximum variability of plant growth parameters, i.e., PN, PP, PK, SL, RL, FW, DW, nT, nP, KL, KB, PL, and TW, while the bioagent PIK1 located on the lower positive side of Dim1 indicates the maximum variability of soil properties, i.e., U, AP, ALP, D, SN, SP, and SK, and the control located on the positive side of Dim2 indicates the maximum variability of the PDI. PCA results indicated a significant effect of different treatments (bioagent consortium, TAIK1, and PIK1) on soil and plant growth parameters with the percentage disease index.

4. Discussion

Soil-borne pathogens, like S. oryzae and Rhizoctonia solani, pose a significant threat to rice cultivation in India and elsewhere. The severity and significance of the yield damage caused have led to the development of effective management strategies. Extensive research has demonstrated that antagonistic soil microflora, including fungi and bacteria, has the ability to inhibit pathogens and hold immense potential for suppressing soil-borne pathogens and promoting plant growth [50,51].
The selected bioagents used in the study, namely POPS1, PIK1, BIK3, and TAIK1, exhibited promising results in suppressing S. oryzae, both in vitro and in vivo. The bioagents’ suppression mechanism has been attributed to the secretion of antimicrobial compounds, such as bacteriocins, phenazines, and hydrogen cyanide (HCN), in the growth media, leading to the inhibition of pathogen growth [52,53]. Additionally, competition for nutrients and the production of enzymes, such as chitinases, proteases, pectinases, and glucanases, which degrade pathogen cell walls, have been reported as significant modes of action for Trichoderma spp. [54]. Trichoderma spp. have been found to produce antimicrobial metabolites, like trichoviridin and trichodermin. Similarly, Bacillus spp. have been found to produce subtilin, bacitracin, bacillin, and bacillomycin, which also contribute to pathogen suppression by degrading cell walls [55]. Pseudomonas spp. are known to secrete secondary metabolites, such as 2,4-diacetyl phloroglucinol, phenazine-1-carboxylic acid, phenazine-1-carboxamide, pyoluteorin, and pyrrolnitrin, which effectively inhibit plant pathogens [56].
In addition to their antagonistic activity against S. oryzae, the native BCAs used in this study also significantly increased seedling length, biomass, and yield. The bioagent-treated plants showed improvement in shoot length, fresh weight, and dry weight over the control plants, which may be due to the promotion of nutrient recycling, nitrogen fixation, phosphorus solubilization, and the production of plant-growth-promoting hormones and some alkaloids, like siderophores [50,57,58], in addition to the plant growth promotion activities of TAIK1, BIK3, PIK1, and POPS1, which are endophytic in nature, and the secretion of major phytohormones IAA, GA, SA, ABA, and Zeatin reported earlier by Sowmya et al. [59].
In vivo studies indicated that effective suppression of S. oryzae results in a significant reduction in the PDI over the control. The colonization of TAIK1 on the sclerotial bodies and mycelia of S. oryzae resulted in significant mycelial lysis, causing a loss of their viability and inhibiting their ability to germinate. Trichoderma secretes lytic enzymes, like chitinases and glucanases, which degrade the cell wall of the pathogen [60], further causing cell leakage and lysis of the pathogen. These findings have been observed through scanning electron microscope (SEM) studies [61,62]. The significant destruction of sclerotia is noteworthy, as these sclerotia are produced by S. oryzae to withstand adverse conditions and survive during the off-season. The effective suppression of these pathogens by TAIK1, resulting in sclerotial destruction, plays a crucial role in reducing the pathogen’s inoculum in the soil. This provides a sustainable management approach for controlling stem rot disease in rice, both during the crop cycle and in the off-season. These findings have been documented in studies conducted by Halifu et al. [63] and Kannan et al. [28].
Defense enzymes are involved in microbial-induced systemic resistance in plants and play a vital role in their ability to fight against invading pathogens [64,65]. Phenylalanine ammonia-lyase (PAL) is the first enzyme to be activated in the plant defense response and is the precursor for various secondary metabolites involved in plant defense, including phytoalexins, lignins, and flavonoids. Phytoalexins are toxic to invading pathogens by interfering with their protein and DNA pathways, inhibiting spore germination, and disrupting the cell membrane [66]. PAL affects pathogen development in plants by lignifying the cell wall, producing phenolic compounds, and accumulating reactive oxygen species (ROS) [67]. PO and PPO are involved in the oxidative cross-linking of cell wall components and provide physical barriers to pathogen movements in plants. These enzymes mainly induce defense-related genes and also detoxify pathogen-derived compounds [68]. The total phenolic content refers to the measurement of phenolic compounds, including a wide variety of secondary metabolites, such as tannins and flavonoids, that have antimicrobial properties. Phenolic compounds inhibit the enzymes released by pathogens that are involved in cell wall degradation, leading to blockage of colonization and development [69]. This study’s results revealed that the consortium treatment of plants induced significant concentrations of defense-related enzymes, such as PAL, PPO, PO, and TPC, as compared to individual BCA treatments and the untreated control.
An increase in soil pH, EC, and OC has a negative impact on soil-borne pathogens. A higher pH value indicates alkaline soil conditions that may be unfavorable to soil-borne fungal pathogens. Under alkaline conditions, the nutrient imbalance affects soil-borne pathogens, which may lead to the unavailability of essential nutrients and make soil-borne pathogens starve [70]. This nutrient imbalance also affects the diversity and abundance of microorganisms, including fungi, thus impacting their growth and survival [71]. In addition, high EC also leads to the accumulation of toxic ions, such as chloride and sodium, which may further inhibit the growth and survival of soil-borne pathogens by creating undue osmotic stress [71].
Soil organic carbon improves the suppressive nature of the soil by promoting the growth of beneficial microorganisms that compete with and inhibit the growth and multiplication of fungal pathogens [72]. These beneficial microorganisms also produce compounds that inhibit the growth and reproduction of pathogens, or they can outcompete them for nutrients and other resources in the soil [73]. In our study, BCA-treated soils were found to have increased pH, EC, and OC. Keim and Webster [74] proved that the application of native rhizosphere microflora leads to an increase in pH, EC, and OC levels. This increase creates a favorable environment that stimulates the growth and proliferation of beneficial microbes through quorum sensing. The beneficial microbe community secretes phenolic compounds, such as coumarins, flavonoids, and tannins, as well as volatile organic compounds (VOCs) and organic acids. These compounds play a crucial role in disrupting the signaling pathways for sclerotial body germination. As a result, the growth and proliferation of pathogens are effectively inhibited [71].
Application of beneficial microorganisms, such as Trichoderma spp., in agricultural soils has positive effects on nutrient availability. Studies conducted by Yadav et al. [75] and Kapri and Tewari [76] have reported the ability of Trichoderma spp. to enhance the solubilization of essential nutrients, viz., N, P, and K. These microorganisms release organic acids that acidify the soil, promoting the release of bound nutrients and making them more available to plants. Kucuk et al. [77] further confirmed that the acidification caused by organic acids released by T. harzianum can provide additional nutrients to plants.
Soil enzymes, viz., urease, acid and alkaline phosphatase, and dehydrogenase, play a key role in sustaining soil health by influencing the soil nutrient cycles. Urease plays a crucial role in the hydrolysis of urea into ammonia and carbon dioxide [78]. Phosphatase plays an important role in the phosphorus cycle and increases phosphorus solubilization in plants, which is a good indicator of soil fertility and quality [79]. The dehydrogenase enzyme catalyzes the oxidation of organic matter in the soil, providing an indication of the microbial activity and metabolic potential of soil microorganisms [80]. Results obtained from our study indicated an increase in soil enzymes upon treatment with BCAs compared to untreated soils, as reported in earlier studies [81]. Soil enzymatic activity is known to have a negative correlation with pathogen development, due to the increase in soil pH resulting from the production of ammonia by urease; alkaline conditions have a suppressive effect on some soil-borne pathogens [82]. Phosphorus solubilization by phosphatase makes plants uptake P, which is an essential component for sclerotia germination of the stem rot disease pathogen, which limits the pathogen’s development [83]. Higher levels of dehydrogenase activity are associated with a more diverse and healthier soil-beneficial microbial community, which is better equipped to suppress the growth and survival of soil-borne pathogens.
Correlation analysis revealed the interdependence of plant growth and yield attributes with soil parameters, which are negatively correlated with the disease severity of plants. PCA clearly showed the role of two principal components, viz., the application of the consortium of bioagents and TAIK1, which contributed about 97% of the total variability when compared to all the other factors involved. Soil enzymes were more influenced by PIK1 when compared to other bioagents. Stepwise regression analysis showed that the unit change variability in plant growth parameters is due to alterations in soil properties upon treatment with bioagents.

5. Conclusions

This study revealed the impact of potential BCAs P. otitidis, P. putida, T. asperellum, and B. cabrialesii isolated from the native rice soils of Telangana. They were investigated for their impact on soil health, plant growth promotion, and antagonistic activity against the stem rot disease pathogen under both in vitro and in vivo conditions. It was observed that all the BCAs had a noticeable effect on soil characteristics, such as pH, EC, OC, and soil enzymes, which in turn influenced the development of sclerotia of the soil-borne pathogen S. oryzae. These BCAs demonstrate potential as components of eco-friendly management strategies for stem rot disease. Additionally, they were found to promote plant growth, highlighting their significant role in developing sustainable integrated disease management (IDM) approaches for managing rice stem rot disease caused by S. oryzae.

Author Contributions

K.C.: conceptualization, planning, and editing of manuscript; S.V., M.P. and S.K.: conducting of experiments, data analysis, and writing of manuscript; G.R., S.R. and S.C.: contribution of reagents/materials/analysis tools; U.D.G., R.P., T.M., E.S. and C.K.: data analysis and editing of manuscript. All authors have read and agreed to the published version of the manuscript.

Funding

This study was funded by the Department of Agricultural Research (DARE), Ministry of Agriculture and Farmers’ Welfare, Government of India. K.C. acknowledges research support from the ICAR-IIRR. C.K. gratefully acknowledges financial support from the project of the Ministry of Science and Higher Education of the Russian Federation on the development of the Young Scientist Laboratory within the framework of the Interregional Scientific and Educational Center of the South of Russia (nos. LabNOTs-21-01AB, FENW-2021-0014) and to the Strategic Academic Leadership Program of the Southern Federal University (“Priority 2030”).

Institutional Review Board Statement

Not applicable.

Informed Consent Statement

Not applicable.

Data Availability Statement

The data sets used and/or analyzed during the study are available from the corresponding author upon reasonable request from K.C.

Acknowledgments

The authors thank Anusha for her help with this work. We would also like to acknowledge the help and support received from the Director and Head of, IIRR, and the of Plant Pathology, PJTSAU, Rajendranagar, Hyderabad, for this study.

Conflicts of Interest

The authors declare no conflict of interest.

References

  1. Neher, D.A. Soil community composition and ecosystem processes: Comparing agricultural ecosystems with natural ecosystems. Agrofor. Syst. 1999, 45, 159–185. [Google Scholar] [CrossRef]
  2. Raj, A.; Jhariya, M.K.; Yadav, D.K.; Banerjee, A.; Meena, R.S. Soil for sustainable environment and ecosystems management. In Sustainable Agriculture, Forest and Environmental Management; Springer: Berlin/Heidelberg, Germany, 2019; pp. 189–221. [Google Scholar]
  3. Fan, K.; Chu, H.; Eldridge, D.J.; Gaitan, J.J.; Liu, Y.R.; Sokoya, B.; Wang, J.T.; Hu, H.W.; He, J.Z.; Sun, W.; et al. Soil biodiversity supports the delivery of multiple ecosystem functions in urban greenspaces. Nat. Ecol. Evol. 2023, 7, 113–126. [Google Scholar] [CrossRef]
  4. Chaparro, J.M.; Sheflin, A.M.; Manter, D.K.; Vivanco, J.M. Manipulating the soil microbiome to increase soil health and plant fertility. Biol. Fertil. Soils 2012, 48, 489–499. [Google Scholar] [CrossRef]
  5. Else, K.B.; Giulia, B.; Zhanguo, B.; Rachel, E.C.; Gerlinde, D.D.; Ron, G.; Luuk, F.; Violette, G.; Thom Erdel, E.; Simsek, U.; et al. Effects of Fungi on Soil Organic Carbon and Soil Enzyme Activity under Agricultural and Pasture Land of Eastern Türkiye. Sustainability 2023, 15, 1765. [Google Scholar]
  6. Nikita, B.; Puneet, S.C. Excessive and Disproportionate Use of Chemicals Cause Soil Contamination and Nutritional. In Soil Contamination-Threats and Sustainable Solutions; IntechOpen: London, UK, 2020. [Google Scholar] [CrossRef]
  7. Jagaba, A.H.; Kutty, S.R.M.; Isa, M.H.; Ghaleb, A.A.S.; Lawal, I.M.; Usman, A.K.; Birniwa, A.H.; Noor, A.; Abubakar, S.; Umaru, I.; et al. Toxic effects of xenobiotic compounds on the microbial community of activated sludge. ChemBioEng Rev. 2022, 9, 497–535. [Google Scholar] [CrossRef]
  8. Jianhua, Q.; Zhuoran, L.; Zhihuan, W.; Fuxuan, B.; Shuqi, W.; Min, D.; Qi, H.; Yifan, W.; Hui, Y.; Ying, Z. Cyclodextrin-functionalized magnetic alginate microspheres for synchronous removal of lead and bisphenol a from contaminated Soil. Chem. Eng. J. 2023, 461, 142079. [Google Scholar]
  9. Evangelia, E.G. The impact of heavy metal contamination on soil quality and plant nutrition. Sustainable management of moderate contaminated agricultural and urban soils, using low cost materials and promoting circular economy. Sustain. Chem. Pharm. 2023, 33, 101046. [Google Scholar]
  10. Jianhua, Q.; Ruixin, L.; Xuewei, B.; Zhuoran, L.; Kaige, L.; Qi, H.; Xinru, Z.; Guangshan, Z.; Shouyi, M.; Ying, Z. Remediation of atrazine contaminated soil by microwave activated persulfate system: Performance, mechanism and DFT calculation. J. Clean. Prod. 2023, 399, 136546. [Google Scholar]
  11. Jianhua, Q.; Yihang, Y.; Xinmiao, Z.; Lei, W.; Yue, T.; Zhao, J.; Hui, Y.; Min, D.; Ying, Z. Stabilization of lead and cadmium in soil by sulfur-iron functionalized biochar: Performance, mechanisms and microbial community evolution. J. Hazard. Mater. 2022, 425, 127876. [Google Scholar]
  12. Punam, K.; Mukesh, M.; Pooja, G.; Manish, K.D.; Gopal, N.; Upadhyay, R.S. Plant growth promoting rhizobacteria and their biopriming for growth promotion in mung bean (Vigna radiata (L.) R. Wilczek). Biocatal. Agric. Biotechnol. 2018, 16, 163–171. [Google Scholar]
  13. Kumar, S.; Chandra, R.; Behera, L.; Keswani, C.; Sansinenea, E. Dual Trichoderma consortium mediated elevation of systemic defense response against early blight in potato. Eur. J. Plant Pathol. 2021, 162, 681–696. [Google Scholar] [CrossRef]
  14. de Andrade, L.A.; Santos, C.H.B.; Frezarin, E.T.; Sales, L.R.; Rigobelo, E.C. Plant growth-promoting rhizobacteria for sustainable agricultural production. Microorganisms 2023, 11, 1088. [Google Scholar] [CrossRef]
  15. Kumari, S.; Bharat, N.K.; Thakur, A.K. Role of plant growth-promoting rhizobacteria (PGPR) and bio-control agents (BCAs) in crop production. Int. J. Econ. Plants 2020, 7, 144–150. [Google Scholar] [CrossRef]
  16. Mishra, R.K.; Sahu, P.K.; Mishra, V.; Jamal, H.; Varma, A.; Tripathi, S. Isolation and characterization of halotolerant plant growth promoting rhizobacteria from mangrove region of Sundarbans, India for enhanced crop productivity. Front. Plant Sci. 2023, 14, 1122347. [Google Scholar]
  17. Neina, D. The role of soil pH in plant nutrition and soil remediation. Appl. Environ. Soil Sci. 2019, 2019, 5794869. [Google Scholar] [CrossRef] [Green Version]
  18. Shah, K.K.; Tripathi, S.; Tiwari, I.; Shrestha, J.; Modi, B.; Paudel, N.; Das, B.D. Role of soil microbes in sustainable crop production and soil health: A review. Agric. Sci. Technol. 2021, 13, 1313–1336. [Google Scholar] [CrossRef]
  19. Pooja, S.; Rajesh, K. Soil salinity: A serious environmental issue and plant growth promoting bacteria as one of the tools for its alleviation. Saudi J. Biol. Sci. 2015, 22, 123–131. [Google Scholar]
  20. Chandran, H.; Meena, M.; Swapnil, P. Plant growth-promoting rhizobacteria as a green alternative for sustainable agriculture. Sustainability 2021, 13, 10986. [Google Scholar] [CrossRef]
  21. Muhammad, I.R.; Liyakat, H.M.; Tanvir, S.; Talal, A.; Iqbal, M.I.; Ismail, M.O. Bacteria and fungi can contribute to nutrients bioavailability and aggregate formation in degraded soils. Microbiol. Res. 2016, 183, 26–41. [Google Scholar]
  22. Singh, D.P.; Prabha, R.; Renu, S.; Sahu, P.K.; Singh, V. Agrowaste bioconversion and microbial fortification have prospects for soil health, crop productivity, and eco-enterprising. Int. J. Recycl. Org. Waste Agric. 2019, 8, 457–472. [Google Scholar] [CrossRef] [Green Version]
  23. Shen, H.; He, X.; Liu, Y.; Chen, Y.; Tang, J.; Guo, T. A Complex Inoculant of N2-Fixing, P- and K-Solubilizing Bacteria from a Purple Soil Improves the Growth of Kiwifruit (Actinidia chinensis) Plantlets. Front. Microbiol. 2016, 7, 841. [Google Scholar] [CrossRef]
  24. Meena, V.S.; Meena, S.K.; Verma, J.P.; Kumar, A.; Aeron, A.; Mishra, P.K.; Bisht, J.K.; Pattanayak, A.; Naveed, M.; Dotaniya, M.L. Plant beneficial rhizospheric microorganism (PBRM) strategies to improve nutrients use efficiency: A review. Ecol. Eng. 2017, 107, 8–32. [Google Scholar] [CrossRef]
  25. Gopika, K.; Jagadeeshwar, R.; Rao, V.K.; Vijayalakshmi, K. An overview of stem rot disease of rice (Sclerotium oryzae catt.) and its comprehensive management. Int. J. Appl. Biol. Pharml. Technol. 2016, 7, 111–124. [Google Scholar]
  26. Pramesh, D.; Alase, S.; Muniraju, K.M.; Kumara, M.K. A combination fungicide for the management of sheath blight, sheath rot and stem rot diseases of paddy. Int. J. Curr. Microbiol. Appl. Sci. 2017, 6, 3500–3509. [Google Scholar]
  27. Bashyal, B.M.; Parmar, P.; Zaidi, N.W.; Sunil, K.S.; Prakash, G.; Rashmi, A. Improved methodology for the isolation of false smut pathogen Ustilaginoidea virens of rice. Indian Phytopathol. 2021, 74, 249–252. [Google Scholar] [CrossRef]
  28. Kannan, C.; Mishra, D.; Miriyala, A.; Prakasam, V.; Basavaraj, K.; Jasudasu, G.; Srinivas, P.M.; Sundaram, R.M. Native isolates of Trichoderma as bio-suppressants against sheath blight and stem rot pathogens of rice. Egypt. J. Biol. Pest Control. 2021, 31, 12. [Google Scholar]
  29. Sinclair, J.B.; Dhingra, O.D. Basic Plant Pathology Methods; CRC Press: Boca Raton, FL, USA, 2017; pp. 287–300. [Google Scholar]
  30. Gangwar, G.P.; Sinha, A.P. Comparative antagonistic potential of Trichoderma spp. against Xanthomonas oryzae pv. oryzae. Ann. Plant Sci. 2010, 8, 458–463. [Google Scholar]
  31. Kumar, V.; Singh, R.; Jalali, B.L. Evaluation of resistance to stem rot and yield losses caused by the disease in rice. Indian Phytopathol. 2003, 4, 403–407. [Google Scholar]
  32. International Rice Research Institute (IRRI). Standard Evaluation System for Rice; International Rice Research Institute (IRRI): Los Banos, Manila, Philippines, 2002; p. 24. Available online: http://www.knowledgebank.irri.org/images/docs/rice-standard-evaluation-system.pdf (accessed on 10 June 2023).
  33. Brueske, C.H. Phenylalanine ammonia lyase activity in tomato roots infected and resistant to the root-knot nematode, Meloidogyne incognita. Physiol. Plant Pathol. 1980, 16, 409–414. [Google Scholar] [CrossRef]
  34. Hammerschmidt, R.; Nuckles, E.M.; Kuc, J. Association of enhanced peroxidase activity with induced systemic resistance of cucumber to Colletotrichum lagenarium. Physiol. Plant Pathol. 1982, 20, 73–82. [Google Scholar] [CrossRef]
  35. Gauillard, F.; Richardforget, F.; Nicolas, J. New spectrophotometric assay for polyphenol oxidase active ity. Anal. Biochem. 1993, 215, 59–65. [Google Scholar] [CrossRef]
  36. Malick, C.P.; Singh, M.B. Plant Enzymology and Histo Enzymology; Kalyani Publishers: New Delhi, India, 1980; p. 286. [Google Scholar]
  37. McLean, E.O. Soil pH and lime requirement. In Methods of Soil Analysis: Part. 2 Chemical and Microbiological Properties; Wiley: Hoboken, NJ, USA, 1983; Volume 9, pp. 199–224. [Google Scholar]
  38. Rhoades, J.D. Soluble Salts. In Methods of Soil Analysis: Part. 2 Chemical and Microbiological Properties; Agronomy Monographs; American Society of Agronomy: Madison, WI, USA, 1983; pp. 167–179. [Google Scholar]
  39. Walkley, A.; Black, L.A. An examination of the Degtjareff method for determining soil organic matter, and a proposed modification of the chromic acid titration method. Soil Sci. 1934, 37, 29–38. [Google Scholar] [CrossRef]
  40. Subbaiah, B.V. A rapid procedure for estimation of available nitrogen in Soil. Curr. Sci. 1956, 25, 259–260. [Google Scholar]
  41. Watanabe, F.S.; Olsen, S.R. Test of an ascorbic acid method for determining phosphorus in water and NaHCO3 extracts from Soil. Soil Sci. Soc. Am. J. 1965, 29, 677–678. [Google Scholar] [CrossRef]
  42. Muhr, G.R. Soil testing in India. In USAID Mission to India; USAID: New Delhi, India, 1965; p. 120. [Google Scholar]
  43. Casida, J.L.E.; Klein, D.A.; Santoro, T. Soil dehydrogenase activity. Soil Sci. 1964, 98, 371–376. [Google Scholar] [CrossRef]
  44. Tabatabai, M.A.; Bremner, J.M. Use of p-nitrophenyl phosphate for assay of soil phosphatase activity. Soil Biol. Biochem. 1969, 1, 301–307. [Google Scholar] [CrossRef]
  45. Eivazi, F.; Tabatabai, M.A. Phosphatases in soils. Soil Biol. Biochem. 1977, 9, 167–172. [Google Scholar] [CrossRef]
  46. Piper, C.S. Vanado-Molybdo-Phosphoric Yellow Colour Method. Soil Sci. Plant Anal. 1966, 10, 368. [Google Scholar]
  47. Chapman, H.D.; Pratt, P.F. Methods of Analysis for Soils, Plants and Waters; University of California, Division of Agricultural Sciences: Oakland, CA, USA, 1961. [Google Scholar]
  48. Husson, F.; Josse, J.; Le, S.; Mazet, J. FactoMineR: Multivariate Exploratory Data Analysis and Data Mining. R Package Version 2.3. 2020. Available online: https://CRAN.R-project.org/package=FactoMineR (accessed on 3 June 2023).
  49. Kassambara, A.; Mundt, F. Factoextra: Extract and Visualize the Results of Multivariate Data Analyses, R Package v. 1.0.7. 2020. Available online: https://CRAN.R-project.org/package=factoextra (accessed on 3 June 2023).
  50. Kannan, C.; Divya, M.; Rekha, G.; Maruthi, P.; Hajira, S.; Sundaram, R.M. Diversity analysis of antagonistic microbes against bacterial leaf and fungal sheath blight diseases of rice. Egypt. J. Biol. Pest Cont. 2021, 31, 115. [Google Scholar] [CrossRef]
  51. Nawaz, M.E.; Malik, K.; Hassan, M.N. Rice-associated antagonistic bacteria suppress the Fusarium fujikoroi causing rice bakanae disease. Biol. Cont. 2022, 67, 101–109. [Google Scholar] [CrossRef]
  52. Caulier, S.; Nannan, C.; Gillis, A.; Licciardi, F.; Bragard, C.; Mahillon, J. Overview of the Antimicrobial Compounds Produced by Members of the Bacillus subtilis group. Front. Microbiol. 2019, 10, 302. [Google Scholar] [CrossRef] [Green Version]
  53. Adrien, B.; Martin, F. Phenazines in plant-beneficial Pseudomonas spp. biosynthesis, regulation, function and genomics. Environ. Microbiol. 2018, 20, 3905–3917. [Google Scholar]
  54. Pandit, M.A.; Kumar, J.; Gulati, S.; Bhandari, N.; Mehta, P.; Katyal, R.; Rawat, C.D.; Mishra, V.; Kaur, J. Major Biological Control Strategies for Plant Pathogens. Pathogens 2022, 11, 273. [Google Scholar] [CrossRef]
  55. Moubark, M.Y.; Abdel-Monaim, M.F. Effect of bio-control agents on yield, yield components and root rot control in two wheat cultivars at New Valley region. Not. Sci. Biol. 2011, 3, 79–87. [Google Scholar] [CrossRef] [Green Version]
  56. Ivica, D.; Tamara, J.; Marija, P.; Giuliano, D.; Djordje, F. Plant-associated Bacillus and Pseudomonas antimicrobial activities in plant disease suppression via biological control mechanisms—A review. Physiol. Mol. Plant Pathol. 2022, 117, 101754. [Google Scholar]
  57. Stuti, S.; Shweena, K.; Rajni, S. Pseudomonas mediated nutritional and growth promotional activities for sustainable food security. Microbiol. Curr. Res. 2021, 2, 2666–5174. [Google Scholar]
  58. Tian, J.; Ge, F.; Zhang, D.; Deng, S.; Liu, X. Roles of Phosphate Solubilizing Microorganisms from Managing Soil Phosphorus Deficiency to Mediating Biogeochemical P Cycle. Biol. J. 2021, 10, 158. [Google Scholar] [CrossRef]
  59. Sowmya, V.; Raja Gopalan, N.S.; Maruthi, P.; Baskar, M.; Umadevi, G.; Ladha Lakshmi, D.; Koteshwar, P.; Jesudasu, G.; Santhosha, R.; Srinivas, P.; et al. Native bio-control agents from the rice fields of Telangana, India: Characterization and unveiling the potential against stem rot and false smut diseases of rice. Res. Sq. 2023. [Google Scholar] [CrossRef]
  60. Burns, R.G. Enzyme activity in soil: Location and a possible role in microbial ecology. Soil Biol. Biochem. 1982, 14, 423–427. [Google Scholar] [CrossRef]
  61. Mukherjee, M.; Mukherjee, P.K.; Horwitz, B.A.; Zachow, C.; Berg, G.; Zeilinger, S. Trichoderma-plant-pathogen interactions: Advances in genetics of biological control. Indian J. Microbiol. 2012, 52, 522–529. [Google Scholar] [CrossRef] [Green Version]
  62. Singh, J.S.; Koushal, S.; Kumar, A.; Vimal, S.R.; Gupta, V.K. Book review: Microbial inoculants in sustainable agricultural Productivity—Vol. II: Functional application. Front. Microbiol. 2016, 7, 7. [Google Scholar] [CrossRef] [Green Version]
  63. Halifu, S.; Deng, X.; Song, X.; Song, R.; Liang, X. Inhibitory mechanism of Trichoderma virens ZT05 on Rhizoctonia solani. Plants 2020, 9, 912. [Google Scholar] [CrossRef]
  64. Rais, A.; Jabeen, Z.; Shair, F.; Hafeez, F.; Hassan, M. Bacillus spp. a bio-control agent enhances the activity of antioxidant defense enzymes in rice against Pyricularia oryzae. PLoS ONE 2017, 12, e0187412. [Google Scholar] [CrossRef] [Green Version]
  65. Wiesel, L.; Newton, A.C.; Elliott, I.; Booty, D.; Gilroy, E.M.; Birch, P.R.J.; Hein, I. Molecular effects of resistance elicitors from biological origin and their potential for crop protection. Front. Plant Sci. 2014, 5, 655. [Google Scholar] [CrossRef] [Green Version]
  66. Deice Raasch-Fernandes, L.; Bonaldo, S.M.; Jesus Rodrigues, D.; Magela Vieira-Junior, G.; Regina Freitas Schwan-Estrada, K.; Rocco da Silva, C.; Gabriela Araújo Verçosa, A.; Lopes de Oliveira, D.; Wender Debiasi, B. Induction of phytoalexins and proteins related to pathogenesis in plants treated with extracts of cutaneous secretions of southern Amazonian Bufonidae amphibians. PLoS ONE 2019, 14, e0211020. [Google Scholar] [CrossRef] [Green Version]
  67. Zandi, P.; Schnug, E. Reactive Oxygen Species, Antioxidant Responses and Implications from a Microbial Modulation Perspective. Biology 2022, 11, 155. [Google Scholar] [CrossRef]
  68. Kaur, S.; Samota, M.K.; Choudhary, M.; Abhay, K.P.; Anshu, S.; Julie, T. How do plants defend themselves against pathogens-Biochemical mechanisms and genetic interventions. Physiol. Mol. Biol. Plants 2022, 28, 485–504. [Google Scholar] [CrossRef]
  69. Aryal, S.; Baniya, M.K.; Danekhu, K.; Kunwar, P.; Gurung, R.; Koirala, N. Total Phenolic Content, Flavonoid Content and Antioxidant Potential of Wild Vegetables from Western Nepal. Plants 2019, 8, 96. [Google Scholar] [CrossRef] [Green Version]
  70. Jacoby, R.; Peukert, M.; Succurro, A.; Koprivova, A.; Kopriva, S. The Role of Soil Microorganisms in Plant Mineral Nutrition-Current Knowledge and Future Directions. Front. Plant Sci. 2017, 8, 1617. [Google Scholar] [CrossRef] [Green Version]
  71. Ahmad, M.I.; Biswas, A.K.; Sultana, M.S.; Sarker, B.C.; Mondal, C. Effect of Different Media and pH on Mycelial Growth of Sclerotium oryzae Causing Sheath Rot of Rice. South Asian J. Agric. 2019, 18, 67–72. [Google Scholar] [CrossRef]
  72. Du, J.X.; Li, Y.; Ur-Rehman, S.; Mukhtar, I.; Yin, Z.; Dong, H.; Wang, H.; Zhang, X.; Gao, Z.; Zhao, X.; et al. Synergistically promoting plant health by harnessing synthetic microbial communities and prebiotics. iScience 2021, 24, 102918. [Google Scholar] [CrossRef]
  73. Hibbing, M.E.; Fuqua, C.; Parsek, M.R.; Peterson, S.B. Bacterial competition: Surviving and thriving in the microbial jungle. Nat. Rev. Microbiol. 2010, 8, 15–25. [Google Scholar] [CrossRef] [Green Version]
  74. Keim, R.; Webster, R.K. Fungistasis of sclerotia of Sclerotium oryzae. Phytopathology 1975, 65, 283–287. [Google Scholar] [CrossRef]
  75. Yadav, R.L.; Shukla, S.K.; Suman, A.; Singh, P.N. Trichoderma inoculation and trash management effects on soil microbial biomass, soil respiration, nutrient uptake and yield of ratoon sugarcane under subtropical conditions. Biol. Fertil. Soils 2009, 45, 461–468. [Google Scholar] [CrossRef]
  76. Kapri, A.; Tewari, L. Phosphate solubilization potential and phosphatase activity of rhizospheric Trichoderma spp. Braz. J. Microbiol. 2010, 41, 787–795. [Google Scholar] [CrossRef] [Green Version]
  77. Kucuk, C.; Kivanc, M.; Kinaci, E.; Kinaci, G. Determination of the growth and solubilization capabilities of Trichoderma harzianum T1. Biologia 2008, 63, 167–170. [Google Scholar] [CrossRef]
  78. Nannipieri, P.; Kandeler, E.; Ruggiero, P. Enzyme activities and microbiological and biochemical processes in Soil. In Enzymes in the Environment; Marcel Dekker Inc.: New York, NY, USA, 2002; pp. 1–33. [Google Scholar]
  79. Gil-Sotres, F.; Trasar-Cepeda, C.; Leirós, M.C.; Seoane, S. Different approaches to evaluating soil quality using biochemical properties. Soil Biol. Biochem. 2005, 37, 877–887. [Google Scholar] [CrossRef]
  80. Ng, C.W.W.; Yan, W.H.; Tsim, K.W.K.; So, P.S.; Xia, Y.T.; To, C.T. Effects of Bacillus subtilis and Pseudomonas fluorescens as the soil amendment. Heliyon 2022, 8, e11674. [Google Scholar] [CrossRef]
  81. Qiu, L.P.; Liu, J.; Wang, Y.Q.; Sun, H.M.; He, W.X. Research on relationship between soil enzyme activities and soil fertility. Plant Nutr. Fert. Sci. 2004, 10, 277–280. [Google Scholar]
  82. Zenichi, M.; Fumie, I.; Konomi, T.; Masao, T. The Effects of Phosphorus and Magnesium on Sclerotium formation in Rhizoctonia solani Kühn. Jpn. J. Phytopathol. 1991, 57, 649–656. [Google Scholar]
  83. Ghasemi, S.; Safaie, N.; Shahbazi, S.; Shams-Bakhsh, M.; Askari, H. The Role of Cell Wall Degrading Enzymes in Antagonistic Traits of Trichoderma virens Against Rhizoctonia solani. Iran. J. Biotechnol. 2020, 18, e2333. [Google Scholar]
Figure 1. Inoculation process of S. oryzae and development of stem rot disease symptoms under glasshouse conditions: (a) S. oryzae pure culture, (b) S. oryzae multiplied in dried bits of rice stem, (c) S. oryzae infection on the stem of the rice plant, (d) formation of sclerotial bodies at the base of the stem, (e) severe infection of the rice plant upon S. oryzae infection, and (f) maintenance of favorable conditions for S. oryzae multiplication.
Sustainability 15 11768 g001
Figure 2. Antagonistic effect of different bioagents on S. oryzae under in vitro conditions: (a) control stem rot disease pathogen, (b) interaction of TAIK1 with S. oryzae, (c) interaction of BIK3 with S. oryzae, (d) interaction of PIK1 with S. oryzae, and (e) interaction of POPS1 with S. oryzae.
Sustainability 15 11768 g002
Figure 3. Antagonistic effect of single and combined application of bioagents on stem rot disease of rice caused by S. oryzae under in vivo conditions: (a) control plant upon challenge inoculation with S. oryzae, (b) TAIK1-treated plant upon challenge inoculation with S. oryzae, (c) BIK3-treated plant upon challenge inoculation with S. oryzae, (d) PIK1-treated plant upon challenge inoculation with S. oryzae, (e) POPS1-treated plant upon challenge inoculation with S. oryzae, and (f) consortium-treated plant upon challenge inoculation with S. oryzae.
Sustainability 15 11768 g003
Figure 4. Effect of individual bioagents and the consortium of four bioagents on plant growth promotion activities under glasshouse conditions.
Sustainability 15 11768 g004
Figure 5. Stacked circular bar plot depicts the changes in soil properties and plant growth parameters over a crop period at regular intervals upon treatment with single bioagents and the consortium of bioagents. Each bar represents the mean ± SE of 6 biological replicate plants from 2 experiments with significant differences (p < 0.05, DMRT, R) at 7, 14, 21, 45, 60, and 90 DAS.
Sustainability 15 11768 g005
Figure 6. Box plot illustrates the changes in defense enzymes’ activities upon challenge inoculation with S. oryzae. Each box plot represents the mean ± SE of 8 treatments at different intervals upon inoculation with the stem rot disease pathogen, with a significant difference of p < 0.05 (DMRT, OPSTAT) between treated and control plants.
Sustainability 15 11768 g006
Figure 7. Graphical interpretation of the relationship between changes in soil properties, PDI, and plant growth parameters of plants treated with bioagents.
Sustainability 15 11768 g007
Figure 8. Principal component analysis (PCA) of the effect of single bioagents and the consortium of four bioagents on soil and plant growth parameters with percentage disease: (a) biplot and (b) scree plot. PDI: percentage disease index; PN: plant nitrogen; PP: plant phosphorus; PK: plant potassium; SN: soil nitrogen; SP: soil phosphorus; SK: soil potassium; U: urease; AP: acid phosphatase; ALP: alkaline phosphatase; D: dehydrogenase; SL: shoot length; RL: root length; FW: fresh weight; DW: dry weight; EC; electrical conductivity; OC: organic carbon; KL: kernel length; KB: kernel breadth; NT: no. of tillers; NP: no. of panicles; PL: panicle length; GY: grain yield; and TW: test weight.
Sustainability 15 11768 g008
Table 1. Descriptive statistics of changes in plant growth, yield, and disease index parameters upon application of single bioagents and the consortium of bioagents. The data represent the mean ± SE of 10 seedlings from 2 experiments collected at different stages of growth, viz., 7, 14, 21, 45, 60, and 90 DAS, after treatment with bioagents. Numerical values with different letters are significantly different (p < 0.05, DMRT, OPSTAT).
BioagentsShoot Length (cm)Root Length (cm)Fresh Weight (g)Dry Weight (g)No. of TillersNo. of PaniclesKernel Length (mm)Kernel Breadth (mm)Panicle Length (cm)Test Weight (g)Grain Yield/Hill (g)PDI (%)
PIK148.77 c31.20 c32.20 c10.50 c19.82 b8.44 c5.80 bc2.60 ab22.80 c21.50 c16.10 c26.38 d
POPS141.60 e25.20 d23.30 e7.83 e18.99 c7.99 d5.60 cd2.30 bc20.00 e18.50 e14.00 e38.73 b
BIK344.07 d25.77 d26.50 d8.93 d19.01 c8.11 d5.70 c2.40 bc21.20 d20.00 d15.00 d36.88 c
TAIK150.90 b33.87 b35.67 b12.00 b20.11 d9.63 b6.00 ab2.70 ab23.80 b22.20 b17.10 b24.06 e
Consortium58.33 a39.03 a41.53 a13.57 a22.32 a10.50 a6.20 a2.90 a25.80 a24.10 a19.10 a19.32 f
Control36.90 f22.33 e18.00 f6.97 f18.54 d7.32 e5.40 d2.10 c19.20 f17.70 f11.20 f75.24 a
CD0.3580.6050.1960.1810.3610.2850.0670.1490.0880.0960.3062.006
CV0.6471.2670.6471.8300.6630.6870.6613.4610.2310.3680.8713.290
SEm0.1160.1970.0640.0590.0340.0250.0220.0490.0290.0310.0180.023
Table 2. Descriptive statistics of changes in soil properties upon bioagent application over a crop period. The data represent the mean ± SE of 3 samples from 2 experiments collected at different stages of growth, viz., 7, 14, 21, 45, 60, and 90 DAS, after treatment with bioagents. Numerical values with different letters are significantly different (p < 0.05, DMRT, OPSTAT).
BioagentsSoil pHECOCUreaseAcid
Phosphatase
Alkaline
Phosphatase
DehydrogenaseSoil NSoil PSoil KPlant NPlant PPlant K
PIK18.24 a0.75 a0.64 a6.18 b1.25 ab1.66 ab12.96 c283.15 c17.06 c216.35 c0.41 b0.07 ab1.23 ab
POPS18.15 a0.73 a0.60 a5.85 c0.85 cd1.42 b11.35 d235.21 e12.39 e181.72 e0.27 c0.04 b1.01 ab
BIK38.20 a0.74 a0.61 a6.10 b0.64 d1.46 b11.58 d247.63 d14.01 d195.27 d0.38 b0.05 ab1.10 ab
TAIK18.25 a0.75 a0.65 a6.32 b1.00 bc1.67 ab14.60 b297.67 b19.67 b249.42 b0.47 b0.08 ab0.93 b
Consortium8.28 a0.76 a0.68 a7.33 a1.39 a1.78 a16.44 a315.82 a24.91 a288.28 a0.58 a0.11 a1.58 a
Control8.08 a0.72 a0.57 b0.73 d0.09 e0.90 c0.14 e155.18 f7.87 f121.29 f0.21 c0.02 b0.76 c
CD0.0230.0280.2680.0570.0700.0740.1110.0240.0020.7720.0090.0011.952
CV1.5781.9261.3602.7271.3351.9609.5480.3521.9932.4301.3425.9142.564
SEm0.0750.0080.1270.0180.0220.0240.0350.0080.0010.2520.0030.0010.638
Table 3. Stepwise regression analysis for shoot length with soil parameters upon bioagent treatment.
Soil and Plant
Characteristics
ParametersEstimatesStandard ErrorProbabilityPartial R-SquareModel R-Square
pHPOPS10.970.050.06240.040.95
BIK30.620.06<0.00010.91
ECBIK30.650.08<0.00010.960.9552
OCPIK10.680.06<0.00010.940.9414
Available NTAIK10.390.03<0.00010.940.9403
Available PPIK10.690.05<0.00010.950.9527
Available KPIK10.690.050.00030.330.9462
Consortium0.890.1<0.00010.61
UreaseConsortium0.90.03<0.00010.960.959
Acid PhosphatasePOPS10.630.01<0.00010.980.9783
Alkaline PhosphatasePOPS10.40.050.00370.050.9702
BIK30.140.020.00250.84
TAIK10.550.070.00730.08
DehydrogenasePOPS10.420.08<0.00010.960.9633
Plant NBIK30.440.030.00980.590.76
Consortium0.570.070.0550.18
Plant PPOPS10.990.050.02870.020.9785
BIK30.490.09<0.00010.96
Plant KPIK10.70.090.09940.030.9836
POPS10.510.020.05480.03
BIK30.4800.09920.01
Consortium0.350.05<0.00010.91
Table 4. Stepwise regression analysis for root length with soil parameters upon bioagent treatment.
Soil and Plant
Characteristics
ParametersEstimatesStandard ErrorProbabilityPartial R-SquareModel R-Square
pHPOPS10.670.08<0.00010.920.96
BIK30.50.030.03670.04
ECBIK30.690.09<0.00010.960.9571
OCPIK10.770.01<0.00010.960.9608
Available NTAIK10.260.02<0.00010.960.9643
Available PPIK10.490.03<0.00010.970.973
Available KPIK10.250.060.00110.580.9169
Consortium0.970.050.01040.34
UreaseTAIK10.650.1<0.00010.970.9685
Acid PhosphatasePOPS10.120.06<0.00010.980.9785
Alkaline PhosphatasePOPS10.960.020.12150.040.9753
BIK30.570.030.00010.86
TAIK10.430.030.00590.07
DehydrogenasePOPS10.680.03<0.00010.970.9726
Plant NBIK30.430.020.01910.520.7677
Consortium0.590.060.02850.25
Plant PPIK10.570.04<0.00010.940.9412
Plant KPIK10.550.050.05270.030.9757
TAIK10.70.050.07520.02
Consortium0.490.06<0.00010.92
Table 5. Stepwise regression analysis for fresh weight with soil parameters upon bioagent treatment.
Soil and Plant
Characteristics
ParametersEstimatesStandard ErrorProbabilityPartial R-SquareModel R-Square
pHPOPS10.880.05<0.00010.90.9383
BIK30.670.050.07480.04
ECBIK30.820.03<0.00010.940.9403
OCPIK10.650.07<0.00010.930.9332
Available NTAIK10.290.03<0.00010.940.935
Available PPOPS10.830.07<0.00010.940.9432
Available KBIK30.080.030.14650.320.9712
Consortium0.580.02<0.00010.65
UreaseTAIK10.280.05<0.00010.940.9367
Acid PhosphatasePOPS10.660.01<0.00010.960.9731
Consortium0.360.020.09290.01
Alkaline PhosphatasePOPS10.120.040.10.070.9657
BIK30.670.060.00050.8
TAIK10.070.010.00570.1
DehydrogenasePIK10.610.07<0.00010.960.9641
Plant NBIK30.760.030.02060.510.738
Consortium0.80.060.04240.23
Plant PBIK30.250.03<0.00010.930.9349
Plant KPIK10.450.050.04380.060.9822
POPS10.720.070.03430.04
BIK30.670.050.12440.01
Consortium0.720.1<0.00010.88
Table 6. Stepwise regression analysis for dry weight with soil parameters upon bioagent treatment.
Soil and Plant
Characteristics
ParametersEstimatesStandard ErrorProbabilityPartial R-SquareModel R-Square
pHPOPS10.070.090.08770.90.93
BIK30.050.07<0.00010.04
ECBIK30.060.06<0.00010.950.9624
Consortium0.060.020.14580.01
OCPIK10.670.07<0.00010.940.9381
Available NTAIK10.100.01<0.00010.940.9432
Available PPIK10.070.01<0.00010.950.9483
Available KBIK30.070.040.09650.580.9398
Consortium0.180.030.01130.36
UreaseConsortium0.140.07<0.00010.950.9494
Acid PhosphatasePOPS10.130.09<0.00010.970.9827
Consortium0.810.050.07260.01
Alkaline PhosphatasePOPS10.680.010.09830.060.9716
BIK30.450.080.00030.82
TAIK10.520.070.00440.09
DehydrogenasePIK10.250.02<0.00010.970.9699
Plant NPIK10.400.060.04720.210.7497
BIK30.700.100.0150.54
Plant PPOPS10.510.030.09280.020.9673
BIK30.590.01<0.00010.95
Plant KPIK10.650.070.09440.040.9807
POPS10.860.010.07020.03
BIK30.730.050.06650.02
Consortium0.960.01<0.00010.89
Disclaimer/Publisher’s Note: The statements, opinions and data contained in all publications are solely those of the individual author(s) and contributor(s) and not of MDPI and/or the editor(s). MDPI and/or the editor(s) disclaim responsibility for any injury to people or property resulting from any ideas, methods, instructions or products referred to in the content.

