
Interaction Patterns of Motorists and Cyclists at Intersections: Insight from a Vehicle–Bicycle Simulator Study


Abstract
1. Introduction
1.1. Motivation
1.2. Implicit Signals and Interaction Patterns
1.3. The State of the Art
1.4. Current Study
2. Methods
2.1. Participants
2.2. Set-Up and Design
2.2.1. Study Design
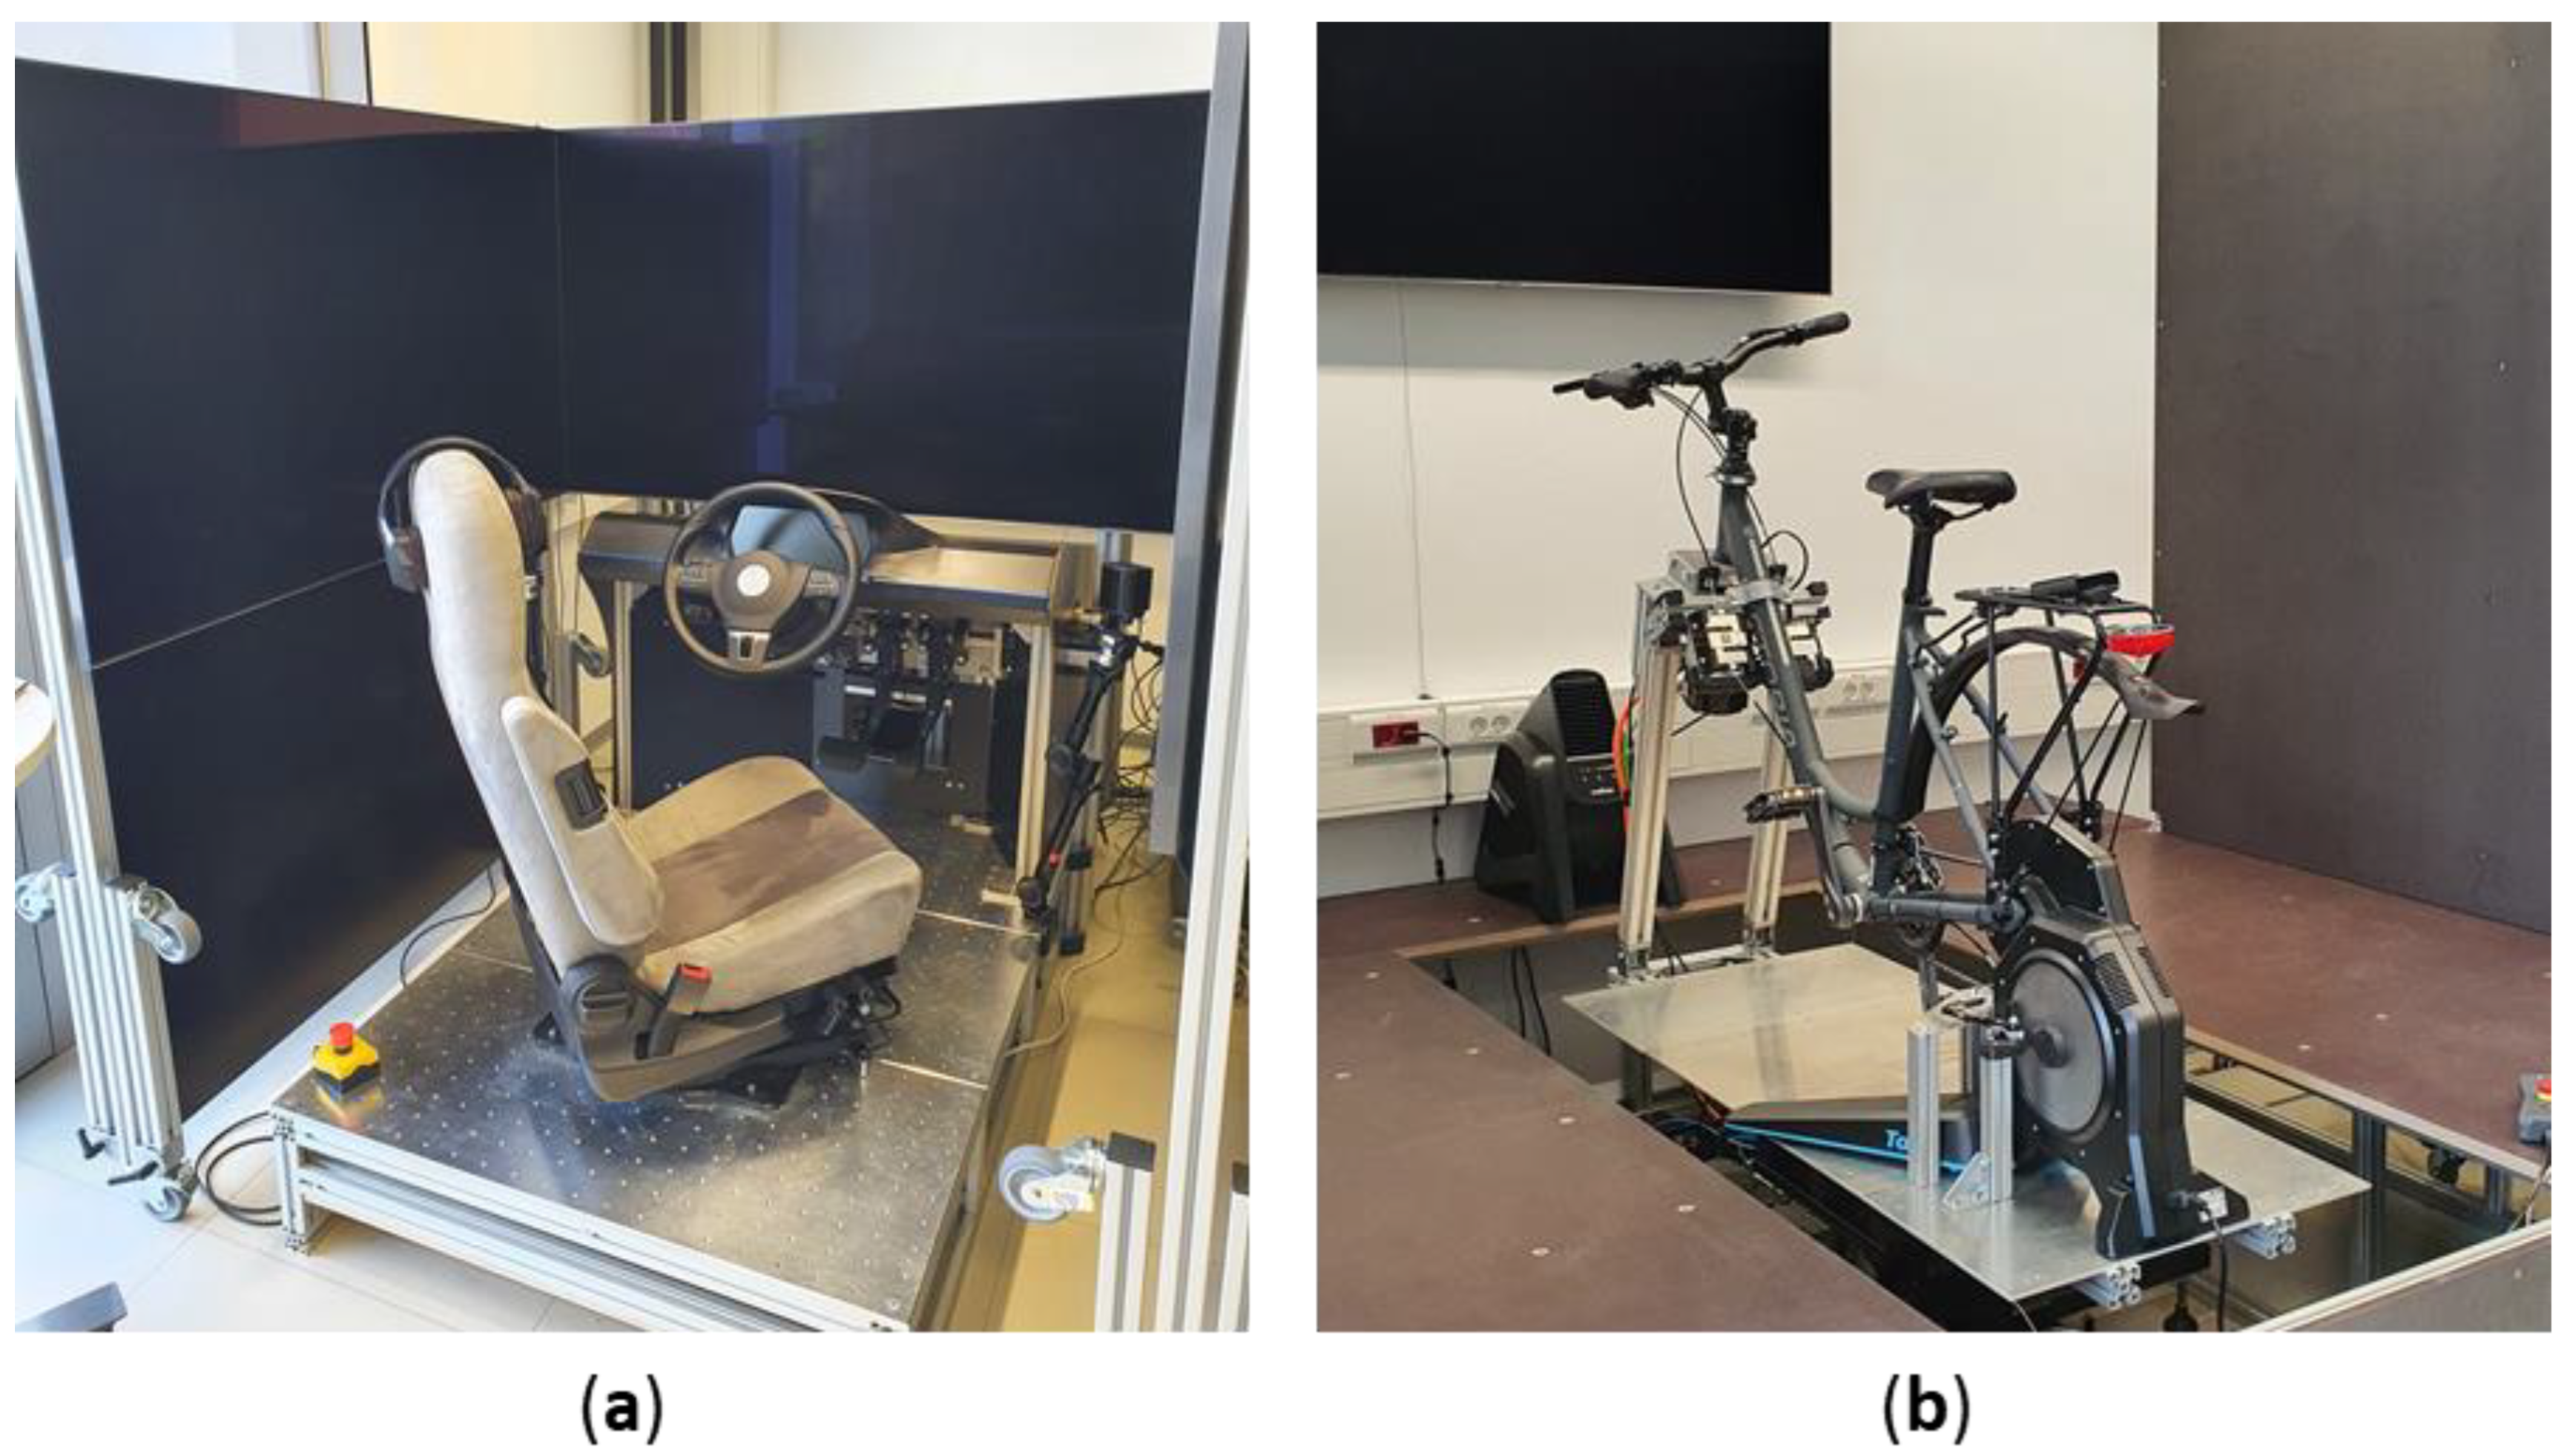
2.2.2. Coupled Simulator
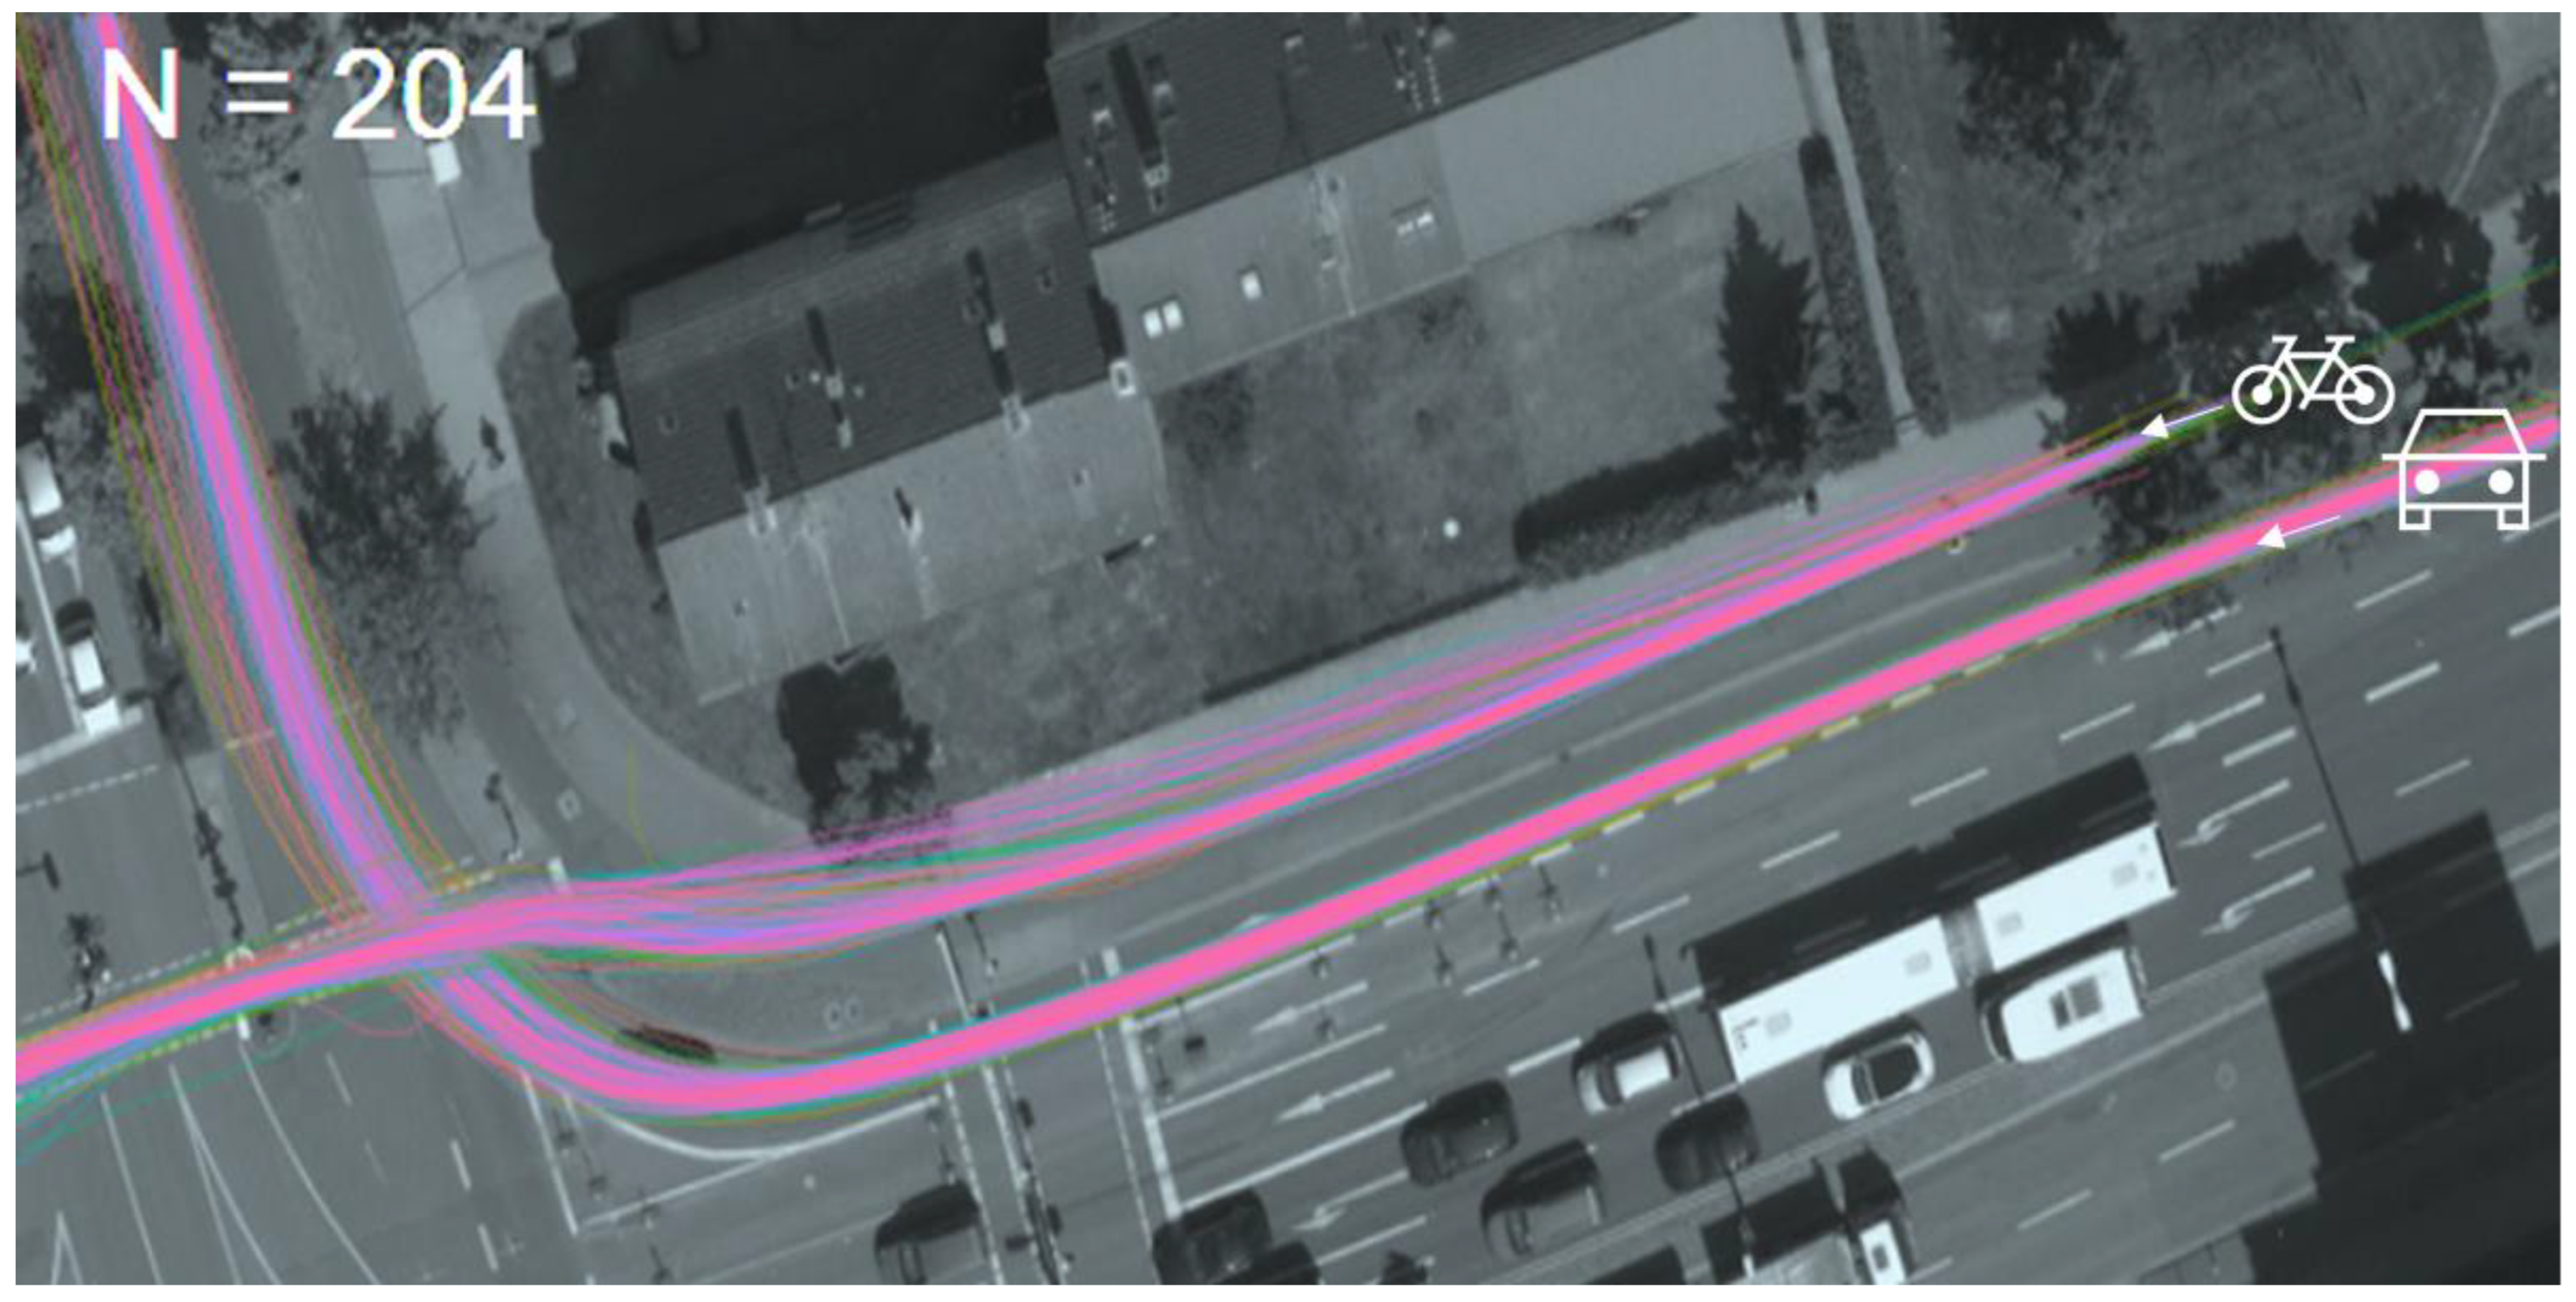
2.2.3. Scenario
2.3. Procedure
2.4. Questionnaires
2.5. Analyses
3. Results
3.1. Interaction Patterns
3.1.1. Performance Parameters
- Speed difference
- Average speed
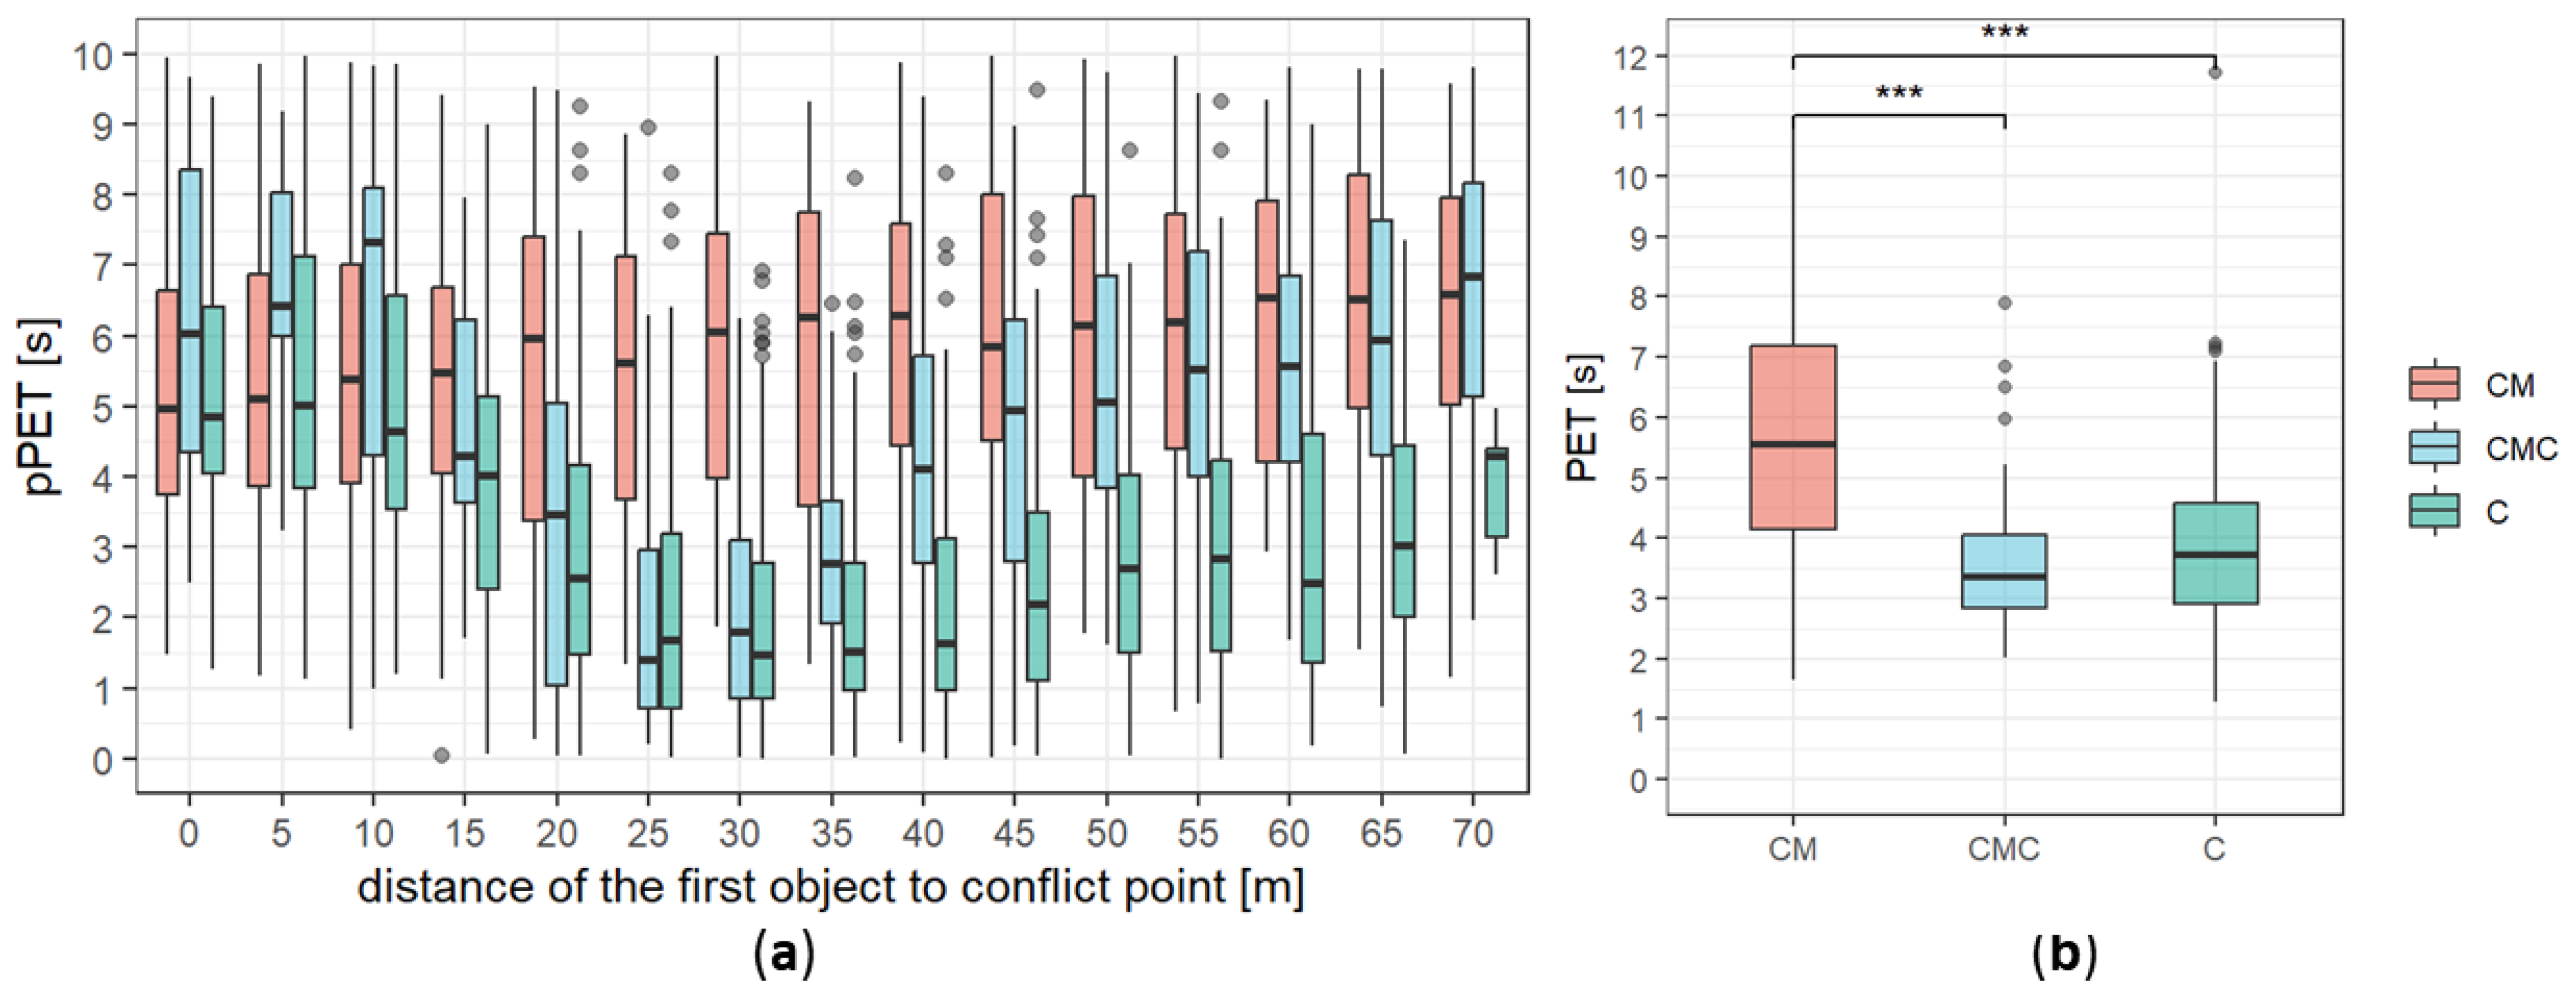
- pPET
- PET
3.1.2. Subjective Ratings
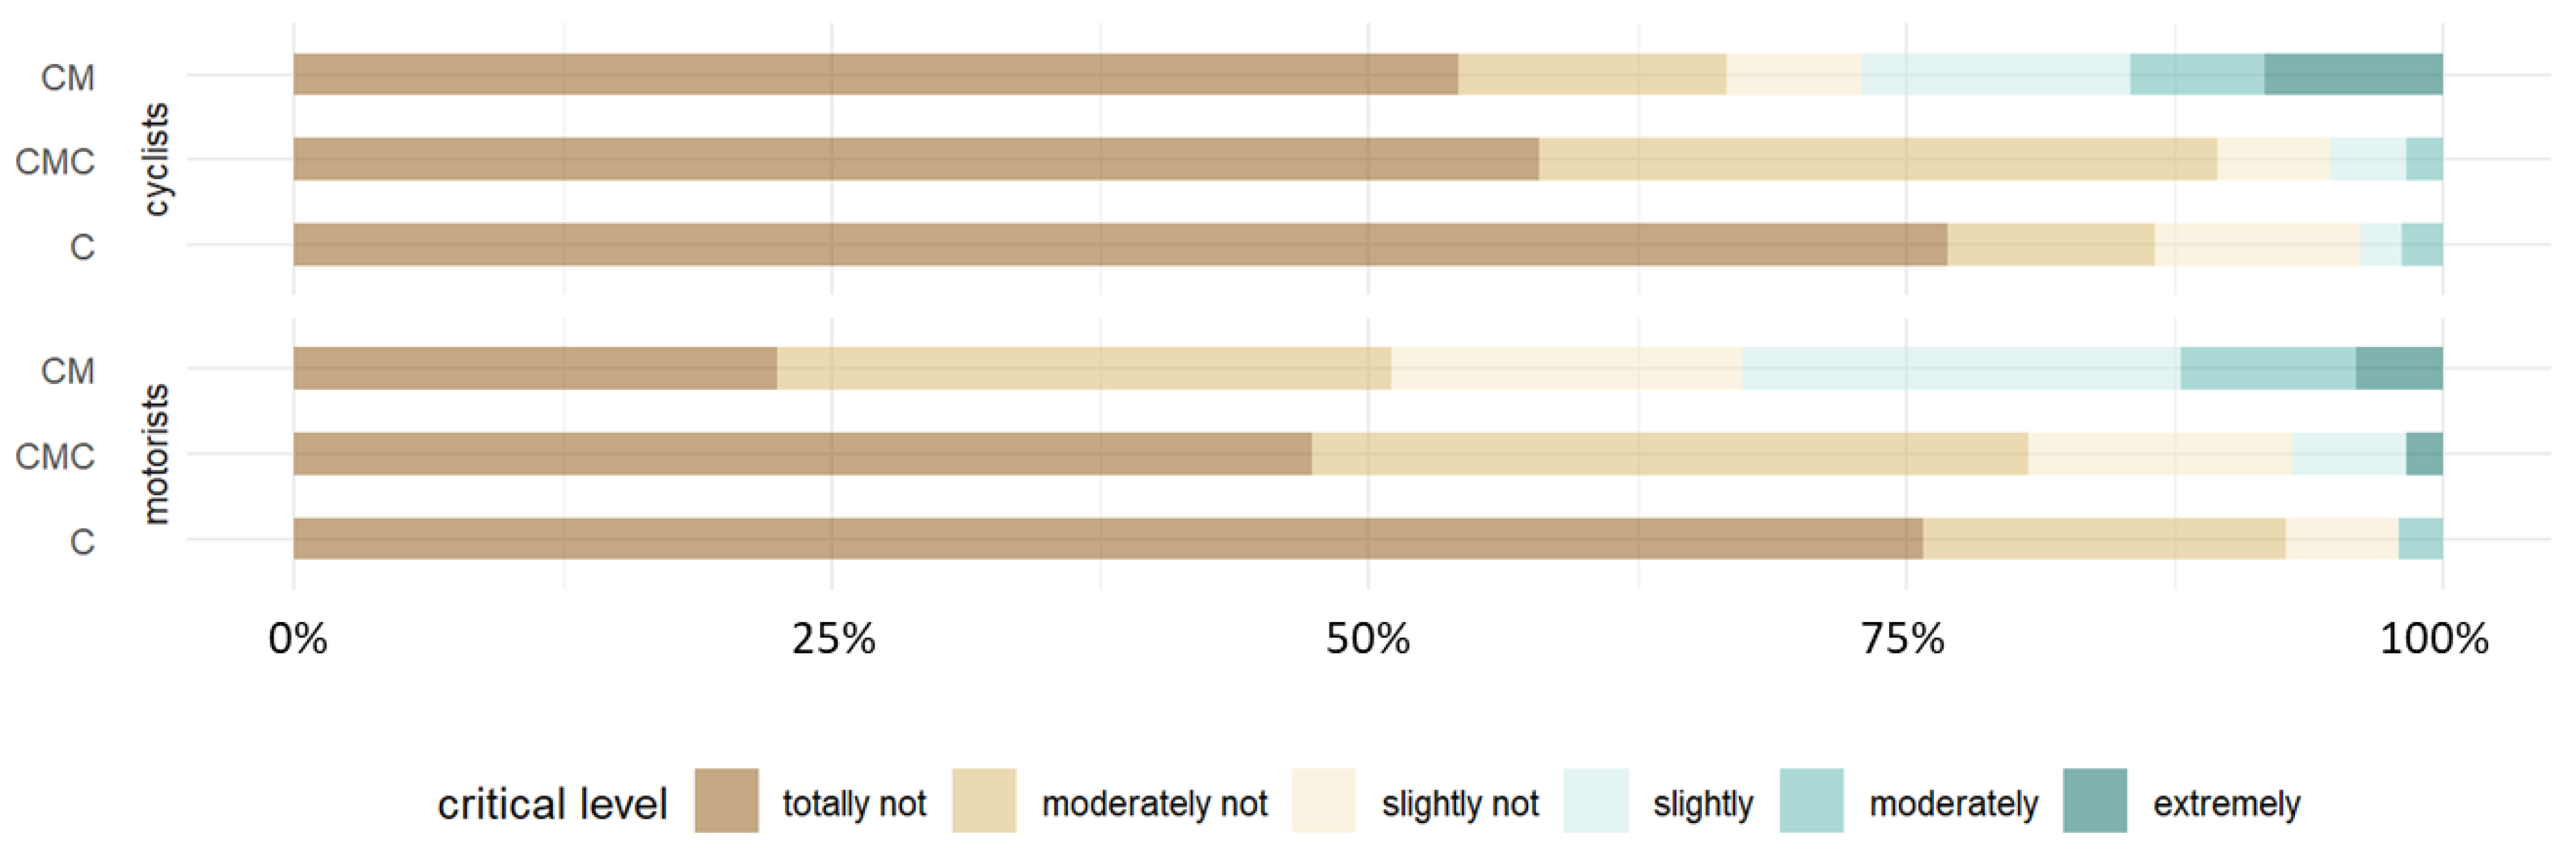
- Criticality
- Cooperation
- Certainty
3.2. Effect of Crossing Order and Overtaking Position
4. Discussion
5. Conclusions
Author Contributions
Funding
Institutional Review Board Statement
Informed Consent Statement
Data Availability Statement
Conflicts of Interest
References
- Markkula, G.; Madigan, R.; Nathanael, D.; Portouli, E.; Lee, Y.M.; Dietrich, A.; Billington, J.; Schieben, A.; Merat, N. Defining interactions: A conceptual framework for understanding interactive behaviour in human and automated road traffic. Theor. Issues Ergon. Sci. 2020, 21, 728–752. [Google Scholar] [CrossRef]
- Lee, Y.M.; Madigan, R.; Giles, O.; Garach-Morcillo, L.; Markkula, G.; Fox, C.; Camara, F.; Rothmueller, M.; Vendelbo-Larsen, S.A.; Rasmussen, P.H.; et al. Road users rarely use explicit communication when interacting in today’s traffic: Implications for automated vehicles. Cogn. Technol. Work. 2020, 23, 367–380. [Google Scholar] [CrossRef]
- Higgs, B.; Abbas, M.; Medina, A. Analysis of the Wiedemann Car Following Model over Different Speeds Using Naturalistic Data. Ph.D. Thesis, Virginia Tech, Blacksburg, VA, USA, September 2011. [Google Scholar]
- Fuest, T.; Sorokin, L.; Bellem, H.; Bengler, K. Taxonomy of Traffic Situations for the Interaction between Automated Vehicles and Human Road Users. In Advances in Human Aspects of Transportation; Stanton, N.A., Ed.; Springer International Publishing: Cham, Switzerland, 2018; pp. 708–719. [Google Scholar]
- Šucha, M. Road Users’ Strategies and Communication: Driver-Pedestrian Interaction. In Proceedings of the Transport Research Arena (TRA), Paris, France, 14–17 April 2014. [Google Scholar]
- Beggiato, M.; Witzlack, C.; Krems, J.F. Gap Acceptance and Time-To-Arrival Estimates as Basis for Informal Communication between Pedestrians and Vehicles. In Proceedings of the 9th International Conference on Automotive User Interfaces and Interactive Vehicular Applications, Oldenburg, Germany, 24–27 September 2017; Association for Computing Machinery: Oldenburg, Germany, 2017; pp. 50–57. [Google Scholar]
- Ackermann, C.; Beggiato, M.; Bluhm, F.; Krems, J. Vehicle Movement and Its Potential as Implicit Communication Signal for Pedestrians and Automated Vehicles; HUMANIST Publications: The Hague, Netherlands, 2018; p. 7. [Google Scholar]
- Silvano, A.P.; Ma, X.; Koutsopoulos, H.N. When Do Drivers Yield to Cyclists at Unsignalized Roundabouts?: Empirical Evidence and Behavioral Analysis. Transp. Res. Rec. J. Transp. Res. Board 2015, 2520, 25–31. [Google Scholar] [CrossRef]
- Sakshaug, L.; Laureshyn, A.; Svensson, Å.; Hydén, C. Cyclists in roundabouts—Different design solutions. Accid. Anal. Prev. 2010, 42, 1338–1351. [Google Scholar] [CrossRef] [PubMed]
- De Ceunynck, T.; Polders, E.; Daniels, S.; Hermans, E.; Brijs, T.; Wets, G. Road Safety Differences between Priority-Controlled Intersections and Right-Hand Priority Intersections: Behavioral Analysis of Vehicle–Vehicle Interactions. Transp. Res. Rec. J. Transp. Res. Board 2013, 2365, 39–48. [Google Scholar] [CrossRef]
- Várhelyi, A. Drivers’ speed behaviour at a zebra crossing: A case study. Accid. Anal. Prev. 1998, 30, 731–743. [Google Scholar] [CrossRef] [PubMed]
- van Haperen, W.; Daniels, S.; De Ceunynck, T.; Saunier, N.; Brijs, T.; Wets, G. Yielding behavior and traffic conflicts at cyclist crossing facilities on channelized right-turn lanes. Transp. Res. Part F Traffic Psychol. Behav. 2018, 55, 272–281. [Google Scholar] [CrossRef]
- Zhang, M.; Dotzauer, M.; Schießl, C. Analysis of Implicit Communication of Motorists and Cyclists in Intersection Using Video and Trajectory Data. Front. Psychol. 2022, 13, 864488. [Google Scholar] [CrossRef] [PubMed]
- Laureshyn, A.; Svensson, Å.; Hydén, C. Evaluation of traffic safety, based on micro-level behavioural data: Theoretical framework and first implementation. Accid. Anal. Prev. 2010, 42, 1637–1646. [Google Scholar] [CrossRef] [PubMed]
- Rettenmaier, M.; Dinkel, S.; Bengler, K. Communication via motion—Suitability of automated vehicle movements to negotiate the right of way in road bottleneck scenarios. Appl. Ergon. 2021, 95, 103438. [Google Scholar] [CrossRef] [PubMed]
- Taylor, D.H. Drivers’ galvanic skin response and the risk of accident. Ergonomics 1964, 7, 439–451. [Google Scholar] [CrossRef]
- Fuller, R. Towards a general theory of driver behaviour. Accid. Anal. Prev. 2005, 37, 461–472. [Google Scholar] [CrossRef]
- Quante, L.; Zhang, M.; Preuk, K.; Schießl, C. Human Performance in Critical Scenarios as a Benchmark for Highly Automated Vehicles. Automot. Innov. 2021, 4, 274–283. [Google Scholar] [CrossRef]
- Vlakveld, W.; van der Kint, S.; Hagenzieker, M.P. Cyclists’ intentions to yield for automated cars at intersections when they have right of way: Results of an experiment using high-quality video animations. Transp. Res. Part F Traffic Psychol. Behav. 2020, 71, 288–307. [Google Scholar] [CrossRef]
- Calvi, A.; D’amico, F.; Ferrante, C.; Ciampoli, L.B. Driving Simulator Study for Evaluating the Effectiveness of Virtual Warnings to Improve the Safety of Interaction Between Cyclists and Vehicles. Transp. Res. Rec. J. Transp. Res. Board 2022, 2676, 436–447. [Google Scholar] [CrossRef]
- Bella, F.; Silvestri, M. Survival Model of Drivers’ Speed Reduction Time at Bicycle Crossroads: A Driving Simulator Study. J. Adv. Transp. 2018, 2018, e4738457. [Google Scholar] [CrossRef]
- Lindner, J.; Grigoropoulos, G.; Keler, A.; Malcolm, P.; Denk, F.; Brunner, P.; Bogenberger, K. A Mobile Application for Resolving Bicyclist and Automated Vehicle Interactions at Intersections. In Proceedings of the 2022 IEEE Intelligent Vehicles Symposium (IV), Aachen, Germany, 4–9 June 2022; pp. 785–791. [Google Scholar]
- Preuk, K.; Schießl, C. Benefits and Challenges of Multi-Driver-Simulator Studies. IET Intell. Transp. Syst. 2014, 9, 618–625. [Google Scholar] [CrossRef]
- Preuk, K.; Dotzauer, M.; Köster, F.; Jipp, M. Encounters Between Drivers with and Without Cooperative Intelligent Transport Systems. In UR:BAN Human Factors in Traffic: Approaches for Safe, Efficient and Stress-Free Urban Traffic; Bengler, K., Drüke, J., Hoffmann, S., Manstetten, D., Neukum, A., Eds.; ATZ/MTZ-Fachbuch; Springer Fachmedien: Wiesbaden, Germany, 2018; pp. 363–377. ISBN 978-3-658-15418-9. [Google Scholar]
- Lehsing, C.; Feldstein, I.T. Urban Interaction—Getting Vulnerable Road Users into Driving Simulation. In UR:BAN Human Factors in Traffic: Approaches for Safe, Efficient and Stress-Free Urban Traffic; Bengler, K., Drüke, J., Hoffmann, S., Manstetten, D., Neukum, A., Eds.; ATZ/MTZ-Fachbuch; Springer Fachmedien: Wiesbaden, Germany, 2018; pp. 347–362. ISBN 978-3-658-15418-9. [Google Scholar]
- Kennedy, R.S.; Lane, N.E.; Berbaum, K.S.; Lilienthal, M.G. Simulator Sickness Questionnaire: An Enhanced Method for Quantifying Simulator Sickness. Int. J. Aviat. Psychol. 1993, 3, 203–220. [Google Scholar] [CrossRef]
- Tomczak, M.; Tomczak, E. The Need to Report Effect Size Estimates Revisited. An Overview of Some Recommended Measures of Effect Size. Trends Sport Sci. 2014, 1, 19–25. [Google Scholar]
- Ripley, B.; Venables, B.; Bates, D.M.; Hornik, K.; Gebhardt, A.; Firth, D.; Ripley, M.B. Package ‘Mass’. Cran r 2013, 538, 113–120. [Google Scholar]
- Martinez Garcia, D.; Gröne, K.; Quante, L.; Fischer, M.; Thal, S.; Henze, R. Parameter Tuning of a Bicycle Simulator for a Realistic Riding Behaviour and Motion Perception. In Proceedings of the Driving Simulation Conference-DSC 2022, Strasbourg, FrankreichStrasbourg, 14–16 September 2022. [Google Scholar]
- Friedrich, M.; Nause, D.; Heesen, M.; Keich, A.; Kelsch, J.; Baumann, M.; Vollrath, M. Validation of the MoSAIC-Driving Simulator: Investigating the Impact of a Human Driver on Cooperative Driving Behavior in an Experimental Simulation Setup. In Proceedings of the Human Factors and Ergonomics Society Annual Meeting, Los Angeles, CA, USA, 1 September 2013; Volume 57, pp. 2052–2056. [Google Scholar]


| Addressee | Question | Response Scale |
|---|---|---|
| Cyclist | How critical would you rate the driving situation you just experienced? 1 | totally not critical (1)– extremely critical (6) |
| How confident were you that the vehicle would respond appropriately to you? 2 | totally not confident (1)– extremely confident (6) | |
| How cooperative would you rate the driving situation you just experienced? 3 | totally not cooperative (1)– extremely cooperative (7) | |
| Did you cross the road before or after the vehicle? 4 | before/after | |
| Motorist | How critical would you rate the driving situation you just experienced? 1 | totally not critical (1)– extremely critical (6) |
| How confident were you that you could turn in front of the cyclist? 2 | totally not confident (1)– extremely confident (6) | |
| How cooperative would you rate the driving situation you just experienced? 3 | totally not cooperative (1)– extremely cooperative (7) | |
| Did you turn before or after the bicycle? 4 | before/after |
| Parameter | Unit | Description |
|---|---|---|
| distance to conflict point | m | the longitudinal distance between the current position and the conflict point, where two trajectories intersect. |
| average speed | m/s | the mean value of the speeds of the bicycle or vehicle from the starting point until they reach the intersection |
| speed difference | m/s | the difference between the speeds of the vehicle and the bicycle at a given moment |
| PET | s | post encroachment time, an observed time, which describes the time interval by which two road users miss each other |
| pPET | s | predicted PET, the time at which the vehicle and bicycle would intersect if they maintain their current speeds at a given moment |
| Patterns | N (%) | Description |
|---|---|---|
| CM | 49 (24%) | cyclists are first in front of motorists but cross the intersection after motorists |
| CMC | 57 (28%) | cyclists are first in front of, then behind motorists, and cross the intersection before motorists |
| C | 98 (48%) | cyclists are always in front of motorists and cross the intersection before motorists |
| Criticality | Cooperation | Certainty | |||||
|---|---|---|---|---|---|---|---|
| Coeff. | t | Coeff. | t | Coeff. | t | ||
| Cyclist | crossing order 1 | 0.92 | 2.25 * | −2.4 | −5.7 *** | −0.6 | −1.7 - |
| overtaking position 2 | −0.1 | −3 ** | 0.04 | 1.88 - | 0.02 | 1.27 | |
| Motorist | crossing order 1 | 1.46 | 3.8 *** | −1.84 | −4.76 *** | 2.53 | 5.80 *** |
| overtaking position | −0.02 | −1.4 | 0 | 0.03 | 0.02 | 1.08 | |
Disclaimer/Publisher’s Note: The statements, opinions and data contained in all publications are solely those of the individual author(s) and contributor(s) and not of MDPI and/or the editor(s). MDPI and/or the editor(s) disclaim responsibility for any injury to people or property resulting from any ideas, methods, instructions or products referred to in the content. |
© 2023 by the authors. Licensee MDPI, Basel, Switzerland. This article is an open access article distributed under the terms and conditions of the Creative Commons Attribution (CC BY) license (https://creativecommons.org/licenses/by/4.0/).
Share and Cite
Zhang, M.; Quante, L.; Gröne, K.; Schießl, C. Interaction Patterns of Motorists and Cyclists at Intersections: Insight from a Vehicle–Bicycle Simulator Study. Sustainability 2023, 15, 11692. https://doi.org/10.3390/su151511692
Zhang M, Quante L, Gröne K, Schießl C. Interaction Patterns of Motorists and Cyclists at Intersections: Insight from a Vehicle–Bicycle Simulator Study. Sustainability. 2023; 15(15):11692. https://doi.org/10.3390/su151511692
Chicago/Turabian StyleZhang, Meng, Laura Quante, Kilian Gröne, and Caroline Schießl. 2023. "Interaction Patterns of Motorists and Cyclists at Intersections: Insight from a Vehicle–Bicycle Simulator Study" Sustainability 15, no. 15: 11692. https://doi.org/10.3390/su151511692
APA StyleZhang, M., Quante, L., Gröne, K., & Schießl, C. (2023). Interaction Patterns of Motorists and Cyclists at Intersections: Insight from a Vehicle–Bicycle Simulator Study. Sustainability, 15(15), 11692. https://doi.org/10.3390/su151511692