Abstract
Prolonged driving is necessary in underground construction caverns to transport materials, muck, and personnel, exposing drivers to high-risk and complex environments. Despite previous studies on attention and gaze prediction at tunnel exit-inlet areas, a significant gap remains due to the neglect of dual influences of long-distance driving and complex cues. To address this gap, this study establishes an experimental scenario in a construction environment, utilizing eye-tracking and simulated driving to collect drivers’ eye movement data. An analysis method is proposed to explore the visual change trend by examining the evolution of attention and calculating the possibility of visual cues being perceived at different driving stages to identify the attentional selection mechanism. The findings reveal that as driving time increases, fixation time decreases, saccade amplitude increases, and some fixations transform into unconscious saccades. Moreover, a phenomenon of “visual adaptation” occurs over time, reducing visual sensitivity to environmental information. At the start of driving, colorful stimuli and safety-related information compete for visual resources, while safety-related signs, particularly warning signs, always attract drivers’ attention. However, signs around intense light are often ignored. This study provides a scientific basis for transport safety in the construction environment of underground caverns.
1. Introduction
Underground engineering includes the engineering of traffic tunnels and underground caverns. Underground caverns are increasingly used in hydropower, mining, civil air defense, utility infrastructure, and other fields []. In particular, hydropower engineering often demands the construction of complex underground caverns under adverse conditions, such as complex terrain and geological conditions []. During the construction of underground caverns, drivers need to drive long distances in the access tunnels of the construction environment to transport muck, materials, equipment, and personnel []. Because of the complex environment and harsh construction conditions during the construction process, driving accidents have among the highest rates of injury and death in underground project construction []. These complex driving environments constantly threaten the safety of drivers. Access tunnels are connected to the working surface in underground construction caverns, as shown in Figure 1. For construction workers, driving and reversing vehicles may result in potentially life-threatening accidents. Therefore, it is of great significance to study driving safety in the construction process of underground caverns to reduce struck-by accidents and protect personnel (including drivers and workers).
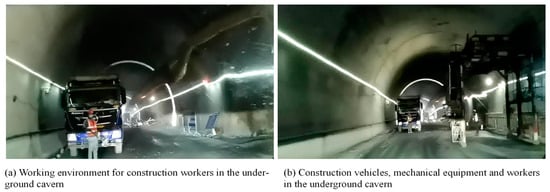
Figure 1.
Cross operation of construction and traffic in an underground cavern.
During the construction of underground caverns, access tunnels for auxiliary construction have some unique characteristics, including extended lengths, diverse functions, non standardized facilities, and intense visual cues. A schematic diagram and photographs of the particular driving environment of an underground cavern under construction are shown in Figure 2. When a driver drives in an underground construction cavern, the main driving conditions include the following. First, prolonged driving underground is required to assist in transporting muck, materials, and personnel in underground construction caverns. In a dark environment, prolonged driving increases the driver’s mental load, driving fatigue, and negatively affects drivers’ risk perception [,]. Second, the environment of underground caverns in the construction stage is harsher than the traffic tunnel environment. For instance, uneven illumination affects the driver’s observation abilities and leads the driver ignoring some critical visual cues for safe driving. Third, there are complex visual cues, including traffic-related visual cues and construction safety-related visual cues in construction caverns. The driver receives complex visual cues in a short time, which distracts the driver. Finally, these complex visual cues are temporarily set up as construction progresses. The arrangement of visual cues is casual and messy compared to that in a traffic tunnel. These multiple and messy visual cues lead the driver to misjudge the priority of information or to be unable to make decisions quickly and accurately. Thus, drivers are highly prone to security incidents while driving in underground construction caverns. The particularity of the driving environment of underground construction caverns (i.e., long-distance driving and complex visual cues) indicates the necessity for further in-depth studies on driving safety in underground construction caverns.
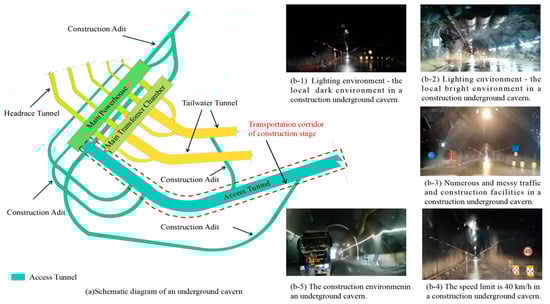
Figure 2.
Location of an access tunnel in underground engineering and common environmental problems related to safe driving in access tunnels.
A driver needs to extract helpful information from visual cues in the driving environment to ensure driving safety [,]. There are two main ways to explore the ability of drivers to acquire environmental information. One is inferring visual perception by measuring and evaluating the reaction times of drivers’ decision-making behaviors [], and the other is exploring visual perception by extracting eye movement data in real time using sensing technology. The method of utilizing a driver’s response times to analyze the driver’s ability to acquire driving information is indirect and less accurate. Vision is a sensory perception, and the best way to detect it is to obtain eye movement data in real-time using sensing technology []. As an effective way to collect, identify, and process information, sensor-based technology is a new generation of methods for advancing construction safety management []. An eye tracker, as a type of sensor, provides technical support for extracting eye movement data. Eye movement data can be used to analyze a driver’s visual behavior, such as average fixation time, saccade rate, and saccade range []. The average fixation time is the average duration of gaze behavior in a given area, also known as the average fixation duration. The saccade rate is the number of times an eye is scanned per unit of time. The saccade range is the scanning angle of the eye between the two effective fixation points of the observer. Eye-tracking technology based on sensing technology dramatically improves the collection of eye-tracking information, data transmission, and data processing, supplying the necessary technical support for implementing our research.
In driving safety, research for underground engineering based on drivers’ vision, exploring the impact of environmental features and driving characteristics on vision in completed traffic tunnels is a mainstream approach. Entrance and exit locations, lighting environment, vehicle speed, driving duration, and driving experience are recognized as the primary factors that affect driving safety [,]. Accidents in extra-long tunnels account for 70.4% of all tunnel traffic accidents []. As the driving time in a tunnel increases, the probability of an accident also increases. Especially in extra-long tunnels with lengths greater than or equal to 10 km, the visual perception ability of drivers is reduced, which significantly decreases driving safety []. Compared to normally completed traffic tunnels, drivers need to spend more time driving in underground construction caverns because of the long-distance access tunnels of underground caverns and speed limitations caused by construction. Simultaneously, the driving environment of underground construction caverns is characterized by inadequate landscape richness, dark and monotonous driving environments, a high similarity of visual cues, and deficient stimulation. A driver drives for a long time in an underground engineering environment, which results in decreased alertness and the neglect of critical visual cues, leading to rapidly reduced driving safety []. However, few studies have explored the neglect of visual cues and the regularity of drivers’ visual attention during prolonged driving in underground caverns. Hence, it is crucial to investigate the change in drivers’ visual features, such as gaze and saccade patterns and preferences of attention towards visual cues when driving long distances for the sake of ensuring driver safety.
In addition, compared with completed traffic tunnels, the visual cues formed by the combination of temporarily installed traffic and construction safety facilities are more complex in underground construction caverns, which causes drivers to spend more time capturing visual cues. There is no provision in China’s current regulations for the management of traffic and construction safety in temporary facilities at the construction sites of underground caverns. One of the main reasons is that drivers’ visual attention characteristics in underground construction caverns are not well understood. Hence, ensuring the accurate capture of important information from complex visual cues is the key to optimizing temporary safety signs at construction sites and ensuring driver safety. However, to date, drivers’ visual attention mechanism under the dual influence of long-distance driving and complex visual cues has not been explored in the driving environment of underground construction caverns.
This study explores the visual attention mechanism during long-distance driving in an underground cavern under construction to fill the gaps in previous research. An experimental scenario based on the construction environment is established to collect drivers’ eye movement data using eye tracking and simulated driving. An analysis method of the evolution law of attention is proposed to explore the change trend of drivers’ vision. The possibility of different visual cues being perceived at different driving stages is calculated to reveal the selection mechanism of visual attention in complex environments.
The remainder of this paper is organized as follows: A literature review on driver vision research and the application of eye-tracking is presented in Section 2. The primary purpose is to further elaborate on the innovations of this study by comparison with previous studies. Section 3 proposes this study’s methodology, including the experimental method and the quantification of eye movement indices. The results of a test are presented and discussed in Section 4. Finally, the implications, limitations, and conclusions are presented in Section 5.
2. Literature Review
During construction, driving safety is always a common concern in underground caverns. Correct decision-making behavior during driving plays a crucial role in the safety of drivers. However, safe driving decisions require access to driving information as a prerequisite []. While driving-related visual cues provide critical information for driver decision-making, driving-unrelated visual cues can lead to distraction. This section reviews driver vision-related research and the application of eye-tracking technology in driving.
2.1. Driver Vision-Related Research
There are many types of underground engineering structures, including traffic tunnels (road tunnels, highway tunnels, etc.) and underground caverns (underground powerhouses, civil air defense shelters, mining excavations, etc.). Scholars have conducted much research on the influence of the underground environment on drivers’ vision. However, the vast majority of driver vision research on underground engineering has focused on completed traffic tunnels [,]. According to scholars, the impact of traffic tunnel environments on vision depends primarily on six elements: pavement, lighting, visibility, length, horizontal curvature, and longitudinal slope. Buddhavarapu et al. [] constructed crash injury severity models by integrating crash and pavement surface condition databases and revealed that the pavement condition has an essential effect on driving safety in tunnels. He et al. [] conducted a continuous visual exploration of a tunnel lighting environment through solid-car experiments. They found that the decreasing luminance, lower uniformity, and flickering effect in the tunnel interior zone increased the driver’s visual load. Moreover, Staff et al. [] and Wang et al. [] reported that low-visibility conditions affect the fixation time, directly increasing driving hazards. Fu et al. [] investigated variations in driving behavior and visual perception in three types of tunnels, namely, short, medium-length, and long tunnels, and identified the effect of the tunnel length on drivers’ visual perceptions. Jiao et al. [] conducted a real vehicle test on curved sections with five horizontal curvatures and straight sections of extra-long urban underwater tunnels. The research established quantitative models under different curvature and turning conditions in the extra-long urban underwater tunnels. Wang et al. [] analyzed the impact of the longitudinal slope on the average fixation time by constructing a Lorentz model. In addition, scholars have focused on the study of driver vision in long tunnels. Wang et al. [] conducted an analysis of drivers’ visual characteristics in long tunnels with varying radii. Their findings revealed that as the tunnel radius decreased, the driver’s gaze point became more focused, and the gaze time increased simultaneously. Zhou et al. [] employed pupil diameter, gaze duration, and EEG power spectral density as indicators to investigate the patterns of variation in driver visual load within extra-long road tunnels (>10 km). Wang et al. [] investigated the dynamic characteristics of visual load at the entrance and exit areas of the extra-long tunnel, employing the driver’s pupil rate of change as a measure of driver visual characteristics.
As discussed earlier, the driving environment significantly impacts a driver’s vision in a completed traffic tunnel. Compared with completed traffic tunnels, the driving environment of underground construction caverns is more complex and is simultaneously disturbed by the construction environment. In recent years, scholars have gradually focused on construction site safety management research [,]. Especially in the construction phase of driving safety, Xu et al. [] proposed a construction conflict recognition method (CCFRM) to explore the relationship between drivers’ eye movements and construction conflicts based on pupil diameter and blink rate. Li et al. [] used a Toeplitz inverse covariance-based clustering method to determine the number of levels of mental fatigue of a construction vehicle driver using eye movement data. Although there have been some fundamental studies on driver vision in the construction area, these studies have not considered the driving environment in underground construction.
In underground construction caverns, drivers often need to drive long distances in dark environments while quickly extracting critical information from complex visual cues. Whether the results of previous research are also applicable to driver vision in underground caverns in construction environments remains to be further verified.
2.2. Application of Eye Tracking Technology in Driving
The above studies have emphasized the environmental variables that impact driver vision. In addition, eye movement can intuitively reflect the driver’s visual perception behavior []. The best way to analyze visual behavior is to collect eye movement data in real time through sensing technology. In recent studies, the use of eye-tracking technology has become a familiar and effective method for collecting eye movement data []. Many researchers have used eye-tracking techniques to extract eye movement parameters, such as gaze, saccade, blink, and pupil size, to explore the visual changes of drivers [,,].
Gazing and scanning are excellent methods for gathering visual information and determining drivers’ intentions. The commonly analyzed indicators include the frequency and duration of fixation, saccade amplitude, and fixation point distribution. Goldberg and Kotval [] proposed that the effectiveness of visual search is related to the number of fixations—the more fixations there are, the lower the efficiency of search technology. According to Romoser et al. [], a broader visual scan amplitude along the horizontal axis and shorter fixation time can help drivers detect potential hazards. Taking the drivers’ fixation point analytic coordinates on the vision plane as a clustering variable, Yan et al. [] grouped the fixation points’ positions, divided the areas of interest (AOIs), and then analyzed the distribution law of attention. Park and Reed [] embedded a functional field of view (FFOV) paradigm with concurrent central object recognition and peripheral target localization tasks in a simulated driving environment. The research investigated how concurrent action with spatial monitoring affects the distribution of attention across the visual field. Simultaneously, scholars have also researched visual distraction based on eye-tracking technology. For instance, Zhao et al. [] proposed a novel driver behavior detection system based on fixation points, which realized distracted driving behavior detection using cascading multiple attention-based convolutional neural networks. Soares et al. [] analyzed drivers’ distraction types by reproducing three accidents in a driving simulator and collecting drivers’ eye movement parameters. Liang et al. [] applied Bayesian networks (BNs), a data mining method, to develop a real-time approach for detecting cognitive distraction using drivers’ eye movements and driving performance. Arexis et al. [] and Candida et al. [] explored the impact of distracting cues on attention capture. Bakhit et al. [] implemented a renewal cycle approach to provide deeper insights into how drivers allocate their attention while driving. The analysis revealed that two new measures could characterize distracted driving behavior: the number of renewal cycles per event (NRC) and a distraction level index (DI). The number of renewal cycles per event is a measure that tracks drivers’ eye glance behavior, whereas the distraction index is a measure that quantifies the different levels of distracted driving.
In summary, scholars have used eye-tracking technology to conduct basic vision research on completed traffic tunnels and construction areas. Nevertheless, almost no scholar has considered the dual effects of long-distance driving in underground caverns and complex visual cues caused by the construction stage on drivers’ vision. In addition, few studies have been undertaken on drivers’ visual attention laws in underground caverns in construction environments. Moreover, complex visual cues have rarely been studied in underground construction environments as an important factor influencing selective attention. The application of eye-tracking technology opens the possibility of exploring the influence of the above two factors on the visual attention of drivers.
3. Materials and Methods
Driving simulation is a tool that provides an alternative to on-road testing in a safe, reliable, and efficient manner []. Because of the potential dangers in the construction site, in this paper, environmental video data of the underground cavern of the Jinping Hydropower Station were collected and imported into a driving simulator. Then, we collected eye movement data of participants using eye-tracking technology and simulated driving. Before the beginning of the experiment, participants were asked to observe visual cues during simulated driving. Based on the construction speed limit of the project, the participants were required to simulate driving at a speed of approximately 40 km/h. The different phases and steps of the study are shown in Figure 3. In this section, the experimental method of this study, including the experimental scenarios, instruments, subjects, and procedure, is described. In addition, this section discusses the quantification method of eye movement indices.
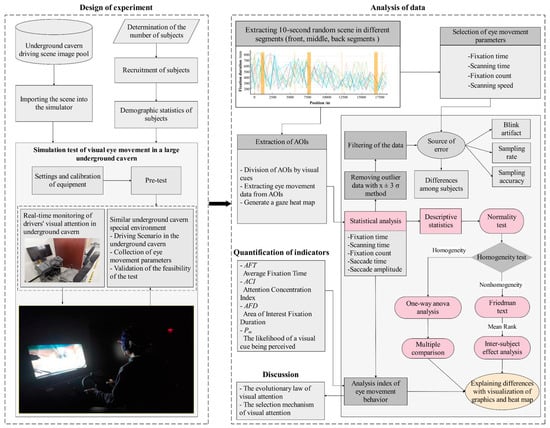
Figure 3.
Phases and steps of the study.
3.1. Experiment
Due to the danger of driving on construction sites, an actual vehicle experiment would have presented a significant driving risk. Therefore, for the test, video data were collected on-site in this study and then imported into a driving simulator. Next, a simulated driving experiment was performed, and participants’ eye movement data were collected using eye-tracking in real-time. After the experiment, a semi-structured open-ended interview was conducted to determine the drivers’ attention deviation for different signs.
3.1.1. Experimental Scenarios
The access tunnel in the underground construction cavern of Jinping Hydropower Station was selected as the research object in this study, as shown in Figure 4. This project is located at a tributary of the Yalongjiang River in Southwest China. The total length is 17.5 km.
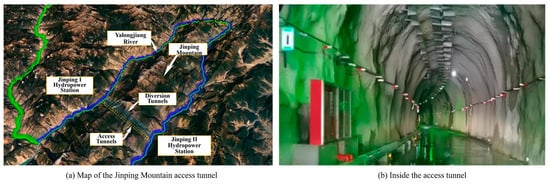
Figure 4.
Alignment of the test section in the Jinping Mountain access tunnel.
According to the Chinese tunnel classification standard, tunnels are classified as short (L ≤ 500 m), medium-length (500 m ≤ L < 3000 m), long (3000 m ≤ L < 10,000 m), and extra-long (L ≥ 10,000 m). To investigate the visual changes during long-distance driving in underground caverns, this study partitions the smooth driving section of the experimental scenarios into three segments: front, middle, and back. From these segments, three scenarios representing medium-length, long, and extra-long tunnels are chosen based on their corresponding driving distances. Specifically, the section was from 1 km after entering the access tunnel to 1 km before exiting the access tunnel. The smooth driving phase was divided into anterior, middle, and posterior segments. From each segment, a 10-s random scene with the same facilities and lighting environment was extracted, as shown in Figure 5. In the same experimental environment, eye movement data were analyzed in these three segments. The change trend of visual perception was explored in the underground cavern.
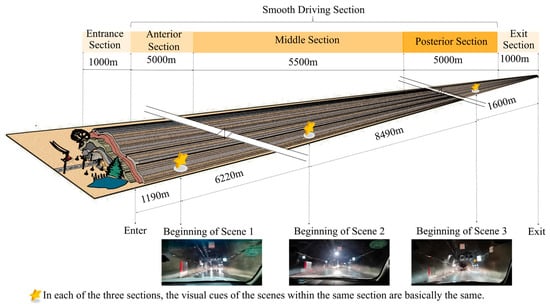
Figure 5.
Schematic diagram of the scene selection location.
3.1.2. Experimental Instruments and Subjects
The experimental instruments included a laptop computer, a driving simulator of construction vehicle model DH-QCD-01, and a Tobii Pro Glasses 2 eye-tracking device, as shown in Figure 6. The driving simulator included a central unit, monitor, steering wheel, throttle, brake, clutch, and shift lever. The accuracies of the eye-tracking device for the visual angle and head displacement were 0.5 degrees and 1 mm, respectively [].
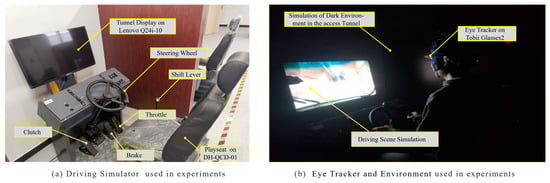
Figure 6.
Experimental setup.
Before the experiment, to estimate the sample size, an a priori sample size estimation analysis was performed using GPower 3.1. One-way ANOVA (F test) was used to analyze the data. We set α = 0.05 (significance) and β = 0.20 (power of 80%). The total sample size computed by this method was 42 (14 in each group). The groups are the three scenarios selected in the experiment. That is, in scenes 1–3, the sample size for each scene is 14. Therefore, in this study, a demographic questionnaire was used to collect information on the participants’ gender, age, driving age, and driving experience in underground caverns. As construction vehicle drivers are experienced in driving in realistic underground caverns. Additionally, during the construction phase, the environmental factors in the underground caverns are constantly changing. For the driver, the driving environment is constantly changing. To control the effect of variables, this paper selected subjects who were all experienced in driving in underground caverns but had not driven this test section. Subjects were required to have a corrected visual acuity of 5.0. Fourteen subjects who met the requirements of the experiment were selected, as shown in Table 1.

Table 1.
Descriptive demographic statistics of participants.
After collecting eye-movement data from the first five subjects, to ensure accuracy and reliability, a one-way analysis of variance (F-test) was performed with the PASS 15 software that reviewed the sample size to reassess the sample size, as shown in Table 2. In Scenes 1–3, the average fixation durations of each participant were 338 (SD = 109) ms, 210 (SD = 32) ms, and 204 (SD = 59) ms, respectively. We also set α = 0.05 (power of 80%). The total sample size was 36. In the later stage of the experiment, the data integrity was checked, and the 2 participants with the most null data were eliminated. Finally, 36 eye movement samples were collected in the underground cavern environment based on 12 subjects at three stages of smooth driving. Eye movement data from the final 12 subjects, with ages ranging from 23 to 36 years (mean = 37.36 years, SD = 12.47 years), were used for analysis. In total, 6 drivers with more than 5 years of driving experience and 6 drivers with less than 5 years of driving experience (mean = 5.92 years, SD = 2.47 years). The participants were evenly split between genders. The types of vehicles that the participants drove for a long time were light trucks (41.7% of the participants), medium trucks (16.7% of the participants), and dump trucks (41.7% of the participants). Participants were required to have a corrected visual acuity of at least 1.0 and have driving experience in underground cavern engineering. Meanwhile, they were unfamiliar with the driving simulation scene. Participants signed a statement indicating their voluntary participation in the experiment and received a small gift as acknowledgment.
Table 2.
Review of sample size using PASS 15 Software.
3.1.3. Experimental Procedure
(1) Pre-experiment. Before the beginning of the experiment, a demographic questionnaire survey was conducted. The subjects’ demographic statistics were collected to screen the subjects who met the test requirements. Before the formal experiment, a preliminary experiment was conducted. Two subjects were randomly selected to wear eye-movement equipment to drive in another similar tunnel environment scenario. The collected eye-movement parameters were analyzed to test the feasibility of the experiment. Meanwhile, the areas of interest for gaze were preidentified as the basis for identifying complex visual cues in the data analysis stage.
(2) Formal experiment. Before beginning the experiment, the investigator demonstrated the correct use of the instruments and explained the experimental procedures. Each participant wore Tobii Pro Glasses 2 and sat on a simulator. A one-point eye calibration was performed to ensure the accuracy of the participant’s point of gaze. Next, the lights in the driving simulation lab were turned off, simulating the dim environment of an underground cavern, and the simulation experiment officially started. The investigator no longer gave instructions or performed actions during the test phase to avoid interference. After the simulated driving test, the recorder stopped and played back the recording to confirm the validity of the driver’s test and save the data.
(3) Post hoc semi-structured interview. To explore the reasons for each driver’s attention deviation from different signs in the experiment, a semi-structured interview was performed after the driver removed the eye-tracking device and took a five-minute break. Then, the core content expressed by the interviewees was extracted and converted using annotation coding.
3.2. Quantification Method of Eye Movement Indices
For each participant, there were differences in the eye movement data (EMD) due to individual factors. This paper considered numerous sensitivity factors affecting the fixation duration to investigate the reasons for these discrepancies, including gender (G), age (A), driving age (Ad), time of response (Tr), experience with driving in an access tunnel (Eat), driving time (Td), sensitivity of construction environment (E), and experience with safety training (Est). These influences were coupled into a function of visual perception (EMD) as follows:
Combined with factors such as the composition of construction vehicle drivers in underground construction caverns, the composition of drivers varies greatly. For example, certain subjects exhibit characteristics such as being female, older A, longer Ad, slower Tr, more Eat, longer Td, higher E, and less Est. Additionally, another proportion of subjects are male, younger A, longer Ad, slower Tr, less Eat, longer Td, higher E, and less Est. Moreover, there exist diverse combinations of these traits. Nonetheless, the presence of various driver types causes each influencing factor to affect different cognitive abilities and counteract one another, ultimately resulting in reduced variability in the experimental results. The differences in each participant’s eye movement data were considered. Therefore, this paper defined eye movement indices of the sample population.
3.2.1. Related Vision Indices
Average fixation time (AFT): In visual tasks, cognitive processing needs to be achieved through gaze behavior. AFT is the average fixation time of participants in different scenarios []. It reflects the degree of difficulty of obtaining information. The function is defined in Equation (2).
where AFTm is the average fixation time of all subjects in the mth scene; E(fmji) and S(fmji) are the end and start times, respectively, of each gaze behavior of the ith subject in the mth scene; l is the index of the gaze behavior of the ith subject in the mth scene; FDm indicates the sum of the fixation durations of the ith subject in the mth scene; and n is the number of subjects.
Attention concentration index (ACI): ACI refers to the ratio of the time spent acquiring information to the duration of visual perception (DVP) in a scene. Because of the differences between null data and blinking data for each driver, it is impossible to accurately quantify the degree of attention concentration based on each subject’s total eye movement time. ACI only considers durations associated with visual perception, including gaze and saccade durations. DVP is the duration that produces visual perception in a scene. It includes the total fixation time (TFT) and total saccade time (TST). Among them, TFT responds to the time spent by the driver searching and processing visual information throughout the scene []. Although drivers use saccade behavior to sense visual cues, it is not used to deeply process visual information in the brain []. The ACI value is calculated as TFT divided by DVP. The larger the value of ACI, the more time the driver spends searching, processing, and understanding visual information. In contrast, the lower the value of ACI, the less time the driver spends searching, processing, and understanding visual information. The function is defined in Equation (3).
where TSTmi is the total saccade time of the ith subject in the mth scene, TFTmi is the total fixation time of the ith subject in the mth scene, and DVPmi is the duration of visual perception of the ith subject through visual behavior in the mth scene, which is the sum of the durations of the gaze and saccade behavior.
Area of interest fixation duration (AFD): AFD represents the mean driver fixation duration on a single AOI []. It determines the distribution of drivers’ attention on a single visual cue. The function is defined in Equation (4).
where AFDmji is the total duration of all gaze behavior of the ith subject on the jth AOI in the mth scene; E(fmi) and S(fmi) represent the end time and start time, respectively, of the single gaze behavior of the ith subject on the jth AOI in the mth scene; and k is the number of the gaze behavior of the ith subject on the jth AOI in the mth scene.
3.2.2. Possibility of Visual Cues Being Perceived
Visual cues need to attract the observer’s attention to be seen. Not surprisingly, objects or areas that attract more attention are more likely to be observed. However, not all visual cues in our visual field receive attention []. The ability to capture vision is key to perceiving visual cues []. P represents the ability of a single visual cue to attract attention. The possibility function for perceiving the jth visual cue (jth AOI) in the mth scene is denoted Pmj. For the ith subject, the ratio of the AFD of the jth AOI to the DVP in the mth scene is defined as Pmji. The higher the value of the possibility, the more likely this visual cue is to be perceived. The function is defined in Equation (5).
where Pmj is the possibility index of the jth AOI being perceived by drivers in the mth scene, DVPmi is the sum of the durations of the fixation and saccade behavior of the ith subject in the mth scene.
3.3. Data Collection and Preprocessing
The experiment was conducted with a simulated driver, and eye movement data were collected simultaneously with a wearable eye-tracking device, Tobii Pro Glass 2. The eye movement data were then exported and initially processed using ErgoLAB 3.0, a human factor engineering analysis software.
A double-threshold eye movement detection method was employed to mark rapid eye movement (REM) events: the onset of a REM was defined as the moment that gaze velocity exceeded a 50°/s threshold value; multiple eye movements within 0.05 s were merged into one movement and the minimum duration of an eye movement was set at 0.1 s [].
4. Results and Discussions
4.1. Evolutionary Characteristics of Driver Vision
4.1.1. Data Processing and Analysis
Before the experimental data analysis, the experimental data were screened to exclude missing and significantly biased data. Anomaly detection was conducted according to the three-sigma principle (3σ), as expressed in Equation (6), and the abnormal records were removed.
After removing outliers, eye movement data were further processed with eye movement analysis software. These data included eye state type, fixation count, fixation time, saccade time, and eye movement coordinate. The fixation time was explored with descriptive statistics and the Shapiro–Wilk normality test, as shown in Table 3. In Scenes 1–3, the AFT values were 343.26 ms, 260.17 ms, and 217.67 ms, respectively. The p values of the Shapiro–Wilk test possibility were all >0.05. The results conformed to a normal distribution.
Table 3.
Statistics and normality test results for the fixation time in different scenes.
On this basis, AFT was analyzed in different scenes using a homogeneity test and one-way ANOVA. Meanwhile, a post hoc multiple comparison test of the different scenes was conducted, and the results are shown in Table 4. Based on AFT, the homogeneity test showed that LS (2,33) = 0.82 and p = 0.45 (>0.05). The results revealed that the variances of AFT were homogeneous. One-way ANOVA showed that F (2,33) = 6.18 and p = 0.01 (<0.05). The results indicated differences in AFT among the study groups. Meanwhile, AFT was computed for Scene 1–Scene 2 (p = 0.03 < 0.05), Scene 2–Scene 3 (p = 0.25 > 0.05), and Scene 1–Scene 3 (p = 0.00 < 0.01). The results showed a clear significant difference between Scene 1 and Scene 3. There was also a significant difference between Scene 1 and Scene 2. The distribution of AFT in Scenes 1–3 was shown in Figure 7. The results showed that the driver’s AFT gradually decreased as the driving time increased. These significant differences suggest that the driver’s average fixation time has distinct evolutionary characteristics over time.
Table 4.
Homogeneity test, one-way ANOVA, and post hoc multiple comparison test of AFT for the three scenes.
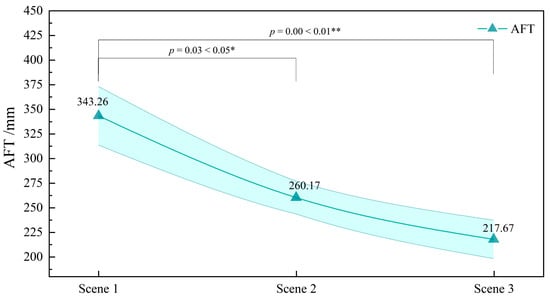
Figure 7.
Distribution of AFT of drivers in Scenes 1–3. * The mean difference is significant at the 0.05 level. ** The mean difference is significant at the 0.01 level.
4.1.2. Behavior of Single Fixation
Gaze behavior is defined as maintaining a stable gaze position for at least 80 ms []. Fixation duration is the duration of a subject’s single gaze behavior. Gaze behavior is typically analyzed using the fixation duration. In this paper, the distribution of the fixation duration during simulated driving was determined to analyze each driver’s gaze behavior, as shown in Figure 8. Overall, for most of the drivers, the fixation duration in the underground cavern differed over time.
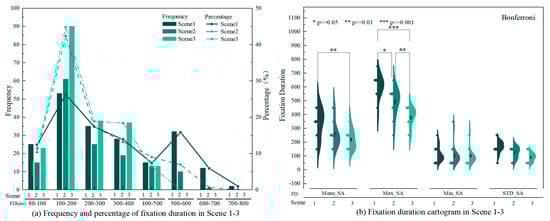
Figure 8.
Distribution of fixation duration in Scenes 1–3.
The variabilities in the frequency and percentage of fixation duration in Scenes 1–3 are shown in Figure 8a. The fixation duration was primarily concentrated in the range of 100–200 ms. As the driving process continued, the proportion in the range of 100–200 ms gradually increased, reaching 44.8% in Scene 3. In Scenes 1–3, within two periods of fixation duration, 80–100 ms, and 200–400 ms, the distribution ratio of drivers’ fixation durations showed a general trend of first decreasing and then increasing. In contrast, there was a different trend when the drivers’ time spent on single gaze behavior was longer than 400 ms. As the driving process continued, the proportion of single gaze behavior longer than 400 ms decreased significantly and became nearly zero in the latter part of the access tunnel. In the anterior segment of the access tunnel, gaze behavior of long duration, with a fixation time exceeding 400 ms, constituted as high as 30.2% of all fixation behaviors. In other words, nearly a quarter of drivers’ gaze behaviors required prolonged fixation, which made it take longer for the drivers to obtain single pieces of information from the environment. In the middle of the access tunnel, single gaze behavior of long duration constituted approximately 16.7% of the total fixation behavior. That is, the driver had less time to capture a single piece of information from the environment. In the posterior segments of the access tunnel, the cumulative percentage of gaze behavior of long duration was 6.5% of all fixation behavior. In particular, gaze behavior lasting more than 500 ms almost did not occur in the posterior segments. That is, the single gaze behavior of long duration dropped sharply, and the single gaze behavior of short duration continued to increase, which made the time for drivers to obtain a single piece of information from the environment increasingly short. As discussed earlier, the longer the driving time in the underground cavern was, the less time the driver spent on single gaze behavior. The results show that it became easier for the drivers to receive single pieces of visual information from the environment of the underground cavern over time.
The AFT of drivers was calculated according to Equation (2). The variation in the fixation duration of drivers’ single gaze behavior is shown in Figure 8b. In Scenes 1–3, the AFTs were 343.266 ms, 260.17 ms, and 217.67 ms, respectively. Meanwhile, the maximum single fixation duration values were 260–800 ms, 150–750 ms, and 150–550 ms, respectively. The maximum duration of single gaze behavior showed a gradual downward trend. According to the results, from the drivers’ gaze point of view, it became easier for the drivers to obtain environmental information in the access tunnel of the underground cavern over time.
4.1.3. Concentration of Visual Attention
The distributions of the total fixation time and total saccade time in Scenes 1–3 are shown in Figure 9. The average total fixation time first decreased and then increased. The average total saccade time remained roughly the same. The saccade behavior characterized the drivers’ unconscious visual search. The drivers did not deeply process the visual information during the saccade phase. The saccade amplitude could reflect the range of the fields of view of drivers’ unconscious searches.
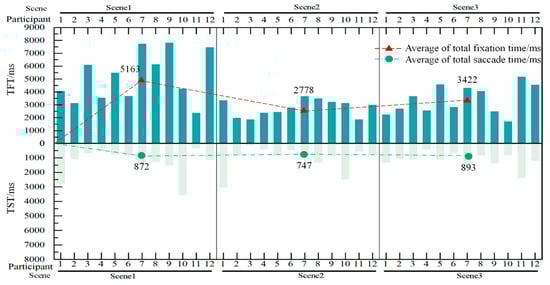
Figure 9.
Distributions of the total fixation time and total saccade time in Scenes 1–3.
Figure 10 shows the saccade amplitudes in different scenes. In Scenes 1–3, the saccade amplitudes were 2.6°, 3.5°, and 5.1°, respectively. The saccade amplitude gradually increased over time. The purview of unconscious visual perception increased. However, a previous study of a completed traffic tunnel showed different results, with the total fixation time increasing and total scanning time increasing []. This indicates that the established laws of drivers’ fixation time and saccade time in the completed tunnel are unsuitable for studying drivers’ vision in underground caverns under construction.
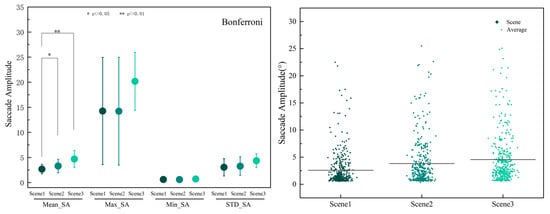
Figure 10.
Saccade amplitude cartogram and plots for different scenes.
Because of the differences between the null data and blinking data collected for each driver, it was impossible to individually quantify the degree of attention concentration by directly using each subject’s fixation time or saccade time. Therefore, the total fixation time and the total saccade time of each driver should be considered together in studies on the concentration of visual attention. According to Equation (3), ACI equals the total fixation time divided by the sum of the durations of the gaze and saccade behavior. The effects of different scenes on ACI are shown in Table 5. The ACI values for Scenes 1–3 were 0.86, 0.81, and 0.79, respectively. ANOVA was performed on ACI for Scenes 1–3 (F = 4.10, p = 0.05). Meanwhile, multiple comparisons were performed on ACI for Scenes 1–3. The results showed a significant difference in the degree of attention concentration in Scenes 1–3 (p = 0.05), and the ACI gradually decreased over time. The concentration of visual attention was closely related to the driver’s ability to process environmental information. From a combined gaze and saccade perspective, over time, drivers spent less time searching, processing, and understanding information. The results showed that drivers had short-term memory for visual information acquired at the early driving stage. Alternatively, the drivers’ visual sensitivity was reduced. From a psychological point of view, as the driving time increased, the visual system converted information that had already appeared into short-term memory. Effective visual fixation was turned into an unconscious visual saccade, and the sensitivity of vision to the environment was reduced; namely, a phenomenon of “visual adaptation” occurred []. However, this inertial thinking reduced the drivers’ sensitivity to hazard recognition.
Table 5.
Effects of different scenes on ACI.
4.2. Selection Mechanism of Drivers’ Visual Attention in the Underground Cavern
4.2.1. Visualization of Attentional Selection
The experiment generated a large amount of abstract, numerical-based eye movement data. However, these data are difficult to understand intuitively. A gaze heatmap was used to convert the gaze data into images displayed on a screen, which intuitively expressed the distribution characteristics of gaze points. To intuitively observe gaze heatmaps, the environmental information of every scene was processed into a static composite graph as a mapping graph, as shown in Figure 11a. On the three mapping graphs, the eye movement fixation points of Scenes 1–3 were superimposed and calculated. Then, a fixation point heatmap was generated, as shown in Figure 11(b-1)–(b-3).
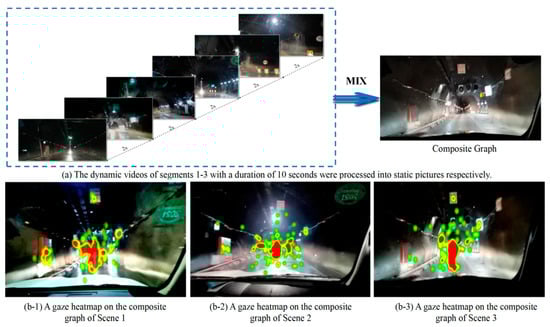
Figure 11.
Synthesis of mapping graphs and gaze heatmaps.
As shown in Figure 11(b-1), the driver’s gaze points were mainly distributed in front of the field of view. Meanwhile, visual cues in some locations, such as standing water on the ground, the sign above the cave roof, and visual cues on the left and right sides, also attracted attention. As shown in Figure 11(b-2), the driver’s fixation on the visual cues on the left and right sides decreased gradually. The fixation on the road surface decreased, but the fixation on the cave roof increased. As shown in Figure 11(b-3), the fixation on the visual cues on both sides decreased, the fixation on the road surface increased, and the fixation on the top of the cavern remained approximately the same. In summary, in the early stage of driving, each driver’s attention was easily distracted. In the middle and posterior driving stages, some visual cues on the left and right sides did not attract the driver’s attention. Simultaneously, some visual cues on the road and the top of the cavern were always a concern for drivers. As discussed in Section 4.1.3, from a psychological point of view, the visual system converted part of the presented visual information into short-term memory over time. With the increase in driving time, some of the abovementioned visual cues were stored in the short-term memory of the drivers and no longer attracted their attention. Visual attention was increasingly concentrated on specific regions and visual cues.
4.2.2. Quantification of Attentional Selection
To further explain the visual attractiveness of different visual cues to the drivers, this study attempted to quantify the selectivity of attention. Previous research paradigms have mainly focused on the mechanical division of AOIs based on the plane coordinate position of a driver’s vision [,]. Few of these studies have used visual cues as a condition for dividing AOIs, and the effects of different visual cues on the driver’s attention have not been adequately considered. This study extracted three scenes with the same visual cues from the anterior, middle, and posterior segments in the access tunnel of the underground construction cavern. The visual cues were used as the basis for dividing AOIs, as shown in Figure 12.
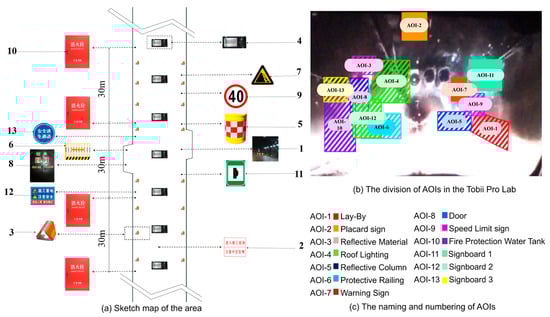
Figure 12.
Division of AOIs in this study.
The gaze behaviors of the drivers on AOIs and non-AOIs were compared. The distributions of the items fixated on, fixation duration, and number of fixations during the simulated driving experiment are shown in Table 6. In the beginning, the drivers gave attention to environmental information, along with the space in front of the road and the road surface conditions. Over time, the number of noticed AOIs, the average fixation duration, and the counts of AOIs decreased. Meanwhile, the average fixation duration and the number of fixations of non-AOIs first decreased and then increased. The results show that the drivers gradually adapted to the environment as the driving time increased. The drivers became insensitive to some visual cues but became cautious about the road conditions. The drivers refocused on the space ahead and the road surface conditions.
Table 6.
Overview of the fixation duration and the number of fixations for all gaze behaviors.
To determine the distribution of the drivers’ attention on a single visual cue, Equation (4) was introduced to calculate the AFD of each AOI for each scene. Next, an exploratory analysis was carried out, and it was concluded that the AFD was not normally distributed, and that the homogeneity was not uniform. Then, a significance test of the AFDs of various AOIs in each segment was conducted. Since the sample did not satisfy the homogeneity of variance condition, the Friedman test was used to analyze the significance of the data to explore the differences of each indicator under different states. The results of the significance test of differences in AFD are shown in Table 7. An inspection of the data revealed the following: AOI-1 (χ2 = 14.30, p = 0.00), AOI-2 (χ2 = 16.84, p = 0.0), AOI-4 (χ2 = 112.57, p = 0.00), AOI-5 (χ2 = 17.35, p = 0.03), AOI-7 (χ2 = 111.62, p = 0.00), AOI-9 (χ2 = 15.36, p = 0.00), AOI-10 (χ2 = 22.80, p = 0.00), AOI-11 (χ2 = 19.70, p = 0.00), AOI-12 (χ2 = 13.50, p = 0.0), and AOI-13 (χ2 = 10.51, p = 0.00). The above p-values are all less than 0.05. The results showed that differences in the AFD values of the identified AOIs in different scenes were statistically significant. In addition, an inspection of the data revealed the following: AOI-3 (χ2 = 4.73, p = 0.09), AOI-6 (χ2 = 1.40, p = 0.50), and AOI-8 (χ2 = 2.00, p = 0.37). The above p-values are all greater than 0.05. The results showed no statistically significant differences in AFD among these AOIs in different scenes. That is, the drivers’ average fixation durations on these three visual cues, namely, AOI-3, AOI-6, and AOI-8, did not fluctuate much during driving.
Table 7.
Significance test of differences in AFD.
To visually display the change in the AFD of each AOI under different segments, a distribution plot of the average fixation duration was drawn, as shown in Figure 13. Combined with both Table 7 and Figure 13, the results show that all subjects spent almost no time fixating on AOI−3 and AOI−8. Hence, these two types of visual cues did not attract the drivers’ attention from beginning to end. Meanwhile, among eight types of visual cues, namely, AOI−1, AOI−6, AOI−7, AOI−9, AOI−10, AOI−11, AOI−12, and AOI−13, the mean value of AFD decreased gradually over time. A comparison of the results for the three scenes revealed that the drivers gave more attention to the above visual cues in the early stage. Although the drivers were still paying attention to these visual cues as time passed, they were less concerned than at the beginning. Moreover, the mean AFD values of two visual cues, AOI−4 and AOI−5, first increased and then decreased. According to the data, highlight materials of visual cues attracted the drivers’ attention during driving. In addition, the mean AFD value of AOI−2, first decreased and then increased. The results showed that the distribution of attention was greater on the signs in the anterior and posterior segments of the access tunnel.
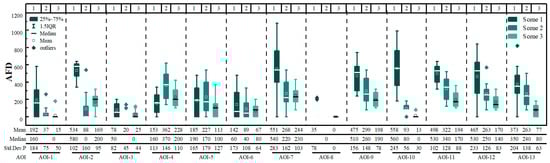
Figure 13.
Distribution of the average fixation duration (AFD) in different scenes.
To further explore the drivers’ selective attention at different driving stages, the visual differences of each subject needed to be considered. Therefore, Equation (5) was introduced to quantify Pmj, the possibility of visual cues being perceived. The possibility of the jth AOI being perceived in the mth scene was calculated. A higher value corresponded to a higher likelihood that this visual cue would be perceived in the scene. The probabilities of AOIs being perceived (i.e., Pmj) at each stage are shown in Table 8: The probabilities of different visual cues being perceived differed among scenes.
Table 8.
Statistics on the possibility of visual cues being perceived (Pmj) in different scenes.
A test of between-subject effects was undertaken to explore the potential relationship of the influence of Pmj between scenes and visual cues, as shown in Table 9. Based on Scene, F (2429) = 26.47 and H = 59.53. Based on AOI, F (12,429) = 21.22 and H = 163.60. Based on Scene * AOI, F (24,429) = 5.28 and H = 62.14. For these three results, the p-values were all <0.05. The results revealed that Scene and AOI had different effects on the value of Pmj. Meanwhile, there was also a significant interaction between Scene and AOI on Pmj. This showed that there were also obvious differences in the possibility of the drivers perceiving visual cues in different scenes.
Table 9.
Tests of Between-Subject Effects a.
Pairwise comparisons of Pmj were conducted to identify specific differences, as shown in Table 10. Four visual cues, namely, AOI−1, AOI−3, AOI−6, and AOI−8, had p values of >0.05. The results showed that there were no significant differences in the possibilities of the four visual cues being perceived during driving. By comparing Scene 1 and Scene 2, it was found that the possibilities of four visual cues being perceived, namely, AOI−2, AOI−4, AOI−5, and AOI−10 (p values of ≤0.05), differed significantly in the anterior and middle segments. By comparing Scene 1 and Scene 3, differences were identified in the possibilities of eight visual cues being perceived in the anterior and posterior segments, namely, AOI−2, AOI−4, AOI−7, AOI−9, AOI−10, AOI−11, AOI−12, and AOI−13 (p values of ≤0.05). By comparing Scene 2 and Scene 3, the possibilities of six visual cues being perceived, namely, AOI−4, AOI−5, AOI−9, AOI−11, AOI−12, and AOI−13 (p values of ≤0.05), were found to be all significantly different in the middle and posterior segments. The results showed that different visual cues showed different visual selection trends during driving. In general, the difference in selective attention was especially reflected between the anterior and posterior sections.
Table 10.
Pairwise comparisons of Pmj for different AOIs in different scenes.
The index data of visual cues being perceived were imported for fitting to obtain intuitive insight into the evolution laws of the drivers’ selective attention during driving. First, a matrix based on the average of Pmji was generated. Next, Pmj was used to construct a smooth surface matrix. Finally, the fitting surface of the possibility index of perceived visual cues was obtained. The 3D surface plot of Pmj based on Scene and AOI is shown in Figure 14.
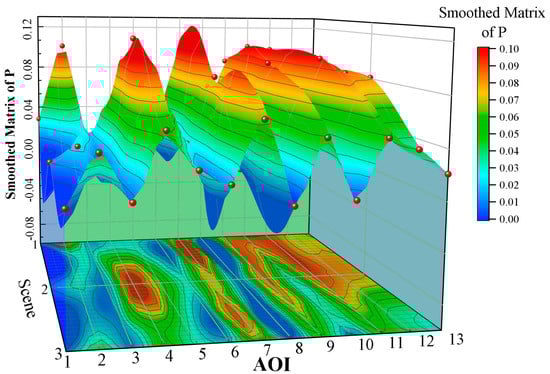
Figure 14.
Three-dimensional surface plot of Pmj based on Scene and AOI.
As shown in the above figure, AOI−1, AOI−3, AOI−6, and AOI−8 were ignored throughout the driving phase. AOI−7, AOI−9, AOI−11, AOI−12, and AOI−13 attracted a high degree of attention throughout the driving phase. The possibilities of AOI−2 and AOI−10 being perceived were high in the anterior section of the access tunnel and then gradually decreased. With increasing driving duration, the possibility of perceiving AOI−4 increased until peaking in the middle section and then slightly decreased. AOI−7 showed the opposite trend. It peaked in the anterior and posterior sections. AOI−2 and AOI−10 were more likely to be perceived in the early stages of driving; then, the likelihood gradually decreased. Over time, the possibility of perceiving AOI−4 increased gradually, peaked in the middle segment of the access tunnel, and then decreased slightly. AOI−7 showed the exact opposite trend. The possibility peaked in both the front and posterior segments of the access tunnel. From the graph, the signs that convey safety information always attracted the drivers’ attention throughout the driving process. In addition, in the early stages of driving, attention was mainly focused on colorful visual stimuli and text signs. This phenomenon occurred because colorful stimuli and driving information related to safety are critical factors in competing for visual resources in the beginning stage of driving. To ensure driving safety, drivers actively allocated visual resources to give attention to signs; because of strong color stimuli, drivers passively distracted attention from colorful cues. In the middle and posterior sections of the access tunnel, attention to color cues was significantly reduced, but the intense lights still attracted the driver’s attention. Because the drivers adapted gradually to the strongly colored stimulation, the sensitivity was reduced in the middle and posterior stages of driving. However, it is difficult for humans to adapt to physiological stimuli formed by intense lights. When colorful visual cues no longer attracted visual resources, intense light visual cues began to snatch visual resources.
Semi-structured open-ended interviews of subjects were performed to determine the reasons for the deviation of drivers’ attention to different signs, as shown in Table 11. The factors affecting attention distribution mentioned by the subjects in the semi-structured interview were classified, and three types of choice coding results were obtained, including 24 principal axis coding results. Among them, driving fatigue, concentration, colors and category of the sign, visual interference cues, and intense light appeared at high frequencies. As shown in Table 11, among the basic properties of signs, the sign category (P5) had the key effect on attention. The drivers paid great attention to warning signs. Regarding the driving environment, the impact of strong light was an essential factor. The placard sign AOI−2 was located next to an intense light (lighting on the top of the cavern), as shown in Figure 12, this is why AOI−2 was not visible.
Table 11.
Influencing factors of visual capture on signs based on semi-structured interviews.
5. Conclusions
Research on drivers’ visual attention in the construction stage is of great significance for ensuring construction safety in underground construction caverns. However, various research gaps remain. In particular, the scientific extraction of the changing trend of visual attention under the dual influence of the underground construction environment and complex visual cues is the basis for current research on the design of safety signs based on ergonomics. The main contributions of this paper are as follows: (1) an experimental scenario based on the driving environment in an underground construction site was established to collect drivers’ eye movement data using eye-tracking and simulated driving; (2) an analysis method of the evolution law of attention was proposed to explore the changing trend of drivers’ vision; and (3) the possibilities of different visual cues being perceived at different driving stages were calculated to identify the selection mechanism of visual attention in complex environments. The following significant results were obtained:
(1) During driving, the duration of saccades remains relatively consistent, while the amplitude of saccades increases. Moreover, as driving time extends, the duration of fixations decreases, accompanied by a reduction in the number of gaze points. Based on the findings of this study, research on drivers’ visual attention in completed road tunnels may not be directly applicable to underground construction caverns with distinct driving environments. Therefore, exploring the visual characteristics of drivers in underground construction caverns becomes essential for enhancing driving safety within such environments.
(2) Over time, drivers allocate less time to search, process, and comprehend visual information, leading to broader unconscious saccades. From a psychological standpoint, there is a reduction in vision’s sensitivity to environmental information, referred to as “visual adaptation.” This phenomenon can diminish drivers’ sensitivity to hazard recognition. Thus, in order to counteract this inertial thinking, incorporating changes in visual cues becomes crucial to enhance visual sensitivity in long and extra-long access tunnels of underground construction caverns.
(3) In medium-length distance driving situations, drivers predominantly focus their attention on safety-related and colorful visual cues. However, as the distance of travel increases, a portion of their visual attention transforms into unconscious saccades. Drivers relying solely on unconscious scanning behavior may overlook critical cues. Therefore, the key to addressing the safety concerns associated with long-distance driving in underground construction caverns lies in enhancing drivers’ active attention towards vital information.
(4) Colorful stimuli and safety-related information play vital roles in competing for drivers’ visual resources during medium-length distance driving. However, as the driving distance increases, attention towards colorful cues diminishes. Hence, it is necessary to consider reducing the prominence of non-critical visual cues in the front of underground construction caverns.
(5) Safety-related signs consistently attract drivers’ attention; however, the level of attention may vary depending on the specific signs. Among various signs, warning signs receive greater attention from drivers. Additionally, drivers may visually overlook signs located in areas with intense lighting. In this driving environment, intense light emerges as a critical factor influencing attention. Therefore, it is advisable to avoid placing signs in areas prone to intense lighting conditions.
Overall, the findings of this paper may provide references for sustainable transportation safety research in other underground construction projects. Additionally, the outcomes of this research can assist in mitigating and preventing transport safety accidents caused by drivers’ visual attention preferences in the unique driving conditions of underground construction sites. However, the data reliability was not high due to the simulation driving experiment. Moreover, this test did not cover all types of facility environments in the tunnel or consider the impacts of different visual cues on the drivers’ selective attention. We hope that subsequent research will be carried out on this basis.
Author Contributions
Conceptualization, Q.Z., X.Z., Y.C. and M.Z.; validation, Y.C. and Q.Z.; resources, Y.C.; data curation, Q.Z. and Y.C.; software, Q.Z.; supervision, Y.C. and Q.H.; visualization, Q.Z.; writing—original draft preparation, Q.Z.; writing—review and editing, X.Z., Q.Z. and D.L.; funding acquisition, X.Z. and Y.C. All authors have read and agreed to the published version of the manuscript.
Funding
This work was supported by the [National Natural Science Foundation of China #1] under Grant [No. 52209163, 51878385]; [Open Foundation of the State Key Laboratory of Hydraulic Engineering Simulation and Safety #2] under Grant [No. HESS-2224]; and [Natural Science Research Project of Yichang City #3] under Grant [No. A21-3-001]. The conclusions herein are those of the authors and do not necessarily reflect the views of the sponsoring agencies.
Institutional Review Board Statement
Ethical approval was waived as the experiment would not cause any mental injury to the participants, have any negative social impact, or affect the participants’ subsequent behaviors. Although our research institutions do not have an appropriate ethics review committee, several experts assessed the research plan to be sound and feasible.
Informed Consent Statement
Informed consent was obtained from all subjects involved in the study.
Data Availability Statement
Data that support the findings of this study are available from the corresponding author upon reasonable request.
Conflicts of Interest
The authors declare that they have no conflict of interest or personal relationships that could have appeared to influence the work reported in this paper.
References
- Xie, Z.W.; Huang, C.; Zhao, Z.T.; Xiao, Y.M.; Zhao, Q.; Lin, J.Q. Review and prospect the development of dust suppression technology and influencing factors for blasting construction. Tunn. Undergr. Space Technol. 2022, 125, 104532. [Google Scholar] [CrossRef]
- Jia, J.S. A Technical Review of Hydro-Project Development in China. Engineering 2016, 2, 302–312. [Google Scholar] [CrossRef]
- Jiang, T.Y.; Jing, Z.H.; Wang, J.H. Sensitivity Analysis of Transport Machinery Configuration in Underground Cavern Group Construction. Intell. Autom. Soft Comput. 2014, 20, 525–534. [Google Scholar] [CrossRef]
- Aneziris, O.N.; Papazoglou, I.A.; Kallianiotis, D. Occupational risk of tunneling construction. Saf. Sci. 2010, 48, 964–972. [Google Scholar] [CrossRef]
- Ahlstrom, C.; Anund, A.; Fors, C.; Akerstedt, T. The effect of daylight versus darkness on driver sleepiness: A driving simulator study. J. Sleep Res. 2018, 27, e12642. [Google Scholar] [CrossRef]
- Zhang, W.; Wang, C.; Shen, Y.; Liu, J.; Feng, Z.; Wang, K.; Chen, Q. Drivers’ car-following behaviours in low-illumination conditions. Ergonomics 2021, 64, 199–211. [Google Scholar] [CrossRef] [PubMed]
- Viano, D.C.; Culver, C.C.; Evans, L.; Frick, M.; Scott, R. Involvement of older drivers in multivehicle side-impact crashes. Accid. Anal. Prev. 1990, 22, 177–188. [Google Scholar] [CrossRef]
- Gotardi, G.C.; Barbieri, F.A.; Simao, R.O.; Pereira, V.A.; Baptista, A.M.; Imaizumi, L.F.; Moretto, G.; Navarro, M.; Polastri, P.F.; Rodrigues, S.T. Parkinson’s disease affects gaze behaviour and performance of drivers. Ergonomics 2022, 65, 1302–1311. [Google Scholar] [CrossRef] [PubMed]
- Amundsen, F.H. Studies of driver behaviour in Norwegian road tunnels. Tunn. Undergr. Space Technol. 1994, 9, 9–15. [Google Scholar] [CrossRef]
- Ogunseiju, O.R.; Gonsalves, N.; Akanmu, A.A.; Bairaktarova, D.; Bowman, D.A.; Jazizadeh, F. Mixed reality environment for learning sensing technology applications in Construction: A usability study. Adv. Eng. Inform. 2022, 53, 101637. [Google Scholar] [CrossRef]
- Brilakis, I.; Park, M.W.; Jog, G. Automated vision tracking of project related entities. Adv. Eng. Inform. 2011, 25, 713–724. [Google Scholar] [CrossRef]
- Babic, D.; Dijanic, H.; Jakob, L.; Babic, D.; Garcia-Garzon, E. Driver eye movements in relation to unfamiliar traffic signs: An eye tracking study. Appl. Ergon. 2020, 89, 103191. [Google Scholar] [CrossRef]
- Gotardi, G.C.; Polastri, P.F.; Schor, P.; Oudejans, R.R.D.; van der Kamp, J.; Savelsbergh, G.J.P.; Navarro, M.; Rodrigues, S.T. Adverse effects of anxiety on attentional control differ as a function of experience: A simulated driving study. Appl. Ergon. 2019, 74, 41–47. [Google Scholar] [CrossRef] [PubMed]
- He, S.Y.; Liang, B.; Tahkamo, L.; Maksimainen, M.; Halonen, L. The influences of tunnel lighting environment on drivers’ peripheral visual performance during transient adaptation. Displays 2020, 64, 101964. [Google Scholar] [CrossRef]
- Ma, Z.; Fang, S.; Liu, S.; Cai, B. Analysis of the Relationship between the Number of Traffic Accidents and the Traffic Flow & Section Location in Extra Long Tunnel. Engineering 2020, 12, 71–81. [Google Scholar] [CrossRef]
- Qin, P.C.; Wang, M.N.; Chen, Z.W.; Yan, G.F.; Yan, T.; Han, C.L.; Bao, Y.F.; Wang, X. Characteristics of driver fatigue and fatigue-relieving effect of special light belt in extra-long highway tunnel: A real-road driving study. Tunn. Undergr. Space Technol. 2021, 114, 103990. [Google Scholar] [CrossRef]
- Larue, G.S.; Rakotonirainy, A.; Pettitt, A.N. Driving performance impairments due to hypovigilance on monotonous roads. Accid. Anal. Prev. 2011, 43, 2037–2046. [Google Scholar] [CrossRef]
- Sivak, M. The information that drivers use: Is it indeed 90% visual? Perception 1996, 25, 1081–1089. [Google Scholar] [CrossRef]
- Eigentler, K. Experiences with LED-based visual guidance systems in tunnels. Tunn. Undergr. Space Technol. 2006, 21, 325. [Google Scholar] [CrossRef]
- Zhigang, D.; Zheng, Z.; Zheng, M.; Ran, B.; Zhao, X. Drivers’ visual comfort at highway tunnel portals: A quantitative analysis based on visual oscillation. Transp. Res. Part D Transp. Environ. 2014, 31, 37–47. [Google Scholar] [CrossRef]
- Buddhavarapu, P.; Banerjee, A.; Prozzi, J.A. Influence of pavement condition on horizontal curve safety. Accid. Anal. Prev. 2013, 52, 9–18. [Google Scholar] [CrossRef]
- He, S.Y.; Liang, B.; Pan, G.B.; Wang, F.; Cui, L.L. Influence of dynamic highway tunnel lighting environment on driving safety based on eye movement parameters of the driver. Tunn. Undergr. Space Technol. 2017, 67, 52–60. [Google Scholar] [CrossRef]
- Staff, A. Safety Zone-Night Work: Reduced Visibility Increases Hazards. Opflow 2018, 44, 28. [Google Scholar] [CrossRef]
- Wang, K.; Zhang, W.; Feng, Z.; Sze, N.N.; Hu, Z.; Wang, C. Maximum acceptable speed based on physiological performance for different alignments of rural roads under the influence of visibility in fog-a driving simulator study. Traffic Inj. Prev. 2020, 21, 145–150. [Google Scholar] [CrossRef]
- Fu, X.S.; He, S.J.; Du, J.T.; Wang, X.F.; Ge, T. Variations in Naturalistic Driving Behavior and Visual Perception at the Entrances of Short, Medium, and Long Tunnels. J. Adv. Transp. 2020, 2020, 7630681. [Google Scholar] [CrossRef]
- Jiao, F.T.; Du, Z.G.; Wang, S.S.; Yang, L.B.; Ni, Y.D. Research on drivers’ visual characteristics in different curvatures and turning conditions of the extra-long urban underwater tunnels. Tunn. Undergr. Space Technol. 2020, 99, 103360. [Google Scholar] [CrossRef]
- Wang, S.S.; Du, Z.G.; Jiao, F.T.; Yang, L.B.; Ni, Y.D. Impact of Urban Undersea Tunnel Longitudinal Slope on the Visual Characteristics of Drivers. J. Adv. Transp. 2020, 2020, 2576769. [Google Scholar] [CrossRef]
- Wang, S.; Du, Z.; Chen, G.; Zheng, H.; Tang, Z.; Jiao, F. Drivers’ visual characteristics in small-radius optically long tunnels on rural roads. Tunn. Undergr. Space Technol. 2021, 113, 103969. [Google Scholar] [CrossRef]
- Zhou, Y.; He, S.; Li, X.; Li, Y.; Du, G.; Hailu, Y. Study on Drivers’ Visual Load Features in Lighting Environments of Interior Zones of Extra-Long Tunnels over 10 km. Adv. Civ. Eng. 2022, 2022, 4840334. [Google Scholar] [CrossRef]
- Wang, S.; Du, Z.; Jiao, F.; Zheng, H.; Ni, Y. Drivers’ visual load at different time periods in entrance and exit zones of extra-long tunnel. Traffic Inj. Prev. 2020, 21, 539–544. [Google Scholar] [CrossRef]
- Han, Y.; Yin, Z.Z.; Zhang, J.J.; Jin, R.Y.; Yang, T. Eye-Tracking Experimental Study Investigating the Influence Factors of Construction Safety Hazard Recognition. J. Constr. Eng. Manag. 2020, 146, 4020091. [Google Scholar] [CrossRef]
- Ahn, C.R.; Lee, S.; Sun, C.F.; Jebelli, H.; Yang, K.; Choi, B. Wearable Sensing Technology Applications in Construction Safety and Health. J. Constr. Eng. Manag. 2019, 145, 03119007. [Google Scholar] [CrossRef]
- Xu, Y.; Li, S.; Gao, S.; Tan, D.; Guo, D.; Wang, Y. Recognition method of construction conflict based on driver’s eye movement. Accid. Anal. Prev. 2018, 113, 193–201. [Google Scholar] [CrossRef] [PubMed]
- Li, J.; Li, H.; Umer, W.; Wang, H.W.; Xing, X.J.; Zhao, S.K.; Hou, J. Identification and classification of construction equipment operators’ mental fatigue using wearable eye-tracking technology. Automat. Constr. 2020, 109, 103000. [Google Scholar] [CrossRef]
- Underwood, G.; Chapman, P.; Bowden, K.; Crundall, D. Visual search while driving: Skill and awareness during inspection of the scene. Transp. Res. Part F Traffic Psychol. Behav. 2002, 5, 87–97. [Google Scholar] [CrossRef]
- Azimian, A.; Ortega, C.A.C.; Espinosa, J.M.; Mariscal, M.A.; Garcia-Herrero, S. Analysis of Drivers’ Eye Movements on Roundabouts: A Driving Simulator Study. Sustainability 2021, 13, 7463. [Google Scholar] [CrossRef]
- Robbins, C.; Chapman, P. How does drivers’ visual search change as a function of experience? A systematic review and meta-analysis. Accid. Anal. Prev. 2019, 132, 105266. [Google Scholar] [CrossRef]
- Zhao, W.; Han, W.; Wen, Y.; Zhang, D.; Liu, H. Impacts of Luminosity in the Cab at Night on the Dynamic Distance of Visual Cognition. Adv. Mech. Eng. 2015, 6, 182168. [Google Scholar] [CrossRef]
- Kim, N.; Kim, J.; Ahn, C.R. Predicting workers’ inattentiveness to struck-by hazards by monitoring biosignals during a construction task: A virtual reality experiment. Adv. Eng. Inform. 2021, 49, 101359. [Google Scholar] [CrossRef]
- Goldberg, J.H.; Kotval, X.P. Computer interface evaluation using eye movements: Methods and constructs. Int. J. Ind. Ergon. 1999, 24, 631–645. [Google Scholar] [CrossRef]
- Romoser, M.R.; Pollatsek, A.; Fisher, D.L.; Williams, C.C. Comparing the Glance Patterns of Older versus Younger Experienced Drivers: Scanning for Hazards while Approaching and Entering the Intersection. Transp. Res. Part F Traffic Psychol. Behav. 2013, 16, 104–116. [Google Scholar] [CrossRef]
- Yan, Y.; Yuan, H.; Wang, X.; Xu, T.; Liu, H. Study on Driver’s Fixation Variation at Entrance and Inside Sections of Tunnel on Highway. Adv. Mech. Eng. 2014, 7, 273427. [Google Scholar] [CrossRef]
- Park, G.D.; Reed, C.L. Nonuniform Changes in the Distribution of Visual Attention from Visual Complexity and Action: A Driving Simulation Study. Perception 2015, 44, 129–144. [Google Scholar] [CrossRef]
- Zhao, L.; Yang, F.; Bu, L.G.; Han, S.; Zhang, G.X.; Luo, Y. Driver behavior detection via adaptive spatial attention mechanism. Adv. Eng. Inform. 2021, 48, 101280. [Google Scholar] [CrossRef]
- Soares, S.; Campos, C.; Leitao, J.M.; Lobo, A.; Couto, A.; Ferreira, S. Distractive Tasks and the Influence of Driver Attributes. Sustainability 2021, 13, 5094. [Google Scholar] [CrossRef]
- Liang, Y.; Lee, J.D.; Reyes, M.L. Nonintrusive detection of driver cognitive distraction in real time using Bayesian networks. Transp. Res. Rec. 2007, 2018, 1–8. [Google Scholar] [CrossRef]
- Arexis, M.; Maquestiaux, F.; Gaspelin, N.; Ruthruff, E.; Didierjean, A. Attentional capture in driving displays. Br. J. Psychol. 2017, 108, 259–275. [Google Scholar] [CrossRef]
- Castro, C.; Padilla, J.L.; Doncel, P.; Garcia-Fernandez, P.; Ventsislavova, P.; Eisman, E.; Crundall, D. How are distractibility and hazard prediction in driving related? Role of driving experience as moderating factor. Appl. Ergon. 2019, 81, 102886. [Google Scholar] [CrossRef] [PubMed]
- Bakhit, P.R.; Osman, O.A.; Guo, B.B.; Ishak, S. A distraction index for quantification of driver eye glance behavior: A study using SHRP2 NEST database. Saf. Sci. 2019, 119, 106–111. [Google Scholar] [CrossRef]
- Gaspar, J.G.; Ward, N.; Neider, M.B.; Crowell, J.; Carbonari, R.; Kaczmarski, H.; Ringer, R.V.; Johnson, A.P.; Kramer, A.F.; Loschky, L.C. Measuring the Useful Field of View During Simulated Driving With Gaze-Contingent Displays. Hum. Factors J. Hum. Factors Ergon. Soc. 2016, 58, 630–641. [Google Scholar] [CrossRef] [PubMed]
- Hochman, M.; Parmet, Y.; Oron-Gilad, T. Pedestrians’ Understanding of a Fully Autonomous Vehicle’s Intent to Stop: A Learning Effect Over Time. Front. Psychol. 2020, 11, 585280. [Google Scholar] [CrossRef] [PubMed]
- Jeelani, I.; Albert, A.; Han, K.; Azevedo, R. Are Visual Search Patterns Predictive of Hazard Recognition Performance? Empirical Investigation Using Eye-Tracking Technology. J. Constr. Eng. Manag. 2019, 145, 04018115. [Google Scholar] [CrossRef]
- Zahabi, M.; Machado, P.; Pankok, C., Jr.; Lau, M.Y.; Liao, Y.F.; Hummer, J.; Rasdorf, W.; Kaber, D.B. The role of driver age in performance and attention allocation effects of roadway sign count, format and familiarity. Appl. Ergon. 2017, 63, 17–30. [Google Scholar] [CrossRef] [PubMed]
- Holmqvist, K.; Nyström, M.; Andersson, R.; Dewhurst, R.; Jarodzka, H.; van de Weijer, J. Eye Tracking: A Comprehensive Guide to Methods and Measures; Oxford University Press: Oxford, UK, 2011. [Google Scholar]
- Xu, Q.; Guo, T.-Y.; Shao, F.; Jiang, X.-J. Division of Area of Fixation Interest for Real Vehicle Driving Tests. Math. Probl. Eng. 2017, 2017, 3674374. [Google Scholar] [CrossRef]
- Fox, E.; de Fockert, J.W. Inhibitory effects of repeating color and shape: Inhibition of return or repetition blindness? J. Exp. Psychol. Hum. Percept. Perform. 2001, 27, 798–812. [Google Scholar] [CrossRef] [PubMed]
- Pel, J.J.; van Beijsterveld, M.C.; Thepass, G.; van der Steen, J. Validity and Repeatability of Saccadic Response Times Across the Visual Field in Eye Movement Perimetry. Transl. Vis. Sci. Technol. 2013, 2, 3. [Google Scholar] [CrossRef]
- Poiroux, E.; Cavaro-Menard, C.; Leruez, S.; Lemee, J.M.; Richard, I.; Dinomais, M. What Do Eye Gaze Metrics Tell Us about Motor Imagery? PLoS ONE 2015, 10, e0143831. [Google Scholar] [CrossRef]
- Fang, S.; Ma, J.X. Experimental Analysis of Driver Visual Characteristics in Urban Tunnels. Appl. Sci. 2021, 11, 4274. [Google Scholar] [CrossRef]
- Gepshtein, S.; Albright, T.D. Adaptive Optimization of Visual Sensitivity. J. Indian Inst. Sci. 2017, 97, 423–434. [Google Scholar] [CrossRef]
- Shang, T.; Lu, H.; Wu, P.; Wei, Y. Eye-Tracking Evaluation of Exit Advance Guide Signs in Highway Tunnels in Familiar and Unfamiliar Drivers. Int. J. Environ. Res. Public Health 2021, 18, 6820. [Google Scholar] [CrossRef]
- Zhang, W.; Dai, J.; Pei, Y.; Li, P.; Yan, Y.; Chen, X. Drivers’ Visual Search Patterns during Overtaking Maneuvers on Freeway. Int. J. Environ. Res. Public Health 2016, 13, 1159. [Google Scholar] [CrossRef] [PubMed]
Disclaimer/Publisher’s Note: The statements, opinions and data contained in all publications are solely those of the individual author(s) and contributor(s) and not of MDPI and/or the editor(s). MDPI and/or the editor(s) disclaim responsibility for any injury to people or property resulting from any ideas, methods, instructions or products referred to in the content. |
© 2023 by the authors. Licensee MDPI, Basel, Switzerland. This article is an open access article distributed under the terms and conditions of the Creative Commons Attribution (CC BY) license (https://creativecommons.org/licenses/by/4.0/).