

The Multifunctional Effect of Porous Additives on the Alleviation of Ammonia and Sulfate Co-Inhibition in Anaerobic Digestion


 , , , , and
Abstract
1. Introduction
2. Materials and Methods
2.1. Inorganic Additives
2.1.1. Bentonite and Zeolite 13X
2.1.2. Methodology of Alkali Modification of Bentonite and Zeolite 13X
2.2. Anaerobic Experimental Process
2.2.1. Feedstock and Inoculum
2.2.2. Experimental Setup
2.3. Analytical Methods
2.3.1. Physicochemical Analyses for the Anaerobic Process
2.3.2. Determination of Ammonia and Sulfate Removal Capacity
2.3.3. Physicochemical Analyses of Modified Additives
2.3.4. Statistical Analyses
3. Results and Discussion
3.1. Characteristics of Additives
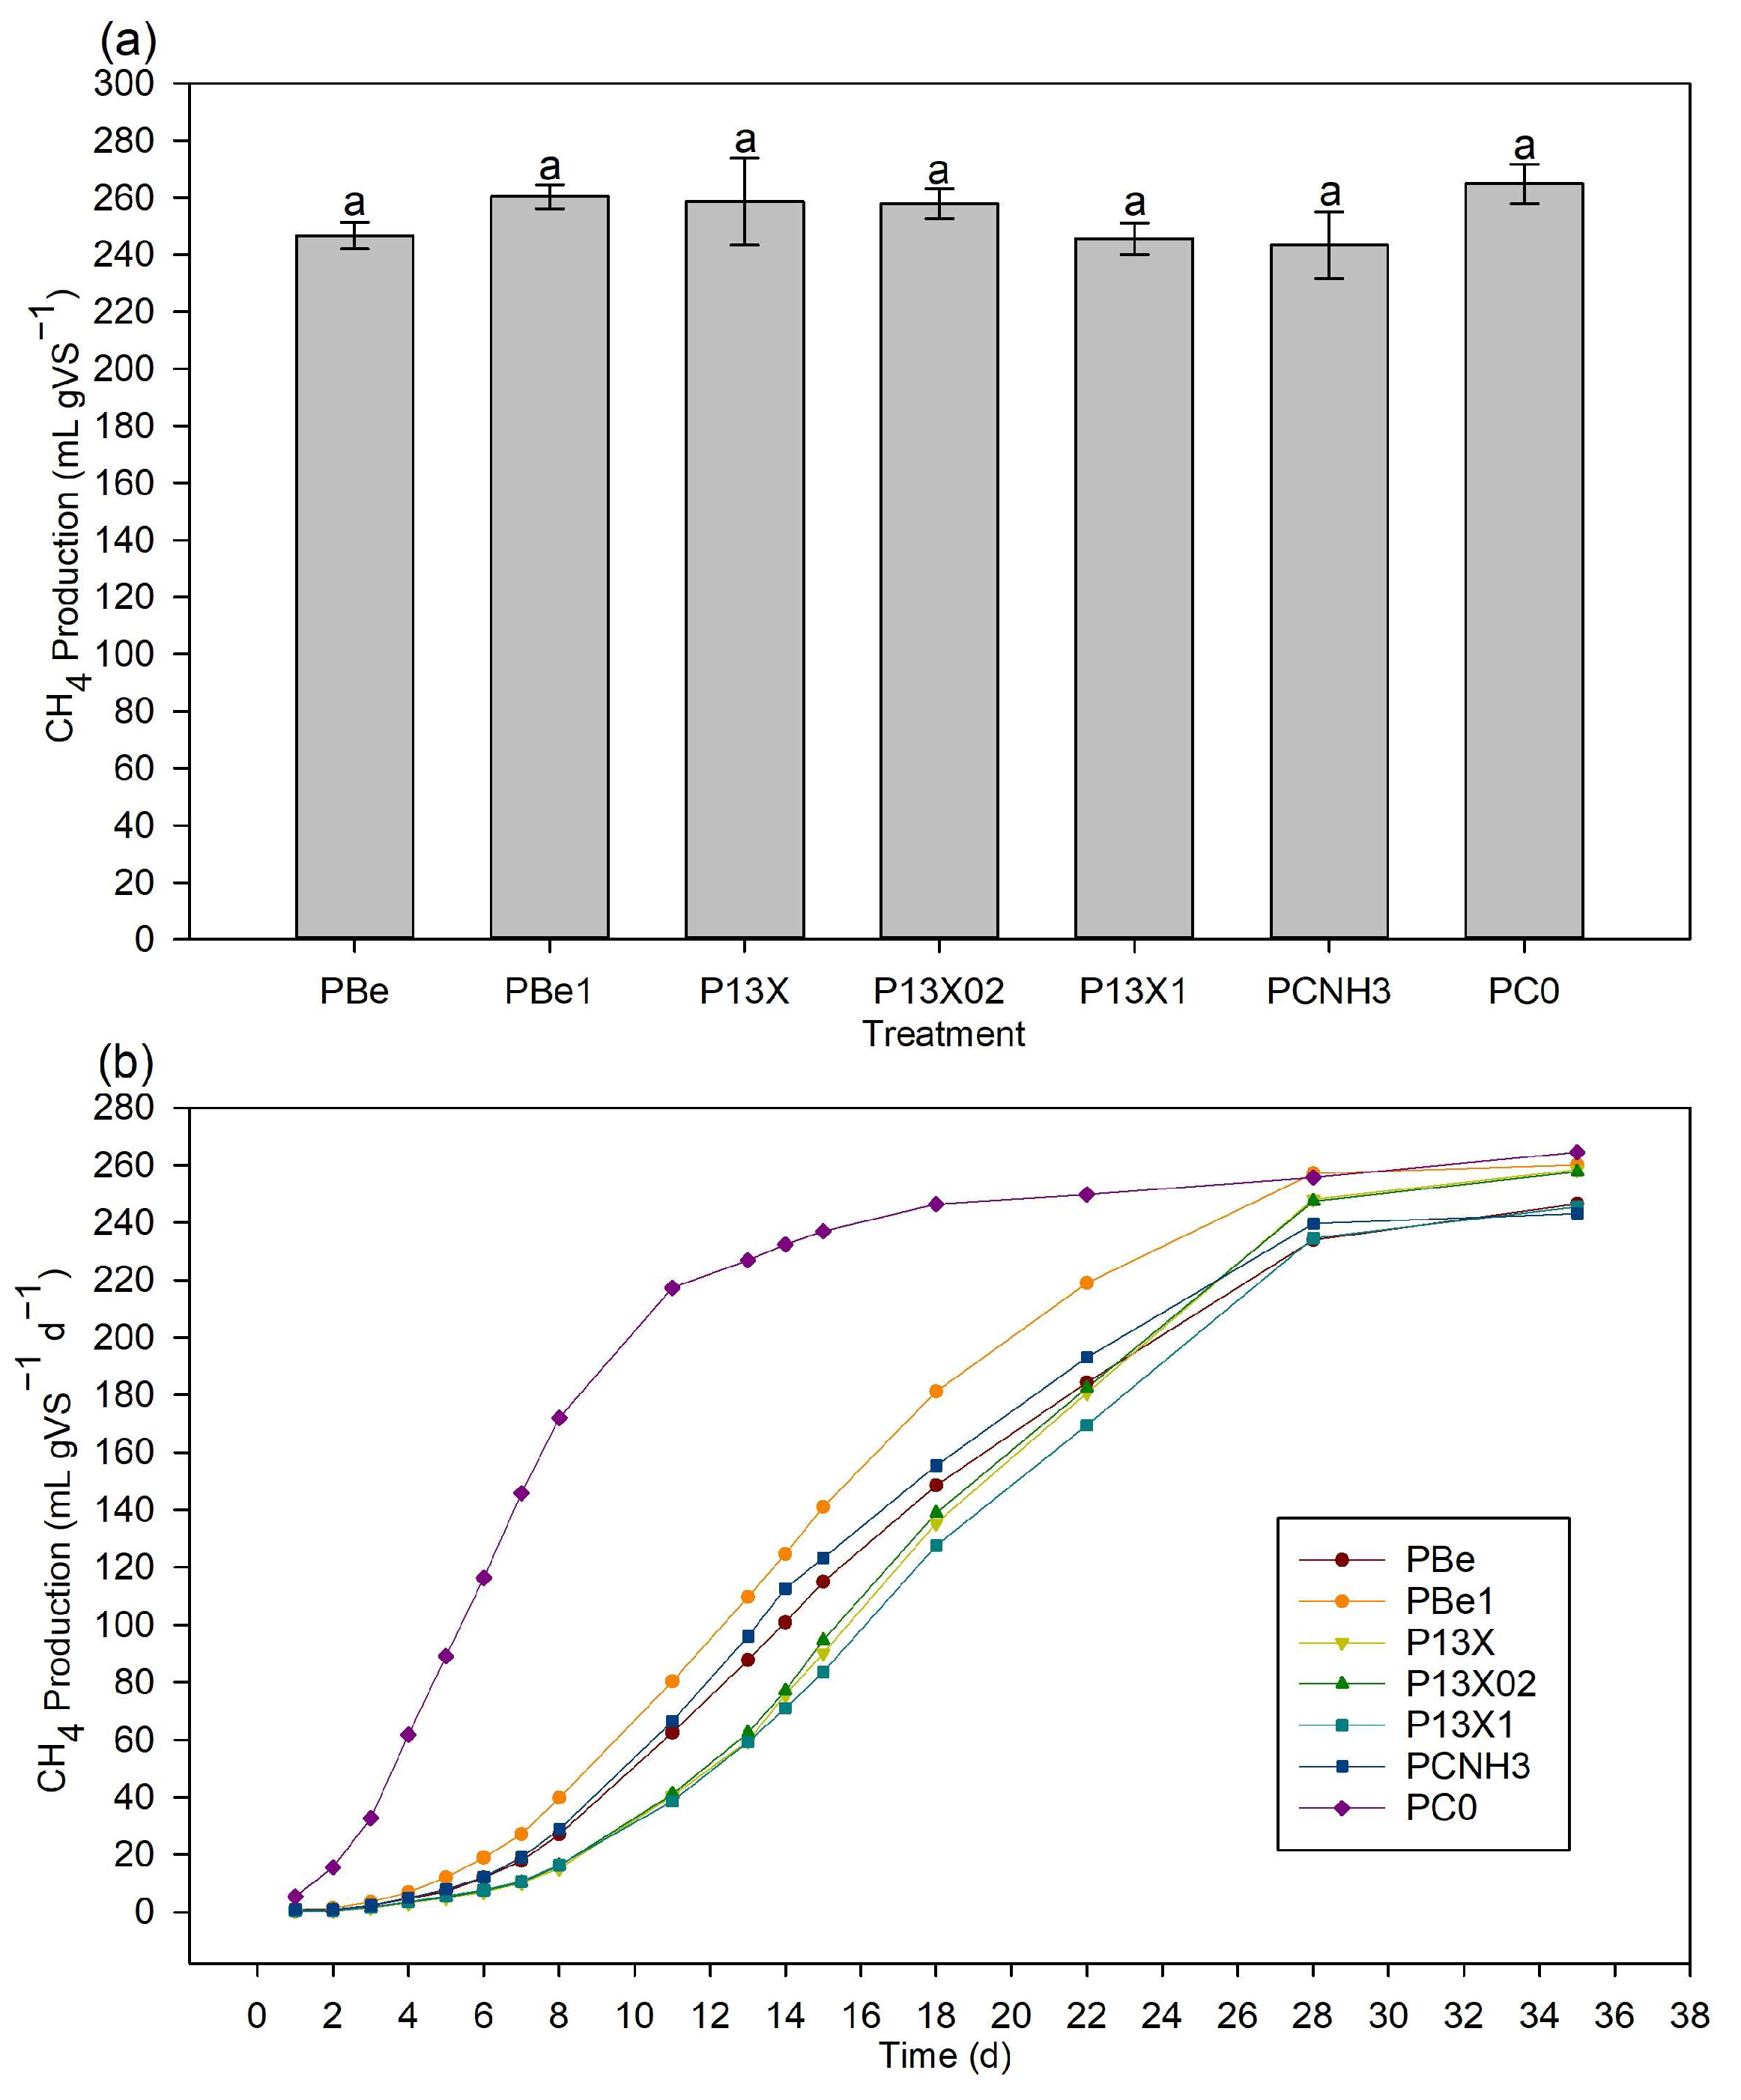
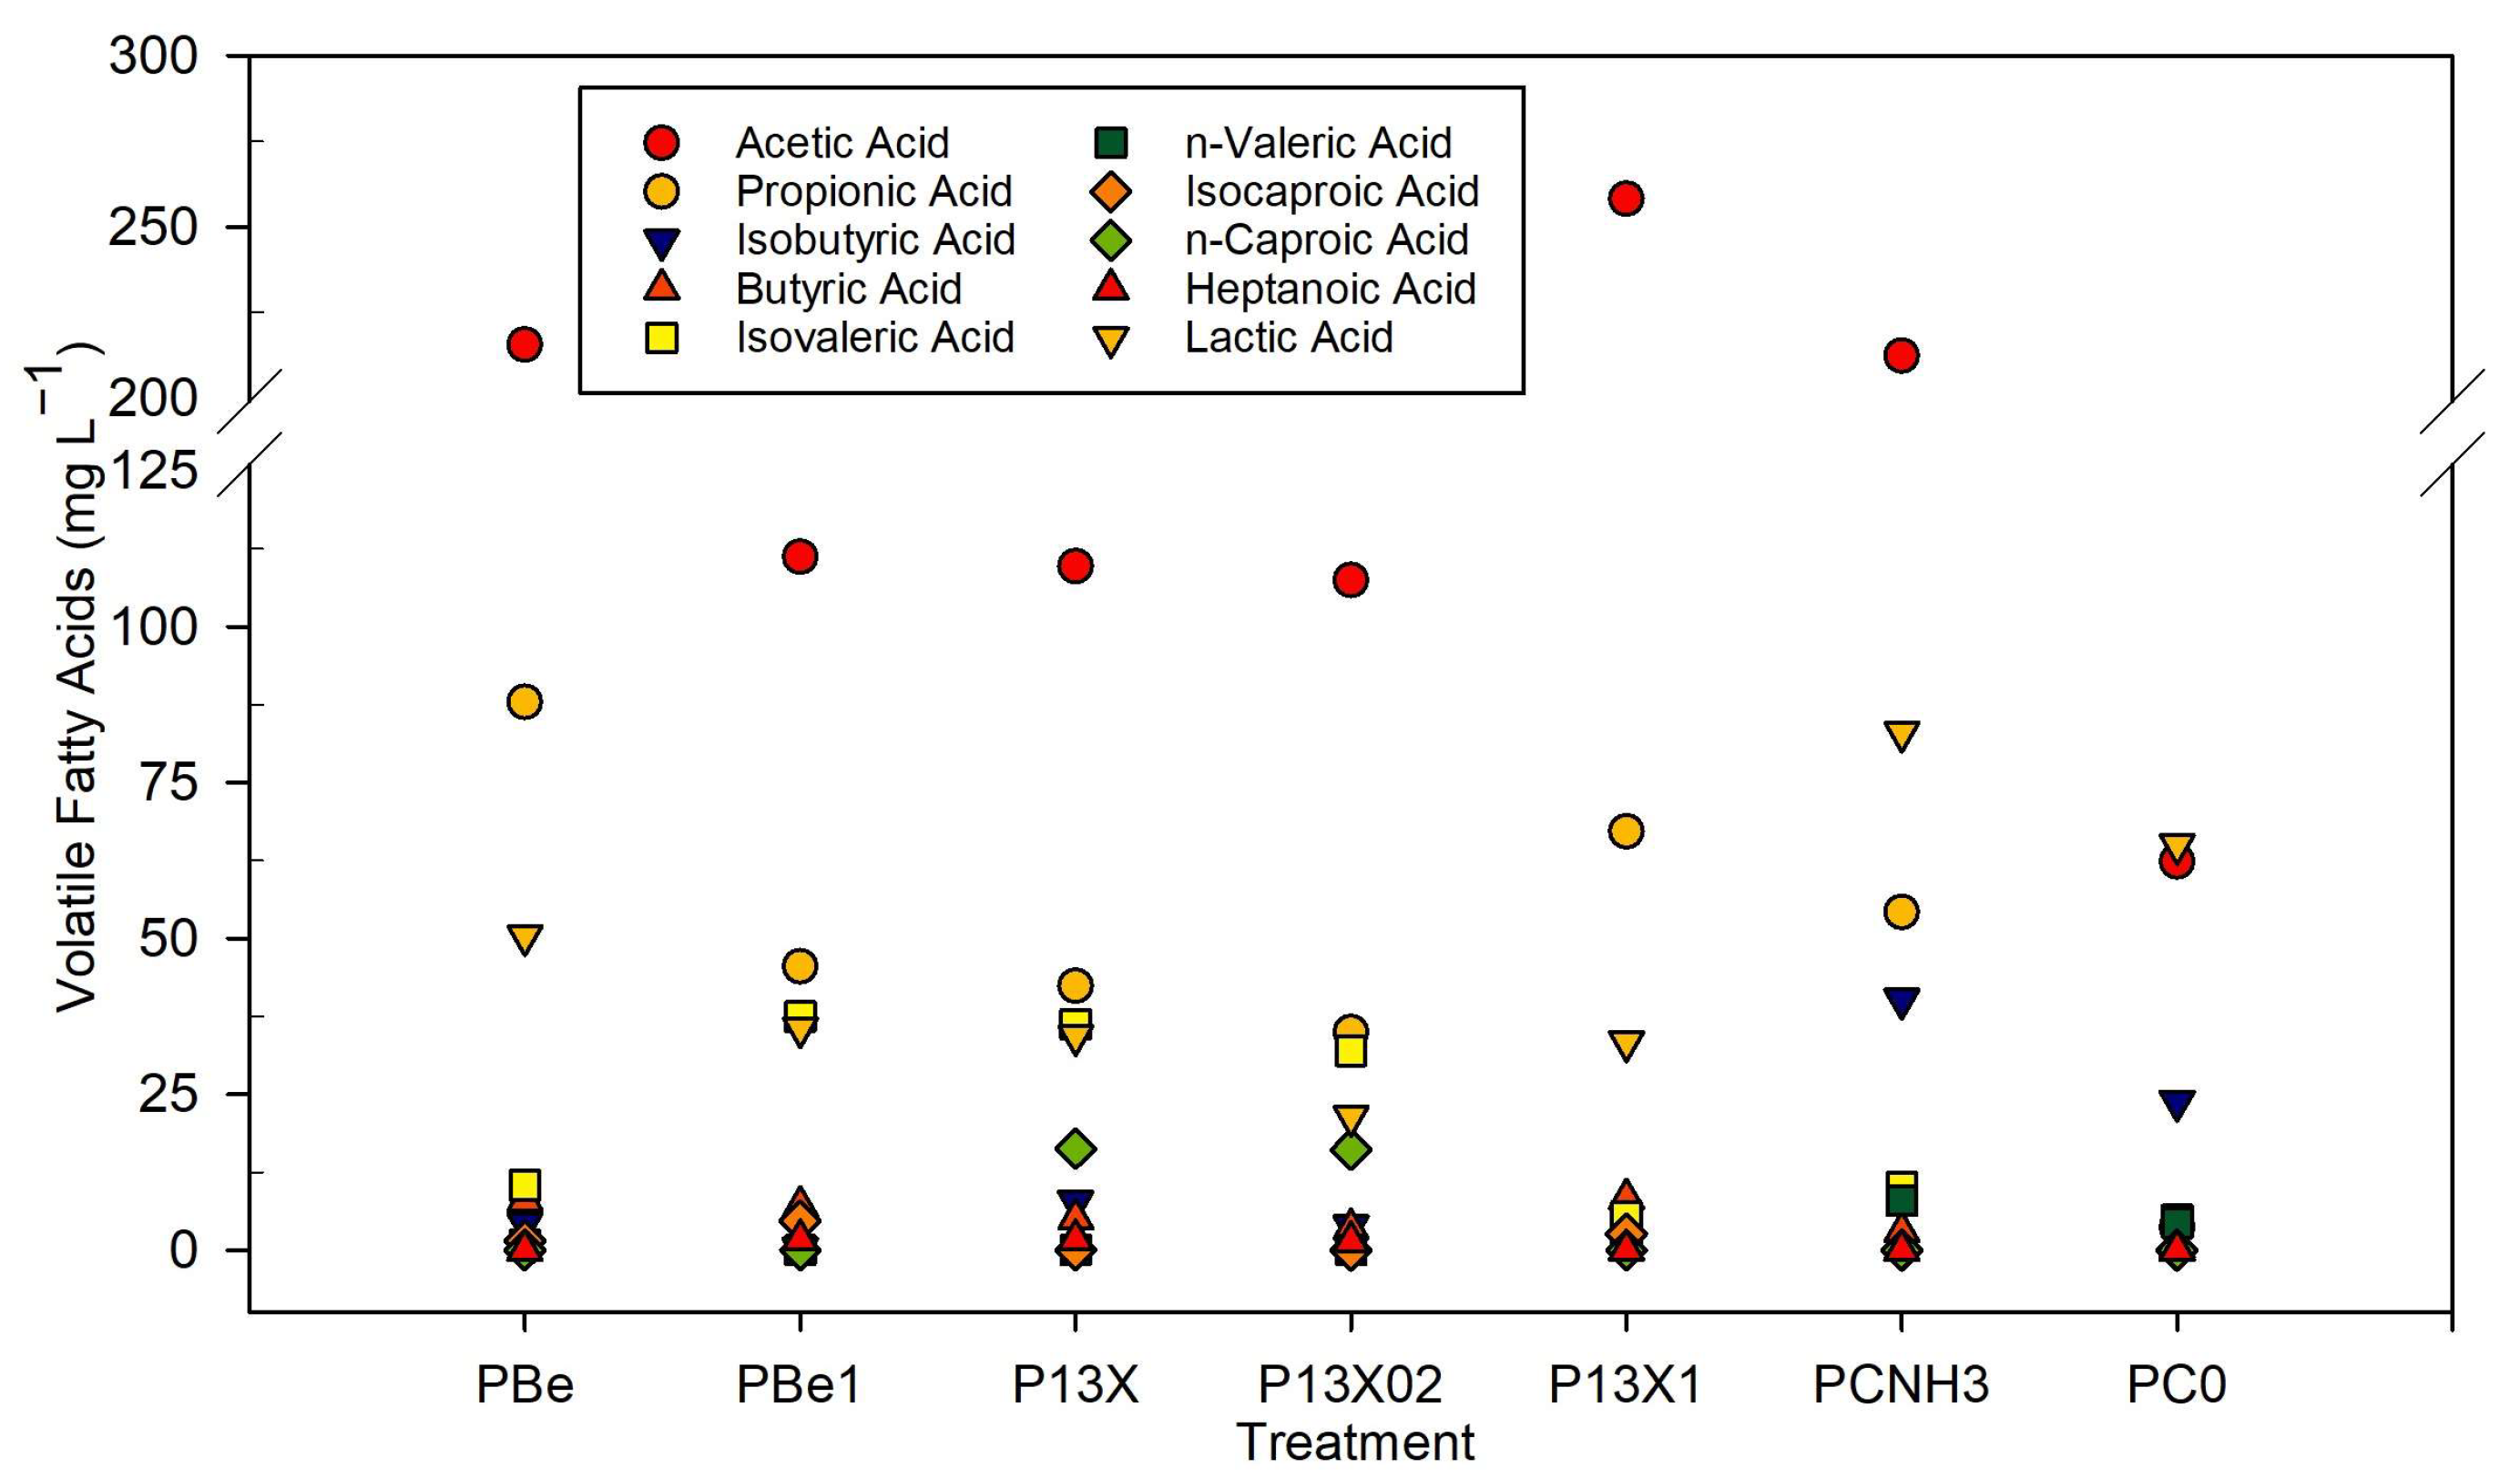
3.2. Effect of Modified Additives on Methane Production under High Ammonia Concentration
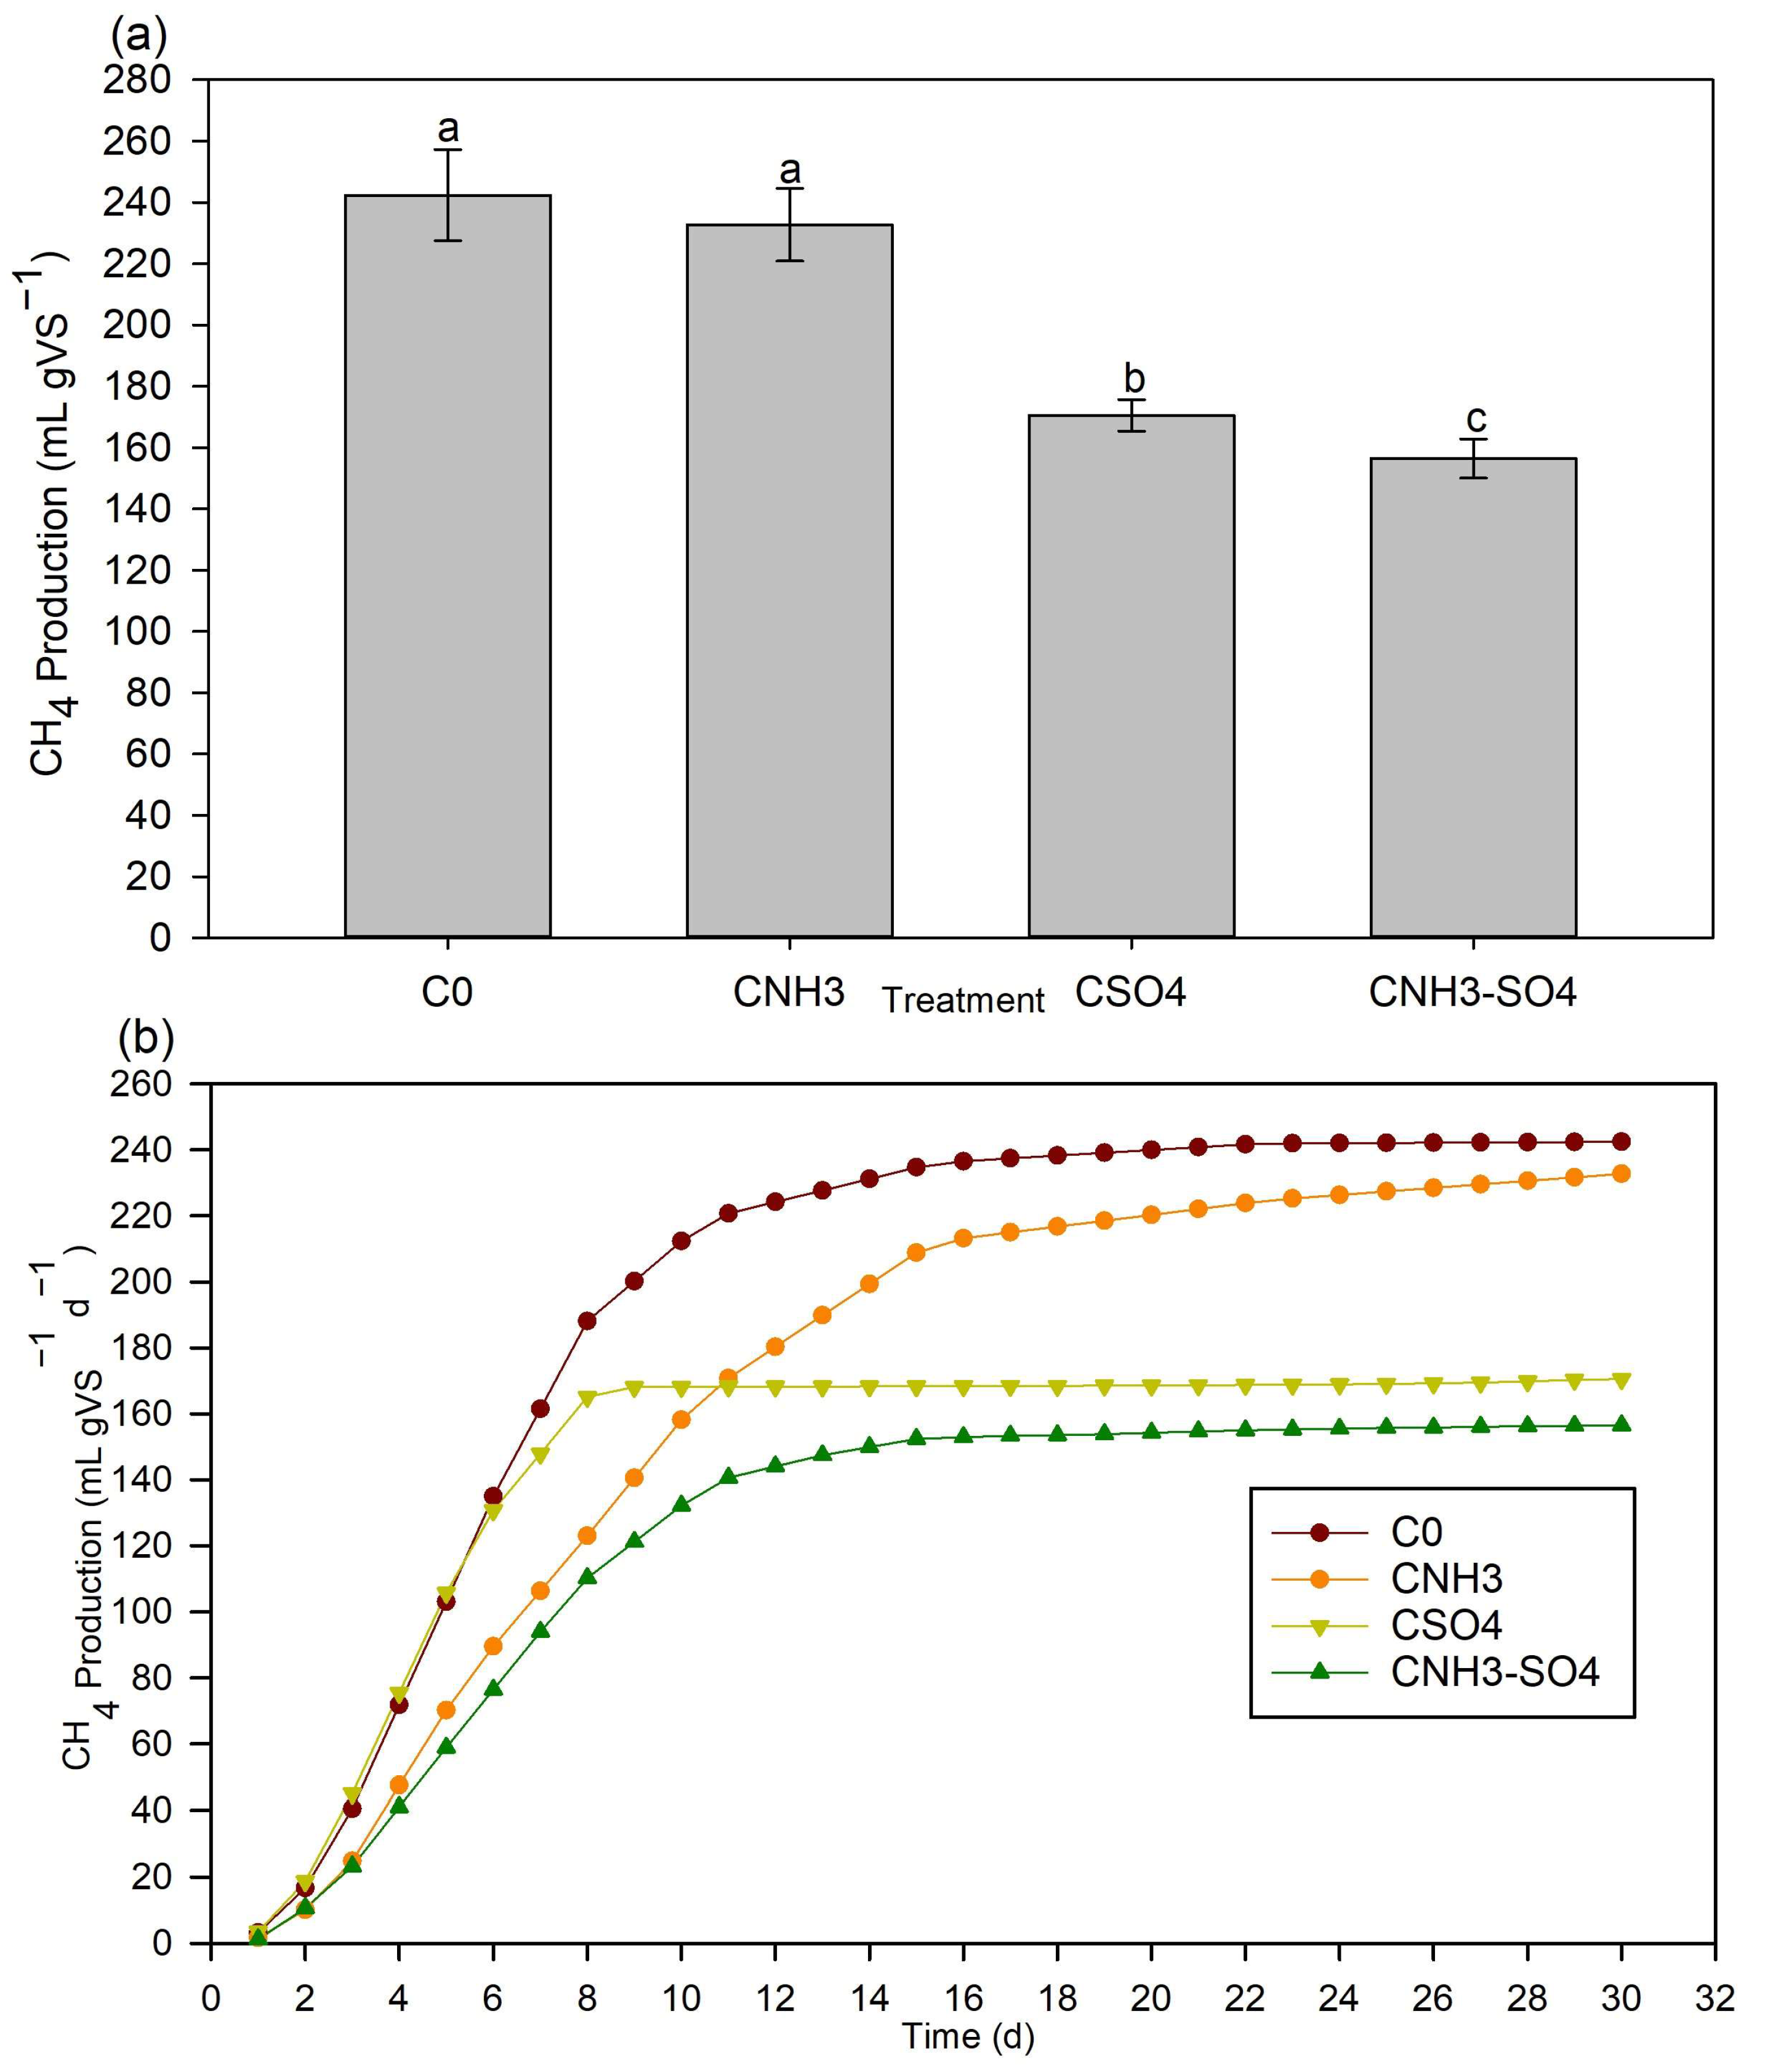
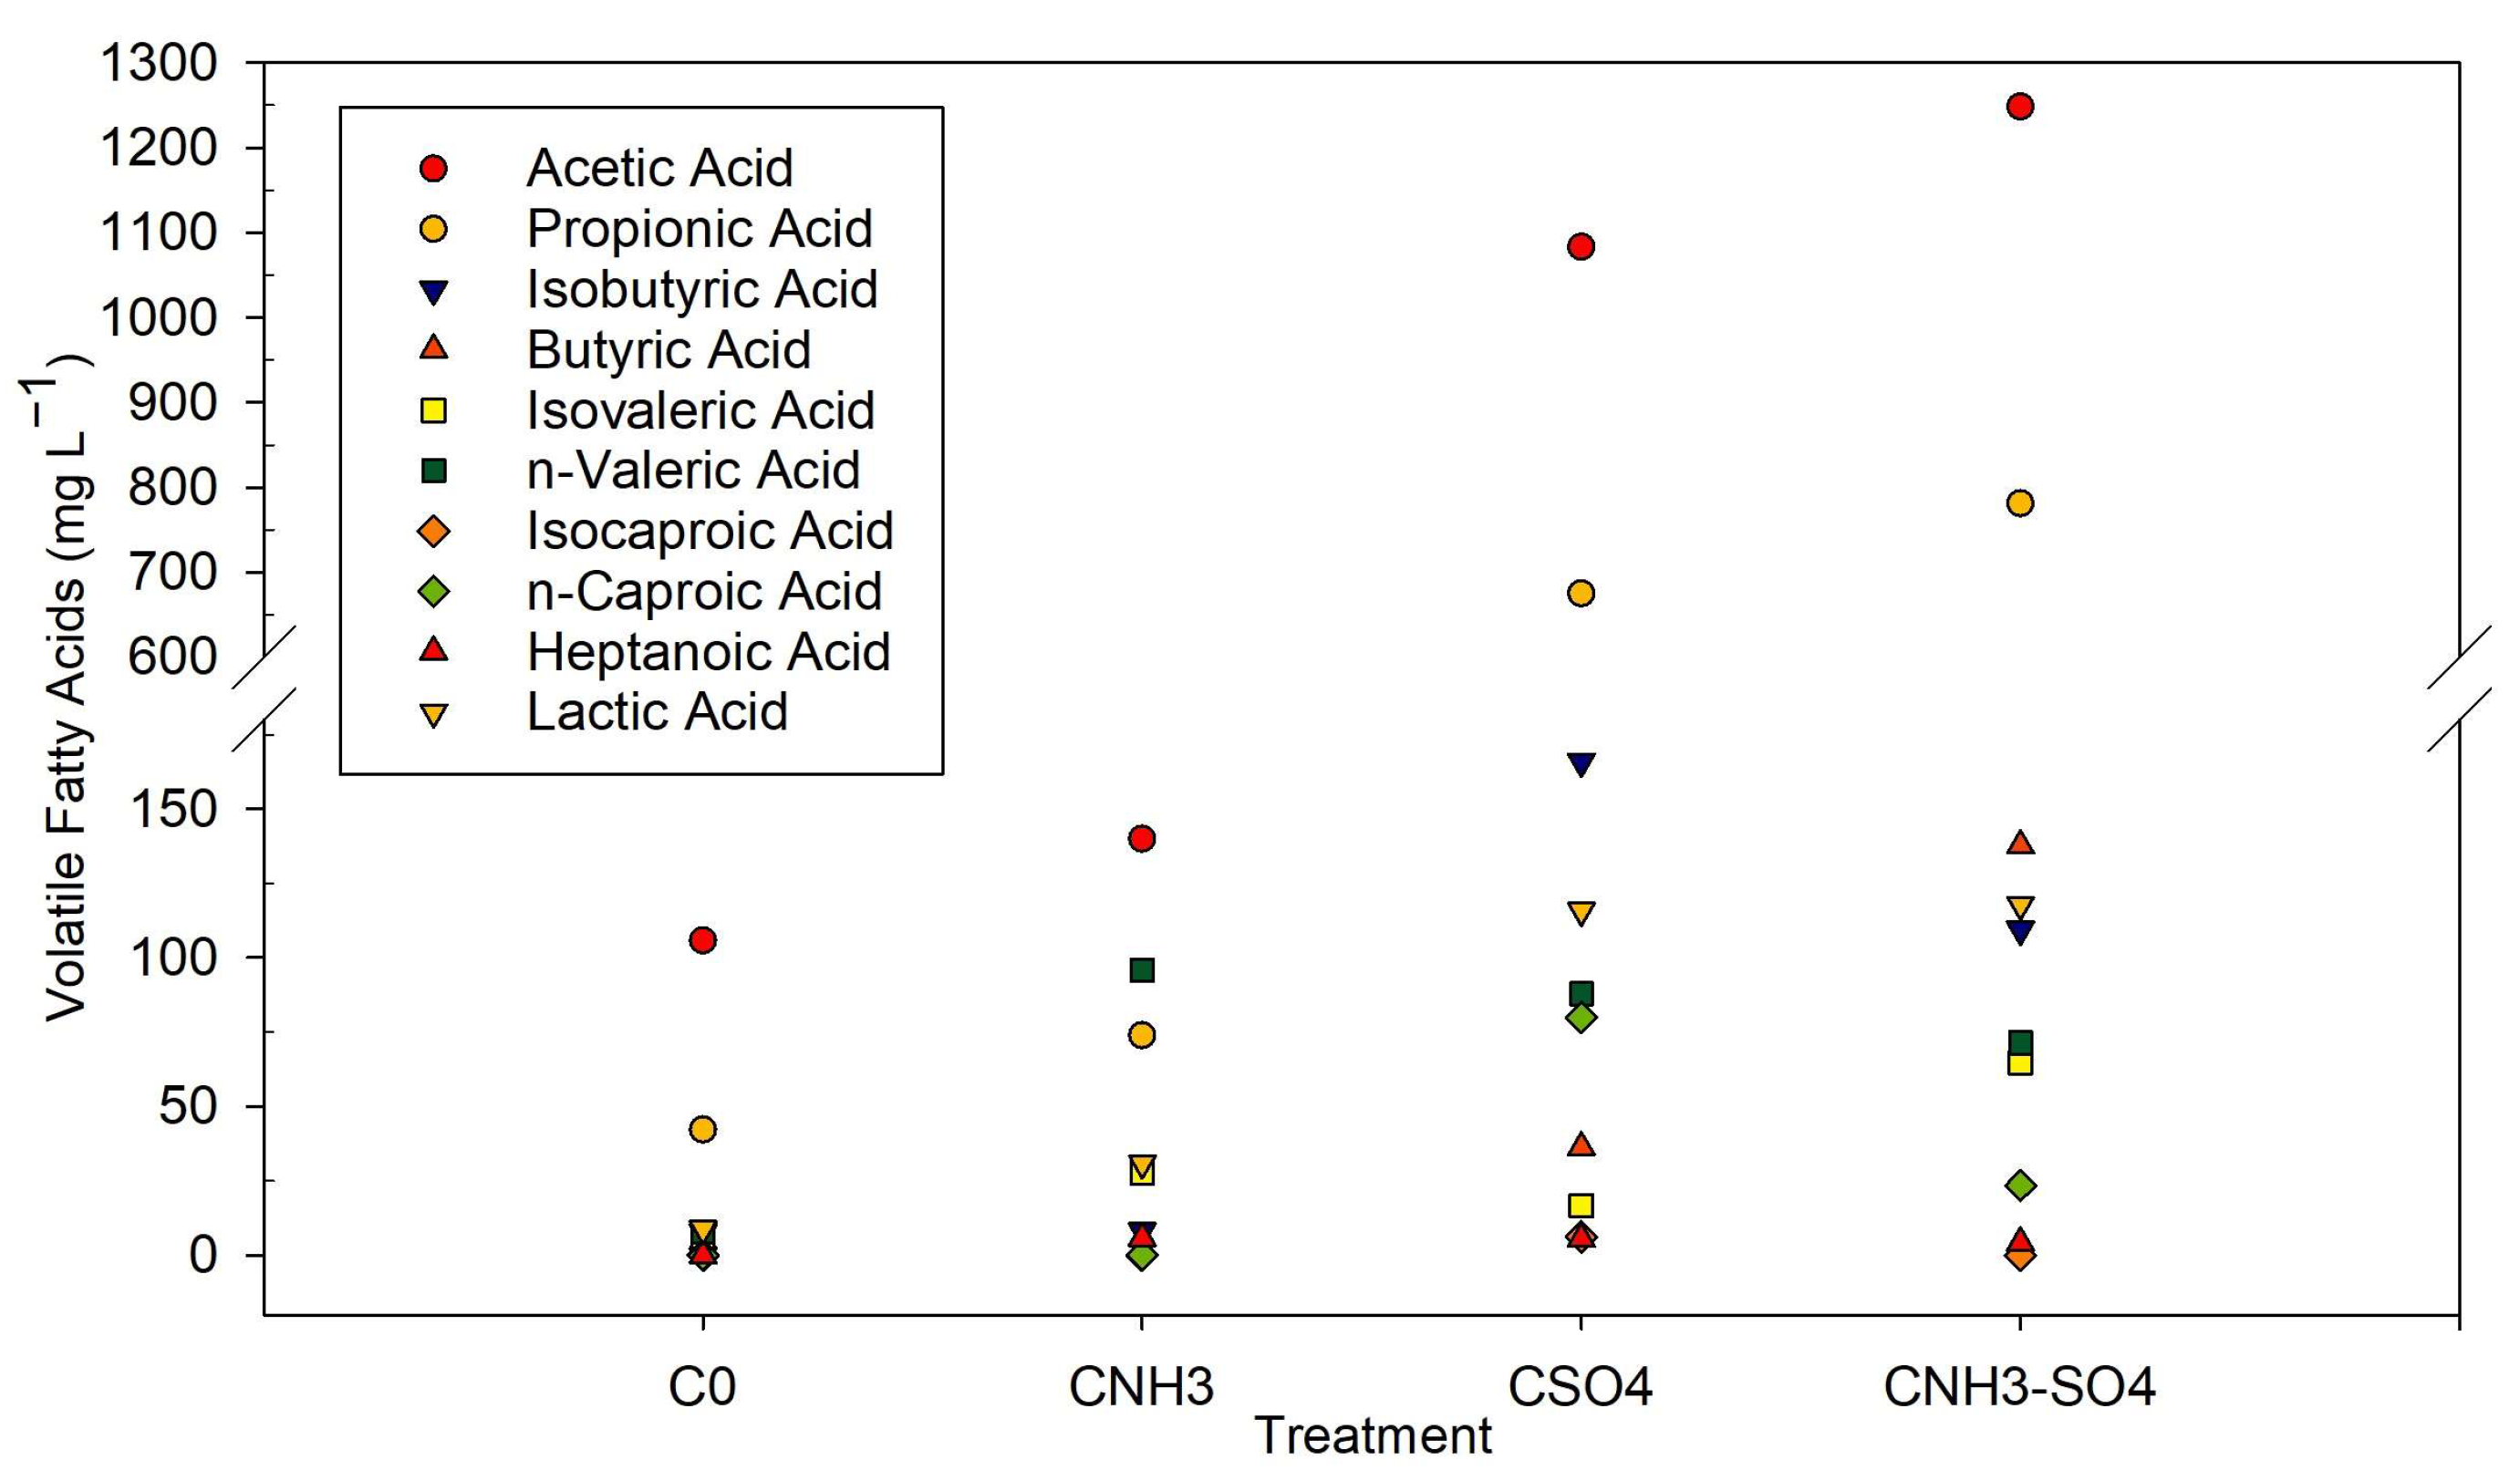
Anaerobic Process under High Ammonia and Sulfate Concentrations
Toxicity Effect of Sulfate and Ammonia on Methane Production
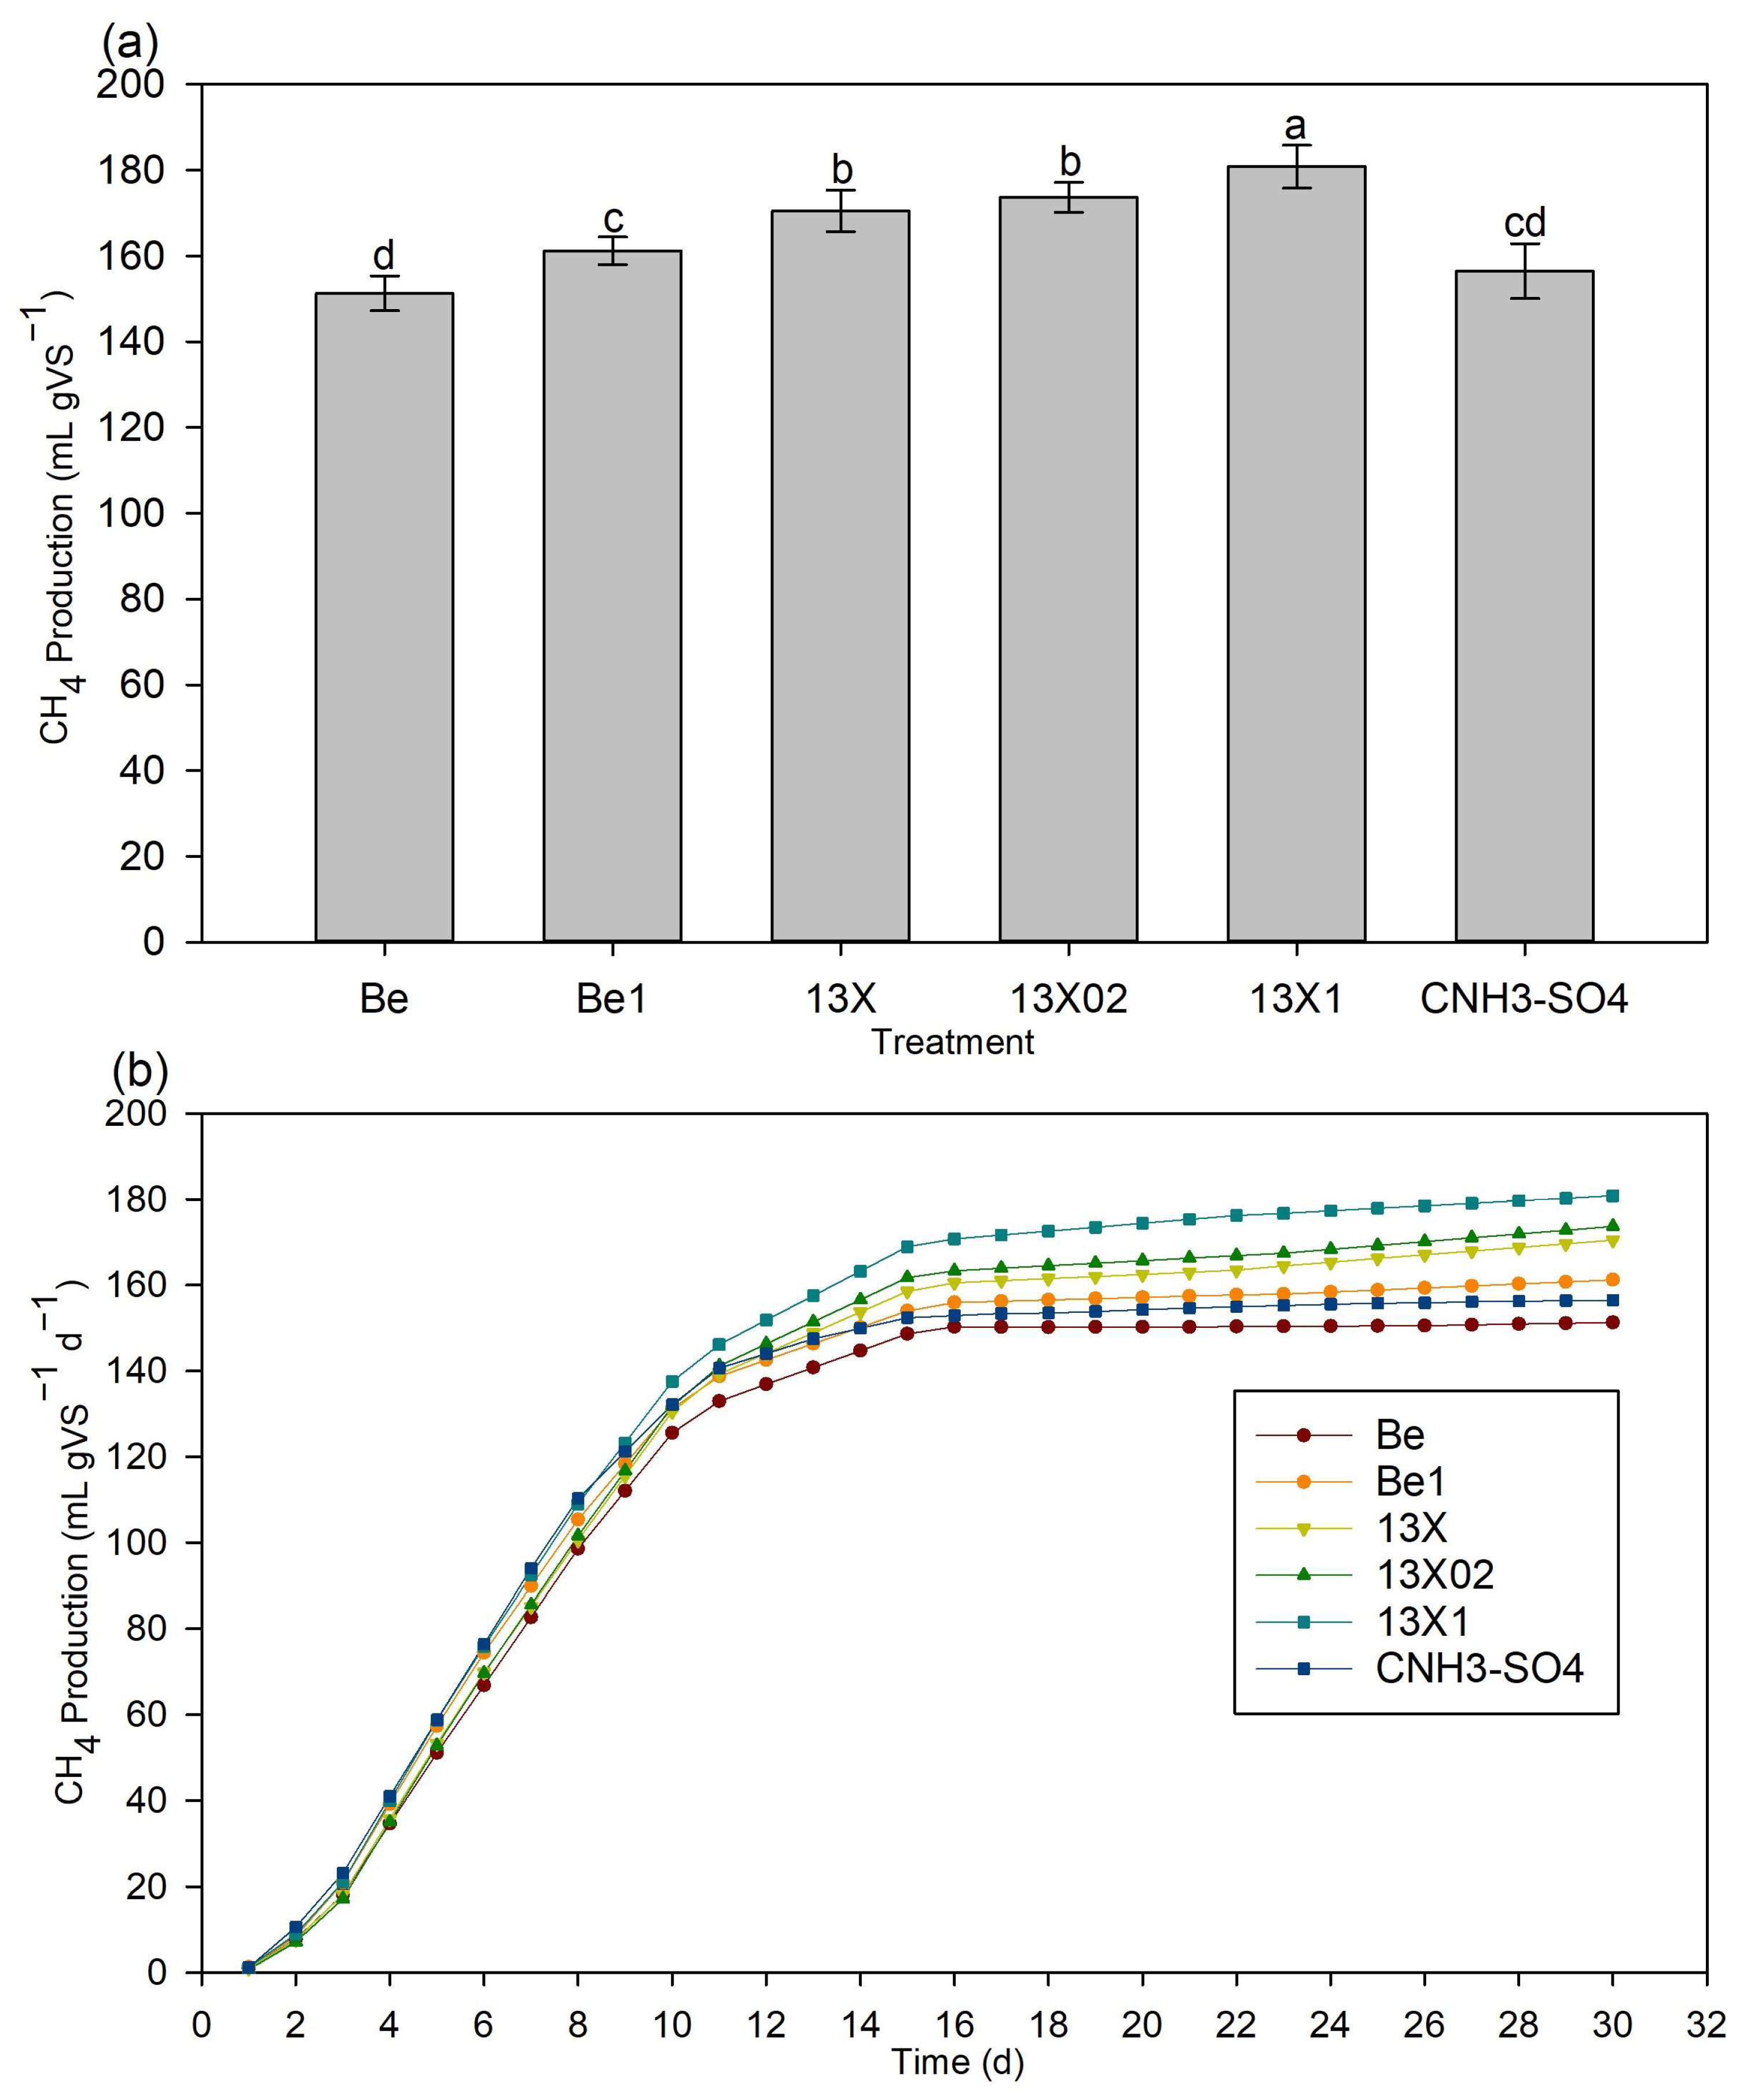
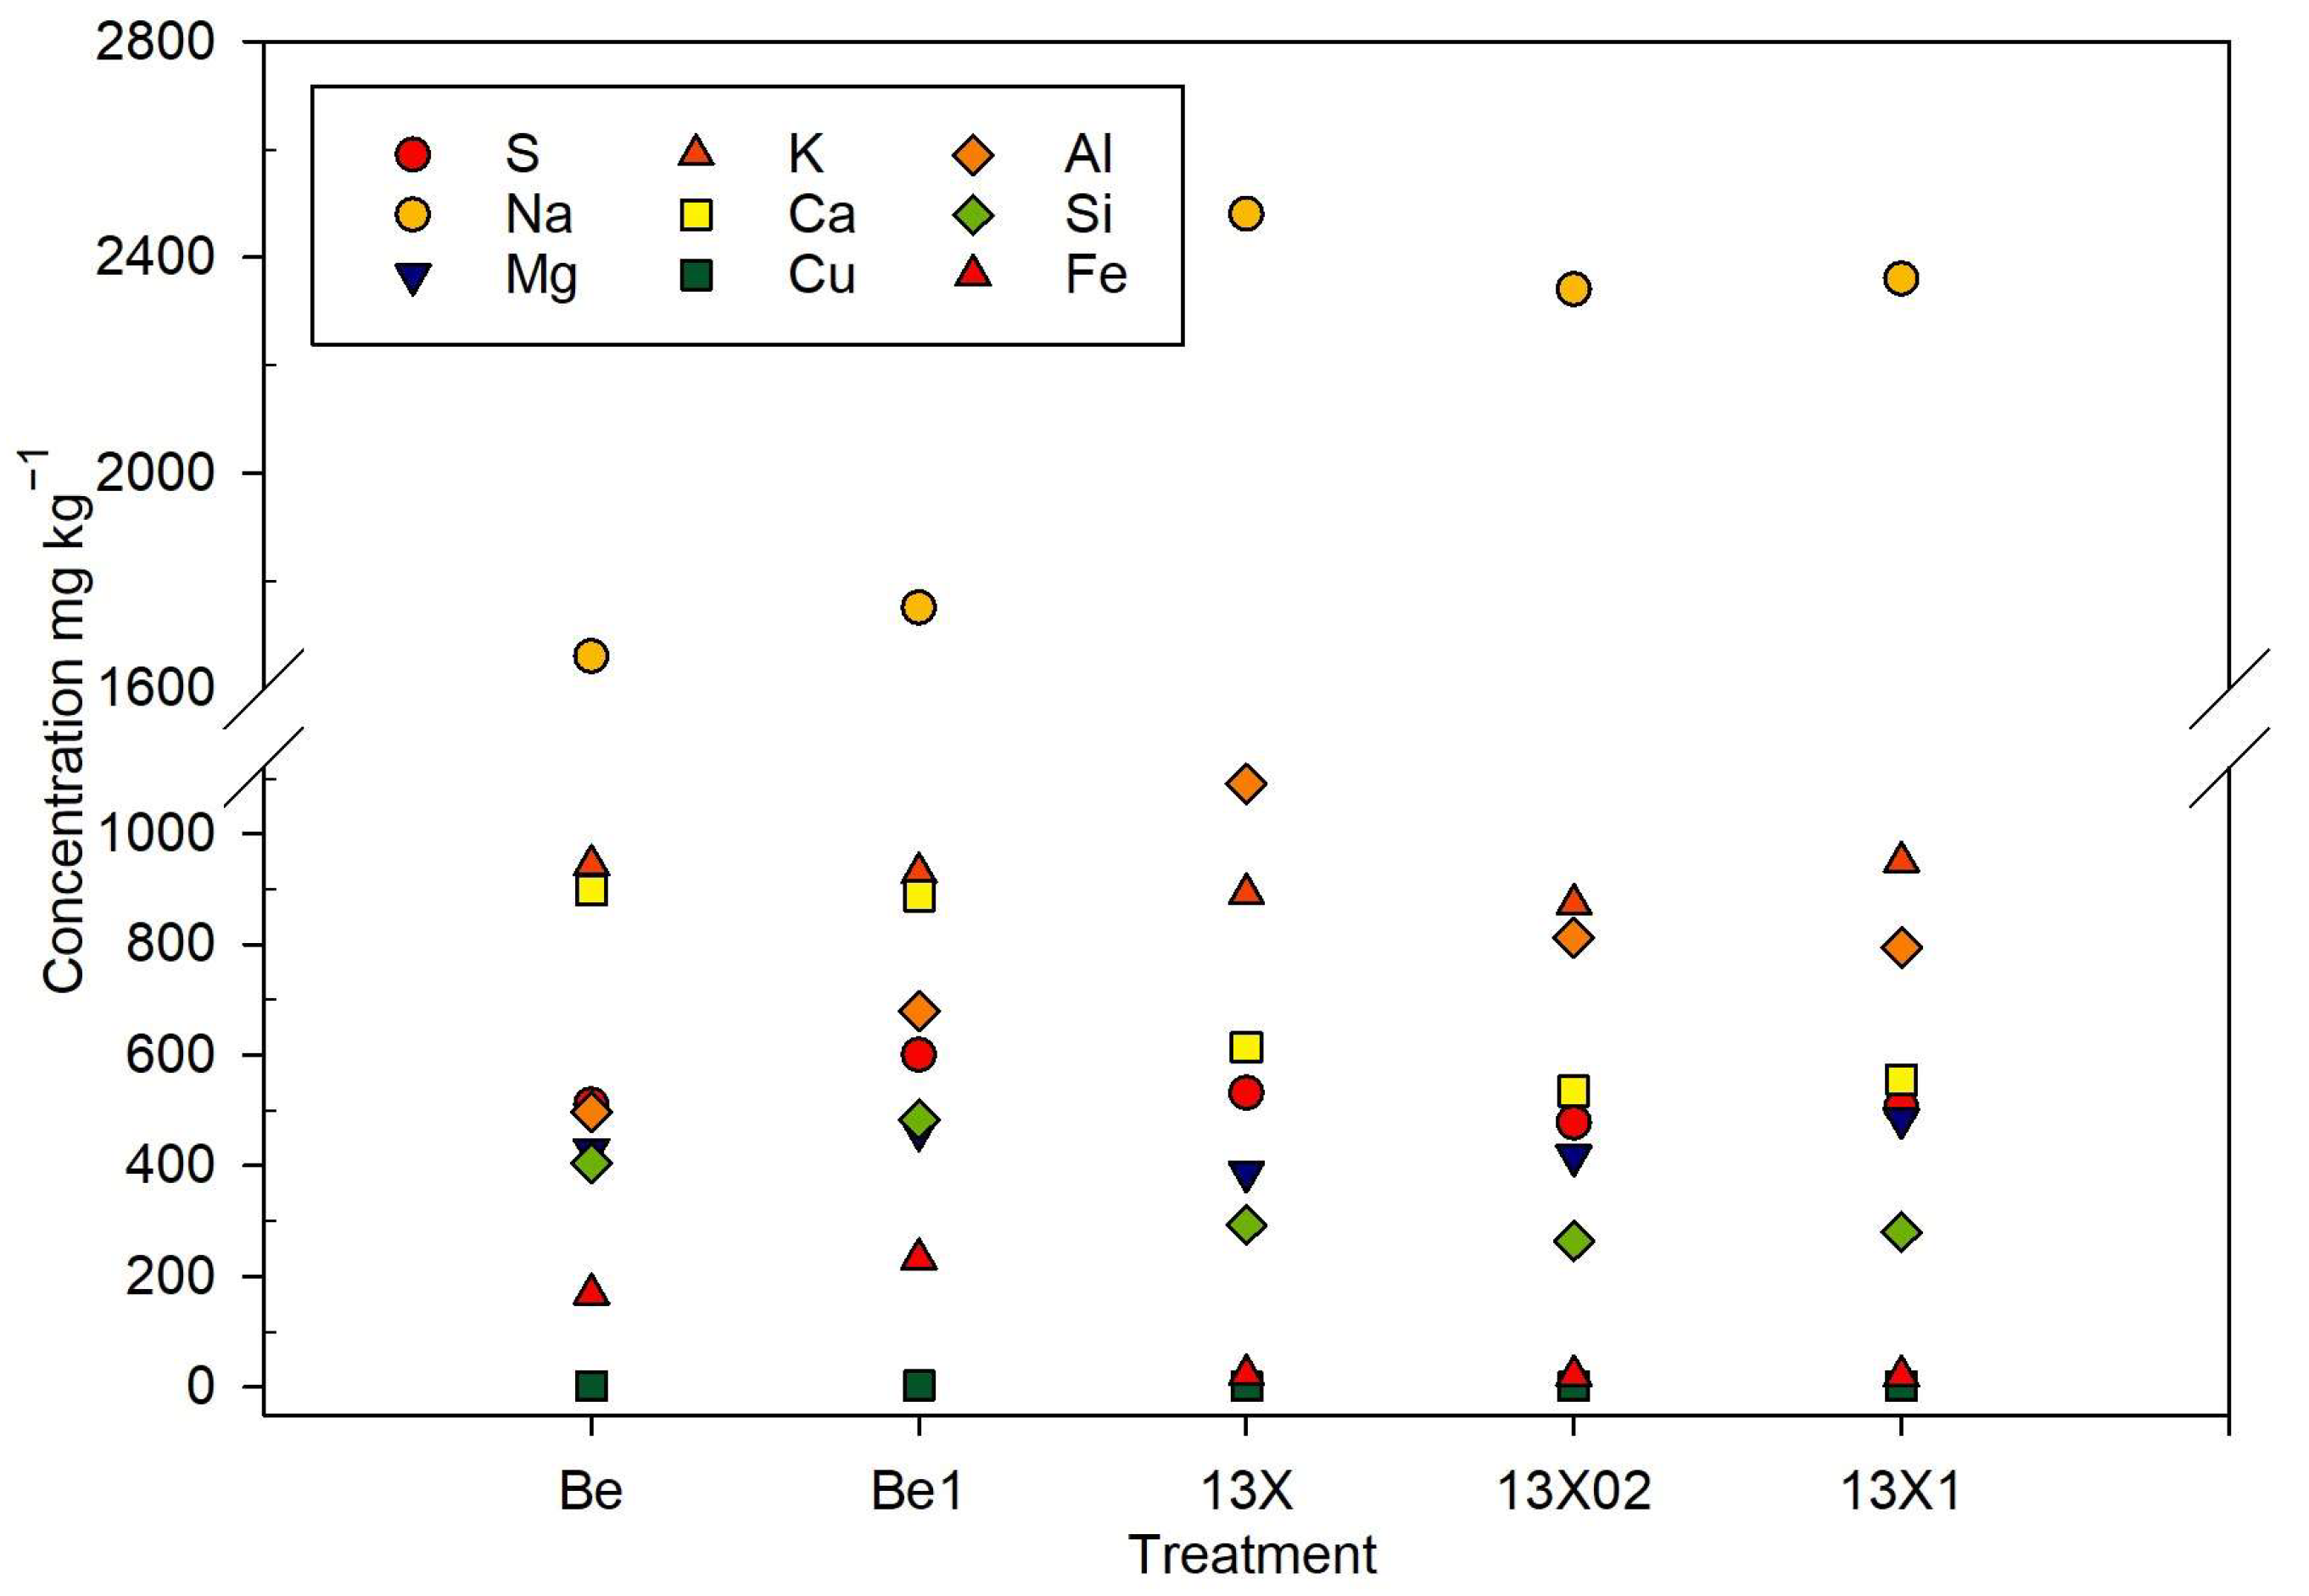
Effect of the Modified Additives on the Anaerobic Process under High Ammonia and Sulfate Concentrations
4. Conclusions
Supplementary Materials
Author Contributions
Funding
Institutional Review Board Statement
Informed Consent Statement
Data Availability Statement
Acknowledgments
Conflicts of Interest
References
- Capson-Tojo, G.; Moscoviz, R.; Astals, S.; Robles, Á.; Steyer, J.-P. Unraveling the literature chaos around free ammonia inhibition in anaerobic digestion. Renew. Sustain. Energy Rev. 2020, 117, 109487. [Google Scholar] [CrossRef]
- Fotidis, I.; Karakashev, D.B.; Angelidaki, I. The dominant acetate degradation pathway/methanogenic composition in full-scale anaerobic digesters operating under different ammonia levels. Int. J. Environ. Sci. Technol. 2014, 11, 2087–2094. [Google Scholar] [CrossRef]
- Tsiakiri, E.P.; Mpougali, A.; Lemonidis, I.; Tzenos, C.A.; Kalamaras, S.D.; Kotsopoulos, T.A.; Samaras, P. Estimation of Energy Recovery Potential from Primary Residues of Four Municipal Wastewater Treatment Plants. Sustainability 2021, 13, 7198. [Google Scholar] [CrossRef]
- Obaideen, K.; Abdelkareem, M.A.; Wilberforce, T.; Elsaid, K.; Sayed, E.T.; Maghrabie, H.M.; Olabi, A. Biogas role in achievement of the sustainable development goals: Evaluation, Challenges, and Guidelines. J. Taiwan Inst. Chem. Eng. 2022, 131, 104207. [Google Scholar] [CrossRef]
- Chen, J.L.; Ortiz, R.; Steele, T.W.; Stuckey, D.C. Toxicants inhibiting anaerobic digestion: A review. Biotechnol. Adv. 2014, 32, 1523–1534. [Google Scholar] [CrossRef] [PubMed]
- Chen, Y.; Jay, J.; Cheng, J.J.; Creamer, K.S. Inhibition of anaerobic digestion process: A review. Bioresour. Technol. 2008, 99, 4044–4064. [Google Scholar] [CrossRef] [PubMed]
- Jung, H.; Kim, D.; Choi, H.; Lee, C. A review of technologies for in-situ sulfide control in anaerobic digestion. Renew. Sustain. Energy Rev. 2022, 157, 112068. [Google Scholar] [CrossRef]
- Yan, L.; Ye, J.; Zhang, P.; Xu, D.; Wu, Y.; Liu, J.; Zhang, H.; Fang, W.; Wang, B.; Zeng, G. Hydrogen sulfide formation control and microbial competition in batch anaerobic digestion of slaughterhouse wastewater sludge: Effect of initial sludge pH. Bioresour. Technol. 2018, 259, 67–74. [Google Scholar] [CrossRef]
- Li, Z.-Y.; Inoue, D.; Ike, M. Mitigating ammonia-inhibition in anaerobic digestion by bioaugmentation: A review. J. Water Process Eng. 2023, 52, 103506. [Google Scholar] [CrossRef]
- Jiang, Y.; McAdam, E.; Zhang, Y.; Heaven, S.; Banks, C.; Longhurst, P. Ammonia inhibition and toxicity in anaerobic digestion: A critical review. J. Water Process Eng. 2019, 32, 100899. [Google Scholar] [CrossRef]
- Calli, B.; Mertoglu, B.; Inanc, B.; Yenigun, O. Effects of high free ammonia concentrations on the performances of anaerobic bioreactors. Process Biochem. 2005, 40, 1285–1292. [Google Scholar] [CrossRef]
- Montalvo, S.; Guerrero, L.; Borja, R.; Sánchez, E.; Milán, Z.; Cortés, I.; de la la Rubia, M.A. Application of natural zeolites in anaerobic digestion processes: A review. Appl. Clay Sci. 2012, 58, 125–133. [Google Scholar] [CrossRef]
- Guo, J.; Yang, C.; Zeng, G. Treatment of swine wastewater using chemically modified zeolite and bioflocculant from activated sludge. Bioresour. Technol. 2013, 143, 289–297. [Google Scholar] [CrossRef] [PubMed]
- Pizarro, C.; Escudey, M.; Bravo, C.; Gacitua, M.; Pavez, L. Sulfate Kinetics and Adsorption Studies on a Zeolite/Polyammonium Cation Composite for Environmental Remediation. Minerals 2021, 11, 180. [Google Scholar] [CrossRef]
- Sigot, L.; Ducom, G.; Germain, P. Adsorption of hydrogen sulfide (H2S) on zeolite (Z): Retention mechanism. Chem. Eng. J. 2016, 287, 47–53. [Google Scholar] [CrossRef]
- Hansen, K.H.; Angelidaki, I.; Ahring, B.K. Improving thermophilic anaerobic digestion of swine manure. Water Res. 1999, 33, 1805–1810. [Google Scholar] [CrossRef]
- Ullah, S.; Rahman, A.U.; Ullah, F.; Rashid, A.; Arshad, T.; Viglašová, E.; Galamboš, M.; Mahmoodi, N.M.; Ullah, H. Adsorption of Malachite Green Dye onto Mesoporous Natural Inorganic Clays: Their Equilibrium Isotherm and Kinetics Studies. Water 2021, 13, 965. [Google Scholar] [CrossRef]
- Zhao, Z.; Cui, X.; Ma, J.; Li, R. Adsorption of carbon dioxide on alkali-modified zeolite 13× adsorbents. Int. J. Greenh. Gas Control 2007, 1, 355–359. [Google Scholar] [CrossRef]
- Kalamaras, S.D.; Vitoulis, G.; Christou, M.L.; Sfetsas, T.; Tziakas, S.; Fragos, V.; Samaras, P.; Kotsopoulos, T.A. The Effect of Ammonia Toxicity on Methane Production of a Full-Scale Biogas Plant—An Estimation Method. Energies 2021, 14, 5031. [Google Scholar] [CrossRef]
- Kotsopoulos, T.; Karamanlis, X.; Dotas, D.; Martzopoulos, G. The impact of different natural zeolite concentrations on the methane production in thermophilic anaerobic digestion of pig waste. Biosyst. Eng. 2008, 99, 105–111. [Google Scholar] [CrossRef]
- Kalamaras, S.D.; Vasileiadis, S.; Karas, P.; Angelidaki, I.; Kotsopoulos, T.A. Microbial adaptation to high ammonia concentrations during anaerobic digestion of manure-based feedstock: Biomethanation and 16S rRNA gene sequencing. J. Chem. Technol. Biotechnol. 2020, 95, 1970–1979. [Google Scholar] [CrossRef]
- Siles, J.A.; Brekelmans, J.; Martín, M.A.; Chica, A.F.; Martín, A. Impact of ammonia and sulphate concentration on thermophilic anaerobic digestion. Bioresour. Technol. 2010, 101, 9040–9048. [Google Scholar] [CrossRef] [PubMed]
- Rice, E.W.; Baird, R.B.; Eaton, A.D. Standard Methods for the Examination of Water and Wastewater, 23rd ed.; American Public Health Association, American Water Works Association, Water Environment Federation: Washington, DC, USA, 2017; Volume 1. [Google Scholar]
- Toothaker, L.E. Multiple Comparison Procedures; Sage Publications, Inc.: Newbury Park, CA, USA, 1993. [Google Scholar]
- Suzuki, T.; Okuhara, T. Change in pore structure of MFI zeolite by treatment with NaOH aqueous solution. Microporous Mesoporous Mater. 2001, 43, 83–89. [Google Scholar] [CrossRef]
- Ates, A.; Akgül, G. Modification of natural zeolite with NaOH for removal of manganese in drinking water. Powder Technol. 2016, 287, 285–291. [Google Scholar] [CrossRef]
- Esquivel, D.; Cruz-Cabeza, A.J.; Jiménez-Sanchidrián, C.; Romero-Salguero, F.J. Local environment and acidity in alkaline and alkaline-earth exchanged β zeolite: Structural analysis and catalytic properties. Microporous Mesoporous Mater. 2011, 142, 672–679. [Google Scholar] [CrossRef]
- Ruiz, R.; Blanco, C.; Pesquera, C.; González, F.; Benito, I.; López, J.L. Zeolitization of a bentonite and its application to the removal of ammonium ion from waste water. Appl. Clay Sci. 1997, 12, 73–83. [Google Scholar] [CrossRef]
- Gates, W.; Bouazza, A. Bentonite transformations in strongly alkaline solutions. Geotext. Geomembr. 2010, 28, 219–225. [Google Scholar] [CrossRef]
- Fotidis, I.A.; Kougias, P.G.; Zaganas, I.D.; Kotsopoulos, T.A.; Martzopoulos, G.G. Inoculum and zeolite synergistic effect on anaerobic digestion of poultry manure. Environ. Technol. 2014, 35, 1219–1225. [Google Scholar] [CrossRef]
- Fotidis, I.A.; Karakashev, D.; Angelidaki, I. Bioaugmentation with an acetate-oxidising consortium as a tool to tackle ammonia inhibition of anaerobic digestion. Bioresour. Technol. 2013, 146, 57–62. [Google Scholar] [CrossRef]
- Yan, M.; Fotidis, I.A.; Tian, H.; Khoshnevisan, B.; Treu, L.; Tsapekos, P.; Angelidaki, I. Acclimatization contributes to stable anaerobic digestion of organic fraction of municipal solid waste under extreme ammonia levels: Focusing on microbial com-munity dynamics. Bioresour. Technol. 2019, 286, 121376. [Google Scholar] [CrossRef]
- Tada, C.; Yang, Y.; Hanaoka, T.; Sonoda, A.; Ooi, K.; Sawayama, S. Effect of natural zeolite on methane production for anaerobic digestion of ammonium rich organic sludge. Bioresour. Technol. 2005, 96, 459–464. [Google Scholar] [CrossRef]
- Montalvo, S.; Díaz, F.; Guerrero, L.; Sánchez, E.; Borja, R. Effect of particle size and doses of zeolite addition on anaerobic digestion processes of synthetic and piggery wastes. Process Biochem. 2005, 40, 1475–1481. [Google Scholar] [CrossRef]
- Milán, Z.; Sánchez, E.; Weiland, P.; Borja, R.; Martín, A.; Ilangovan, K. Influence of different natural zeolite concentrations on the anaerobic digestion of piggery waste. Bioresour. Technol. 2001, 80, 37–43. [Google Scholar] [CrossRef] [PubMed]
- Dar, S.A.; Kleerebezem, R.; Stams, A.J.M.; Kuenen, J.G.; Muyzer, G. Competition and coexistence of sulfate-reducing bacteria, acetogens and methanogens in a lab-scale anaerobic bioreactor as affected by changing substrate to sulfate ratio. Appl. Microbiol. Biotechnol. 2008, 78, 1045–1055. [Google Scholar] [CrossRef]
- Lackner, N.; Wagner, A.O.; Illmer, P. Effect of sulfate addition on carbon flow and microbial community composition during thermophilic digestion of cellulose. Appl. Microbiol. Biotechnol. 2020, 104, 4605–4615. [Google Scholar] [CrossRef]
- Alex Kibangou, V.; Lilly, M.; Mpofu, A.B.; de Jonge, N.; Oyekola, O.O.; Welz, P.J. Sulfate-reducing and methanogenic microbial community responses during anaerobic digestion of tannery effluent. Bioresour. Technol. 2022, 347, 126308. [Google Scholar] [CrossRef] [PubMed]
- Kugelman, I.J.; McCarty, P.L. Cation Toxicity and Stimulation in Anaerobic Waste Treatment. J. Water Pollut. Control Fed. 1965, 37, 97–116. [Google Scholar]
- Valença, R.B.; Santos, L.A.D.; Firmo, A.L.B.; Silva, L.C.S.D.; Lucena, T.V.D.; Santos, A.F.D.M.S.; Jucá, J.F.T. Influence of sodium bicarbonate (NaHCO3) on the methane generation potential of organic food waste. J. Clean. Prod. 2021, 317, 128390. [Google Scholar] [CrossRef]
- Deheri, C.; Acharya, S.K. Effect of calcium peroxide and sodium hydroxide on hydrogen and methane generation during the co-digestion of food waste and cow dung. J. Clean. Prod. 2021, 279, 123901. [Google Scholar] [CrossRef]
- Zhang, Y.; Li, L.; Kong, X.; Zhen, F.; Wang, Z.; Sun, Y.; Dong, P.; Lv, P. Inhibition Effect of Sodium Concentrations on the Anaerobic Digestion Performance of Sargassum Species. Energy Fuels 2017, 31, 7101–7109. [Google Scholar] [CrossRef]
- Lee, J.; Hwang, S. Single and combined inhibition of Methanosaeta concilii by ammonia, sodium ion and hydrogen sulfide. Bioresour. Technol. 2019, 281, 401–411. [Google Scholar] [CrossRef] [PubMed]
- Yuan, Y.; Cheng, H.; Chen, F.; Zhang, Y.; Xu, X.; Huang, C.; Chen, C.; Liu, W.; Ding, C.; Li, Z.; et al. Enhanced methane production by alleviating sulfide inhibition with a microbial electrolysis coupled anaerobic digestion reactor. Environ. Int. 2020, 136, 105503. [Google Scholar] [CrossRef] [PubMed]
- Tao, Y.; Kanoh, H.; Abrams, L.; Kaneko, K. Mesopore-Modified Zeolites: Preparation, Characterization, and Applications. Chem. Rev. 2006, 106, 896–910. [Google Scholar] [CrossRef] [PubMed]
- Christou, M.L.; Vasileiadis, S.; Kalamaras, S.D.; Karpouzas, D.G.; Angelidaki, I.; Kotsopoulos, T.A. Ammonia-induced inhibition of manure-based continuous biomethanation process under different organic loading rates and associated microbial community dynamics. Bioresour. Technol. 2021, 320, 124323. [Google Scholar] [CrossRef] [PubMed]


| Constituents | Adsorbents | |
|---|---|---|
| Bentonite | Zeolite 13X | |
| O | 47.15 | 46.3 |
| Si | 28.15 | 22.28 |
| Al | 11.45 | 18.44 |
| Fe | 3.325 | N.D. ** |
| Cu | 2.025 | N.D. ** |
| Na | 2.425 | 12.9 |
| Mg | 2.275 | N.D. ** |
| K | 0.775 | 0.08 |
| Ca | 2.425 | N.D. ** |
| Treatment | Bentonite | Zeolite 13X |
|---|---|---|
| None | Be | 13X |
| Alkali, 0.2 M NaOH solution | No Treatment | 13X02 |
| Alkali, 1 M NaOH solution | Be1 | 13X1 |
| First Set | Second Set | |||
|---|---|---|---|---|
| Parameter | Inoculum (Mean ± SD *) | Substrate (Mean ± SD *) | Inoculum (Mean ± SD *) | Substrate (Mean ± SD *) |
| Total Solids, TS (g L−1) | 22.79 ± 3.31 | 64.99 ± 5.26 | 34.06 ± 2.01 | 65.24 ± 4.53 |
| Volatile Solids, VS (g L−1) | 14.56 ± 1.73 | 56.75 ± 2.82 | 25.03 ± 1.68 | 58.31 ± 3.52 |
| Total Ammonia Nitrogen, TAN (mg N L−1) | 1040 ± 11.65 | 1800 ± 45.84 | 1680 ± 25.78 | 1960 ± 31.55 |
| Volatile Fatty Acids, VFA (g L−1) | 1.83 ± 0.06 | 39.94 ± 0.74 | 2.63 ± 0.08 | 46.58 ± 0.95 |
| Total Sulfur, TSf (mg kg−1) | 75.58 ± 1.94 | 83.59 ± 5.11 | 82.80 ± 2.34 | 86.00 ± 3.59 |
| pH | 7.63 ± 0.08 | 7.71 ± 0.05 | 7.75 ± 0.06 | 7.84 ± 0.03 |
| Treatment | Additive (g/Reactor) | Inoculum (g VS/Reactor) | Substrate (g VS/Reactor) | TAN (mg L−1) |
|---|---|---|---|---|
| PBe | 1.2 | 1 | 1 | 4500 |
| PBe1 | 1.2 | 1 | 1 | 4500 |
| P13X | 1.2 | 1 | 1 | 4500 |
| P13X02 | 1.2 | 1 | 1 | 4500 |
| P13X1 | 1.2 | 1 | 1 | 4500 |
| PCNH3 | 0 | 1 | 1 | 4500 |
| PC0 | 0 | 1 | 1 | 910 |
| PBlank | 0 | 1 | 0 | 693 |
| Treatment | Additive (g/Reactor) | Inoculum (g VS/Reactor) | Substrate (g VS/reactor) | TAN (mg L−1) | SO42− (mg L−1) |
|---|---|---|---|---|---|
| Be | 1.2 | 1 | 1 | 3500 | 2270 |
| Be1 | 1.2 | 1 | 1 | 3500 | 2270 |
| 13X | 1.2 | 1 | 1 | 3500 | 2270 |
| 13X02 | 1.2 | 1 | 1 | 3500 | 2270 |
| 13X1 | 1.2 | 1 | 1 | 3500 | 2270 |
| CNH3-SO4 | 0 | 1 | 1 | 3500 | 2270 |
| CNH3 | 0 | 1 | 1 | 3500 | N.D. * |
| CSO4 | 0 | 1 | 1 | 680 | 2270 |
| C0 | 0 | 1 | 1 | 680 | N.D. * |
| Blank | 0 | 1 | 0 | 450 | N.D. * |
| Property | Be | Be1 | 13X | 13X02 | 13X1 |
|---|---|---|---|---|---|
| NH3 Adsorption Capacity (mg g−1) | 10.9 | 23.25 | 34.076 | 31.53 | 28.97 |
| SO4−2 Adsorption Capacity (mg g−1) | 38.51 | 28.14 | 53.32 | 28.14 | 1.48 |
| BET specific surface (m2 g−1) | 52 | 13 | 688 | 969 | 110 |
| Micropore volume (mL g−1) | N.D. * | N.D. * | 0.35 | 0.485 | 0.036 |
| Mesopore volume (mL g−1) | 0.150 | 0.086 | N.D. * | N.D. * | 0.340 |
| Treatment | pH (Mean ± SD *) |
|---|---|
| PBe | 7.74 ± 0.20 |
| PBe1 | 7.81 ± 0.13 |
| P13X | 7.64 ± 0.21 |
| P13X02 | 7.39 ± 0.28 |
| P13X1 | 7.22 ± 0.22 |
| PCNH3 | 7.23 ± 0.42 |
| PC0 | 7.75 ± 0.32 |
| Treatment | pH (Mean ± SD *) |
|---|---|
| C0 | 7.82 ± 0.45 |
| CNH3 | 7.61 ± 0.36 |
| CSO4 | 7.42 ± 0.20 |
| CNH3-SO4 | 7.36 ± 0.62 |
| Treatment | pH (Mean ± SD *) |
|---|---|
| Be | 7.53 ± 0.60 |
| Be1 | 7.64 ± 0.35 |
| 13X | 7.76 ± 0.31 |
| 13X02 | 7.69 ± 0.47 |
| 13X1 | 7.81 ± 0.13 |
| CNH3-SO4 | 7.36 ± 0.62 |
Disclaimer/Publisher’s Note: The statements, opinions and data contained in all publications are solely those of the individual author(s) and contributor(s) and not of MDPI and/or the editor(s). MDPI and/or the editor(s) disclaim responsibility for any injury to people or property resulting from any ideas, methods, instructions or products referred to in the content. |
© 2023 by the authors. Licensee MDPI, Basel, Switzerland. This article is an open access article distributed under the terms and conditions of the Creative Commons Attribution (CC BY) license (https://creativecommons.org/licenses/by/4.0/).
Share and Cite
Tzenos, C.A.; Kalamaras, S.D.; Economou, E.-A.; Romanos, G.E.; Veziri, C.M.; Mitsopoulos, A.; Menexes, G.C.; Sfetsas, T.; Kotsopoulos, T.A. The Multifunctional Effect of Porous Additives on the Alleviation of Ammonia and Sulfate Co-Inhibition in Anaerobic Digestion. Sustainability 2023, 15, 9994. https://doi.org/10.3390/su15139994
Tzenos CA, Kalamaras SD, Economou E-A, Romanos GE, Veziri CM, Mitsopoulos A, Menexes GC, Sfetsas T, Kotsopoulos TA. The Multifunctional Effect of Porous Additives on the Alleviation of Ammonia and Sulfate Co-Inhibition in Anaerobic Digestion. Sustainability. 2023; 15(13):9994. https://doi.org/10.3390/su15139994
Chicago/Turabian StyleTzenos, Christos A., Sotirios D. Kalamaras, Eleni-Anna Economou, George Em. Romanos, Charitomeni M. Veziri, Anastasios Mitsopoulos, Georgios C. Menexes, Themistoklis Sfetsas, and Thomas A. Kotsopoulos. 2023. "The Multifunctional Effect of Porous Additives on the Alleviation of Ammonia and Sulfate Co-Inhibition in Anaerobic Digestion" Sustainability 15, no. 13: 9994. https://doi.org/10.3390/su15139994
APA StyleTzenos, C. A., Kalamaras, S. D., Economou, E.-A., Romanos, G. E., Veziri, C. M., Mitsopoulos, A., Menexes, G. C., Sfetsas, T., & Kotsopoulos, T. A. (2023). The Multifunctional Effect of Porous Additives on the Alleviation of Ammonia and Sulfate Co-Inhibition in Anaerobic Digestion. Sustainability, 15(13), 9994. https://doi.org/10.3390/su15139994