Abstract
Using a new systematic method based on text mining and econometric analysis, this paper performs an empirical analysis on the text data and panel data of 195 enterprises in China’s 23 manufacturing sub-sectors from 2011 to 2020, constructs the evaluation index system of sustainable development ability (SDA) of manufacturing enterprises and then uses the non-parametric Mann–Whitney–Wilcoxon tests of inter-group means and the polynomial Logit regression clustering to comparatively analyze the impacts of pure manufacturing (P-), servitization (S-), digitalization (D-) and digital servitization (DS-) paths on the SDA of manufacturing enterprises. The results show that, in terms of profitability as well as each social and environmental dimension, the S-, D- and DS-paths are better choices than the P-path, while, in terms of production ability, debt-paying ability and development ability, there may be “digitalization paradox” or “digital servitization paradox”, but no evidence of “servitization paradox” is found. According to the research results, enterprises should comprehensively evaluate their internal and external conditions, deeply understand the prerequisites and requirements of each development path, actively predict and respond to the risks and challenges they face, be fully prepared and maintain a cautious attitude.
1. Introduction
With the increasing trend of global product homogenization and the rapid rise of service economy and digital economy, traditional product manufacturing enterprises’ economic value creation space has been constantly compressed. Meanwhile, the increasingly prominent social and environmental pressures faced by manufacturing enterprises also pose serious challenges to their sustainable development ability (SDA). Empathic service provision and emerging digital technology application are increasingly becoming path choices for the transformation and upgrading of more and more manufacturing enterprises because they can effectively meet the diverse demands of customers, significantly enhance flexibility, create new profit growth points and bring more social and environmental benefits [1]. Currently, facing fierce competition and a rapidly changing market environment brought about by the new technological revolution, as well as the profound impacts of the COVID-19 on the global manufacturing industry, it is urgent to encourage Chinese manufacturing enterprises to optimize and upgrade through servitization and digitalization, improve SDA and further leap from the low- and middle-end to the high-end of the global value chain. Most existing research shows that servitization, digitalization and their integration, namely, digital servitization, all have brought positive impacts on the SDA of manufacturing enterprises [2,3,4]. However, extensive research shows that manufacturing enterprises under the servitization (S-), digitalization (D-) and digital servitization (DS-) paths may face a “paradox” [5,6]. At present, research on the relationship between the pure manufacturing (P-), S-, D- and DS-paths and the SDA of manufacturing enterprises—along with the causes and solutions of this “paradox”—still needs to be further deepened. In particular, there is no comparative research on the impacts of the above four paths on the SDA of manufacturing enterprises. The main reason is the lack of empirical methods that can completely separate the impacts of the four paths. This paper proposes and adopts a new systematic method based on text mining and econometric analysis, so as to make up for this research gap to a certain extent. The method is mainly an improvement and expansion based on the quantitative research of Neely (2008) and Benedettini et al. (2015) [7,8], so that it is both replicable and extensible and can be extended and applied to other industries and situations, as well as web-based analysis systems. Accordingly, this paper further fills the research gap pointed out by Baines et al. (2009) in providing a method to overcome some of the challenges faced by adopting servitization strategy [9] and responds to the initiative of Kolagar et al. (2022) on using different data and methods to conduct quantitative research on digital servitization [10]. On this basis, this paper builds an evaluation index system of the SDA of manufacturing enterprises from three aspects: economic, social and environmental, including ten dimensions: production ability, profitability, debt-paying ability, development ability, responsibility to employees, responsibility to customers, responsibility to society, raw material utilization, energy utilization and environmental protection intensity. Furthermore, it conducts an empirical analysis based on the text data and panel data of 195 enterprises in China’s 23 manufacturing sub-sectors from 2011 to 2020, in order to find and compare the impacts of the P-, S-, D- and DS-paths on the SDA of manufacturing enterprises. Therefore, the research results of this paper may have a certain practical significance for the transformation, upgrading and sustainable development of Chinese manufacturing enterprises.
2. Literature Review and Research Hypotheses
2.1. Servitization Path and SDA of Manufacturing Enterprises
The research on “Servitization” started relatively early. Scholars have defined its concept from different perspectives [11,12,13]. It is generally believed that servitization is a transformation strategy for manufacturing enterprises to create added value by providing services or comprehensive solutions [14]. Nowadays, servitization research is developing in the direction of understanding the complex relationship between enterprise core products and customer-oriented services, along with how they jointly generate added value [15,16]. As for the concept of sustainable development of enterprises, academia has not yet reached a consensus [17,18]. It is generally believed that it contains three pillars: economy, society and environment, known as the Triple Bottom Line (TBL) [18,19]. Currently, “the relationship between servitization and the SDA of manufacturing enterprises” is still a problem that has attracted much attention but remains unsolved [20]. Most scholars believe that servitization can help to realize product differentiation and diversification, improve customer satisfaction and loyalty, form barriers to entry and eliminate competitors, thus creating better and more stable sources of economic income for manufacturing enterprises, improving their social performance by improving employee and customer satisfaction [21] and improving their environmental performance by improving resources, optimizing energy utilization and reducing emissions [20,22], further enhancing their SDA [23,24,25,26]. However, there is still a lot of research proving the existence of the “servitization paradox”, that is, servitization does not always have positive impacts on the development of manufacturing enterprises [27,28]. This makes some servitized enterprises (S-enterprises) return to the P-path in reality and indicates that more knowledge is still needed to further understand the impacts of servitization [14]. According to most research results related to servitization, it seems that S-enterprises should have higher SDA than pure manufacturing enterprises (P-enterprises) [20,29,30], and Benedettini et al. (2015) believe that the “servitization paradox” mainly occurs when servitization increases the risks of enterprise demand chain [8]. Therefore, the initial expectation of this paper is that servitization will usually have positive impacts on the SDA (production ability, profitability, debt-paying ability, development ability, responsibility to employees, responsibility to customers, responsibility to society, raw material utilization, energy utilization and environmental protection intensity) of manufacturing enterprises. Thus, the following research hypotheses are proposed:
H1(1a/1b/1c/1d/1e/1f/1g/1h/1i/1j): S-enterprises have higher SDA (production ability/profitability/debt-paying ability/development ability/responsibility to employees/responsibility to customers/responsibility to society/raw material utilization/energy utilization/environmental protection intensity) than P-enterprises.
2.2. Digitalization Path and SDA of Manufacturing Enterprises
“Digitalization” is a relatively new concept, which defines the transformation strategy for enterprises to use digital technologies to carry out business activities and create value, so as to maintain competitiveness in the environment of rapid innovation [31,32]. Chen et al. (2020) point out that the current market environment is characterized by high volatility, uncertainty, complexity and ambiguity (VUCA); the COVID-19 pandemic has put forward higher requirements for manufacturing enterprises’ dynamic ability to adapt to the rapid changes in the external market and technological environment [33]. Luo and Jiang (2020) believe that the internal resource and capacity constraints, as well as the external market uncertainty and technological dynamics, jointly drive manufacturing enterprises to accelerate the process of digitalization [1]. The advantages of digitalization seem to be obvious. The continuous development of digital technologies has created opportunities for manufacturing enterprises to improve efficiency at a lower cost [34]. Kamaladin et al. (2020) point out that digitalization has the functions of value acquisition, transmission and creation [35]. Cenamor et al. (2017) stress that digital technologies have dredged the communication channels of manufacturing enterprises and multiple entities can create greater value through network cooperation [36]. Zhang and Yu (2020) believe that digital technologies have become a new power source for manufacturing enterprises to obtain new value growth points and leap to the high-end of the global value chain [37]. Ghobakhloo (2020) finds that digital technology has a direct impact on the economic sustainability of enterprises, which brings opportunities to achieve social (such as improving social welfare) and environmental (such as improving energy utilization and reducing harmful emissions) sustainability [38]. Broccardo et al. (2023) find that, when digital technologies achieve positive results from a social and environmental perspective, they also improve the economic performance of enterprises [39]. However, in reality, many manufacturing enterprises continually invest in remote diagnosis, data warehouse and various data visualization methods in order to optimize decision-making and operation mode [40], but the evidence that these investments bring about performance growth and SDA improvement is still very limited, which makes people worry about the impacts of digitalization [41,42]. Sjödin et al. (2020) point out that manufacturing enterprises may fall into a “digitalization paradox” due to the spiraling cost, that is, digital technology investments cannot bring higher performance and SDA [43]. Grybauskas et al. (2022) point out that there are still conflicting views in academia when explaining the social impacts of digital technologies [44]. Chen et al. (2021) find that digitalization improves resource and information efficiency, but the increase in resource and energy use, as well as the waste and emissions generated from hardware manufacturing, use and disposal, may impose a burden on the environment [45]. Since most digitalization research shows that digital resources have important strategic value for manufacturing enterprises and the application of digital technologies has brought them the opportunity to improve SDA at a lower cost [46,47], the initial expectation of this paper is that digitalization will usually have positive impacts on the SDA (production ability, profitability, debt-paying ability, development ability, responsibility to employees, responsibility to customers, responsibility to society, raw material utilization, energy utilization and environmental protection intensity) of manufacturing enterprises. Therefore, the following hypotheses are proposed:
H2(2a/2b/2c/2d/2e/2f/2g/2h/2i/2j): Digitalized enterprises (D-enterprises) have higher SDA (production ability/profitability/debt-paying ability/development ability/responsibility to employees/responsibility to customers/responsibility to society/raw material utilization/energy utilization/environmental protection intensity) than P-enterprises.
2.3. Digital Servitization Path and SDA of Manufacturing Enterprises
With the continuous deepening of the research on “servitization” and “digitalization”, their integration, namely, “digital servitization”, has become a new research direction [36] and is currently in the early research stage [48]. Sjödin et al. (2020) define “digital servitization” as the transformation strategy of business processes, abilities and products of manufacturing enterprises and their ecosystem to gradually create, deliver and acquire service value-added brought by a series of digital technologies (such as the Internet of Things, big data, artificial intelligence and cloud computing) [43]. Kohtamäki et al. (2019) point out that digitalization is essentially embedded in servitization, which is transitioning from “products + services” to an integrated system of “products + services + software” [31]. Khin and Ho (2019) believe that “digital servitization” may become an effective way to solve the “servitization paradox” and “digitalization paradox”, and the emergence of digital technologies can effectively alleviate various problems in the process of servitization, especially the provision of digital integrated solutions of “products + services + software”, will effectively promote the process of servitization [49]. Coreynen et al. (2017) point out that servitization is facing the risk of falling into the “servitization paradox” due to the high cost of service innovation, and using digital technologies can collect and analyze customer demand information, optimize product and service delivery process and improve efficiency, thereby expanding profit space and reducing innovation risks [50]. Cenamor et al. (2017) stress that digital technology is a key driver of providing advanced services [36]. Paiola and Gebauer (2020) believe that service innovation based on Internet of Things technology can reduce operating costs, create additional revenue, maintain long-term business relations with customers, improve resource utilization and effectively assess current service delivery risks [51]. Zhang et al. (2020) point out that, with the continuous improvement of servitization level, in-depth customer interaction can enhance customer trust and loyalty and generate a large amount of unstructured tacit knowledge, which is heterogeneous and difficult to imitate, which is the key for enterprises to gain competitive advantage [52]. Therefore, many manufacturing enterprises use big data analysis and other technical means to track and analyze customer behaviors (such as records of purchase, return of goods and brand interactions) [1]. Luo and Jiang (2020) find that digital technologies can enhance the coupling effect between product innovation and service innovation of manufacturing enterprises, avoiding the blindness of service innovation to a certain extent, thus promoting servitization processes [1]. Kohtamäki et al. (2020) point out from the impacts of servitization on digitalization that, according to the logic of digital servitization, servitization is indispensable to create positive performance through digitalization; the adoption of a digitalization strategy by manufacturing enterprises without serviceability is likely to lead to negative returns, namely, the “digitalization paradox” [53]. Jankovic-Zugic et al. (2023) find that the combination of digital technologies and product-related services strengthens the relationships between enterprises in the manufacturing ecosystem and enables them to survive in different environments [54]. However, Parida et al. (2019) believe that the growth opportunities brought by digital technologies are uncertain, even for S-enterprises; many manufacturing enterprises find that there are problems in “switching from selling equipment and services to selling digital solutions” [32]. Kohtamäki et al. (2020) point out that the transition to digital servitization is not easy and the implementation of relevant technologies, practices and business models greatly increases complexity [31]. Sjödin et al. (2020) emphasize that digital servitization brings opportunities and challenges to enterprises; while digital technologies improve quality and efficiency, more advanced solutions and abilities also increase service costs, which require higher entry investments and maintenance costs [43]. In fact, manufacturing enterprises under the DS-path may still find themselves facing a “paradox”, that is, because of the sharp rise in costs, the revenue growth brought by digital services cannot bring higher profits and, thus, cannot enhance SDA. Considering that most digital servitization research believes the interaction and integration of digitalization and servitization has brought positive results to enterprises and may effectively solve “servitization paradox” and “digitalization paradox” [49,50,55,56], the initial expectation of this paper is that, comparing with the P-, S- and D-paths, the DS-path is more conducive to the improvement of SDA (production ability, profitability, debt-paying ability and development ability, responsibility to employees, responsibility to customers, responsibility to society, raw material utilization, energy utilization and environmental protection intensity) of manufacturing enterprises. Therefore, the following research hypotheses are proposed:
H3(3a/3b/3c/3d/3e/3f/3g/3h/3i/3j): Digital servitized enterprises (DS-enterprises) have higher SDA (production ability/profitability/debt-paying ability/development ability/responsibility to employees/responsibility to customers/responsibility to society/raw material utilization/energy utilization/environmental protection intensity) than P-enterprises.
H4(4a/4b/4c/4d/4e/4f/4g/4h/4i/4j): DS-enterprises have higher SDA (production ability/profitability/debt-paying ability/development ability/responsibility to employees/responsibility to customers/responsibility to society/raw material utilization/energy utilization/environmental protection intensity) than S-enterprises.
H5(5a/5b/5c/5d/5e/5f/5g/5h/5i/5j): DS-enterprises have higher SDA (production ability/profitability/debt-paying ability/development ability/responsibility to employees/responsibility to customers/responsibility to society/raw material utilization/energy utilization/environmental protection intensity) than D-enterprises.
3. Methods
Based on the research of Neely (2008) and Benedettini et al. (2015) [7,8], this paper improved and expanded their research methods.
Firstly, Neely’s (2008) classification of “P-enterprises” or “S-enterprises” was expanded to include “P-enterprises”, “S-enterprises”, “D-enterprises” and “DS-enterprises” [7], and the scale effect of enterprises was considered. Neely’s (2008) process of coding company descriptors was also replaced by text mining based on a keyword list [7]. Text mining technology enabled this paper to divide the development paths of manufacturing enterprises into four types: P-path, S-path, D-path and DS-path, laying the foundation for subsequent comparative analysis.
Secondly, a series of non-parametric Mann–Whitney–Wilcoxon (MWW) tests of inter-group means at the enterprise level were used to test the research hypotheses. A commonly used parameter method for comparing and analyzing two independent samples is the t-test. The t-test requires that the data come from the observations of normal distributions with equal variance and that they at least are interval scale measurements. In practical research, it is often difficult to meet the conditions of the t-test. At this point, the non-parametric Mann–Whitney–Wilcoxon (MWW) test of inter-group means is a simple and robust method. It can deal with situations where the measurement of data is not interval scale, when there is no way to know the overall distribution or when the overall distribution is not normal; it does not require strict assumptions to make research conclusions more universal.
Thirdly, the polynomial Logit regression clustering was used to further validate the differences in the SDA of manufacturing enterprises under the P-, S-, D- and DS-paths. There are many existing clustering methods, including K-means algorithm and Gaussian Mixture Model (GMM), and related methods also include Community Detection algorithm. K-means algorithm has the characteristics of reliable theory, simple algorithm and fast rate of convergence, but it is only suitable for clustering numerical data sets with spherical clustering results and cannot cluster two classes with the same mean value (the same cluster center). The GMM is proposed to solve this defect, but its premise is that the data set obeys the Gaussian mixture distribution. The Community Detection algorithm is based on a crucial assumption that the edges in the network are sparse, and there is only one type of node, while the nodes in the clustering analysis network can have multiple attributes and categories. In addition, Community Detection is applied in weakly connected networks, while clustering analysis can be implemented in dense datasets. Therefore, after comparing multiple methods, this paper used the polynomial Logit regression clustering to complete the test. The polynomial Logit regression clustering is an extension of the Logit regression model, which involves changing the loss function to cross entropy loss, and predicting the probability distribution to a multinomial probability distribution to natively support the multi class classification problem.
Fourthly, this paper evaluated the SDA of manufacturing enterprises from three aspects: economic, social and environmental, including ten dimensions: production ability, profitability, debt-paying ability, development ability, responsibility to employees, responsibility to customers, responsibility to society, raw material utilization, energy utilization and environmental protection intensity, so as to evaluate the impacts of the four paths more comprehensively.
Finally, the analysis objects focused on a large number of enterprises in multiple manufacturing sub-sectors in China. Many enterprises in these sub-sectors have shifted from pure manufacturing to providing services or integrated digital solutions. In addition, compared with the cross-sectional data analysis, this paper extracted the text data and panel data of the sample enterprises in 2011–2020, so as to capture the dynamic changes and characteristics of enterprises’ businesses and abilities. In particular, compared with the methods of Neely (2008) and Benedettini et al. (2015) [7,8], the methods of this paper were replicable and extensible and can be extended and applied to other industries and situations, as well as web-based analysis systems.
3.1. Construction of Evaluation Index System of SDA of Manufacturing Enterprises
In order to test the research hypotheses more comprehensively, this paper evaluated the SDA of manufacturing enterprises from three aspects: economic, social and environmental, including ten dimensions: production ability, profitability, debt-paying ability, development ability, responsibility to employees, responsibility to customers, responsibility to society, raw material utilization, energy utilization and environmental protection intensity. It used the per capita operating income of employees, return on equity and profit rate, asset–liability ratio, sustainable growth rate, employee satisfaction, product qualification rate, social contribution rate, raw material input–output rate, energy input–output rate and “three-wastes” treatment compliance rate as the second-level evaluation indicators of the ten dimensions. Thus, the evaluation index system of the SDA of manufacturing enterprises was established (see Table 1). Using ratio indicators in the analysis can standardize the value and make it comparable among enterprises with significantly different scales, without requiring additional control measures.

Table 1.
Evaluation index system of SDA of manufacturing enterprises.
3.2. Data Collection and Sample Distribution
The enterprise data are mainly from the CSMAR database. Using the industry classification by the China Securities Regulatory Commission (CSRC) in 2012, the basic information (company name, industry code, business scope and company history) and financial data (number of employees, operating income, per capita operating income of employees, return on equity, profit rate, asset–liability ratio and sustainable growth rate over the years), social contribution data (employee satisfaction, product qualification rate and social contribution rate over the years) and environmental data (raw material input–output rate, energy input–output rate and “three-wastes” treatment compliance rate over the years) of enterprises in all the manufacturing sub-sectors from 2011 to 2020 were extracted to build the data set required, including variables that Neely (2008) did not consider before [7]. The original sample included 2845 enterprises, of which 195 enterprises had complete economic, financial, employee, social, environmental and other data for the years 2011 to 2020. The industry distribution is shown in Figure 1. Compared with the analysis of the cross-sectional data of sample enterprises in a certain year, this paper extracted the text data and panel data of the sample enterprises over 10 years, so as to make the data more representative and comprehensive, capturing the dynamic changes and characteristics of the enterprises’ business and abilities.
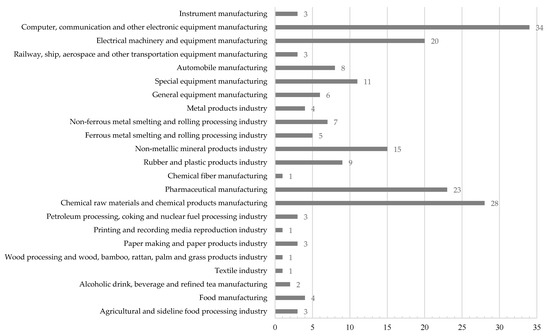
Figure 1.
Industry distribution of sample enterprises.
3.3. Division of Development Paths of Sample Enterprises
The text mining technology was applied to the descriptive text data, such as “the company’s business scope” and “company history” provided in the CSMAR database, so as to divide the development paths of the sample enterprises into P-, S-, D- and DS-. Based on semantics and word families centered on “service” and “digit”, a group of keywords was extracted for manufacturing enterprises under each path (see Table 2). If a keyword was mentioned in the descriptive field related to the enterprise, it was considered as the path feature of the enterprise. Then, based on the hypotheses that manufacturing enterprises under the S- and D-paths have higher SDA than manufacturing enterprises under the P-path, that manufacturing enterprises under the DS-path have higher SDA than manufacturing enterprises under the P-path and that they may have higher SDA than manufacturing enterprises under the S- and D-path, a series of non-parametric Mann–Whitney–Wilcoxon (MWW) tests of inter-group means and polynomial Logit regression clustering at the enterprise level were adopted to reveal the differences among SDA values of manufacturing enterprises under the P-, S-, D- and DS-paths.
Table 2.
Keywords and their frequency.
4. Empirical Analysis
4.1. Descriptive Statistics
The results of development path division show that the most selected path of the sample enterprises is S- (86), followed by DS- (70), P- (33) and D- (6). This result shows that (1) a large number of Chinese manufacturing enterprises have gradually realized the significance of providing “products + services” for the SDA and have embarked on the S-path; (2) most enterprises that adopt a digitalization strategy choose to provide relevant services simultaneously, that is, they have embarked on the DS-path, which to some extent proves the interdependence between digitalization and servitization: digitalization provides technical support for providing advanced services, while servitization brings broader space for the application of digital technologies; (3) only a few enterprises choose the D-path; these enterprises mostly apply digital technologies and equipment in the production process, but do not provide services based on digital technologies; (4) some enterprises still adhere to the P-path; most of these enterprises are manufacturing enterprises of traditional products or low-technology products, or are still unable to carry out servitization and digitalization transformation due to capital and cost constraints. Figure 2 shows the distribution of the sample enterprises’ scales (expressed in operating income in CNY) under the four paths in 2020.
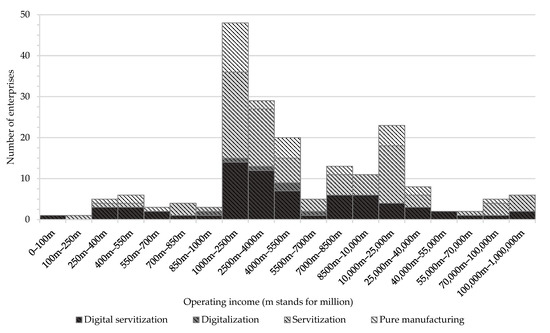
Figure 2.
Scale and development path of manufacturing enterprises in 2020.
It can be seen from Figure 2 that (1) the enterprises that chose the P-path were relatively small in scale, with operating income concentrated in the range of CNY 1 billion to 8.5 billion, while the P-enterprises with relatively large scale (operating income greater than CNY 70 billion) were very few; (2) the six enterprises that chose the D-path were relatively small in scale and their operating income was in the range of CNY 850 million to 7 billion; (3) a large number of enterprises chose the S- or DS-path and their scale distribution was wide. 29% of the S-enterprises had operating income of more than CNY 10 billion, of which 8% had operating income of more than CNY 70 billion, while, for the DS-enterprises, the two figures were 18% and 4%, respectively. Figure 3 shows the SDA (per capita operating income of employees, return on equity, profit rate, asset–liability ratio, sustainable growth rate, employee satisfaction, product qualification rate, social contribution rate, raw material input–output rate, energy input–output rate and “three-wastes” treatment compliance rate) of manufacturing enterprises under the four paths.
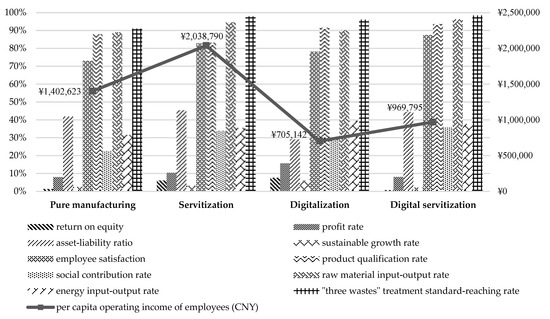
Figure 3.
Comparison of SDA of manufacturing enterprises under the four paths.
It can be seen from Figure 3 that (1) for production ability expressed by per capita operating income of employees, S-enterprises were the highest, followed by P-, DS- and D-enterprises, indicating that there seems to be “digitalization paradox” and “digital servitization paradox” in terms of production ability; (2) for profitability expressed by return on equity, D-enterprises were the highest, followed by S-enterprises, and P-enterprises were slightly higher than DS-enterprises; (3) for profitability expressed by profit rate, D-, S- and DS-enterprises were in the top three, higher than P-enterprises, and DS-enterprises were close to P-enterprises; (4) for debt-paying ability expressed by asset–liability ratio, S-enterprises were slightly higher than DS-enterprises, followed by P- and D-enterprises, indicating that there also seems to be a “digitalization paradox” in terms of debt-paying ability; (5) for development ability expressed by sustainable growth rate, D-enterprises were the highest, followed by S- and P-enterprises, and DS-enterprises were the lowest, indicating that there also seems to be a “digital servitization paradox” in terms of development ability; (6) for responsibility to employees expressed by employee satisfaction, DS-enterprises were the highest, followed by S- and D-enterprises, all of which were higher than P-enterprises; (7) for responsibility to customers expressed by product qualification rate, DS-enterprises were higher than D-enterprises, followed by P-enterprises, and S-enterprises were the lowest; (8) for responsibility to society expressed by social contribution rate, DS-enterprises were slightly higher than S-enterprises, followed by D-enterprises, and P-enterprises were the lowest; (9) for raw material utilization expressed by raw material input–output rate, DS-enterprises were the highest, followed by S-enterprises, and D-enterprises were slightly higher than P-enterprises; (10) for energy utilization expressed by energy input–output rate, D-enterprises were the highest, followed by DS-, S- and P- enterprises; (11) for environmental protection intensity expressed by “three-wastes” treatment compliance rate, DS-enterprises were slightly higher than S-enterprises, followed by D-enterprises, all of which were higher than P-enterprises.
4.2. Non-Parametric Mann–Whitney–Wilcoxon (MWW) Test
A series of non-parametric Mann–Whitney–Wilcoxon (MWW) tests of inter-group means were used to test the degree of difference between the data shown in Figure 3. The test results are shown in Table 3 (a–k).
Table 3.
Mann–Whitney–Wilcoxon test results (non-parametric comparison of inter-group means).
The results of the non-parametric test show that (1) S-enterprises have no significant difference with P-enterprises in terms of per capita operating income of employees and social contribution rate and are lower than P-enterprises for product qualification rate, but are higher than P-enterprises for the other eight indicators; (2) there is no significant difference between D-enterprises and P-enterprises in terms of return on equity; D-enterprises are higher than P-enterprises for profit rate, sustainable growth rate and all social and environmental indicators, but lower for per capita operating income of employees and asset–liability ratio, indicating that there may be a “digitalization paradox” in terms of production ability and debt-paying ability; (3) there is no significant difference between DS-enterprises and P-enterprises in terms of asset–liability ratio; DS-enterprises are higher than P-enterprises for profit rate and all the social and environmental indicators, but lower for per capita operating income of employees, return on equity and sustainable growth rate, indicating that there may be a “digital servitization paradox” in terms of production ability, profitability and development ability; (4) there is no significant difference between S-enterprises and D-enterprises in terms of return on equity, sustainable growth rate and “three-wastes” treatment compliance rate; S-enterprises are higher than D-enterprises for per capita operating income of employees, asset–liability ratio, employee satisfaction and raw material input–output rate, but lower for profit rate, product qualification rate and energy input–output rate; (5) S-enterprises have no significant difference with DS-enterprises for profit rate, asset–liability ratio and sustainable growth rate; S-enterprises are higher than DS-enterprises for per capita operating income of employees and return on equity, but lower for all the social and environmental indicators; (6) there is no significant difference between D-enterprises and DS-enterprises in terms of return on equity, sustainable growth rate, energy input–output rate and “three-wastes” treatment compliance rate; D-enterprises are higher than DS-enterprises for profit rate, but lower for the other six indicators.
4.3. Polynomial Logit Regression Cluster Analysis
Among the comparative variables, profit rate is often one of the most important indicators that can directly reflect the profitability of enterprises. Therefore, this paper took profit rate as the dependent variable and used polynomial Logit regression clustering to further compare and test the differences between S-, D-, DS- and P-enterprises (P- as the benchmark category) (see Table 4). The results show that S-, D- and DS-enterprises are better than P-enterprises in terms of profitability represented by profit rate, further confirming the above research results.
Table 4.
Polynomial Logit regression clustering at enterprise level.
The above analysis results generally support H1, i.e., S-enterprises have higher SDA than P-enterprises. Specifically, H1b, H1c, H1d, H1e, H1g, H1h, H1i and H1j are supported. However, in terms of responsibility to customers, S-enterprises’ product qualification rate is lower than P-enterprises (H1f is not supported). In addition, there is no significant difference between S- and P-enterprises in terms of production ability (H1a is not supported). As for the D-path, H2 is partially supported. Specifically, H2b and H2d are supported, but there is a “digitalization paradox” in terms of production ability and debt-paying ability (H2a and H2c are not supported). In addition, in terms of the social and environmental indicators, D-enterprises are superior to P-enterprises (H2e–j are supported). Moreover, compared with S-enterprises, D-enterprises are at a disadvantage in terms of productivity, debt-paying ability, responsibility to employees and raw material utilization, but have stronger profitability, responsibility to customers and energy utilization. As for the DS-path, H3, H4 and H5 are partially supported. Specifically, H3b is supported, but there is a “digital servitization paradox” in terms of production ability and development ability (H3a and H3d are not supported). For debt-paying ability, there is no significant difference between DS-enterprises and P-enterprises (H3c is not supported), while, for all the social and environmental indicators, DS-enterprises are superior to P-enterprises (H3e–j are supported); The production ability and profitability of DS-enterprises are lower than those of S-enterprises (H4a and H4b are not supported) and, in terms of debt-paying ability and development ability, DS- and S-enterprises do not show significant differences (H4c and H4d are not supported). In terms of the social and environmental indicators, DS-enterprises are superior to S-enterprises (H4e–j are supported); the profitability of DS-enterprises is lower than that of D-enterprises (H5b is not supported) and there is no significant difference in development ability, energy utilization or environmental protection intensity between DS-enterprises and D-enterprises (H5d, H5i and H5j are not supported). However, in the other six evaluation dimensions, DS-enterprises are superior to D-enterprises (H5a, H5c, H5e, H5f, H5g and H5h are supported).
5. Conclusions and Prospects
The empirical analysis results show that, for Chinese manufacturing enterprises, servitization has become a mainstream development trend and is gradually becoming mature. More manufacturing enterprises (about 44%) choose to provide related services or comprehensive solutions while providing physical products, which is different from the previous research results of some scholars [7]. It seems that the S-path has indeed brought higher production ability and debt-paying ability, as well as considerable profitability and development ability for manufacturing enterprises. S-enterprises have taken on strong responsibilities to employees and to society, but their performance in responsibility to customers is relatively lagging. In terms of environmental protection, S-enterprises have also demonstrated high efficiency and intensity. Meanwhile, a large number of enterprises (about 36%) have begun to explore and apply digital technologies on the basis of servitization and try to provide customers with comprehensive digital solutions, thus initially embarking on the DS-path. These enterprises have shown advantages in terms of the social and environmental indicators. However, in terms of the economic indicators, the DS-path seems to have not yet been able to bring the expected results. At present, only a few manufacturing enterprises (about 3%) choose the D-path. These enterprises have weak production ability and debt-paying ability, but show strong profitability and development ability. At the same time, the application of digital technologies has enabled these enterprises to demonstrate certain advantages in terms of the social and environmental indicators. In general, servitization, digitalization and digital servitization are not simple concepts that can be rapidly adopted in different industry backgrounds and enterprise situations, but are complex long-term processes. Enterprises are required to fully understand the preconditions of each path in advance, actively predict and respond to the risks and challenges they face and be fully prepared. If enterprises do not have sufficient abilities, they should maintain a cautious attitude. This is also one of the reasons why some enterprises (about 17%) still adhere to the P-path.
This paper does not find strong evidence of a “servitization paradox”. The test results of H1 show that S-enterprises have no significant difference from P-enterprises in terms of production ability and are lower than P-enterprises in terms of responsibility to customers, while outperforming P-enterprises in the other eight dimensions of SDA. This seems to be inconsistent with a large number of previous research results concerning the “servitization paradox” [27,28], which to some extent indicates that Chinese manufacturing enterprises have achieved successful exploration on the S-path and have accumulated a certain amount of successful experience, i.e., the servitization transformation strategy has begun to bear fruit. The economic, social and environmental returns of the initial investment have begun to fully manifest and the S-path is gradually becoming mature. This also further proves the practical feasibility of the S-path in China, enabling more manufacturing enterprises to embark on the S-path. However, this conclusion is only applicable to the sample enterprises as a whole, which does not mean the “servitization paradox” has been effectively resolved. For each individual enterprise, the major correction challenges and multiple risks that servitization may bring may still make it fall into a “paradox” [57], which is another reason why some enterprises still adhere to the P-path.
The test results of H2 show that D-enterprises are superior to P-enterprises for profitability, development ability and all social and environmental indicators, but there is a “digitalization paradox” in terms of production ability and debt-paying ability. Compared with the S-path, the D-path is at a disadvantage in terms of production ability, debt-paying ability, responsibility to employees and raw material utilization, but has stronger profitability, responsibility to customers and energy utilization. For the above results, the possible explanation is that the P- and S-paths appeared before the D-path, meaning they are relatively mature for Chinese manufacturing enterprises. Most enterprises have formed a relatively complete and stable production and service operation mode. For many manufacturing enterprises, the application of emerging digital technologies is still in the exploration stage and has not yet been able to effectively integrate with the original production and operation system. Furthermore, it may bring high organizational change costs and risks, such as the need for employees to adapt to new office processes, which may lead to dissatisfaction among some employees. However, the application of these emerging digital technologies can meet the diversified needs of customers to a large extent and bring new consumer experiences to customers, improving product quality and energy utilization efficiency, thus having greater profit space and sustainable development potential.
For H3, the test results show that DS-enterprises are only slightly higher than P-enterprises in terms of profit rate, while they are faced with a “digital servitization paradox” in terms of production ability and development ability. In terms of all the social and environmental indicators, DS-enterprises are higher than P-enterprises. The test results of H4 show that DS-enterprises are lower than S-enterprises in terms of production ability and profitability, but are higher in all the social and environmental indicators. The test results of H5 show that DS-enterprises are higher than D-enterprises in terms of productivity, debt-paying ability, responsibility to employees, responsibility to customers, raw material utilization and energy utilization, but lower than them in terms of profitability. For the above results, the possible explanation is that, compared with the D-path, the interactive integration of digitalization and servitization is more conducive to the practical application and transformation of digital technologies into real productivity [58], while also improving organizational flexibility, making it easier to gain recognition from employees and customers, as well as saving raw materials and energy. Compared with the P- and S-paths, the combination of digital technologies and related services and the provision of integrated digital solutions are more conducive to social and environmental sustainability. However, the DS-path is still in the early stage of exploration in China. The simultaneous implementation of digitalization and servitization—and the effective integration of the two—have brought new requirements, unprecedented challenges and unknown risks to manufacturing enterprises, including significantly increased initial investments, human costs, management difficulties and additional resources. The smooth implementation of digital servitization requires the transformation of various aspects inside and outside the enterprise, such as organizational structure, corporate culture, resource allocation, operation mode and the relationship with internal and external stakeholders. All these lead to multiple potential risks brought by uncertainty and complexity in the transformation process. In addition, the success of digital servitization also depends on uncontrollable factors, such as the industrial environment and even the global economic and financial environment. Therefore, manufacturing enterprises that choose the DS-path should not be overly optimistic about the initial gain, but should remain cautious and seriously consider the possibility of overcoming difficulties and bottlenecks through their own abilities and potential. If enterprises do not have sufficient confidence in their own abilities, digital servitization should be suspended until they obtain sufficient abilities, because digitalization and servitization are both processes of continuous improvement of enterprise abilities.
Future research can be carried out from the following aspects: First, further studying the interaction and integration relationship between digitalization and servitization, and conducting empirical tests in different situations. Second, finding out the types of risks faced by enterprises under the different paths and their countermeasures. Third, exploring other ways to create and obtain value through digital technologies, in addition to complementing production and services. Fourth, in-depth study of the impacts of scale effect on enterprises under the different paths, to complement the conclusion of existing research that the “servitization paradox” is mainly applicable to large manufacturing enterprises [7] and further expand the relevant research on digitalization.
Author Contributions
Conceptualization, J.X. and L.M.; methodology, J.X.; software, J.X.; validation, J.X., L.M. and J.L.; formal analysis, J.X. and J.L.; investigation, J.X. and L.M.; resources, J.X.; data curation, J.X.; writing—original draft preparation, J.X.; writing—review and editing, J.X. and J.L.; visualization, J.X.; supervision, J.X. and L.M.; project administration, J.X.; funding acquisition, J.X. All authors have read and agreed to the published version of the manuscript.
Funding
This research was funded by the Social Science Planning Fund Project of Liaoning Province, grant number L21BGL019.
Institutional Review Board Statement
Not applicable.
Informed Consent Statement
Not applicable.
Data Availability Statement
Data available on request.
Conflicts of Interest
The authors declare no conflict of interest. The funders had no role in the design of the study; in the collection, analyses, or interpretation of data; in the writing of the manuscript; or in the decision to publish the results.
References
- Luo, J.Q.; Jiang, Q.W. The influence of digital technology on product and service innovation: A review and prospects. Sci. Technol. Prog. Pol. 2020, 37, 152–160. [Google Scholar]
- Jang, K.K.; Bae, J.; Kim, K.H. Servitization experience measurement and the effect of servitization experience on brand resonance and customer retention. J. Bus. Res. 2021, 130, 384–397. [Google Scholar] [CrossRef]
- Shen, L.; Sun, C.; Ali, M. Role of servitization, digitalization, and innovation performance in manufacturing enterprises. Sustainability 2021, 13, 9878. [Google Scholar] [CrossRef]
- Hao, Z.R.; Liu, C.G.; Goh, M. Determining the effects of lean production and servitization of manufacturing on sustainable performance. Sustain. Prod. Consum. 2021, 25, 374–389. [Google Scholar] [CrossRef]
- Brax, S.A.; Calabrese, A.; Ghiron, N.L.; Tiburzi, L.; Grnroos, C. Explaining the servitization paradox: A configurational theory and a performance measurement framework. Int. J. Oper. Prod. Manag. 2021, 41, 517–546. [Google Scholar] [CrossRef]
- Hellemans, I.; Porter, A.J.; Diriker, D. Harnessing digitalization for sustainable development: Understanding how interactions on sustainability-oriented digital platforms manage tensions and paradoxes. Bus. Strat. Environ. 2021, 31, 668–683. [Google Scholar] [CrossRef]
- Neely, A. Exploring the financial consequences of the servitization of manufacturing. Oper. Manag. Res. 2008, 1, 103–118. [Google Scholar] [CrossRef]
- Benedettini, O.; Neely, A.; Swink, M. Why do servitized firms fail? A risk-based explanation. Int. J. Oper. Prod. Manag. 2015, 35, 946–979. [Google Scholar] [CrossRef]
- Baines, T.; Lightfoot, H.; Benedettini, O.; Kay, J.M. The servitization of manufacturing: A review of literature and reflection on future challenges. J. Manuf. Technol. Manag. 2009, 20, 547–567. [Google Scholar] [CrossRef]
- Kolagar, M.; Parida, V.; Sjödin, D. Ecosystem transformation for digital servitization: A systematic review, integrative framework, and future research agenda. J. Bus. Res. 2022, 146, 176–200. [Google Scholar] [CrossRef]
- Vandermerwe, S.; Rada, J. Servitization of business: Adding value by adding services. Eur. Manag. J. 1988, 6, 314–324. [Google Scholar] [CrossRef]
- Reiskin, E.D.; White, A.L.; Johnson, J.K.; Votta, T.J. Servicizing the chemical supply chain. J. Ind. Ecol. 1999, 3, 19–31. [Google Scholar] [CrossRef]
- Szalavetz, A. Tertiarization of manufacturing industry in the new economy: Experiences in Hungarian companies. J. Mark. 2003, 134, 54–55. [Google Scholar]
- Kowalkowski, C.; Gebauer, H.; Kamp, B.; Parry, G. Servitization and deservitization: Overview, concepts, and definitions. Ind. Mark. Manag. 2017, 60, 4–10. [Google Scholar] [CrossRef]
- Brax, S.A.; Visintin, F. Meta-model of servitization: The integrative profiling approach. Ind. Mark. Manag. 2017, 60, 17–32. [Google Scholar] [CrossRef]
- Chen, Y.; Wu, Z.J.; Yi, W.C.; Wang, B.J.; Yao, J.H.; Pei, Z.; Chen, J.L. Bibliometric method for manufacturing servitization: A review and future research directions. Sustainability 2022, 14, 8743. [Google Scholar] [CrossRef]
- Schmidt, F.C.; Zanini, R.R.; Korzenowski, A.L.; Schmidt, R.; do Nascimento, K.B.X. Evaluation of sustainability practices in small and medium-sized manufacturing enterprises in southern Brazil. Sustainability 2018, 10, 2460. [Google Scholar] [CrossRef]
- Chang, A.Y.; Cheng, Y.T. Analysis model of the sustainability development of manufacturing small and medium-sized enterprises in Taiwan. J. Clean. Prod. 2018, 207, 458–473. [Google Scholar] [CrossRef]
- Trianni, A.; Cagno, E.; Neri, A.; Howard, M. Measuring industrial sustainability performance: Empirical evidence from Italian and German manufacturing small and medium enterprise. J. Clean. Prod. 2019, 229, 1355–1376. [Google Scholar] [CrossRef]
- Doni, F.; Corvino, A.; Martini, S.B. Servitization and sustainability actions. Evidence from European manufacturing companies. J. Environ. Manag. 2019, 234, 367–378. [Google Scholar] [CrossRef]
- Szasz, L.; Seer, L. Towards an operations strategy model of servitization: The role of sustainability pressure. Oper. Manag. Res. 2018, 11, 51–66. [Google Scholar] [CrossRef]
- Hojnik, J. Ecological modernization through servitization: EU regulatory support for sustainable product-service systems. Rev. Eur. Comp. Int. Environ. 2018, 27, 162–175. [Google Scholar] [CrossRef]
- Baines, T.S.; Bigdeli, A.Z.; Bustinza, O.F.; Shi, V.G.; Baldwin, J.; Ridgway, K. Servitization: Revisiting the state-of-the-art and research priorities. Int. J. Oper. Prod. Manag. 2017, 37, 256–278. [Google Scholar] [CrossRef]
- Story, V.M.; Raddats, C.; Burton, J.; Zolkiewski, J.; Baines, T. Capabilities for advanced services: A multi-actor perspective. Ind. Mark. Manag. 2017, 60, 54–68. [Google Scholar] [CrossRef]
- Kamp, B.; Parry, G. Servitization and advanced business services as levers for competitiveness. Ind. Mark. Manag. 2017, 60, 11–16. [Google Scholar] [CrossRef]
- Crozet, M.; Milet, E. Should everybody be in services? The effect of servitization on manufacturing firm performance. J. Econ. Manag. Strat. 2017, 26, 820–841. [Google Scholar] [CrossRef]
- Visnjic Kastalli, I.; Van Looy, B. Servitization: Disentangling the impact of service business model innovation on manufacturing firm performance. J. Oper. Manag. 2013, 31, 169–180. [Google Scholar] [CrossRef]
- Dmitrijeva, J.; Schroeder, A.; Bigdeli, A.Z.; Baines, T. Paradoxes in servitization: A processual perspective. Ind. Mark. Manag. 2022, 101, 145–152. [Google Scholar] [CrossRef]
- Chang, Y.; Ming, X.G.; Zhang, X.Y.; Zhou, T.T.; Liao, X.Q.; Cao, S.J. Servitization and sustainable value creation strategy for China’s manufacturing industry: A multiple case study in the Belt and Road Initiative. Sustainability 2021, 13, 11334. [Google Scholar] [CrossRef]
- Oyelakin, I.O.; Johl, S.K. Does ISO 14001 and green servitization provide a push factor for sustainable performance? A study of manufacturing firms. Sustainability 2022, 14, 9784. [Google Scholar] [CrossRef]
- Kohtamäki, M.; Parida, V.; Oghazi, P.; Gebauer, H.; Baines, T. Digital servitization business models in ecosystems: A theory of the firm. J. Bus. Res. 2019, 104, 380–392. [Google Scholar] [CrossRef]
- Parida, V.; Sjödin, D.; Reim, W. Leveraging digitalization for advanced service business models: Reflections from a systematic literature review and special issue contributions. Sustainability 2019, 11, 391. [Google Scholar] [CrossRef]
- Chen, J.; Huang, S.; Liu, Y.H. Operations management in the digitalization era: From empowering to enabling. J. Manag. World 2020, 36, 117–128. [Google Scholar]
- Broccardo, L.; Zicari, A.; Jabeen, F.; Bhatti, Z.A. How digitalization supports a sustainable business model: A literature review. Technol. Forecast. Soc. Change 2023, 187, 122146. [Google Scholar] [CrossRef]
- Kamaladin, A.; Linde, L.; Sjödin, D.; Parida, V. Transforming provider-customer relationships in digital servitization: A relational view on digitalization. Ind. Mark. Manag. 2020, 89, 306–325. [Google Scholar] [CrossRef]
- Cenamor, J.; Sjödin, D.; Parida, V. Adopting a platform approach in servitization: Leveraging the value of digitalization. Int. J. Prod. Econ. 2017, 192, 54–65. [Google Scholar] [CrossRef]
- Zhang, Q.; Yu, J.P. Input digitalization and climbing global value chain: Micro evidence from Chinese manufacturing enterprises. Econ. Rev. 2020, 6, 72–89. [Google Scholar]
- Ghobakhloo, M. Industry 4.0, digitization, and opportunities for sustainability. J. Clean. Prod. 2020, 252, 119869. [Google Scholar] [CrossRef]
- Broccardo, L.; Truant, E.; Dana, L.P. The interlink between digitalization, sustainability, and performance: An Italian context. J. Bus. Res. 2023, 158, 113621. [Google Scholar] [CrossRef]
- Wamba, S.F.; Gunasekaran, A.; Akter, S.; Ren, S.J.F.; Dubey, R.; Childe, S.J. Big data analytics and firm performance: Effects of dynamic capabilities. J. Bus. Res. 2017, 70, 356–365. [Google Scholar] [CrossRef]
- Ehret, M.; Wirtz, J. Unlocking value from machines: Business models and the industrial internet of things. J. Mark. Manag. 2017, 33, 111–130. [Google Scholar] [CrossRef]
- Hasselblatt, M.; Huikkola, T.; Kohtamäki, M.; Nickell, D. Modeling manufacturer's capabilities for the internet of things. J. Bus. Ind. Mark. 2018, 33, 822–836. [Google Scholar] [CrossRef]
- Sjödin, D.; Parida, V.; Wincent, J. An agile co-creation process for digital servitization: A micro-service innovation approach. J. Bus. Res. 2020, 112, 478–491. [Google Scholar] [CrossRef]
- Grybauskas, A.; Stefanini, A.; Ghobakhloo, M. Social sustainability in the age of digitalization: A systematic literature review on the social implications of industry 4.0. Technol. Soc. 2022, 70, 101997. [Google Scholar] [CrossRef]
- Chen, X.X.; Despeisse, M.; Johansson, B. Environmental sustainability of digitalization in manufacturing: A review. Sustainability 2021, 12, 10298. [Google Scholar] [CrossRef]
- Triki, R.; Maaloul, M.H.; Bahou, Y.; Kadria, M. The impact of digitization to ensure competitiveness of the Ha’il region to achieve sustainable development goals. Sustainability 2023, 15, 1661. [Google Scholar] [CrossRef]
- Sanders, N.R.; Boone, T.; Ganeshan, R.; Wood, J.D. Sustainable supply chains in the age of AI and digitization: Research challenges and opportunities. J. Bus. Logist. 2019, 40, 229–240. [Google Scholar] [CrossRef]
- Favoretto, C.; Mendes, G.H.S.; Oliveira, M.G.; Cauchick-Miguel, P.A.; Coreynen, W. From servitization to digital servitization: How digitalization transforms companies' transition towards services. Ind. Mark. Manag. 2022, 102, 104–121. [Google Scholar] [CrossRef]
- Khin, S.; Ho, T.C.F. Digital technology, digital capability and organizational performance. Int. J. Inov. Sci. 2019, 11, 177–195. [Google Scholar] [CrossRef]
- Coreynen, W.; Matthyssens, P.; Bockhaven, V.W. Boosting servitization through digitization: Pathways and dynamic resource configurations for manufacturers. Ind. Mark. Manag. 2017, 60, 42–53. [Google Scholar] [CrossRef]
- Paiola, M.; Gebauer, H. Internet of things technologies, digital servitization and business model innovation in BtoB manufacturing firms. Ind. Mark. Manag. 2020, 89, 245–264. [Google Scholar] [CrossRef]
- Zhang, Y.; Gu, Y.D.; Gao, J. Servitization and product innovation: The moderating role of environment uncertainty. Sci. Res. Manag. 2020, 41, 140–150. [Google Scholar]
- Kohtamäki, M.; Parida, V.; Patel, P.C.; Gebauer, H. The relationship between digitalization and servitization: The role of servitization in capturing the financial potential of digitalization. Technol. Forecast. Soc. Change 2020, 151, 119804. [Google Scholar] [CrossRef]
- Jankovic-Zugic, A.; Medic, N.; Pavlovic, M.; Todorovic, T.; Rakic, S. Servitization 4.0 as a trigger for sustainable business: Evidence from automotive digital supply chain. Sustainability 2023, 15, 2217. [Google Scholar] [CrossRef]
- Paiola, M.; Schiavone, F.; Grandinetti, R.; Chen, J. Digital servitization and sustainability through networking: Some evidences from IoT-based business models. J. Bus. Res. 2021, 132, 507–516. [Google Scholar] [CrossRef]
- Schiavone, F.; Leone, D.; Caporuscio, A.; Lan, S. Digital servtization and new sustainable configurations of manufacturing systems. Technol. Forecast. Soc. Change 2022, 176, 121441. [Google Scholar] [CrossRef]
- Benedettini, O.; Swink, M.; Neely, A. Examining the influence of service additions on manufacturing firms' bankruptcy likelihood. Ind. Mark. Manag. 2017, 60, 112–125. [Google Scholar] [CrossRef]
- Sklyar, A.; Kowalkowski, C.; Tronvoll, B.; Sorhammar, D. Organizing for digital servitization: A service ecosystem perspective. J. Bus. Res. 2019, 104, 450–460. [Google Scholar] [CrossRef]


Disclaimer/Publisher’s Note: The statements, opinions and data contained in all publications are solely those of the individual author(s) and contributor(s) and not of MDPI and/or the editor(s). MDPI and/or the editor(s) disclaim responsibility for any injury to people or property resulting from any ideas, methods, instructions or products referred to in the content. |
© 2023 by the authors. Licensee MDPI, Basel, Switzerland. This article is an open access article distributed under the terms and conditions of the Creative Commons Attribution (CC BY) license (https://creativecommons.org/licenses/by/4.0/).