Abstract
Uncontrolled urban expansion with rapid population growth causes great pressure on the urban environment. The index of impervious surface area (ISA) has recently been used for the dynamic monitoring of urban expansion. This paper takes Dar es Salaam, the largest city in Tanzania, as an example, combined with multi-source data to obtain urban impervious surface component data on an annual scale, based on which the spatial–temporal characteristics of the city’s expansion are concluded: first, urban expansion showed an evidently phased pattern, with a steady annual growth rate of 2.9% during 2000–2005, and a low rate of 1.4% during 2006–2010, then a relatively high rate of 3.3% in the period of 2011–2019. Secondly, urban expansion hotspots emerged in areas along the main roads extending from the center to the south and north, but coastal expansion and infilling development became evident after 2015, with the impervious surface significantly increasing in areas with poor traffic. Third, urban land expansion, which lags significantly behind population growth, has eased, as the ratio of population growth rate to land expansion is declining, from 2.9 in the period 2002–2012 to 2.0 in the period 2012–2019. Finally, the influence of population, economy, traffic and nature on the evolution of impervious surfaces are analyzed. This paper puts forward corresponding strategic suggestions for land-use policies and analyzes the trend of urban growth spatiotemporal patterns in the future.
1. Introduction
Sustainable urban development is one of the 2030 Sustainable Development Goals of the United Nations, among others. African cities with large and fast-growing numbers are critical to achieving this goal globally. African cities are undergoing rapid urbanization, which, along with significant social–economic development, is accompanied by uncontrolled urban expansion, inadequate and deteriorating infrastructure, traffic congestion, environmental degradation and an acute housing shortage [1,2,3,4]. To address these challenges and effectively manage the growth of African cities, it is urgent to deepen our understanding of the nature and pattern of these cities’ growths.
Since the 1960s, Sub-Saharan Africa (SSA) has experienced the fastest urban population growth at the lowest level of urbanization in the world, with an annual growth rate of 4.9% during the 1960s–1980s, which fell to 4.1% after the 1990s [5,6,7,8]. A large number of studies in the literature revealed the spatial extension of African cities with population growth in the region through remote sensing and Geographic Information System (GIS) technologies. Some of them were conducted on a global scale. For example, the Atlas of Urban Expansion by the Lincoln Institute of Land Policy contains maps of 200 cities around the world for three time periods, 1990, 2000 and 2014, including more than 30 African cities. Based on the dataset, both the population and built-up areas of these African cities were reported to have increase rapidly, by about 4% and more than 5% per year, respectively [9,10]. Moreover, the changing pattern of urban land densities from the urban center to the periphery was revealed to be different between large, medium and small-sized cities. Patterns in small cities were relatively dispersed compared with the large ones, while African cities on average presented a much less compact pattern than those in Asia, Europe and North America by international comparisons [10]. However, some studies have questioned the comparability of different continents and national urban area expansion data. After interpreting the built-up areas of six different cities in West Africa using remote sensing data from four periods from 1970 to 2010, Adhikari compared the difference between the calculated results with Gong’s data on a global scale [11,12] and inferred that an unclear definition of urban areas, limitations of classification algorithm and errors in training samples accounted for the discrepancies in urban area estimations.
A few studies investigated African cities’ expansions at the city scale to address strategic interventions when planning for sustainable development. Karolien used remote sensing images to analyze the changes in urban built-up areas in Kampala, Uganda in 1989, 1995, 2003 and 2010, and pointed out that cities mainly expand along roads, with an average annual increase of 5.6%, while environmental factors, such as slope, influence expansion distribution [13]. Acheampong found that the annual growth rate of construction land in Kumasi, Ghana was 5.6% in the period between 1986 and 2014 [14]. Similar growth rates were reported in Bamako (5.4%) and Nairobi (5.9%), but in Cairo (2.8%) the growth rate was low [15]. Moreover, mono-centric structures and ribbon development along highways were recognized as discernible spatial structures and forms of African cities [16,17,18]. Urban expansion was pushed forward by an increasing population and economic activities. Because of the concept of growth pole that was adopted in African countries [19], the cities were planned as growth poles to stimulate economic growth in the rural hinterland, which has led to large migration from rural areas to urban areas, and the extreme imbalance in development.
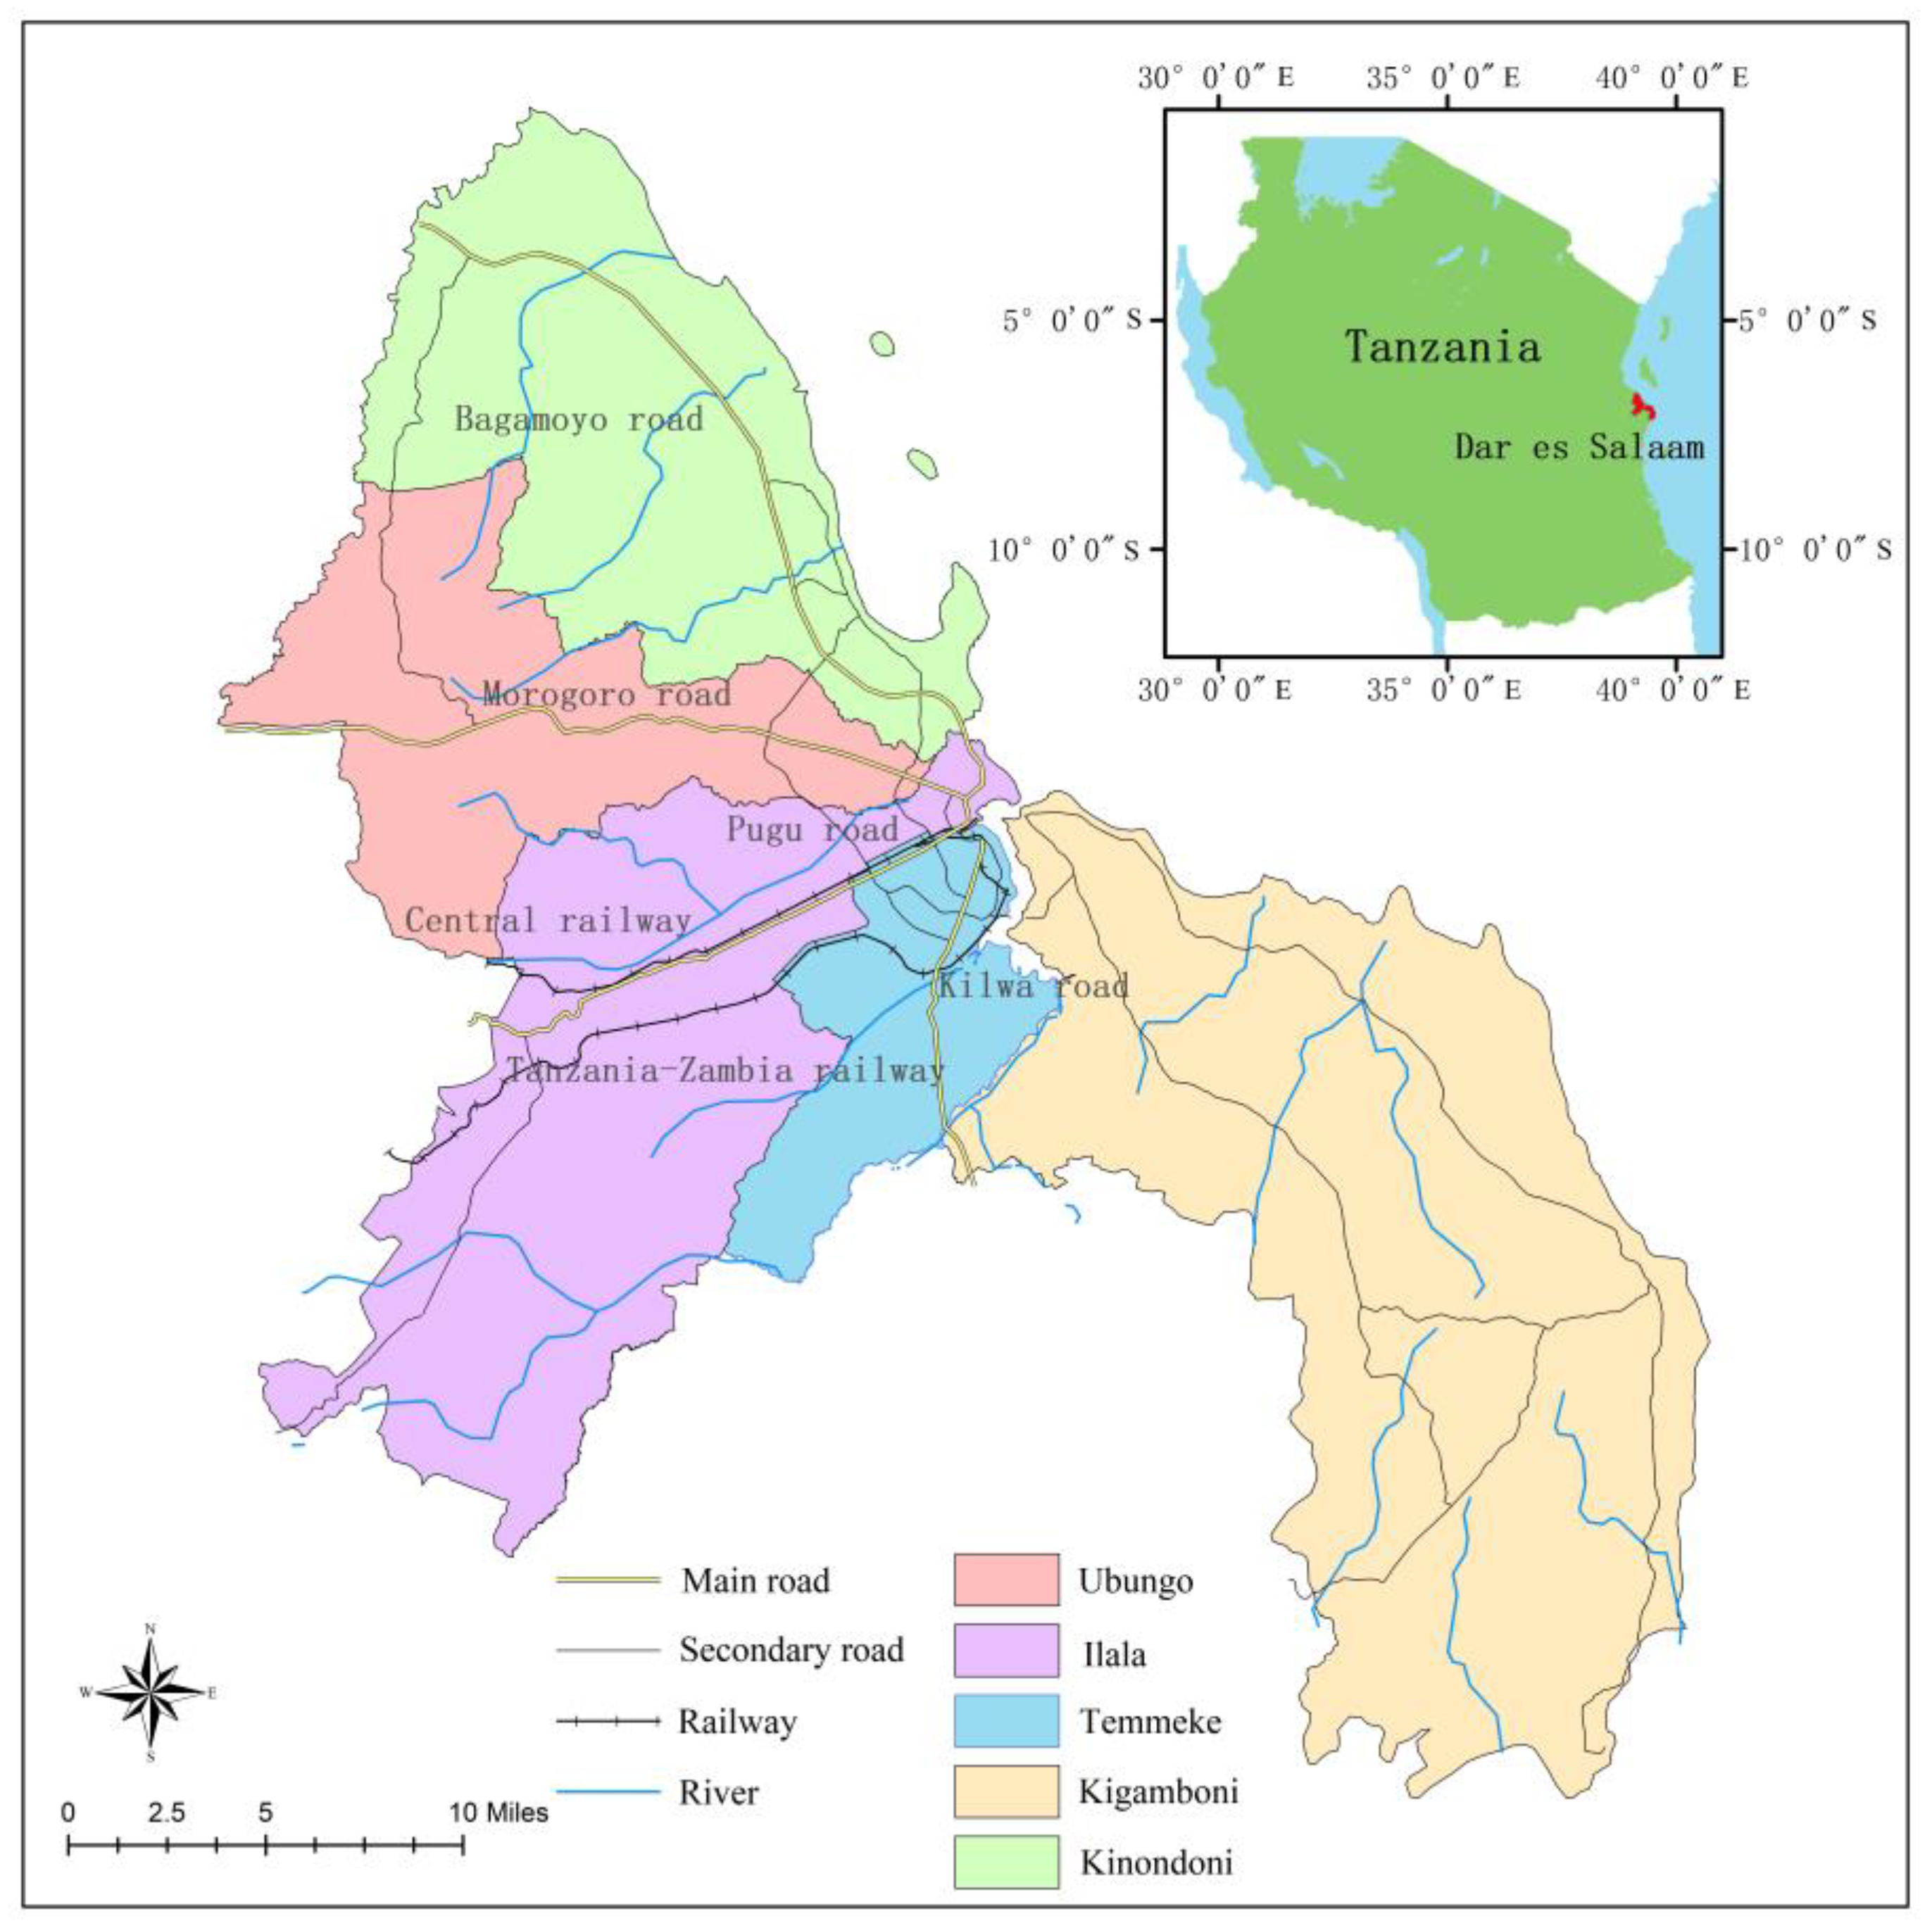
Dar es Salaam is the biggest city in Tanzania, with a population of 5.27 million in 2019 and a built-up area of 561 km2 in 2014 [20]. Dar es Salaam is composed of five districts: Ilala, Ubungo, Temmeke, Kigamboni and Kinondoni, with two railways and four main roads (Figure 1). The Atlas of Urban Expansion collects and analyzes data on the quantity and quality of urban expansion in a stratified global sample of 200 cities, which are important data for exploring urban expansion [21]. However, Dar es Salaam is not included in the database, indicating that its urban development has not received sufficient attention. Its urban expansion has been investigated by a few studies in the literature using a variety of data of different scales and from different sources. The data used date back to 1945, and the latest in 2016, with a short interval of 1 year and a long span of more than 20 years. The results of existing studies show that the city expanded along the main roads in the early stages, formed the linear expansion model in 1992 and then was replaced to a great extent by infill [16,22]. Remote sensing data is widely used in the study of urban growth. Congedo and Macchi conducted a systematic analysis of both the population and land cover changes in 2002, 2004, 2007, 2009 and 2011, and pointed out that the urban sprawl mostly occurred at the urban fringes, with a rapid sprawling process beginning between 2004 and 2007 [23]. Gombe used multi-temporal Landsat satellite images and Random Forest classification to map urban land-use in Dar es Salaam. The results show that the built-up area’s average annual growth rate was almost 8%, which made Dar es Salaam among the fastest growing cities in Africa [24]. On the other hand, the urban expansion mechanism of Dar es Salaam was probed into with empirical data combined with theoretical models by some scholars. Kombe regarded that traffic lines and water supply lines were still priority areas or hotspots in the sub-urban expansion on the basis of tremendous interviews [25]. Mkalawa performed a quantitative analysis of the urban change and spatial development pattern of the land use/cover in the city of Dar es Salaam using three types of data (slope, land cover and proximity map), and also believed that the changes were mainly driven by transportation infrastructure and population growth, with an average annual growth rate of 6% in urban land cover from 1991 to 2009 [26]. Moreover, disorderly development of informal settlements was addressed in a lot of reports [27], which was usually linked with unplanned densely developed urban land, and discontinuously built-up areas. With an increasing number of informal settlements occurring spontaneously throughout the city, conventional data intervals on land cover change can no longer meet the requirements of identifying the hotspots and growth patterns of urban expansion, especially in a typical city such as Dar es Salaam, which has long lacked planning [22]. More real-time and accurate dynamic monitoring of urban expansion becomes important for proper decision-making in urban planning or policy. However, little work has been done in this regard.
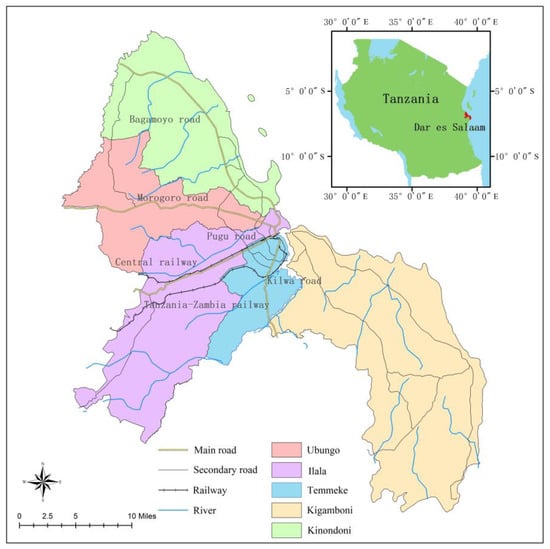
Figure 1.
Location of Dar es Salaam in Tanzania.
In the previous Dar es Salaam studies, data used by scholars to identify urban land-use were all from Landsat satellite images, but there were some differences in the types of satellites, the years of data collection and the methods of processing. For many years, there have been problems caused by a lower number of types of remote sensing data, a low selection of years and a long interval, resulting in significant differences in urban land-use growth. The urban coverage is different from the previous built-up areas and is expressed by the ISA, which refers to buildings, roads and other areas paved with asphalt, concrete and other substances. The ISA method has been widely used to quickly estimate urban expansion in other continents [28,29,30,31,32,33], but there are fewer case studies of African cities. Based on two kinds of remote sensing data, Moderate-resolution Imaging Spectroradiometer (MODIS) and night light data, this paper adopts multi-source data processing and a verification method to ensure the scientific results. Moreover, due to the convenience of data acquisition, it is more conducive to carry out case studies in African regions where data is scarce, and the results have a certain practical significance. By dynamically monitoring the changes in urban form year by year, the pattern of urban evolution can be thoroughly researched and documented.
2. Materials and Methods
2.1. Framework
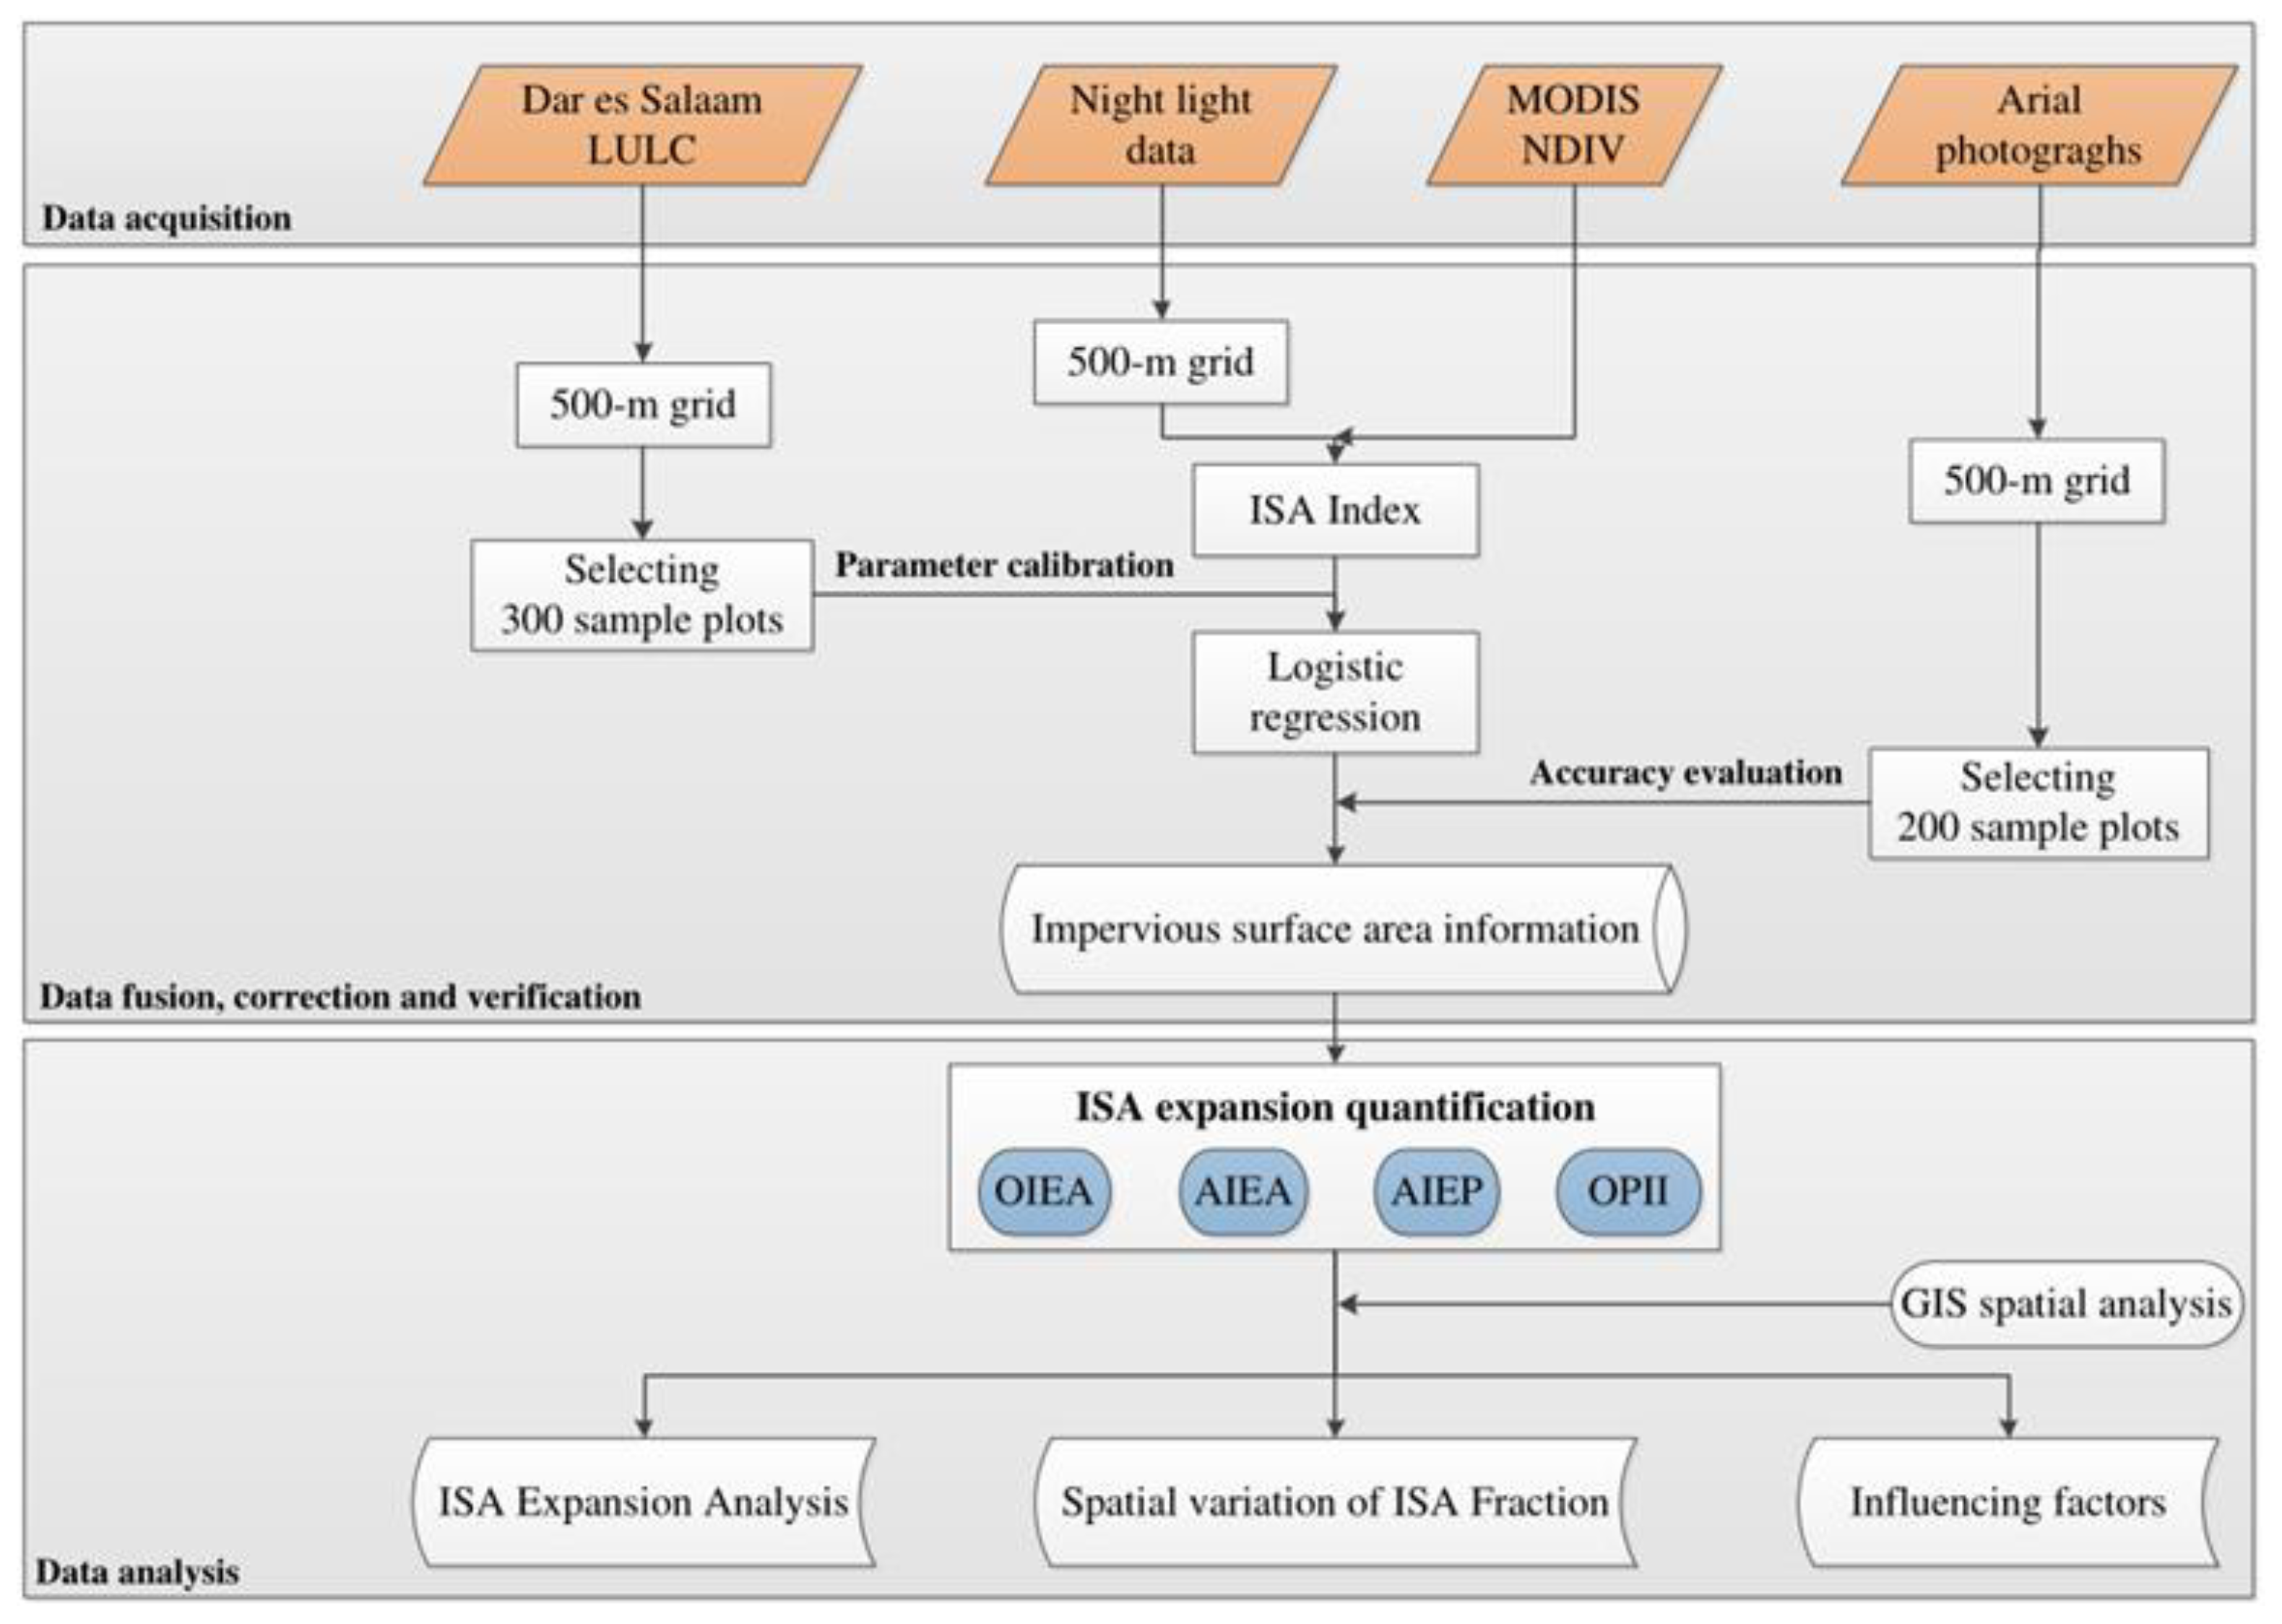
In this study, the ISA index is obtained by fusion processing Defense Meteorological Satellite Program/Operational Linescan System (DMSP/OLS) night light data with Landsat, MODIS and other remote sensing data, which is a new method for quickly estimating residential areas [34]. Compared with the traditional threshold method, it can reduce the saturation problem of night light data and also increase the change in urban value. Through regression correction of the ISA and an accuracy test, the 20-year urban impervious surface distribution of Dar es Salaam can be obtained.
The methodological framework is applied to comparatively analyze the growth pattern of the impervious surface in Dar es Salaam, and it includes three steps: data acquisition, data processing and data analysis (Figure 2).
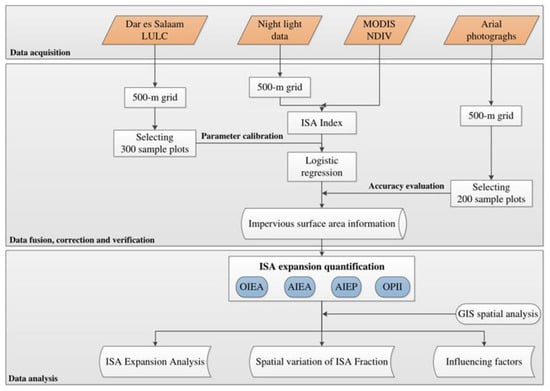
Figure 2.
Methodological Framework.
2.2. Data Sources
Night light data, multi-temporal Moderate-resolution Imaging Spectroradiometer Normalized Difference Vegetation Index (MODIS NDVI (MOD13A1)), Dar es Salaam’s Land Use and Land Cover (LULC) data and other auxiliary data were used in this research (Table 1). The night light data included DMSP/OLS (2000–2013) and Visible Infrared Imaging Radiometer (VIIRS) (2014–2019), and both were downloaded from the National Centers for Environmental Information (NCEI). The multi-temporal MODIS NDVI data (2000–2019) were downloaded from the United State Geological Survey (USGS). Dar es Salaam’s LULC data from 2012 with a vector format generated from digitizing Landsat Thematic Mapper (TM) images were provided by the Dar es Salaam Coastal Zone Climate Change Project [35]. Aerial photographs from 2019 for Dar es Salaam were used as validation data. Other auxiliary data were downloaded from the Tanzania National Bureau of Statistics.

Table 1.
Data list.
2.3. Methods
2.3.1. Data Pre-Processing
MODIS NDVI and night light data were adjusted to the same resolution through projecting raster and resampling in ArcGIS 10.4.1. Afterwards, the data in each pixel were mathematically calculated to obtain the ISA value [36]. Data pre-processing is illustrated in Figure 2. More specifically, night light data was projected to an Albers Conical Equal Area projection, which allowed the layout to be as close to the actual shape as possible without changing the area. Then, the resolution of the night light data was adjusted to 500 m by 500 m to facilitate subsequent calculations [37]. The maximum value of MODIS NDVI for the whole year was obtained by combining the maximum values of each pixel in a year, and they were also projected to the Albers Conical Equal Area projection with a pixel size of 500 m by 500 m. Based on the method proposed by Lu [34], ISApri can be expressed as follows:
where ISApri is the preliminary ISA index; NDVImax is the maximum value of a year in each pixel; and OLSnor is the normalized night light data (0–1).
2.3.2. Data Correction
Details of the data and classification methods used in the literature are shown in Table 2. Landsat satellite images were widely used in the study of African cities, and the regression methods for data processing mainly relied on supervised maximum likelihood classification algorithms. However, when the overall distribution does not conform to the normal distribution, its regression reliability will decline, which eventually leads to differences in results.

Table 2.
Data sources, classification methods and growth rates of urban expansion in Africa.
Ridd proposed the V-I-S (vegetation impervious surface soil) model, which suggests that the urban surface cover is composed of vegetation, impervious surface and bare soil in addition to water [38]. Ward integrated data models for establishing the range of urban land cover types and their biophysical composition (vegetation, soil and impervious surfaces). He improved the V-I-S model and provided a hierarchical approach to classifying land cover within urban environments [39].
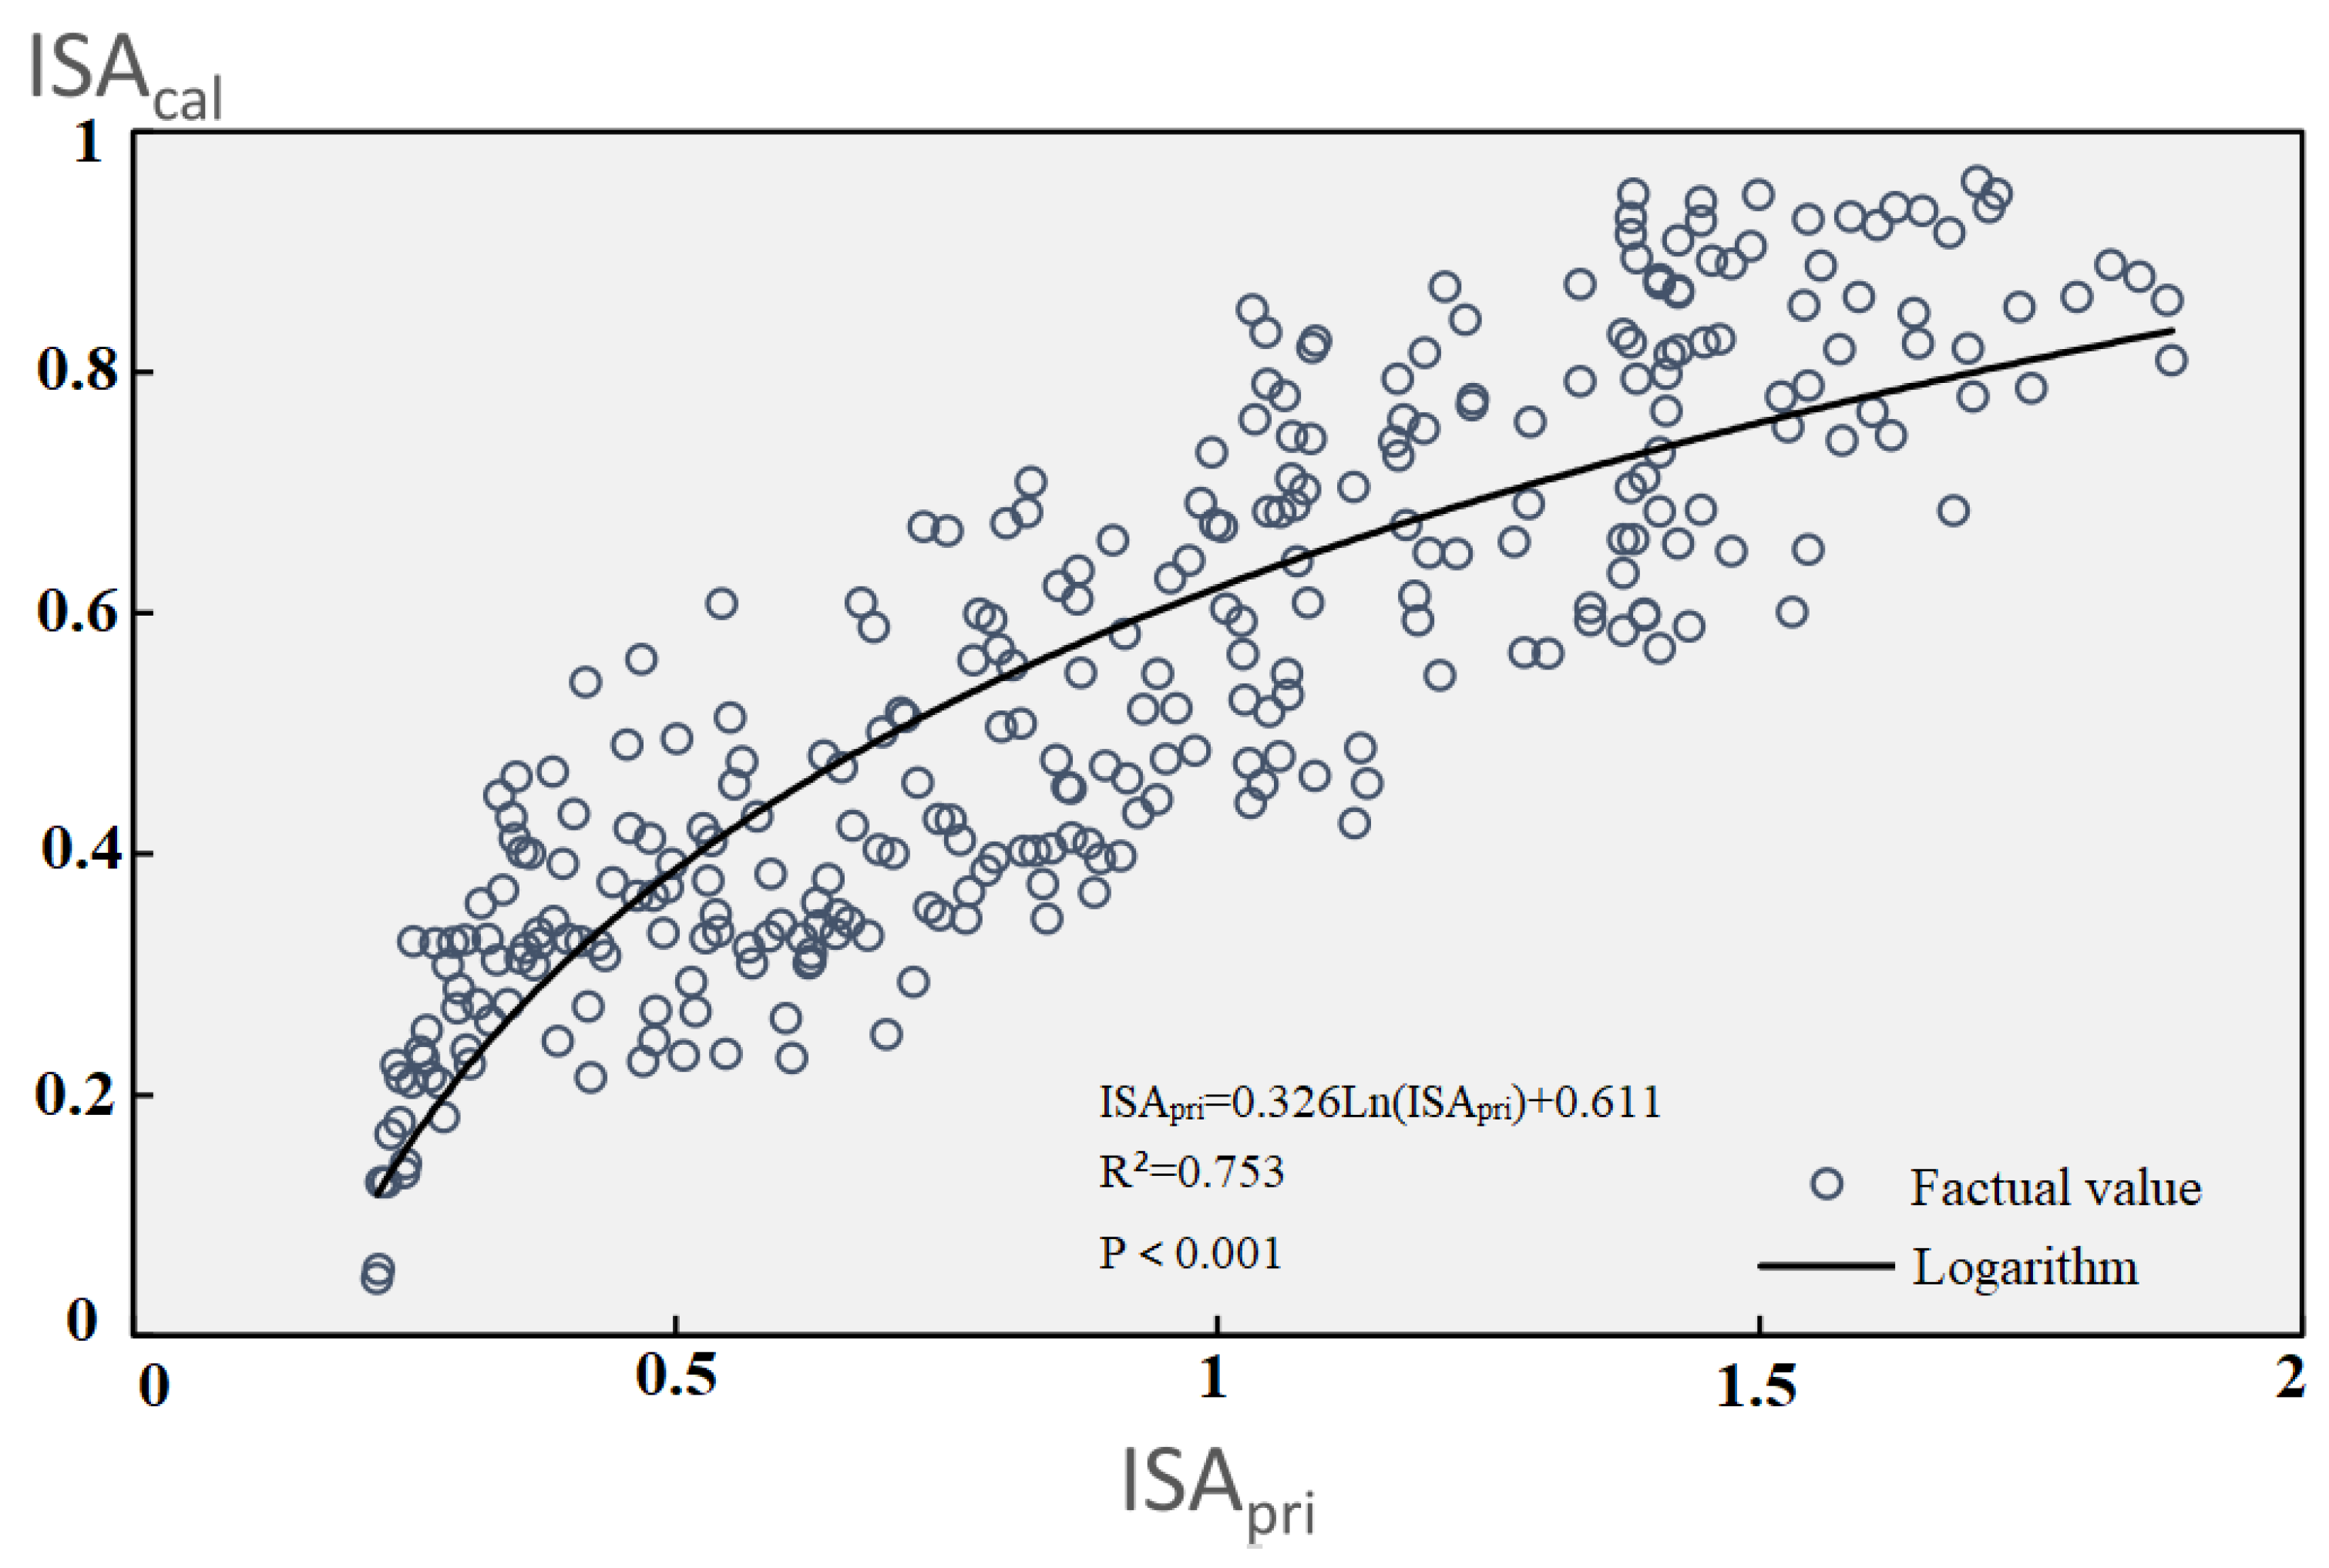
Due to the complexity of urban landscapes, the mixed pixels obtained by using coarse spatial resolution images such as MODIS and DMSP-OLS for settlement mapping are considered to be a major problem affecting the effective use of remotely sensed data in urban land-use/cover classification. Given this V-I-S principle, the ISA index calculated above was converted to the ISA percentage on the grid by a calibration model. From the 2012 Dar es Salaam LULC map, we randomly selected 300 sample plots for data calibration. Among the six LULC categories (high vegetation cover, low vegetation cover, continuous built areas, discontinuous built areas, bare land and water bodies) covered by the map, continuous and discontinuous built areas were regarded as ISA components. Then, we converted the 2012 ISA distribution map to a 500 m by 500 m raster image, and the projection was set to be the same as the MODIS NDVI and night light data. The percentage of ISA components extracted from the 300 sample plots was used as a dependent variable. The preliminary ISA index value was used as an independent variable in linear regression analysis. The coefficient of determination (R2) was used to evaluate the regression model performance (Figure 3). The p-value was used to determine whether the regression coefficient was significant. Finally, the calibration model was as follows:
where ISApri is the preliminary ISA index and ISAcal is the final ISA based on the percentage of ISA within the pixel size of 500 m by 500 m.
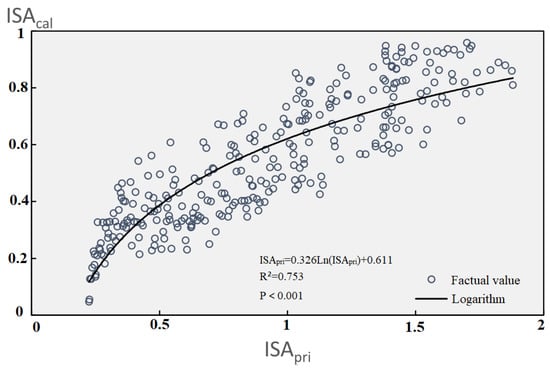
Figure 3.
Regression diagram between ISApri and ISAcal.
2.3.3. Accuracy Evaluation
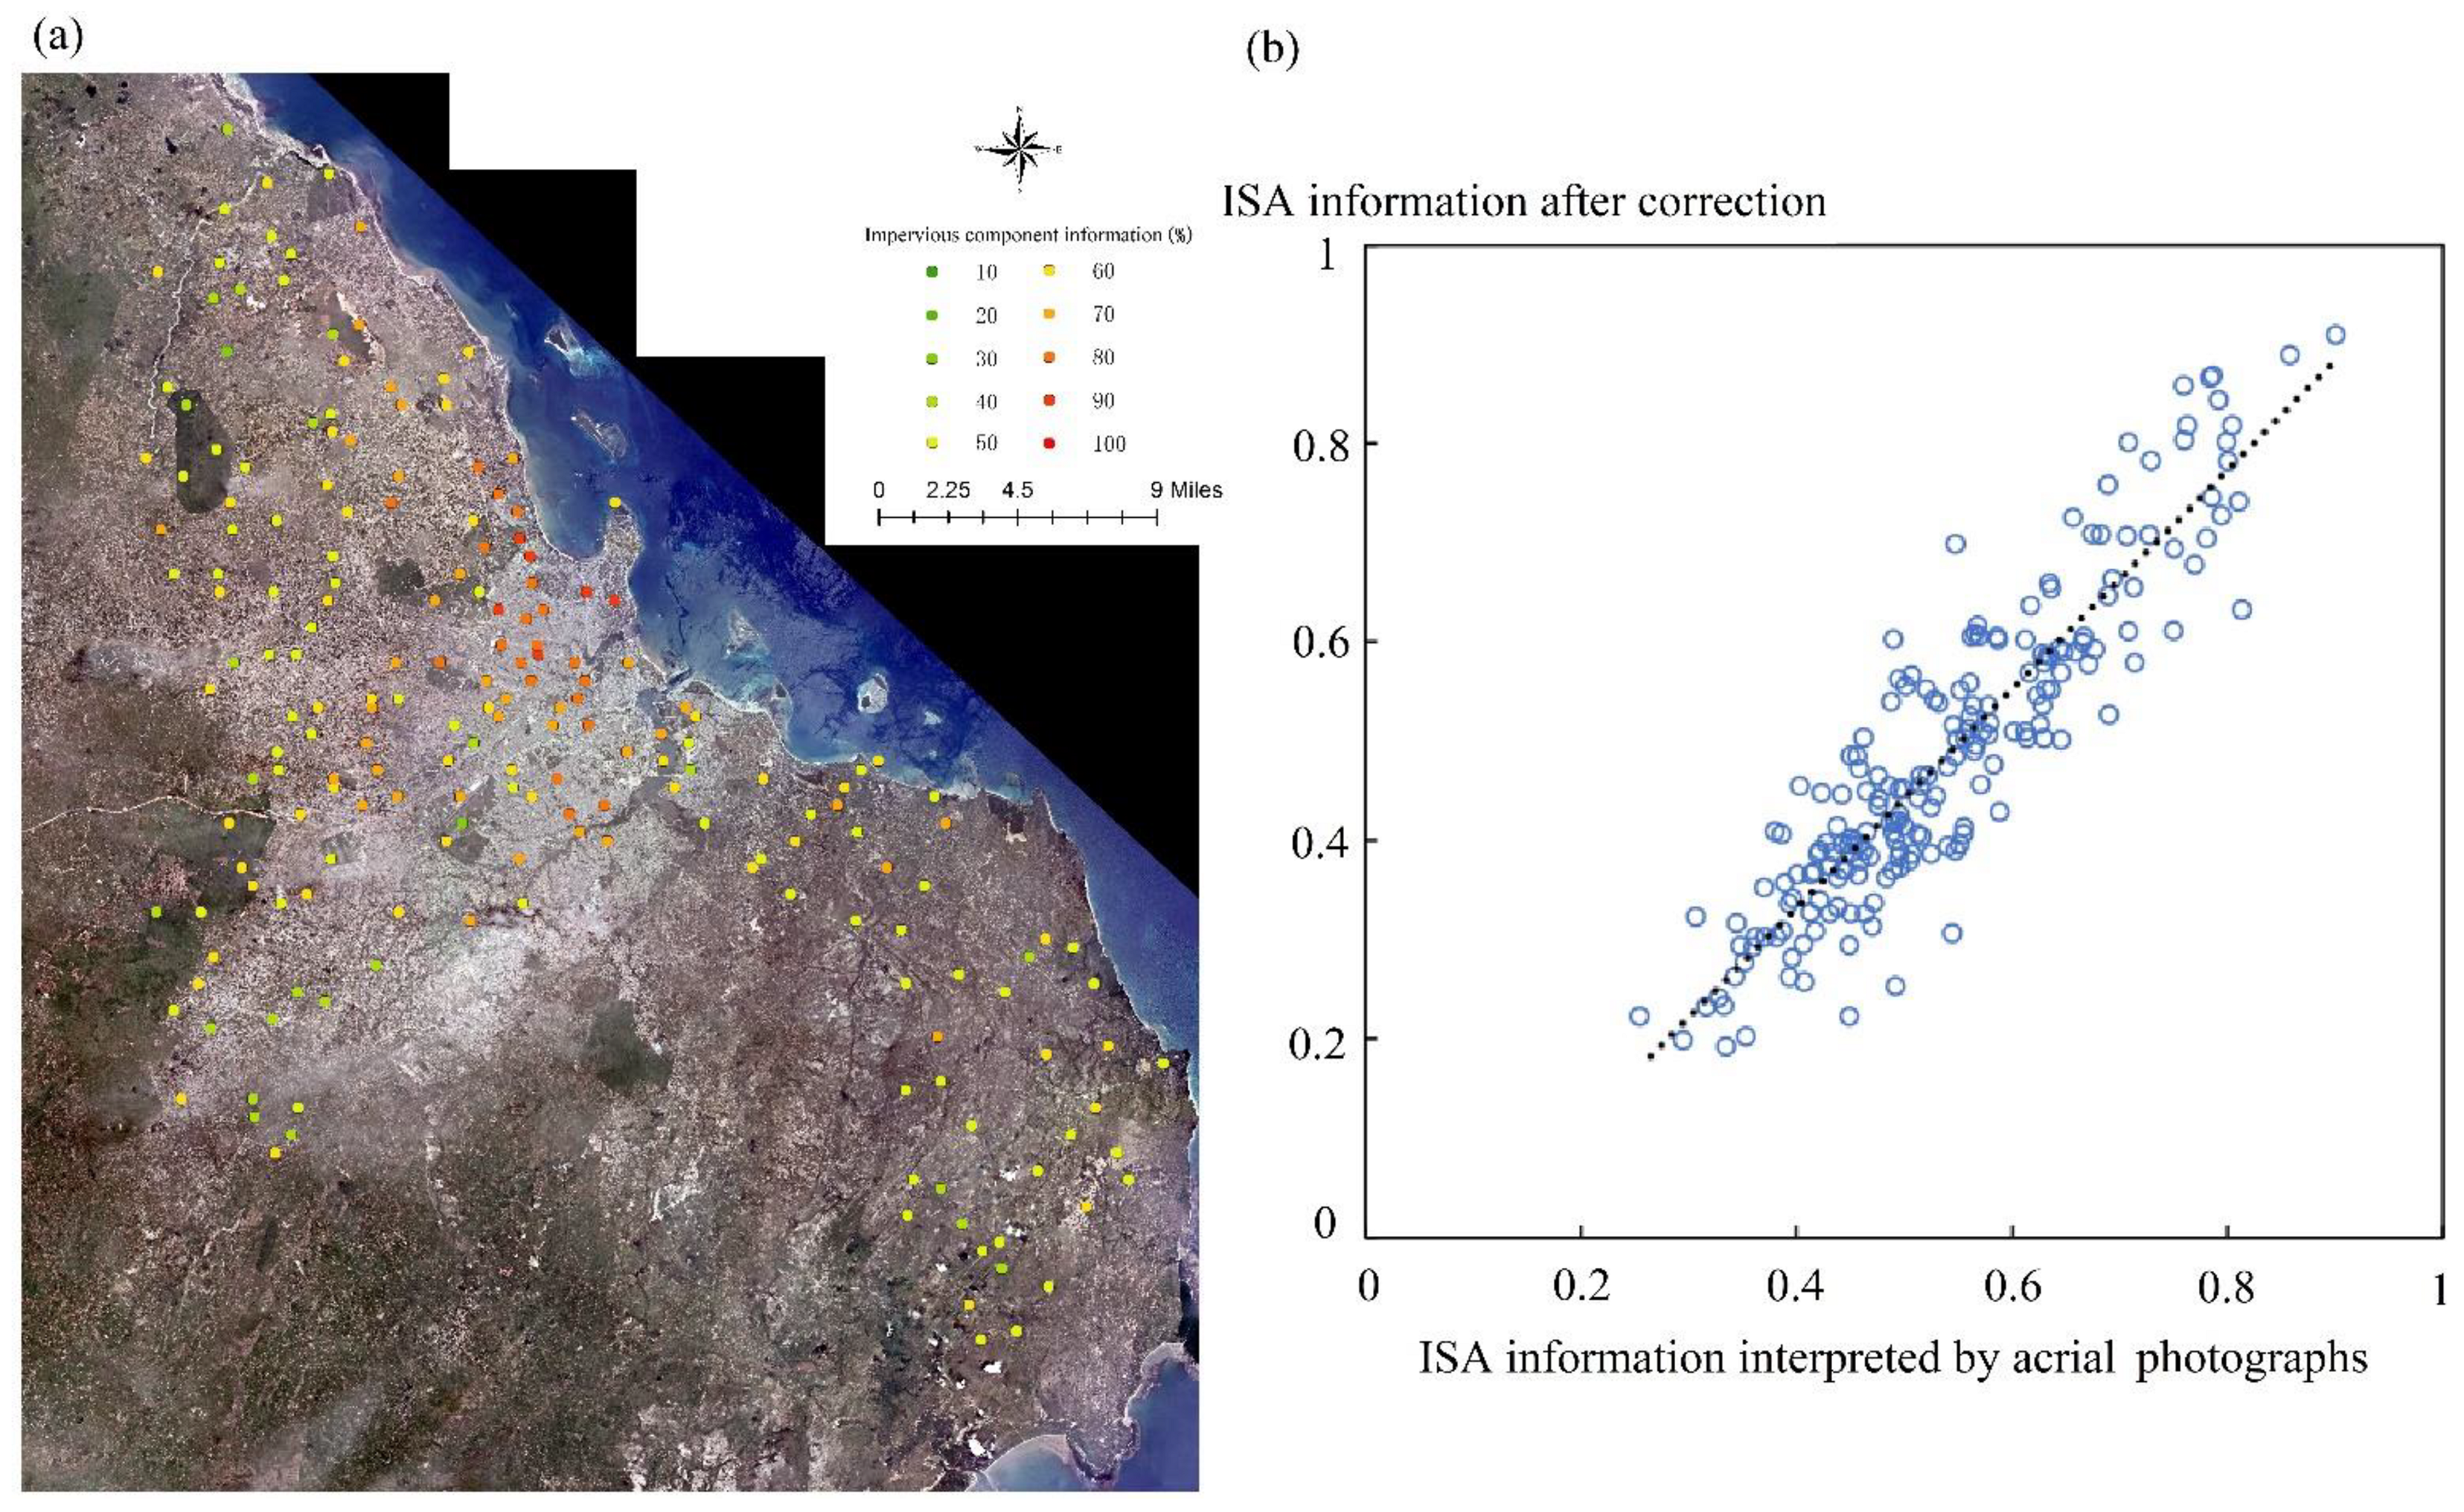
Accuracy evaluation was conducted based on a random sampling method. In order to reduce the impact of image registration errors, the verified sample information was obtained by manual interpretation of the corrected 2019 Aerial photographs of Dar es Salaam (Figure 4a), and the proportion of ISA components in 200 random samples was visually interpreted to represent the true validation value. Manual interpretation is a process in which professionals acquire specific target information on remote sensing images by direct observation or with the aid of interpretive instruments. Through this method, the effect of remote sensing image processing or the accuracy of computer interpretation can be checked. Finally, the mean relative error (MRE) method was used to evaluate the accuracy of corrected ISA information in 2019. According to the results (Figure 4b), the MRE of the corrected ISA was 0.181, indicating that the accuracy of the data is very high.
where MRE is the mean relative error, xi is the ISA information after correction, yi is the ISA information interpreted by aerial photographs and N is the number of samples.
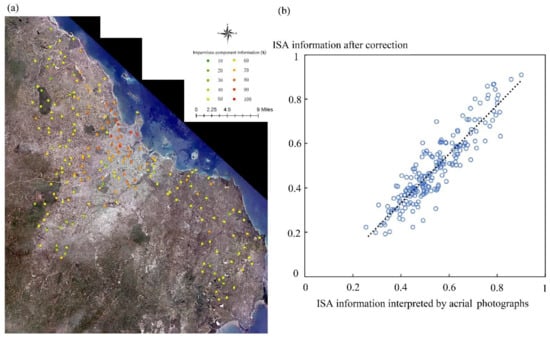
Figure 4.
Sample spots distribution (a) and accuracy verification results (b).
2.3.4. Dynamic Analysis of ISA
To better analyze the dynamics of ISA expansion and reveal its magnitude and rate, we selected four indexes in this study, including overall impervious surface expansion area (OIEA), annul impervious surface expansion area (AIEA), annual impervious surface expansion percent (AIEP) and overall percentage increase in ISA (OPII). OIEA and AIEA aim at measuring changes in ISA and are effective for comparison of ISA over different periods. AIEP is effective for comparison of ISA expansion for five districts in one period. OPII is used to describe the percentage change of ISAs in one period. They can be expressed as follows:
where ISAi and ISAj refer to the impervious surface area at the start of year j and end of year i, respectively, d is the time span from year j to year and PISAi and PISAj refer to the percentage of ISA at the start year j and the end year i.
3. Results and Analyses
3.1. Impervious Surface Growth Pattern with Time
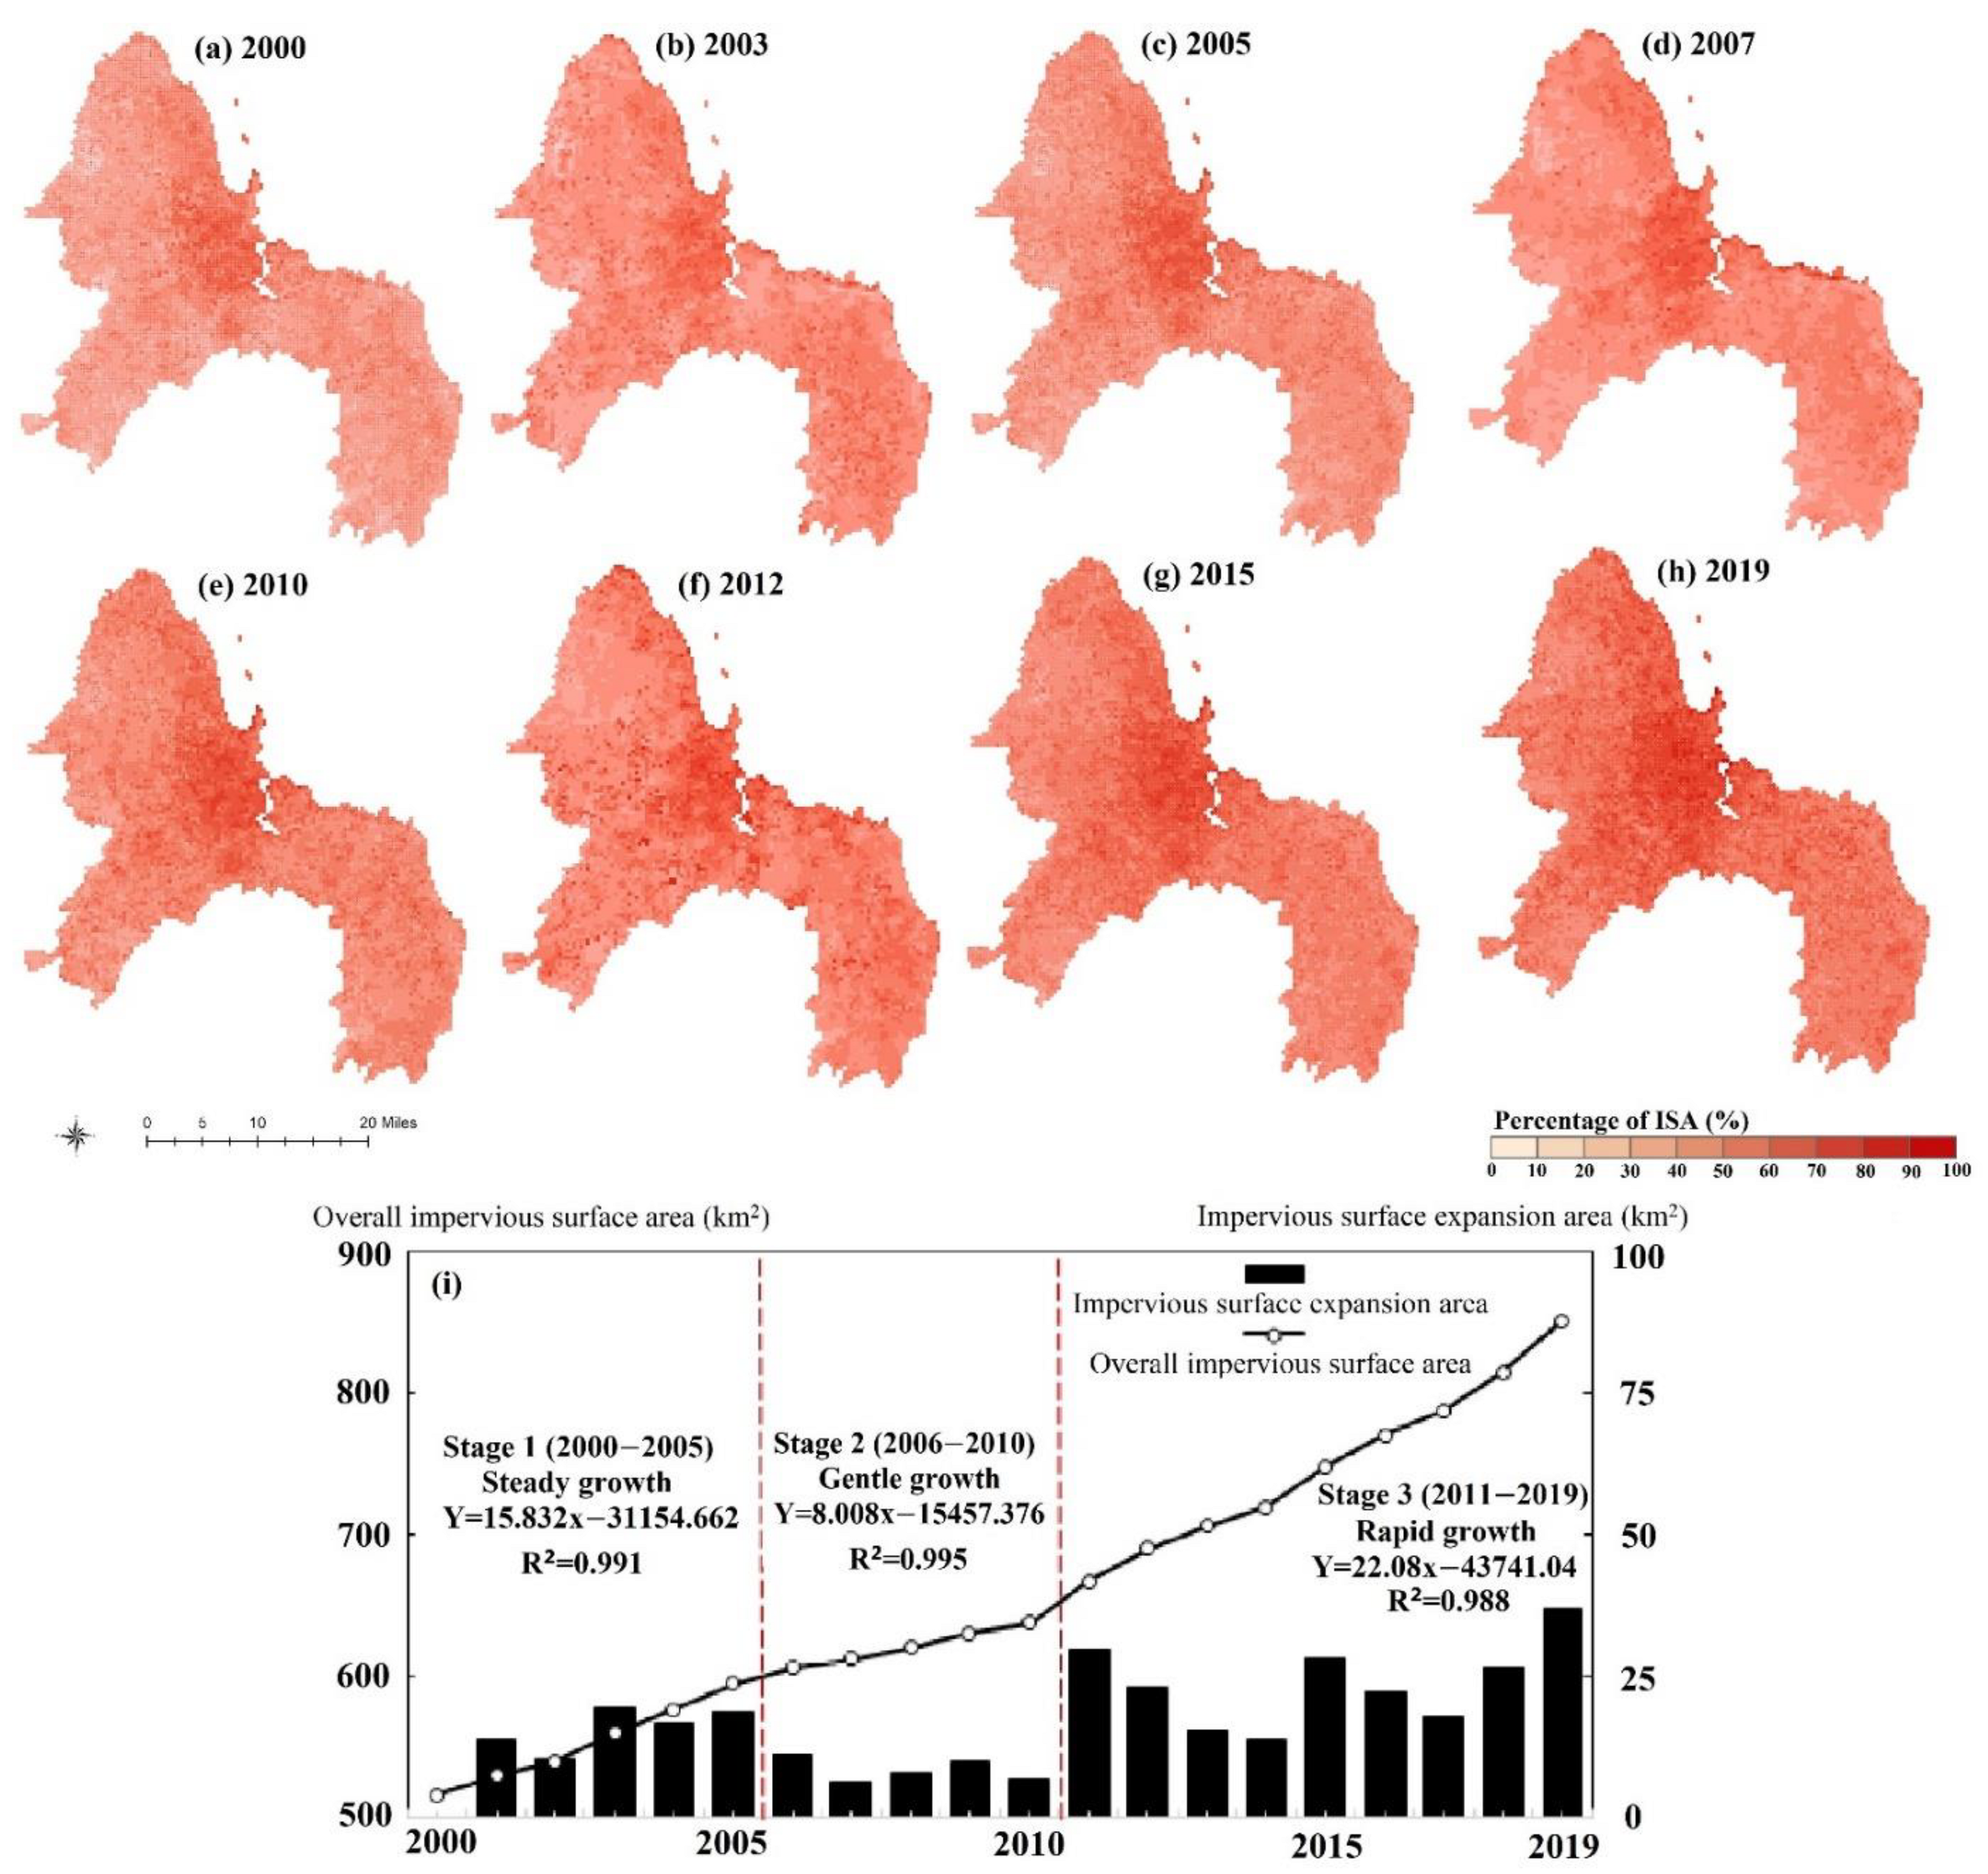
The ISA percentage was calculated for the 500 m by 500 m grids in Dar es Salaam city between 2000 and 2019. Among them, the maps of nine years were selected as shown in Figure 5. In 2000, the ISA percentage was relatively low in most areas of the city (Figure 5a). In 2010 it became obviously higher in the city center than in the peripheral area (Figure 5e), and this feature persisted in later periods. In 2012, a large number of high ISA (above 50%) grids emerged in the west and southwest of the city (Figure 5f). After that, the city average percentage of ISA increased further, reaching 50.5% in 2019 (Figure 5h).
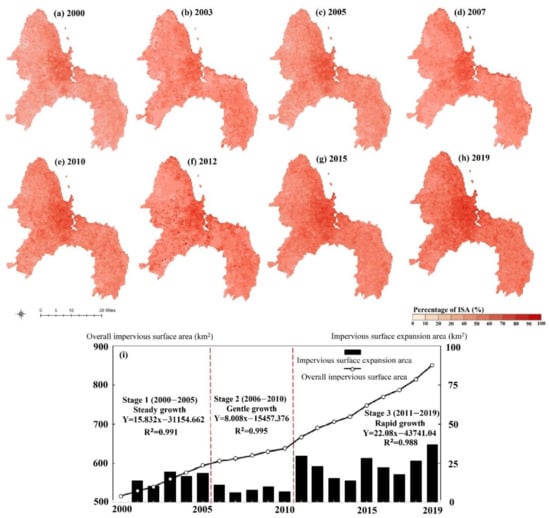
Figure 5.
Spatial information (2000 (a), 2003 (b), 2005 (c), 2007 (d), 2010 (e), 2012 (f), 2015 (g) and 2019 (h)), annual growth and total change of impervious surface area (i) in Dar es Salaam.
The overall ISA and its annual increase for Dar es Salaam is demonstrated in Figure 5i. The total ISA increased from 516.3 km2 in 2000 to 851.7 km2 in 2019, with an AIEP of 2.8%. The changes in ISA over 20 years have obviously appeared in three stages: steady growth from 2000 to 2005, gentle growth from 2006 to 2010 and rapid growth from 2011 to 2019. The AIEP of the three stages are 2.9%, 1.4% and 3.3%, respectively. In these three stages, OIEA in stage 3 was 214.0 km2, accounting for 63.8% of the total increase. OIEA in 2011 was one of the peaks during this period, and then the increment slowed down over the next three years, until it reached another peak in 2015. Finally, the increment in 2019 was the highest during the whole period. In stage 1, the OIEAs for every year were almost above 14 km2, except in 2002. As for the OIEA in stage 2, 2007 (6.2 km2) and 2010 (7.0 km2) were the years with the two lowest increments, and they were also the lowest for the whole period. The AIEA of stage 2 was 8.5 km2, which was much lower than 15.8 km2 in stage 1 and 23.8 km2 in stage 3.
In a view of the ISA expansion in the five districts of Dar es Salaam, Kigamboni was the highest, followed by Ilala and then the other three districts within the 20 years, while the overall growth trend of each district was roughly the same, with OIEA, AIEA and AIEP appearing high, low and very high in stages 1, 2 and 3, respectively (Table 3). During 2000–2005, the annual growth percent of ISA in Temmeke was 4.9%, dramatically faster than others. Ubungo was more prominent in stage 2 and experienced rapid ISA expansion. Its three indexes were the highest among the five districts, with values of 9.8 km2, 2.5 km2 and 2.4%, respectively. Due to rapid growth in stage 3, ISA expansion in each district was dramatically higher than the other two stages. As for AIEP, Ilala was 3.8% in stage 3, showing the highest growth rate.

Table 3.
Changes of ISA in five districts of Dar es Salaam during different periods.
In general, the expansion areas in Kigamboni were 119.5 km2, accounting for 35.6% of the total area of OIEA during 2000–2019. Meanwhile, AIEA in Kigamboni was 6.3 km2, much higher than the other four districts. Temmeke and Ilala experienced more rapid expansion, with annual growth percentages of 3.2% and 2.9%, respectively, both of which were higher than those three districts.
3.2. Circle-Layer and Directional Growth Characteristics
Considering the distribution characteristics of high ISA diffusion outward from the center to the periphery, we chose the Dar es Salaam port as the center to make six concentric circles every 5 km. In a view of ISA distribution within the radius of 20 km, the land grids with more than 50% of the impervious surface accounted for 11.3% in 2000, 40.5% in 2010 and 75.5% in 2019.
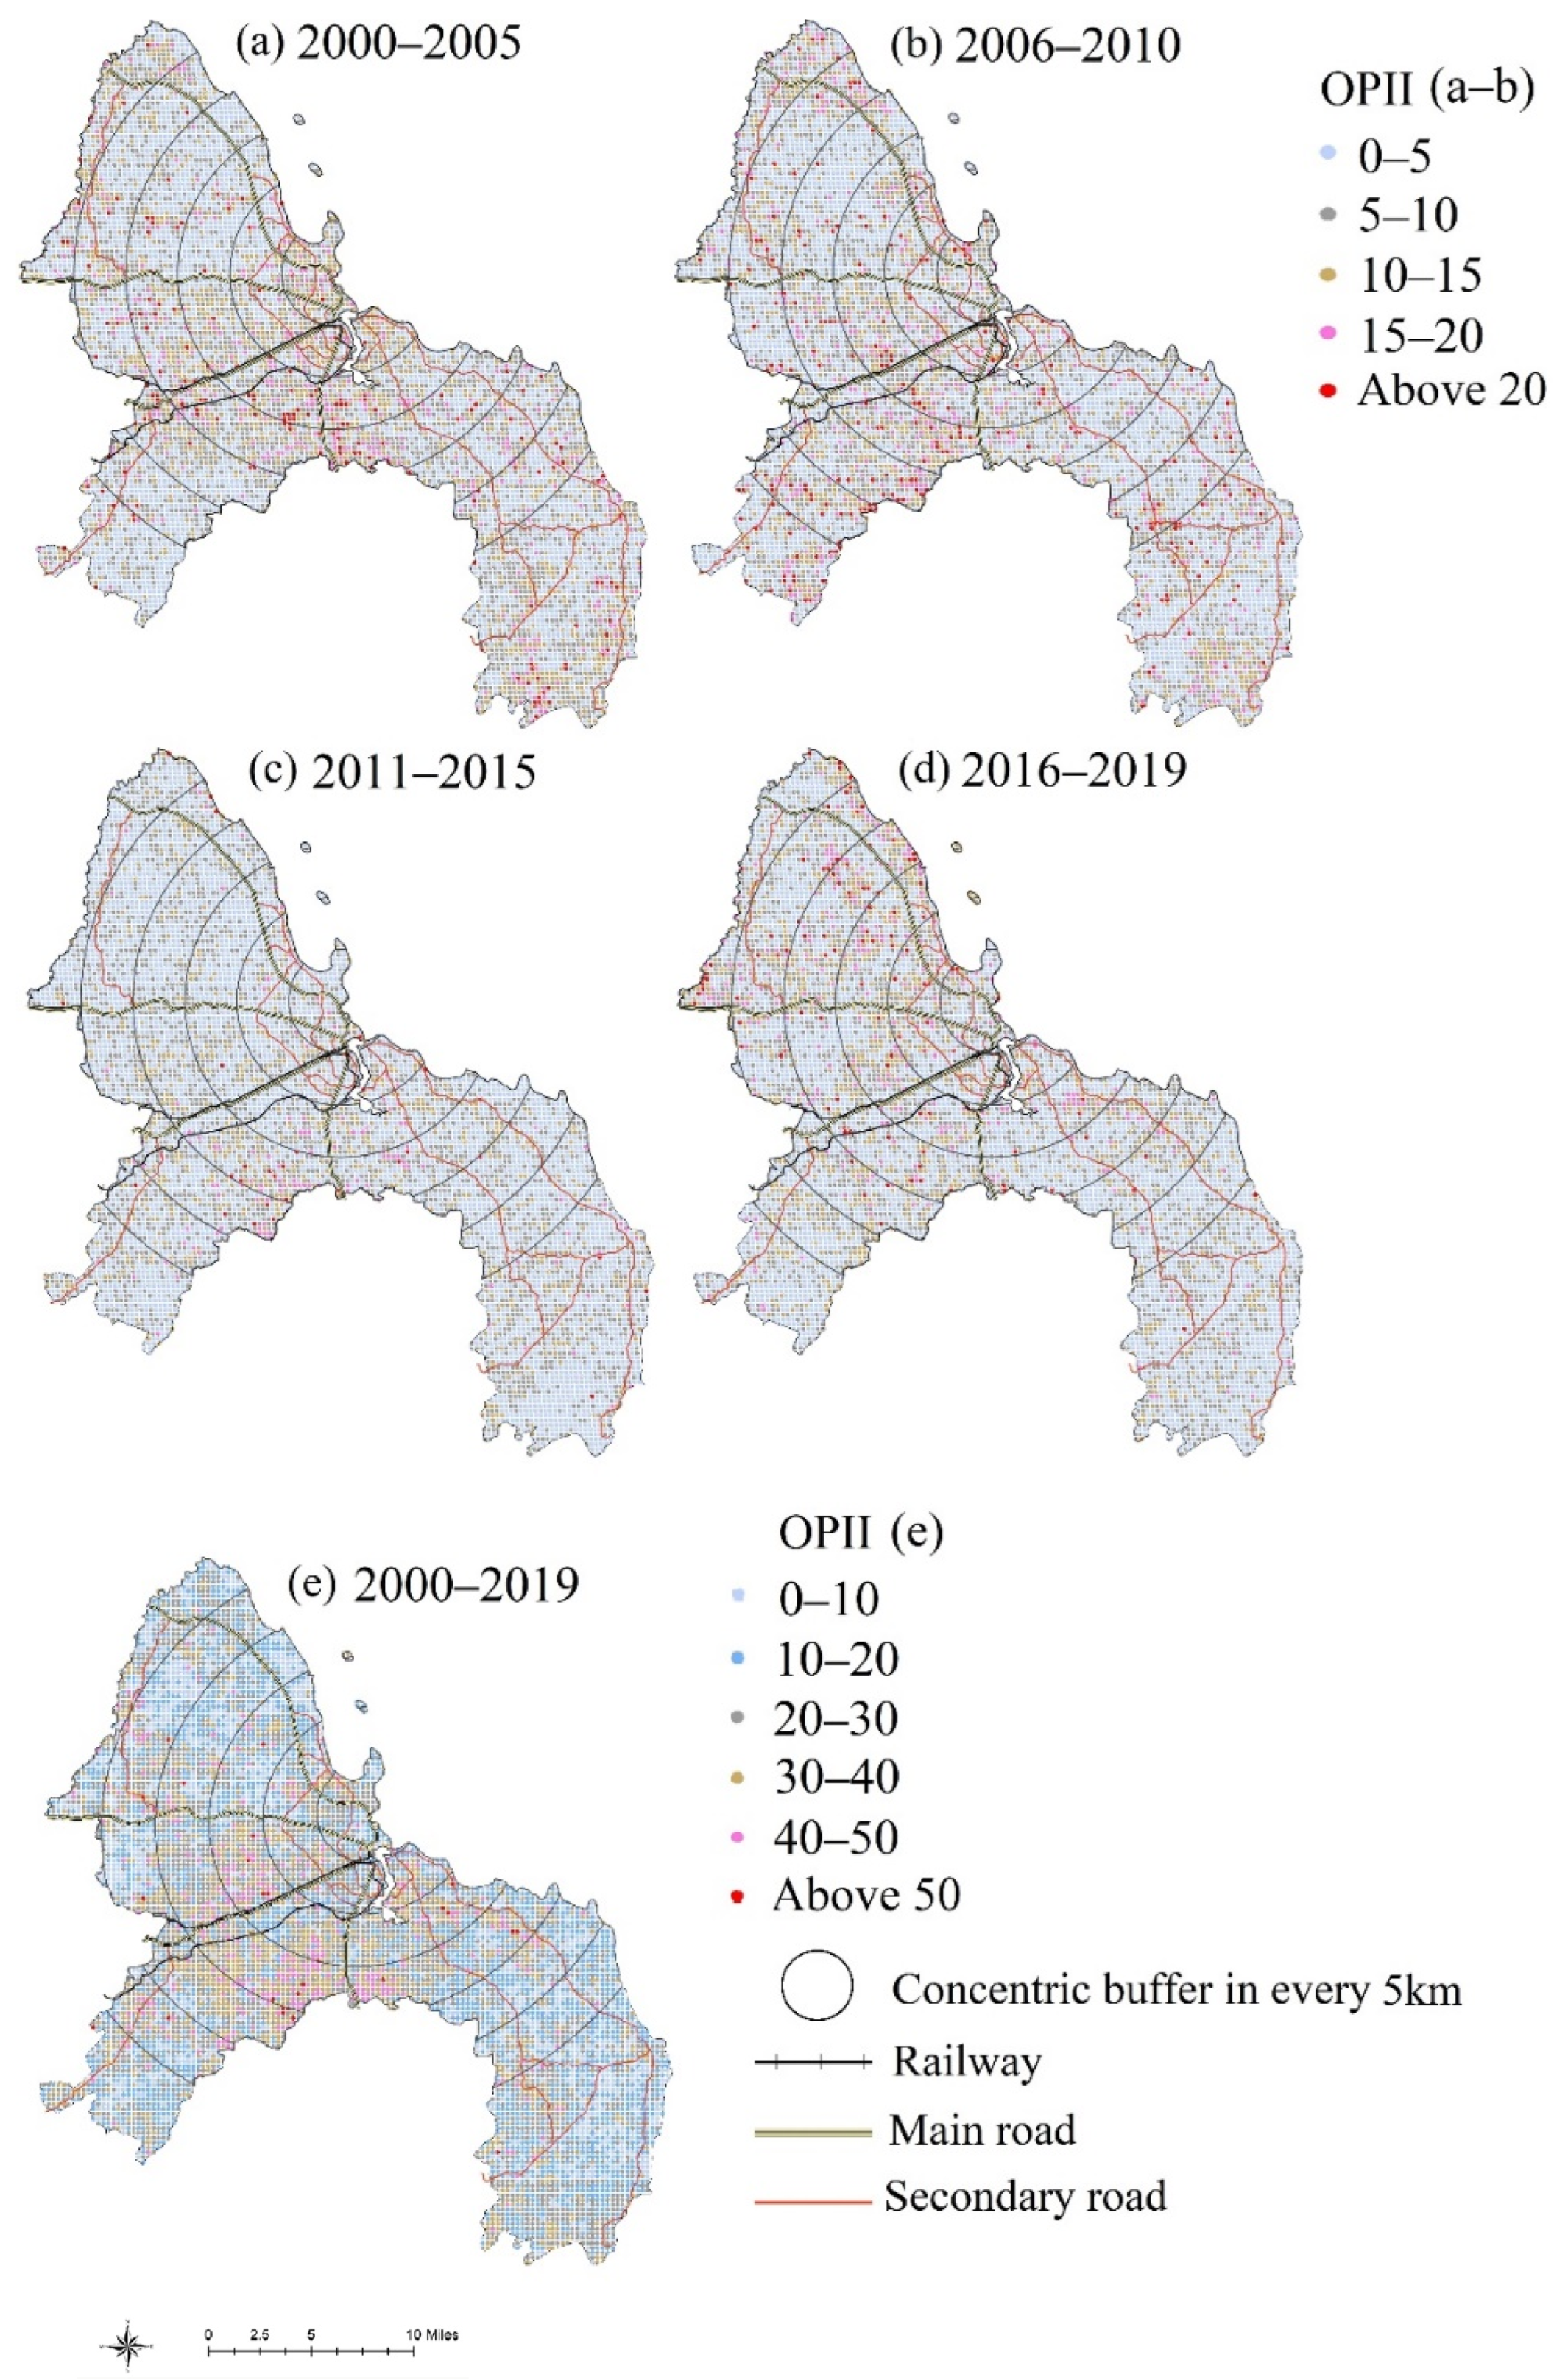
Then, we selected 2005, 2010 and 2015 as the time points, the OPII (overall percentage increase in ISA) during the four periods was mapped as shown in Figure 6, and the proportion of OPII in different concentric circles was analyzed with the results shown in Table 4. The OPII from 0% and 10%, named weak increase, usually occurs, indicating discontinuous, low-density development; the OPII from 10% and 20%, named robust increase, emerges in a major area and the OPII above 20%, named hotspots, of urban development, occurs occasionally, indicating continuous development in the city.
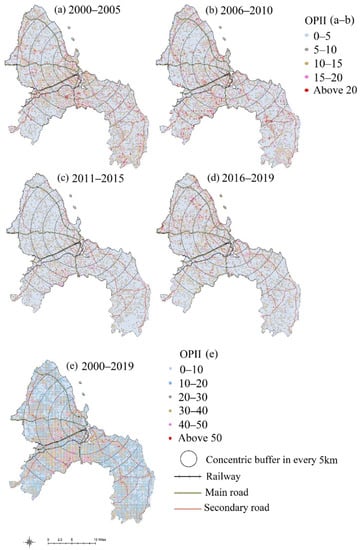
Figure 6.
Spatial-temporal variations of the OPII in different periods (2000–2005 (a), 2006–2010 (b), 2011–2015 (c), 2016–2019 (d) and 2000–2019 (e)).

Table 4.
Proportion of OPII in different concentric circles during four periods.
Combined with the results in Figure 6 and Table 4, we analyzed the changes in growth hotspots for different periods in the city, as well as the characteristics of spatial and temporal growth. From 2000 to 2005, the growth hotspots with OPII above 20% mainly emerged in the south and southwest of the port within 10–20 km, along with the Tanzania–Zambia Railway and Kilwa Road (Figure 6a). The largest proportion of robust increase (OPII from 10% to 20%) was within 5 km from the port, accounting for 38.3% of these areas. In this period, the farther the area was from the port, the greater the proportion of weak increase (OPII from 0% to 10%).
In the following five years, growth hot areas gathered in southwest urban boundary areas, 15–30 km away from the port (Figure 6b). They spread along the Pugu Road Airport highway (10 km–15 km) and southeastern secondary highway in Kigamboni (25–30 km), accounting for 2.8% and 4.2% in their total areas, respectively. In this period, the robust increase was almost around 20%, and 22.1% was the highest, which was 10–15 km away from the center.
During 2011–2015, growth hot areas were relatively scattered so there were no concentrated areas (Figure 6c). Almost all the city experienced very slow growth, so that the areas of weak increase in each circle accounted for about 90%, and the areas 25–30 km away from the port even reached 91.8%.
After 2015, growth hot areas were mainly located in the northwest areas, coastal areas and Kigamboni district (Figure 6d). They were dense within 15 to 20 km from the port, a 2.5% share of the area. For the areas 10–15 km away from the center, the proportion of robust increase reached 24.5. Moreover, the proportion of weak increase was significantly lower than that of five years ago, indicating that the OPII increased over 10 (Table 4). It is worth mentioning that the spatial growth after 2015 is different from that of the years before. The growth hot areas were mainly distributed in the areas within 10–25 km from the west, northwest and southwest of the port. The areas between Bagamoyo road and Morogoro road became hotspots despite the poor traffic. At the same time, the development of Kigamboni district was rapid after 2015, and the impervious surface along the secondary roads in the district also began to increase during this period. The fastest growing areas were mainly between the two secondary roads 10–15 km away from the port.
In a view of the overall changes during the period from 2000 to 2019 (Figure 6e), the main directions of expansion were along the traffic lines in the north, southwest and south of the city. Within a radius of 20 km, the farther away from the center, the expansion intensity was bigger, with the average OPII value increasing from 20.6 in the radius of 5 km, 21.5 in the radius of 5–10 km, 22.7 in the radius of 10–15 km to 23.7 in the radius of 15–20 km. Beyond the radius of 20 km, the average OPII value was 18.4 in the radius of 20–25 km, 20.5 in the radius of 25–30 km and 18.7 in the radius beyond 30 km.
Above all, the growth hot areas appeared frequently in the areas 10–20 km away from the center. Areas more than 20 km away from the center increased slowly, which were the main areas of weak increase, accounting for 80% to 90% for a long time. The maximum difference of the average OPII value between the layers was about 5, the difference of the expansion intensity between the center and the periphery was not very significant and the city showed obvious characteristics of low-density spreading growth.
3.3. Influencing Factors of Impervious Surface Growth
3.3.1. Population and Economic Factors
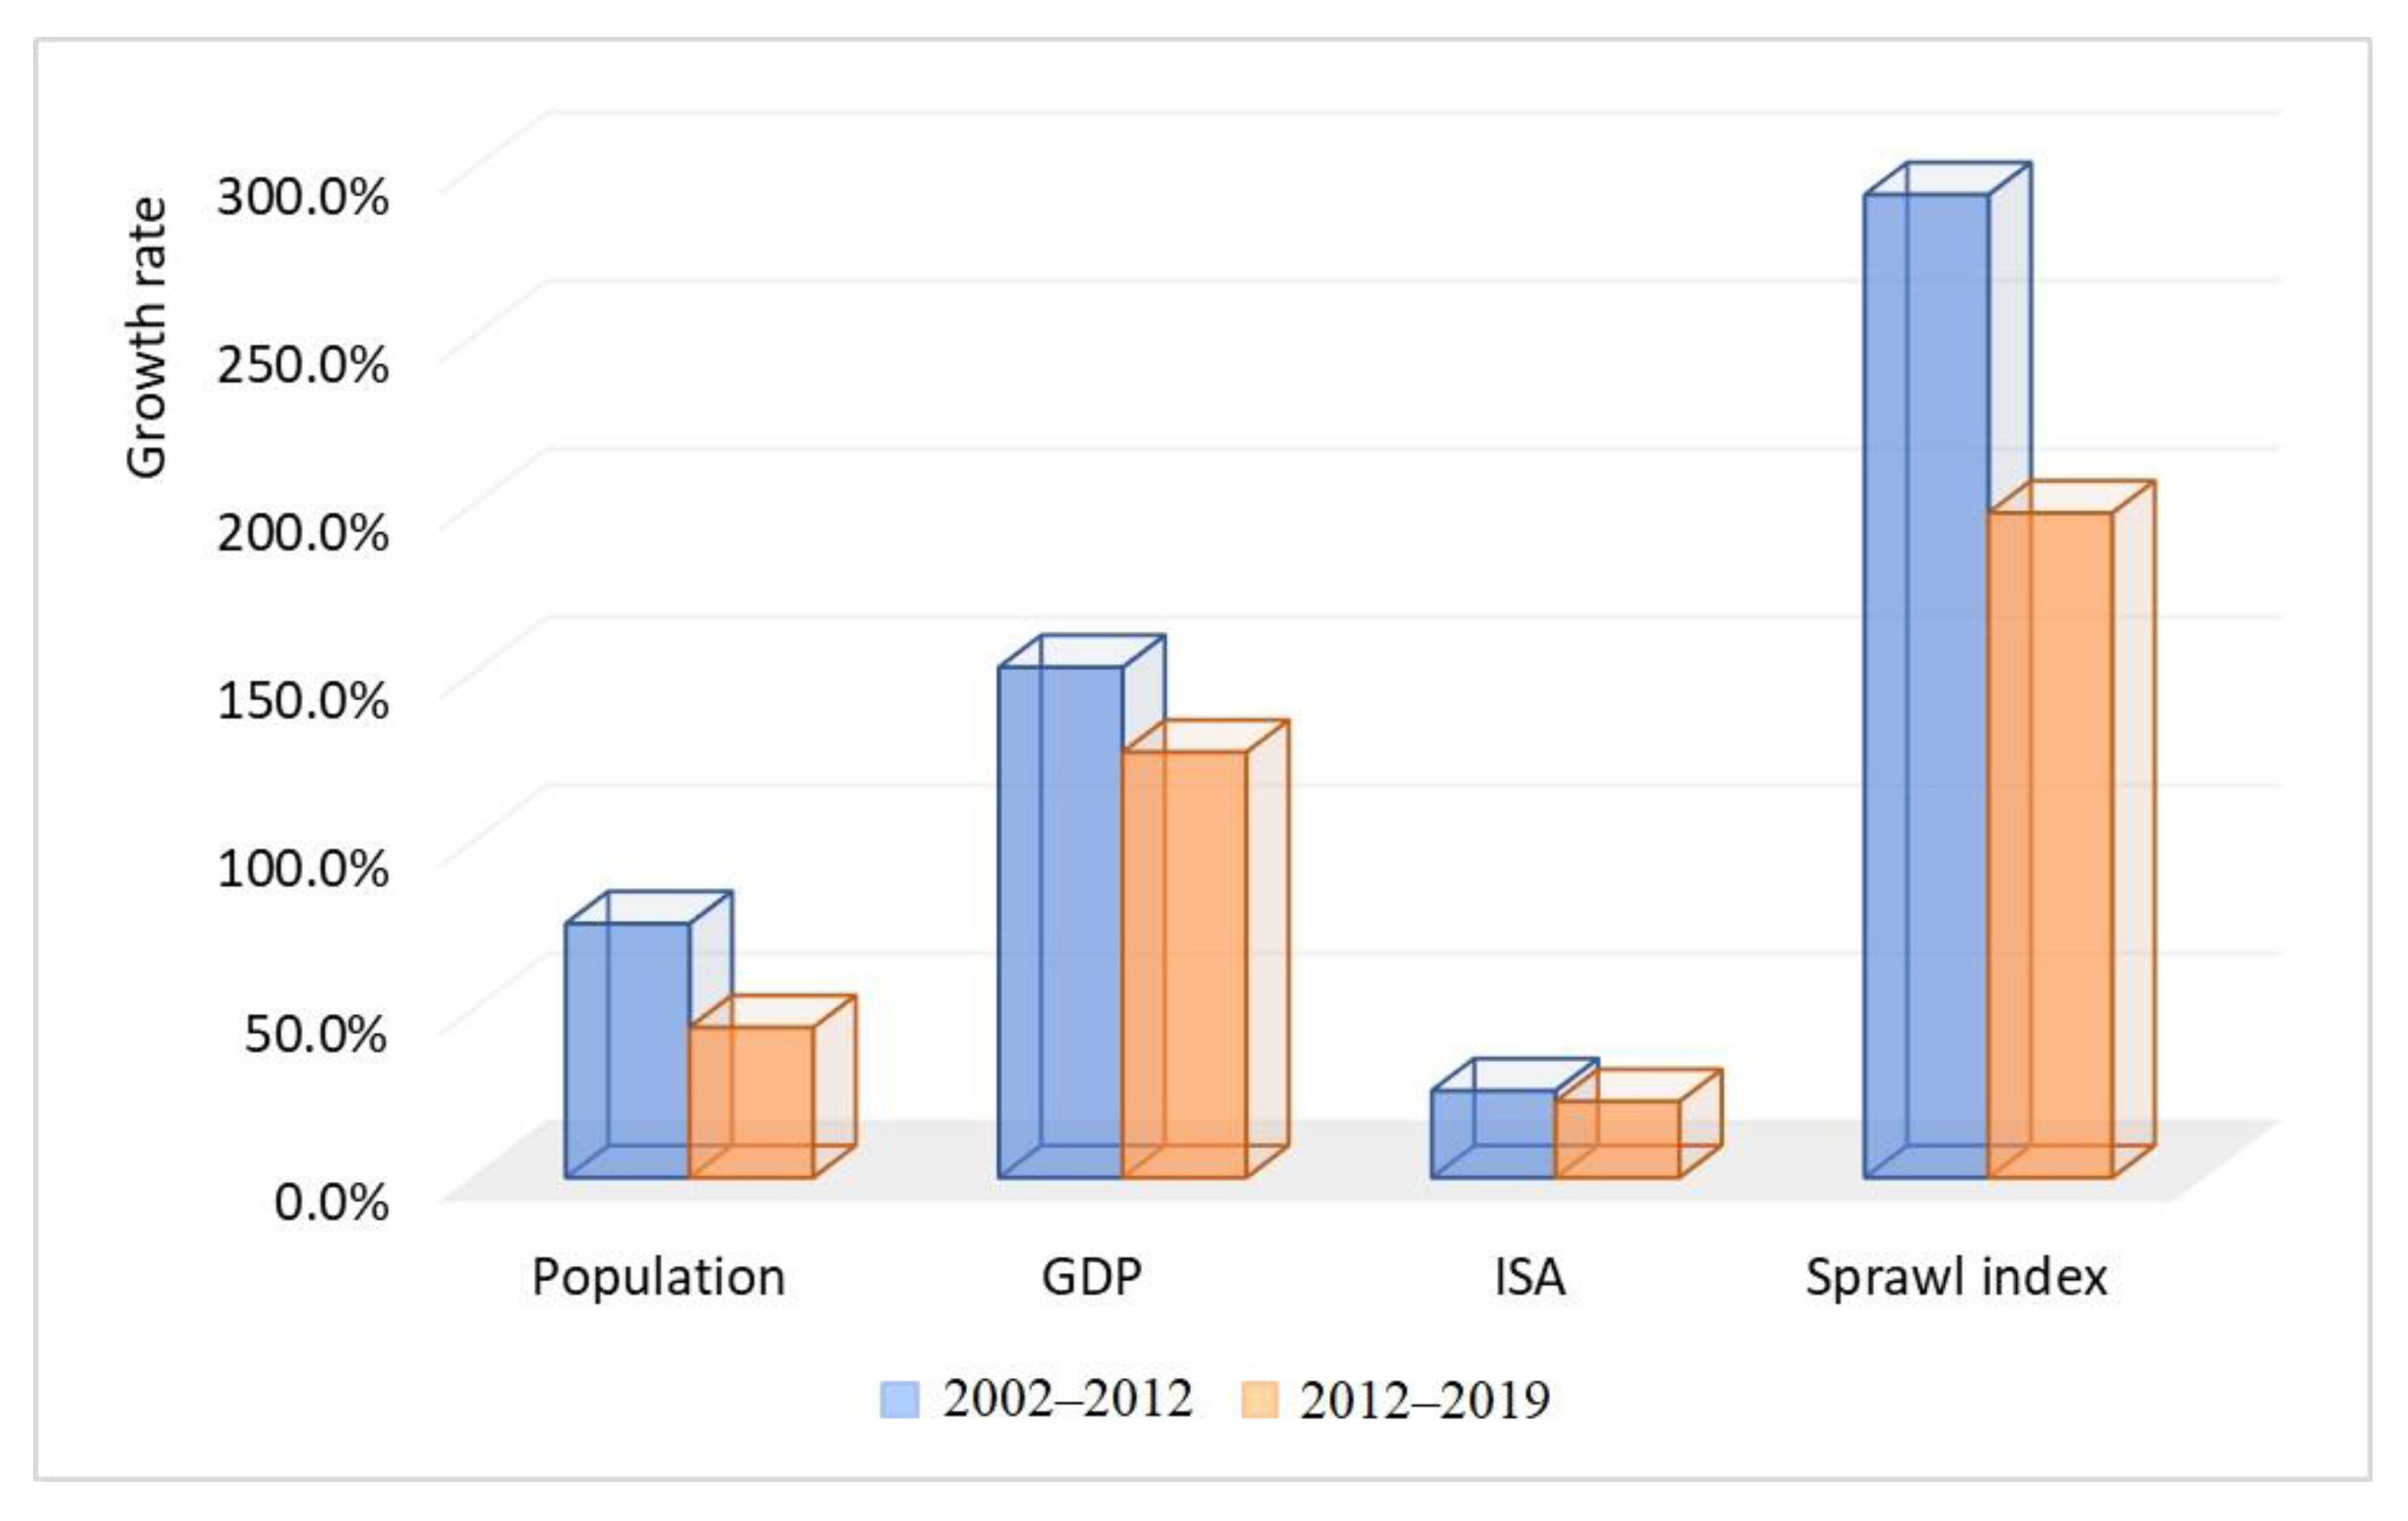
Urbanization in less developed countries is usually driven by the concentration of economic activities in cities. More employment opportunities and good educational and medical conditions in cities attract populations to urban agglomeration. Rapid growth of the population inevitably results in housing demand growth, thus promoting the expansion of urban land. The urban population of Dar es Salaam was 2.487 million in 2002 and increased to 4.365 million in 2012, with an average annual growth rate of 5.6%. In 2006, 80% of urban residents chose informal settlements as their place of residence, 10% higher than five years ago [40]. Due to the spontaneous development of informal settlements in African cities such as Dar es Salaam, the process of urban expansion was not completely synchronized with the process of population and economic growth. Using limited population data in 2002, 2012 and 2019, and the changes in simultaneous Gross Domestic Product (GDP) and ISA, we drew Figure 7 to analyze the relationships between the three. The GDP growth rate is much higher than the population and impervious surface growth, indicating that the city has a sustained expansion power. Because of the lack of infrastructure investment over a long period of time, the rate of urban land expansion lags behind the rate of population growth. The ratio of population growth rate to ISA growth is declining, from 2.9 in 2002–2012 to 2.0 in 2012–2019, indicating that urban overcrowding is easing.
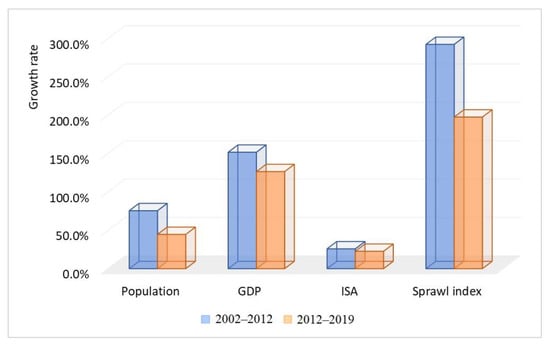
Figure 7.
Growth rates of population, GDP, ISA in Dar es Salaam during two periods (Sprawl index = Growth rate of population/Growth rate of ISA; The data of GDP and population are from National accounts statistics of Tanzania mainland tables 2019, and population in 2019 is calculated based on the data from World Urbanization Prospects 2018).
The rapid development of the economy is an important factor for the increase in impervious surfaces. Dar es Salaam’s total GDP reached 1671.02 million dollars in 2001. After development over almost twenty years, the GDP in 2019 climbed to 10328.07 million dollars, with an average annual growth rate of 10.6%. By using SPSS to analyze the correlation between GDP growth and impervious growth rate, the results were significantly correlated (R = 0.123, p < 0.05).
3.3.2. Traffic Factors
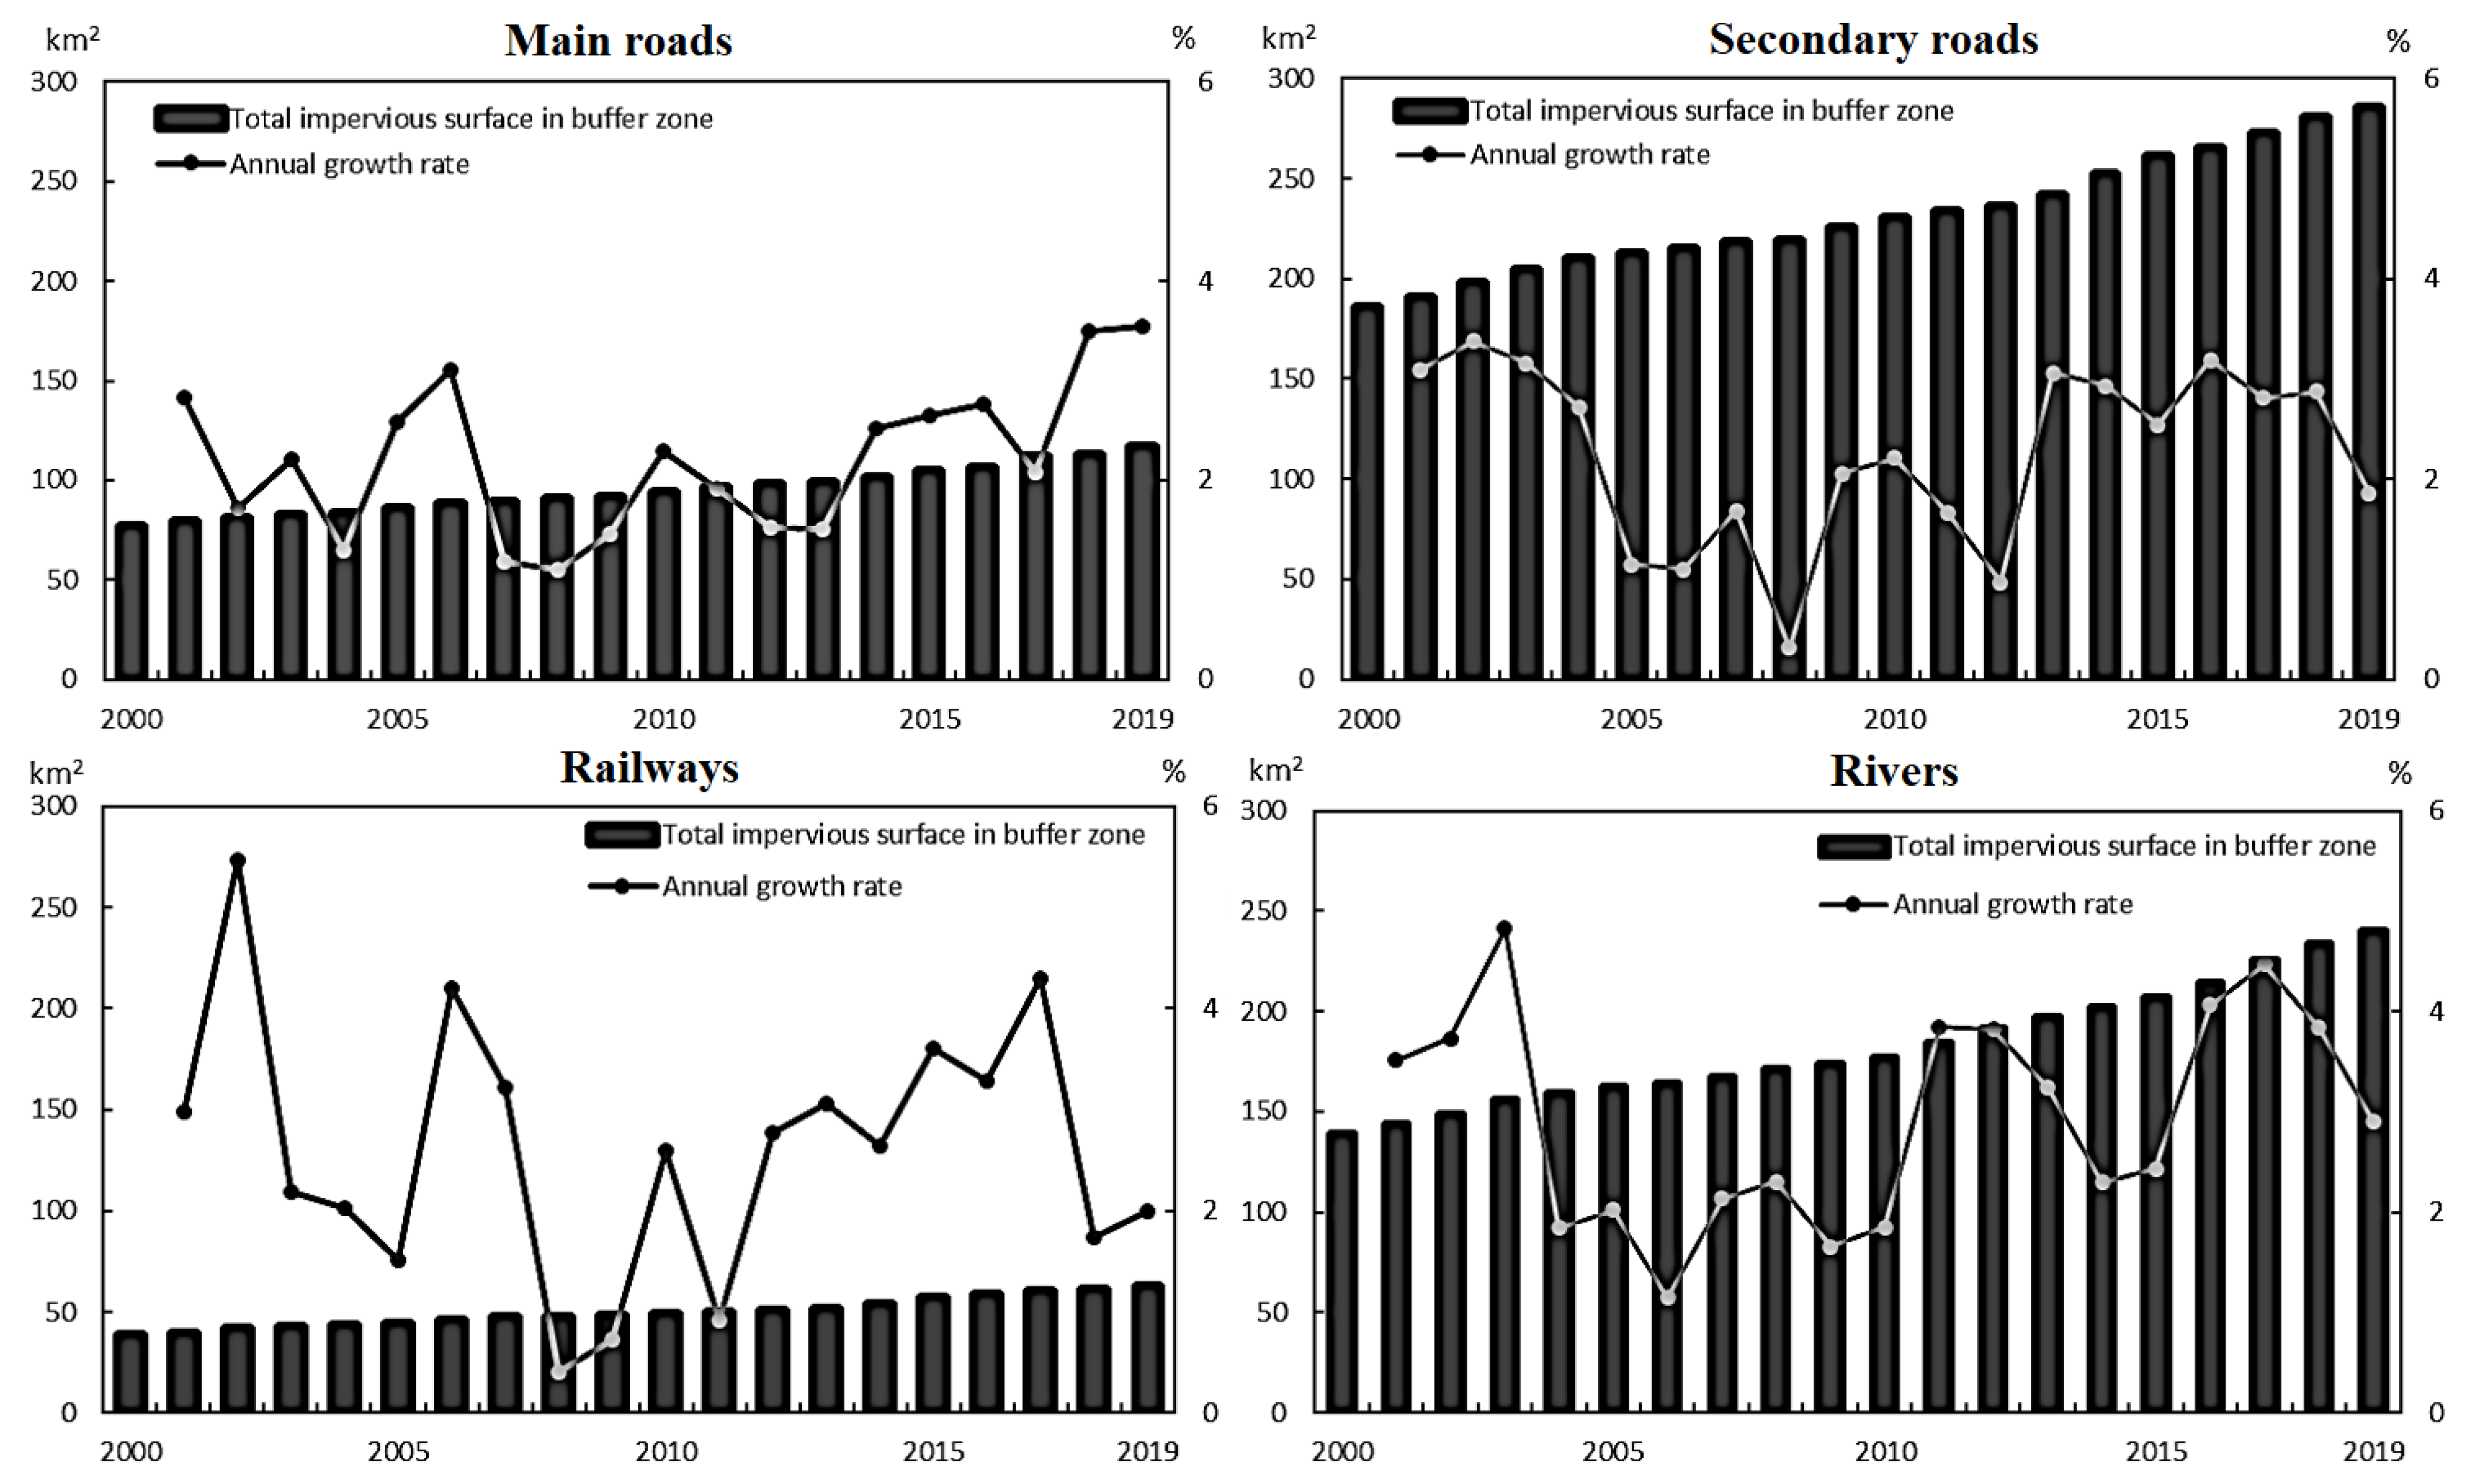
Considering the pattern of urban expansion along traffic lines and water supply lines as reported in the literature, we selected main roads, secondary roads, railways and rivers to extract impervious surface growth data within their 1 km buffer zone in this study, as shown in Figure 8. In terms of total amount, impervious surfaces along rivers and secondary roads increased significantly from 2000 to 2019, increasing by 101.5 km2 and 99.4 km2, respectively. They were higher than increments along the main roads (39.2 km2) and railways (23.9 km2). Among them, increments in 1 km buffer zone along the Pugu Highway, Tanzania–Zambia Railway and Kzinga River were the highest value for each category. In terms of average growth rate, rivers (3.9%) and railways (3.3%) had the fastest growth rates when compared to the remaining two categories. Most open spaces on both sides of the railway or rivers were not suitable for development and had either traffic safety risks or flood risks. The rapid expansion of the ISA in this area may aggravate the vulnerability of cities [25].
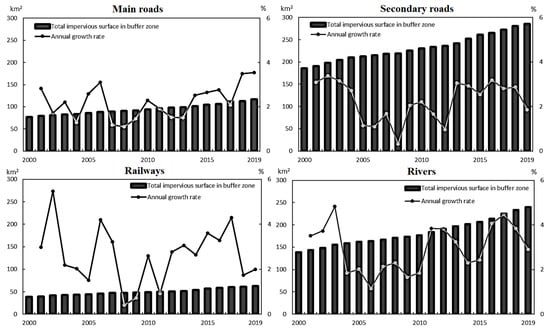
Figure 8.
Variation of impervious surface growth in 1 km buffer zone along traffic lines and rivers.
Along the traffic lines and rivers, there were various kinds of urban land gathering areas in Dar es Salaam, such as industrial, commercial and informal settlements, which are important for urban economic development. With the development of urban traffic networks, a large number of artificial surfaces spread along the lines of traffic network and rivers. In 2012, Dar es Salaam established a Bus Rapid Transit (BRT) system known as Dar Rapid Transit [41]. Since then, the growth rate of impervious surfaces in main highway buffer zones has increased year by year, except in 2017, and the new Dar Rapid Transit (DART Phase II was projected to begin in December 2018) will bring more pressure to the surrounding areas [22].
3.3.3. Natural Factors
Slope as an important geographic element was selected to analyze its relationship with impervious surface growth in this study. Slope data were extracted from DEM data and re-projected to an Albers Conical Equal Area projection with a pixel size of 500 m by 500 m. Then, all the grids covering the whole city were grouped by seven slope intervals, including 0–5°, 5–10°, 10–15°, 15–20°, 20–25°, 25–30° and 30–35°. The number of grid samples and correlation test results between slopes and percentage increase in ISA are shown in Table 5. According to the results, the correlation between slope and ISA growth rate was significant for areas with a slope value of 0–5° (R = 0.32, p < 0.05) and 5–10° (R = 0.233, p < 0.05), while it was not for the others with insufficient samples. This meant the flat terrains were conducive to the construction of buildings and infrastructures. In contrast, the areas with slope values higher than 10° were not appropriate for construction in the study area.

Table 5.
Pearson correlation analysis of slope and impervious surface growth rate.
3.3.4. Policy Factors
Urban development policy was another important factor affecting the spatial–temporal evolution of ISA. Since the 1990s, the government has implemented a number of market-oriented economic adjustment policies aimed at promoting the liberalization of the urban economy. Liberalization and deregulation have blurred the lines between formal and informal development and between public and private stakeholders, thus increasing the opportunities for government agencies and private power brokers to invest in real estate in urban fringe areas. However, some policies with high short-term benefits but lack of long-term strategic objectives promote the growth of urban informal settlements and aggravate urban sprawl. For example, the 1999 Land Act’s strong compensation rights made it politically and physically difficult to alter the local level haphazard urban form resulting from informal development [42]. With the promulgation of such a lack of enforcement policies, illegal expansion of informal settlements aggravated the disorderly expansion of land along major infrastructure lines and border areas. The southern boundary of Ilala and Temmeke districts were adjacent to other cities, far away from the city’s main roads, with a lack of public services. Meanwhile, these areas were more chaotic in land control during the first decade of the 21st century and became hot areas of illegal expansion. Dar es Salaam grew outward aimlessly, making it difficult to effectively establish the convenience of services and network effects of infrastructure.
In the mid-2000s the government initiated a neoliberal land formalization program [38]. Many construction projects were developed to integrate the surrounding chaotic plots, including mega housing projects, satellite-housing schemes, resettlements programs, millennium business parks and economic development zone (EDZ) projects. For example, in 2003, the Ministry of Land used the funds collected from the Ministry of Finance to implement a collection project covering more than 40,000 plots of land in order to develop satellite towns and control land speculation [43]. Coastal areas with excellent living environments have become important areas for the development of the real estate industry. The rapidly increasing residential areas were mainly composed of communities and villas, which met the new middle class’s demand for big houses in the suburbs. Although the vast majority of suburban development projects are achieved through the people’s efforts to build houses, it often took a family nearly a decade. The large number of houses being built off the coast of Dar es Salaam increase the vulnerability of the city to climate change [44].
Vague land property rights also increased the difficulty of urban planning and management. Land in Tanzania belongs to the state and it is divided into three categories: general land, rural land and reserved land. Land in urban areas belongs to general land, and both granted rights of occupancy and customary land rights land tenure systems are observed. Although the two rights have the same effect in law, it is difficult for customary land rights to obtain the benefits of the granted rights of occupancy. Because such land generally depends on ancestral inheritance and long-term occupation, its land rights are unclear. To this end, the government increased efforts to promote a land property rights approval registration system. In 2008 and 2013, the Dar es Salaam government investigated the construction land plots of the whole city. Taking Ilala District as an example, the demand for land parcels in 2008 and 2013 were 5343 and 6143, respectively. Finally, only 2600 and 2945 were approved, which were the largest in each district. These two years also became the years in which the impervious surface of the Ilala district surged significantly. At present, the efficiency of the government in handling affairs is still slow. The acquisition of the land supply of granted rights of occupancy is difficult, while the procedure for obtaining land through illegal means is relatively simple. Moreover, the increasing population means a large demand for land. Local governments are unable to effectively control land speculation and scalping and housing expansion, which further leads to the expansion of informal settlements and exacerbates urban sprawl.
In February 2018, JICA (Japan International Cooperation Agency) unveiled the draft of a new master plan for Dar es Salaam that focused on the improvement of human settlements and infrastructure for the city’s growing population. According to the draft master plan, the city was in need of better infrastructure and housing to cope with the increasing number of inhabitants [22]. Due to the proposal of a number of policies and plans, on the one hand, it accelerated the redevelopment of urban transportation, such as the new airport, overpasses and Dar es Salaam Rapid Transit (DART-I). On the other hand, it paid attention to the provision of public services and the construction of community facilities, which made the speed of urban construction faster in recent years. However, neither the proposed 2012–2032 master plan for Dar es Salaam nor the new 2018–2040 master plan by JICA have been approved by the Ministry of Land, Housing, and Human Settlement Development. Previous master plans continued to be top-down and have also not been effectively implemented by the municipal, ward and village level. Although policy factors can guide the direction of urban growth, they still cannot solve problems such as the disorderly spread of informal settlements and the effective allocation of infrastructure.
4. Conclusions
As one of the fastest urbanizing countries in Africa, Tanzania is undergoing a transformation and remodeling of urban spatial patterns and land structure. After investigating the annual spatial distribution of impervious surface in Dar es Salaam from 2000 to 2019, the evolution patterns and influencing factors are concluded. Firstly, the city has experienced steady growth from 2000 to 2005, slow growth from 2006 to 2010 and rapid growth after 2011, with annual growth rates of 2.9%, 1.4% and 3.3%, respectively. Secondly, the growth hotspots are mainly located along the major roads, but the areas with poor traffic have attracted more development after 2015, particularly between Bagamoyo road and Morogoro road, on the northern coast, and along secondary roads in Kigamboni district. However, the difference of the expansion intensity between the center and the periphery was not very significant, and the city showed obvious characteristics of low-density spreading growth. Thirdly, the changes of impervious surface are obviously affected by population, economy, traffic, nature and policy factors.
Rapid population and economic growth are the biggest driving force for the urban expansion of Dar es Salaam. From 2002 to 2012, the average annual growth rates of urban GDP and population were 15.7% and 5.6%, respectively, thus attracting more migrants to the cities to find their livelihoods. However, due to the insufficient acceptance capacity of the city, the accommodation demands of new residents cannot be solved, resulting in the rapid spread of urban expansion in the form of informal settlements. With the increasingly frequent economic and social activities in the informal settlements, the growth of urban population has been further promoted, thus making the disorderly spread of the city fall into a vicious circle.
The improvement of traffic conditions provides convenience for urban expansion and plays a certain guiding role in the space. The latest master plan of Dar es Salaam (1979) clearly stated that the urban built-up area should be expanded along the four main roads. The high accessibility of the main roads and the planning arrangements make the urban construction before 2000 mainly developed along the main roads. As the Tanzanian state-owned transportation sector was privatized, several secondary roads have been added between the four main roads in the city. The total length of the urban road network has increased from 1950 km in 2003 to 3118 km in 2013, with more than half of the roads open to traffic all year round. Traffic conditions in the areas slightly farther from the main roads have been greatly improved, and the accessibility between the main roads and urban fringe areas has been improved. The rapid and low-density infilled sprawl pattern between main roads has replaced the previous axis sprawl pattern, which has a larger spreading scope and a faster urban expansion speed. The areas with higher ISA between main roads begin to gather and gradually form a scale.
In the German colonial period, Dar es Salaam formed a spatial development structure, which was radiating outward from the port. The area within 10 km of the port has the highest development degree, and the impervious rate of most of the areas was higher than 80% in 2000, with less potential for development. During the research period in this paper, the area within 10 to 20 km southwest of the port had the fastest growth rate, which is located between the three main roads of Kilwa, Pugu and Morogoro Road. A small number of high growth areas are sporadically distributed and lack agglomeration effects, and the quality of growth in urban border areas is low. In two decades, the OIEA of most plots has increased by more than 40%, and the development level is close to saturation. Since many city problems have not been improved, infilled sprawl pattern is still the main spatial expansion pattern for Dar es Salaam in the future. As the construction potential of the southwest area of the city is decreasing, two areas 10 km away from the port will become the new expansion directions of the city, namely the area between the two sides of Bagamoyo Road in the northwest and the secondary road in the southeast. Coastal areas will also become potential areas for urban sprawl in the future, which requires the government to strengthen the control of the coastal area in advance, provide public services to improve the living environment and traffic conditions and protect the fragile ecological environment. In addition, the government must simplify the land approval process and strengthen the circulation of land market. The government should increase the number of approval cases for legal land and optimize and regulate the layout of approved land in space, so as to guide the expansion of informal settlements and solve a series of problems caused by the disorderly development of cities.
Although this paper enriches the latest and continuous years of urban expansion research in Dar es Salaam, there are still some limitations. In the process of reclassifying the 1 km resolution night light data to 500 m, some errors will be caused. Meanwhile, the 500 m resolution MODIS data has limitations in studies at the city scale despite its high time resolution convenient for continuous year monitoring, which may lead to overestimation of the results of impervious surface in this paper. In addition, the impervious surface area calculated in this paper should be larger than the conventional built-up area, since it involves all the settlements including those scattered in the peri-urban areas. This difference might be considered in a comparison study. Thus, in future studies, vegetation data with high accuracy and more annual intervals should be selected as basic data, and the method of data calibration should be improved by using authoritative land data as a calibration data source. At the research spatial scale, the study area will extend to a larger scale area such as the African Mainland to better reflect the temporal resolution advantage of the method.
Author Contributions
Conceptualization, Y.Y. and S.S.C.; methodology, Y.Y. and S.S.C.; software, Y.Y. and Y.M.; validation, Y.Y.; writing—original draft preparation, Y.Y.; writing—review and editing, S.S.C. and Y.M.; supervision, S.S.C. funding acquisition, S.S.C. All authors have read and agreed to the published version of the manuscript.
Funding
This research was supported by the collaborative project between China Ministry of Science and Technology and United Nations Environment Programme (No. 2018YFE0105900), the Sino-Africa Joint Research Centre, Chinese Academy of Sciences (NO. SAJC201609), Jiangsu province “One Belt And One Road” technical cooperation project (No. BZ2018057), and National Natural Sciences Foundation of China (No. 41771140).
Institutional Review Board Statement
Not applicable.
Informed Consent Statement
Not applicable.
Data Availability Statement
The data presented in this study are available on request from the corresponding author.
Conflicts of Interest
The authors declare no conflict of interest.
References
- Chirisa, I. Population growth and rapid urbanization in Africa: Implications for sustainability. J. Sustain. Dev. Afr. 2008, 10, 361–394. [Google Scholar]
- Yaw, O.C.; Kafui, O.; Charles, P. Analyzing growth patterns of Greater Kumasi metropolitan area using gis and multiple regression techniques. J. Sustain. Dev. 2014, 7, 13–31. [Google Scholar] [CrossRef]
- Asongu, S.A.; Agboola, O.M.; Alola, A.A.; Bekun, F.V. The criticality of growth, urbanization, electricity and fossil fuel consumption to environment sustainability in africa. Sci. Total Environ. 2019, 712, 136376. [Google Scholar] [CrossRef]
- Oranje, M.; Huyssteen, E.V.; Maritz, J. Rapid urbanisation to non-metropolitan urban South Africa: A call for accrediting credible ‘informal’ life-enhancing responses and institutions. Cities 2020, 96, 102487. [Google Scholar] [CrossRef]
- Cohen, J.E. Human population: The next half century. Science 2003, 302, 1172–1175. [Google Scholar] [CrossRef]
- Montgomery, M.R. The urban transformation of the developing world. Science 2008, 319, 761–764. [Google Scholar] [CrossRef]
- Potts, D. Urbanization in Africa. In International Encyclopedia of the Social & Behavioral Sciences, 2nd ed.; Elsevier: Amsterdam, The Netherlands, 2015; Volume 29, pp. 965–972. [Google Scholar] [CrossRef]
- Wolff, E.; Grippa, T.; Forget, Y.; Georganos, S.; Vanhuysse, S.; Shimoni, M.; Linard, C.M. Diversity of urban growth patterns in Sub-Saharan Africa in the 1960–2010 period. Afr. Geogr. Rev. 2020, 39, 45–57. [Google Scholar] [CrossRef]
- Linard, C.; Tatem, A.J.; Gilbert, M. Modelling spatial patterns of urban growth in Africa. Appl. Geogr. 2013, 44, 23–32. [Google Scholar] [CrossRef]
- Xu, G.; Dong, T.; Cobbinah, P.B.; Jiao, L.; Sumari, N.S.; Chai, B. Urban expansion and form changes across african cities with a global outlook: Spatiotemporal analysis of urban land densities. J. Clean. Prod. 2019, 224, 802–810. [Google Scholar] [CrossRef]
- Adhikari, P.; Beurs, K.M.D. Growth in urban extent and allometric analysis of west African cities. J. Land Use Sci. 2017, 12, 105–124. [Google Scholar] [CrossRef]
- Gong, P.; Wang, J.; Yu, L.; Zhao, Y.; Zhao, Y.; Liang, L.; Chen, J. Finer resolution observation and monitoring of global land cover: First mapping results with Landsat TM and ETM+ data. Int. J. Remote Sens. 2013, 34, 2607–2654. [Google Scholar] [CrossRef]
- Karolien, V.; Anton, V.R.; Maarten, L.; Eria, S.; Paul, M. Urban growth of Kampala, Uganda: Pattern analysis and scenario development. Landsc. Urban Plan. 2012, 106, 199–206. [Google Scholar] [CrossRef]
- Acheampong, R.A.; Agyemang, F.S.K.; Abdul-Fatawu, M. Quantifying the spatio-temporal patterns of settlement growth in a metropolitan region of ghana. Geojournal 2017, 82, 823–840. [Google Scholar] [CrossRef]
- Hou, H.; Estoque, R.C.; Murayama, Y. Spatiotemporal analysis of urban growth in three African capital cities: A grid-cell-based analysis using remote sensing data. J. Afr. Earth Sci. 2016, 123, 381–391. [Google Scholar] [CrossRef]
- Briggs, J.; Mwamfupe, D. Peri-urban developm.ent in an era of structural adjustment in Africa: The city of Dar es salaam, Tanzania. Urban Stud. 2000, 37, 797–809. [Google Scholar] [CrossRef]
- Mundia, C.N.; Aniya, M. Analysis of land use/cover changes and urban expansion of Nairobi city using remote sensing and GIS. Int. J. Remote Sens. 2005, 26, 2831–2849. [Google Scholar] [CrossRef]
- Mundia, C.N.; Murayama, Y. Modeling spatial processes of urban growth in African cities: A case study of Nairobi city. Urban Geogr. 2013, 31, 259–272. [Google Scholar] [CrossRef]
- Boadi, K.; Kuitunen, M.; Raheem, K.; Hanninen, K. Urbanization without development: Environmental and health implications in african cities. Environ. Dev. Sustain. 2005, 7, 465–500. [Google Scholar] [CrossRef]
- Hojas-Gascón, L.; Eva, H.D.; Ehrlich, D.; Pesaresi, M.; Achard, F.; Garcia, J. Urbanization and forest degradation in east Africa—A case study around Dar es Salaam, Tanzania. In Proceedings of the 2016 IEEE International Geoscience and Remote Sensing Symposium (IGARSS), Beijing, China, 10–15 July 2016; pp. 7293–7295. [Google Scholar] [CrossRef]
- Angel, S.; Parent, J.; Civco, D.L.; Blei, A.; Potere, D. The dimensions of global urban expansion: Estimates and projections for all countries, 2000–2050. Prog. Plan. 2011, 75, 53–107. [Google Scholar] [CrossRef]
- Peter, L.L.; Yang, Y. Urban planning historical review of master plans and the way towards a sustainable city: Dar es salaam, Tanzania. Front. Archit. Res. 2019, 8, 359–377. [Google Scholar] [CrossRef]
- Congedo, L.; Macchi, S. The demographic dimension of climate change vulnerability: Exploring the relation between population growth and urban sprawl in Dar es Salaam. Curr. Opin. Environ. Sustain. 2015, 13, 1–10. [Google Scholar] [CrossRef]
- Gombe, K.E.; Asanuma, I.; Park, J.G. Quantification of Annual Urban Growth of Dar es Salaam Tanzania from Landsat Time Series Data. Adv. Remote Sens. 2017, 6, 175–191. [Google Scholar] [CrossRef]
- Kombe, W.J. Land use dynamics in peri-urban areas and their implications on the urban growth and form: The case of Dar es Salaam, Tanzania. Habitat Int. 2005, 29, 113–135. [Google Scholar] [CrossRef]
- Mkalawa, C.C.; Haixiao, P. Dar es Salaam city temporal growth and its influence on transportation. Urban Plan. Transp. Res. 2014, 2, 423–446. [Google Scholar] [CrossRef]
- Korah, I.; Matthews, T.; Tomerini, D. Characterising spatial and temporal patterns of urban evolution in Sub-Saharan Africa: The case of Accra, Ghana. Land Use Policy 2019, 87, 104049. [Google Scholar] [CrossRef]
- Wu, C.; Murray, A.T. Estimating impervious surface distribution by spectral mixture analysis. Remote Sens. Environ. 2003, 84, 493–505. [Google Scholar] [CrossRef]
- Wang, J.; Su, G.C.; Kuang, W.H.; Chi, W.F.; Lu, D.S. Spatial and Temporal Patterns Analysis of Impervious Surface in Megacity: A Case Study of Beijing. Bull. Surv. Mapp. 2014, 445, 90–94. [Google Scholar] [CrossRef]
- Jantz, P.; Goetz, S.; Jantz, C. Urbanization and the loss of resource lands in the Chesapeake bay watershed. Environ. Manag. 2005, 36, 808–825. [Google Scholar] [CrossRef]
- Zhang, Q.; Schaaf, C.; Seto, K.C. The vegetation adjusted NTL urban index: A new approach to reduce saturation and increase variation in nighttime luminosity. Remote Sens. Environ. 2013, 129, 32–41. [Google Scholar] [CrossRef]
- Yang, Y.; He, C.; Zhang, Q.; Han, L.; Du, S. Timely and accurate national-scale mapping of urban land in china using defense meteorological satellite program’s operational Linescan system nighttime stable light data. J. Appl. Remote Sens. 2013, 7, 073535. [Google Scholar] [CrossRef]
- Xie, H.J.; Li, C.W.; Zhang, Y.J.; Song, A.Y. Evolution pattern of impervious surface in the Yuqiao reservoir watershed, Tianjin, China during the process of urbanization. Chin. J. Appl. Ecol. 2016, 27, 1069–1076. [Google Scholar] [CrossRef]
- Lu, D.; Tian, H.; Zhou, G.; Ge, H. Regional mapping of human settlements in southeastern china with multisensor remotely sensed data. Remote Sens. Environ. 2008, 112, 3668–3679. [Google Scholar] [CrossRef]
- Congedo, L.; Munafò, M. Urban Sprawl as a Factor of Vulnerability to Climate Change: Monitoring Land Cover Change in Dar es Salaam. In Climate Change Vulnerability in Southern African Cities; Springer: Cham, Switzerland, 2014; Volume 1, pp. 73–88. [Google Scholar] [CrossRef]
- Kuang, W.H. Mapping global impervious surface area and green space within urban environments. Sci. China Earth Sci. 2019, 62, 1591–1606. Available online: http://lib.cqvip.com/Qikan/Article/Detail?id=74688871504849574948484855 (accessed on 25 April 2019). [CrossRef]
- Kuang, W.H.; Liu, J.Y.; Zhang, Z.X.; Lu, D.S.; Xiang, B. Spatiotemporal dynamics of impervious surface areas across china during the early 21st century. Chin. Sci. Bull. 2012, 58, 1691–1701. [Google Scholar] [CrossRef]
- Ridd, M.K. Exploring a V-I-S (vegetation-impervious surface-soil) model for urban ecosystem analysis through remote sensing. Int. J. Remote Sens. 1995, 16, 2165–2185. [Google Scholar] [CrossRef]
- Ward, D.; Phinn, S.R.; Murray, A.T. Monitoring growth in rapidly urbanizing areas using remotely sensed data. Prof. Geogr. 2010, 52, 371–386. [Google Scholar] [CrossRef]
- Zhang, J.Q.; Chen, S.; Damas, W.M. Characteristics and influence factors of urban sprawl of Dar es Salaam from 2002 to 2012. J. Univ. Chin. Acad. Sci. 2018, 35, 663–673. [Google Scholar] [CrossRef]
- Kombe, W.J. Land acquisition for public use, emerging conflicts and their socio-political implications. Int. J. Urban Sustain. Dev. 2010, 2, 45–63. [Google Scholar] [CrossRef]
- Sheuya, S. Urban poverty and housing transformations in informal settlements: The case of Dar-es-Salaam, Tanzania. Int. Dev. Plan. Rev. 2009, 31, 81–108. [Google Scholar] [CrossRef]
- Kironde, J.M.L. Good Governance, Efficiency and the Provision of Planned Land for Orderly Development in African Cities: The Case of the 20,000 Planned Land Plots Project in Dar es Salaam, Tanzania. Curr. Urban Stud. 2015, 3, 348–367. [Google Scholar] [CrossRef]
- Mercer, C. Landscapes of extended ruralisation: Postcolonial suburbs in Dar es Salaam, Tanzania. Trans. Inst. Br. Geogr. 2017, 42, 72–83. [Google Scholar] [CrossRef]
Disclaimer/Publisher’s Note: The statements, opinions and data contained in all publications are solely those of the individual author(s) and contributor(s) and not of MDPI and/or the editor(s). MDPI and/or the editor(s) disclaim responsibility for any injury to people or property resulting from any ideas, methods, instructions or products referred to in the content. |
© 2023 by the authors. Licensee MDPI, Basel, Switzerland. This article is an open access article distributed under the terms and conditions of the Creative Commons Attribution (CC BY) license (https://creativecommons.org/licenses/by/4.0/).

