Article

Analysis of Spatial-Temporal Changes and Driving Forces of Desertification in the Mu Us Sandy Land from 1991 to 2021

China Aero Geophysical Survey and Remote Sensing Center for Natural Resources, Beijing 100083, China
*
Authors to whom correspondence should be addressed.
Sustainability 2023, 15(13), 10399; https://doi.org/10.3390/su151310399
Submission received: 26 April 2023 / Revised: 9 June 2023 / Accepted: 26 June 2023 / Published: 1 July 2023
(This article belongs to the Special Issue Land-Use Change and Ecosystem Services)

Abstract

:
Desertification is one of the most critical environmental and socioeconomic issues in the world today. Located in the transitional region between the desert and the Loess Plateau, the Mu Us Sandy Land is one of the nine most environmentally sensitive areas in the world. Remote sensing provides an effective technical method for desertification monitoring. In order to analyze the spatiotemporal distribution of desertification in the Mu Us Sandy Land from 1991 to 2021, the “MSAVI-Albedo” model was employed to extract desertification data in 1991, 2002, 2009 and 2021. The clustering characteristics of desertification were analyzed based on Moran’s I statistic. Subsequently, the driving forces in desertification changes were investigated using a geographical detector to analyze the influence of soil, meteorology, and topography on desertification. Additionally, the impact of meteorological and human factors on desertification change in the Mu Us Sandy Land was assessed. From 1991 to 2021, the degree of desertification of the Mu Us Sandy Land showed an overall decreasing trend, and the percentage of land classified as undergoing extremely severe, severe, moderate and mild desertification was improved by 86.11%, 81.82%, 52.5% and 37.42%, respectively. The proportion of land classified as undergoing extremely severe desertification decreased from 29.22% to 5.62%, and the proportion of land undergoing no desertification increased from 4.16% to 18.33%. At the same time, the desertification center shifted westward, and the desertification distribution showed a clustering trend. It is known that different factors affect the formation and distribution of desertification in the Mu Us Sandy Land in the following order: soil, meteorology, and topography. Over the past 30 years, the mean annual temperature and annual precipitation increased at rates of 0.01871 °C/a and 1.0374 mm/a, respectively, while the mean annual wind speed decreased at a rate of 0.00945 m/s·a. These changes provided more favorable natural conditions for vegetation growth and sand fixation. Human factors, such as economic development, agriculture and animal husbandry practices, and the policy of returning farmland to forest (grassland) also had a significant impact on the desertification process, leading to a year-by-year improvement in the ecological environment of the Mu Us Sandy Land.

1. Introduction

Desertification refers to the deterioration of land surface vegetation due to the combined effects of natural forces and human activities in arid or semi-arid regions, leading to varying degrees of exposed sandy land and the formation or expansion of deserts. This poses a threat to the human living environment and impacts the sustainable development of society [1,2]. China is among the countries with the largest area and degree of desertification. The desertification has caused substantial economic losses to the nation, and sandstorm events also negatively affect residents’ health [3,4].
To address the threat posed by desertification to the national ecology and economy, China began implementing major ecological protection projects, such as the Three-North Shelter Forest Project [5,6], in the 1980s. China’s efforts to prevent desertification have since entered a stage of rapid development. After 2000, anti-desertification investment in China increased significantly, the desertification area began to decrease, and the trend of ecological deterioration began to be curbed. In 2018, China increased investment in ecological restoration, achieving remarkable results in its anti-desertification efforts, which had gradually shifted from artificial vegetation construction to near-natural restoration [7]. According to the results of China’s fifth desertification monitoring project [8], the desertification area had continuously decreased for many years, and the degree of desertification had changed from extremely severe to mild. The ecological condition of sandy areas in China has improved significantly [9]. However, in arid and semi-arid areas, the conservation rate and windbreak functions of ecological protection forests are far below expectations, regional water consumption is increasing, and the phenomenon of desertification is recurring [10]. Ecological problems in arid areas still must be addressed [11].
In 1992, the Mu Us Sandy Land was defined by UNESCO as one of the nine most environmentally sensitive areas in the world [12]. The Mu Us Sandy Land is a typical desert, formed by the interaction of natural environment changes and human living activities [13], in which desertification control has been started since the 1980s [14]. According to statistics from the Shaanxi Forestry Administration, the land control rate of the Mu Us Sandy Land had reached more than 93.24% by April 2020, and it had become a national and even global model of desertification control. However, there are still some problems in the Mu Us Sandy Land, such as a fragile ecological environment, high intensity of agriculture and animal husbandry development, and destruction of the ecological environment by the mining industry [15]. Therefore, it is necessary to analyze the transformation mode and the causes of desertification in the Mu Us Sandy Land to provide a scientific basis for ecological protection and restoration of other sandy land.
Remote sensing can provide multi-temporal and large-scale data support for desertification research, enabling retrospective monitoring and analysis of the evolution of desertification [16]. Since the United Nations Conference on Desertification formally raised the issue of land desertification in 1977, research on global and regional desertification has been conducted. In the early 1980s, China began to widely apply remote sensing technology to monitor and assess desertification. Zhu et al. built an index system based on a combination of surface morphology and changes in geographical landscape and ecological parameters, conducted quantitative and qualitative evaluations of desertification in China based on remote sensing images, and applied their system to desertification control [17,18,19]. Since then, with the improvement of remote sensing image quality and the development of data processing technology, quantitative desertification analysis methods have been gradually formed based on visual interpretation and supervised classification [20,21,22]. However, remote sensing and supervised classification struggle to accurately capture spectral information on different degrees of desertification, which affects classification accuracy. In recent years, many studies have used a single index (e.g., NDVI, MSAVI) to assess desertification [23,24,25]. However, due to the complex causes of the evolution of desertification, a single index cannot fully reflect desertification [26]. The Albedo-NDVI model, based on the negative correlation between Albedo and NDVI, provides an effective method for quantitative analysis of desertification [27], and this method has been used in many desertified lands, such as the Moulouya basin [28], central Mexico [29], the Mongolian plateau [30], and the Yellow River in China [31]. There are few studies on the evolution of the desertification of the Mu Us Sandy Land, and short-time-scale desertification research has practical significance for assessing the desertification control effect.
Based on the significant correlation between surface radiation and vegetation cover, this paper utilized the modified soil adjusted vegetation index–Surface Albedo (MSAVI-Albedo) model to reflect the distribution and change of desertification in the Mu Us Sandy Land in 1991, 2002, 2009 and 2021. It can be seen that the degree of desertification of the Mu Us Sandy Land showed an overall decreasing trend. The factors affecting the formation and change of the Mu Us Sandy Land mainly include natural factors (meteorology, topography, soil) and human factors (government policy, economic development, urban construction, population expansion, agricultural and animal husbandry development). This paper provides an important reference for clarifying the formation mechanism of desertification and identifying effective control methods.

2. Study Area and Data Sources
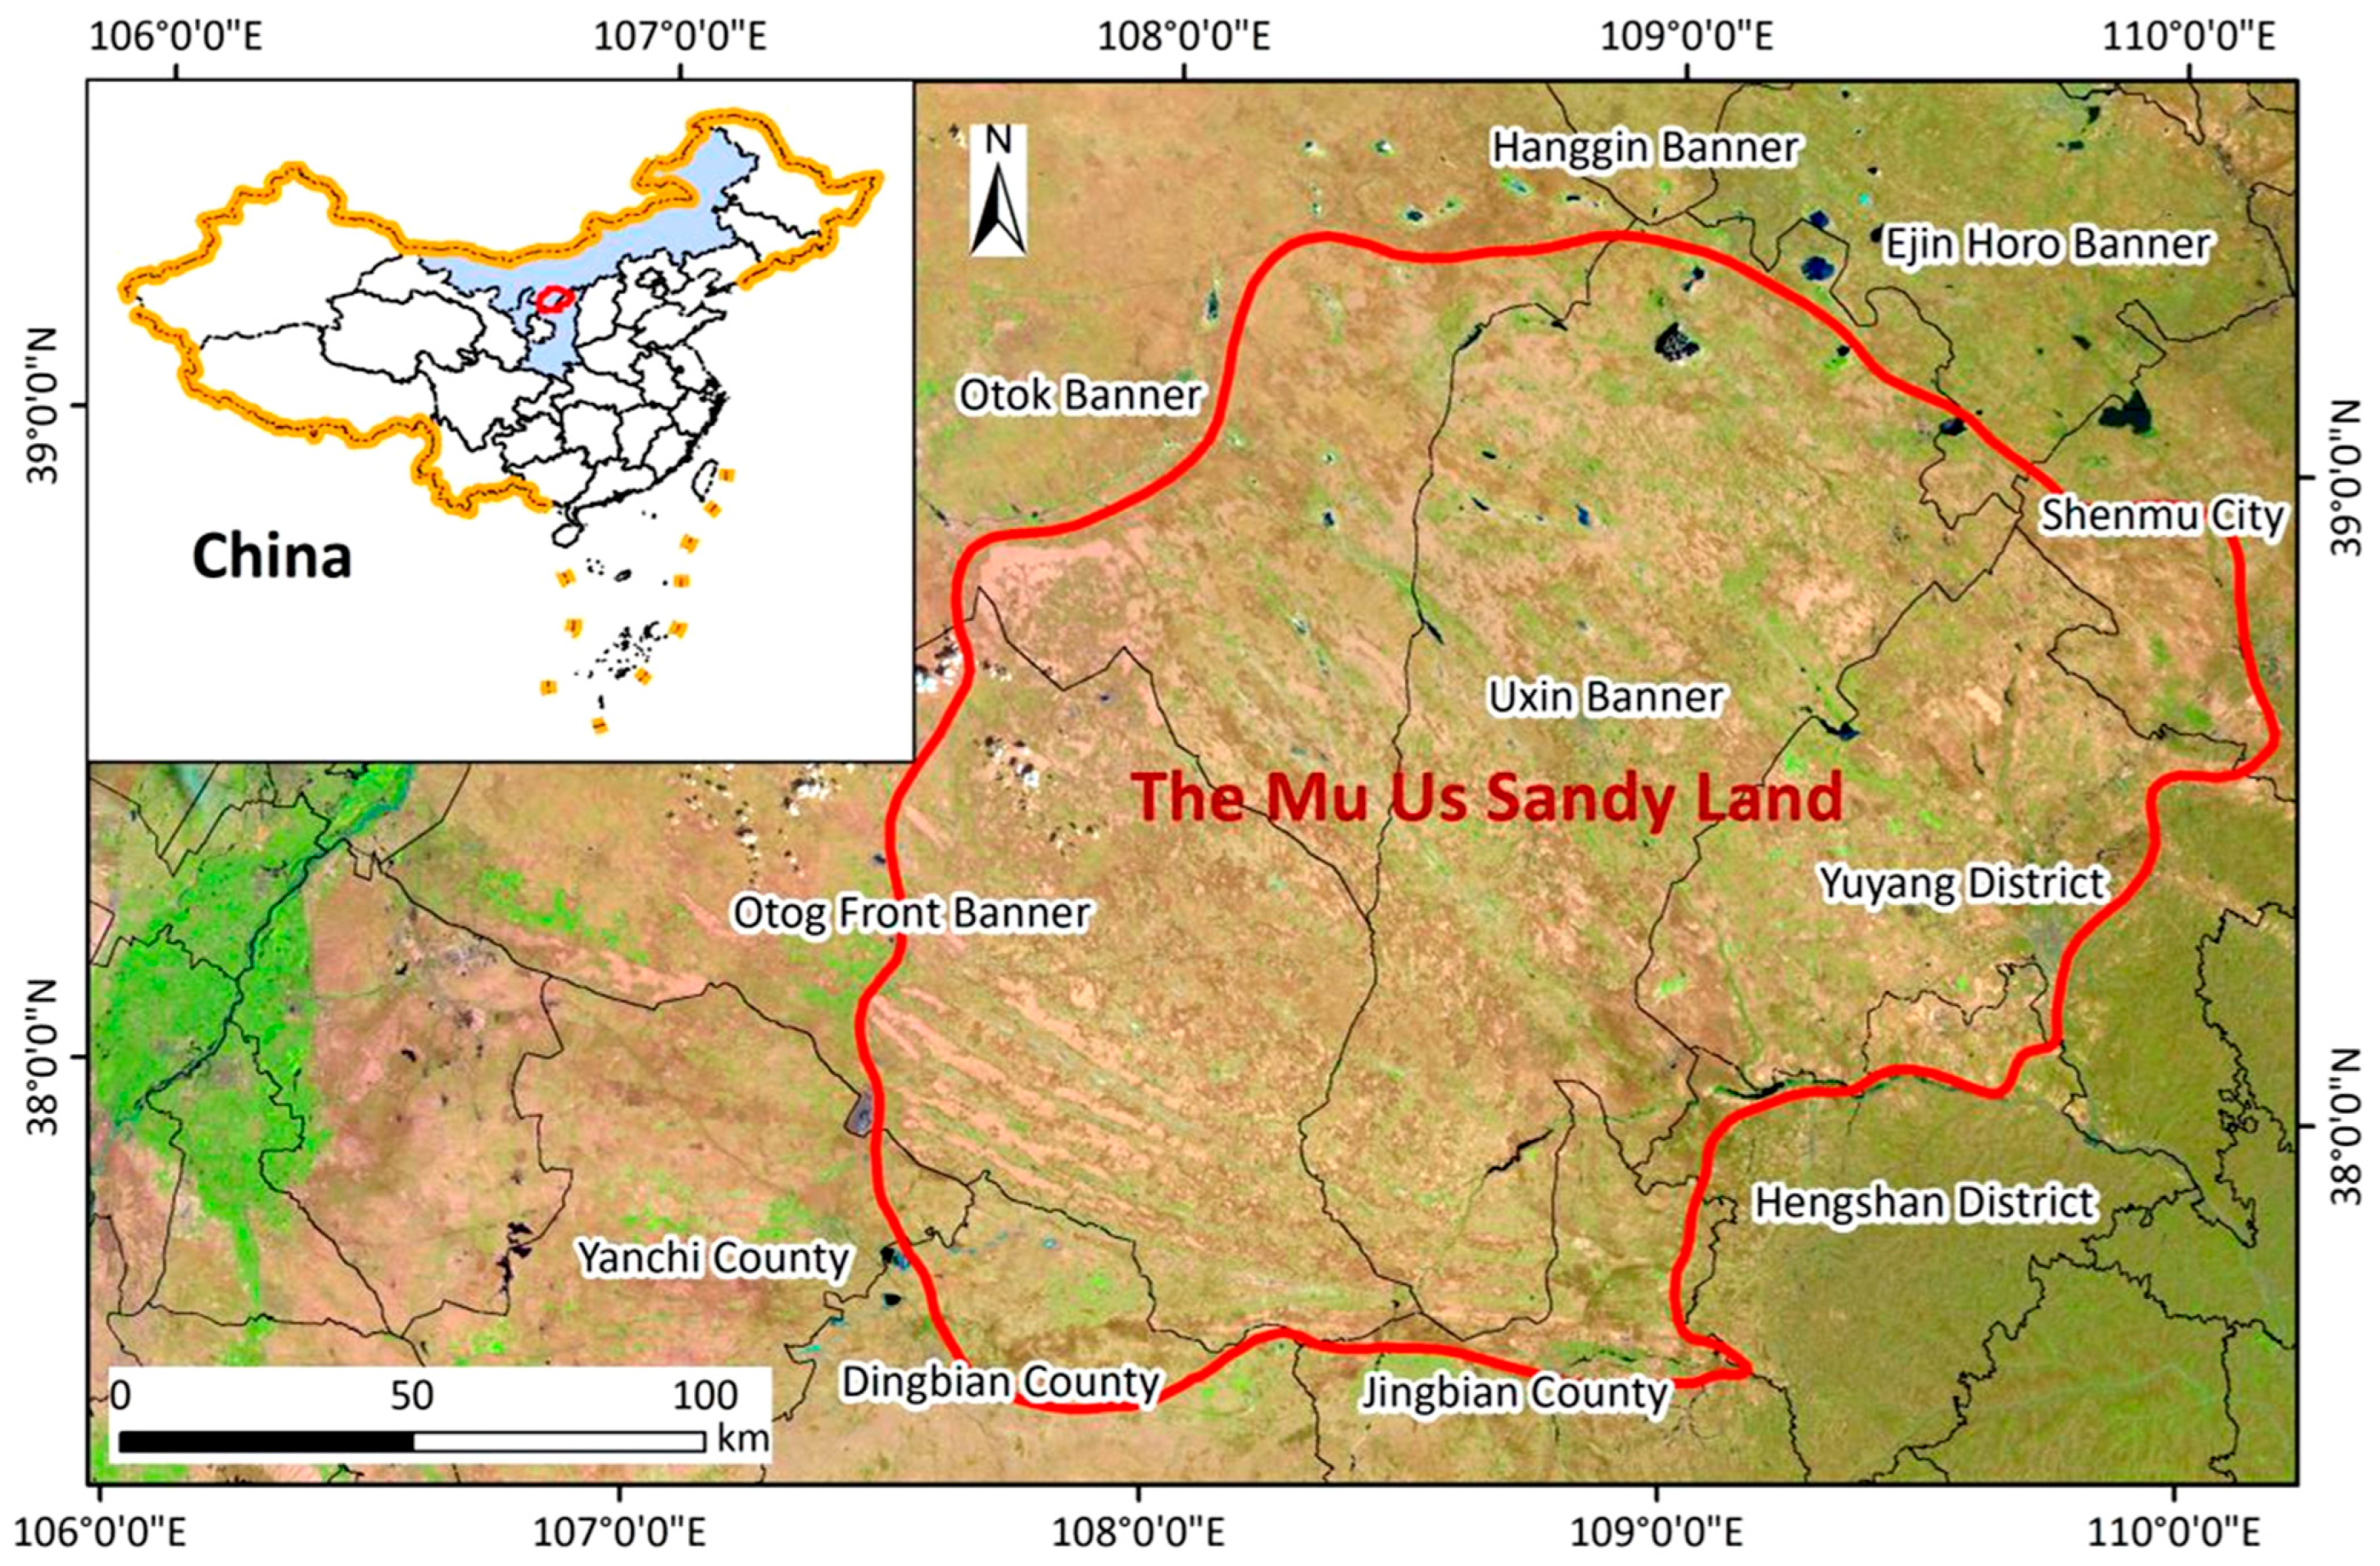
2.1. Study Area

The Mu Us Sandy Land (37°27.5′–39°22.5′ N, 107°20′–110°30′ E), as shown in Figure 1, is situated in the southeastern part of the Ordos Plateau and the northern part of the Loess Plateau, and is one of four sandy land areas in China [32]. Located in the middle of the agricultural and pastoral ecotone, Mu Us Sandy Land is a transitional region between the desert and the Loess Plateau, one of the main sources of sandstorms affecting Beijing, and a key area for governance of ecological security patterns in China [33]. It stretches approximately 100 km from east to west and 220 km from north to south, encompassing a total area of about 32,100 km2, at an altitude ranging from 1200 to 1600 m above sea level [34]. The Mu Us Sandy Land belongs to the middle-temperate semi-arid climate zone, with an average temperature of 7.5–8.5 °C and annual precipitation of 350–600 mm, decreasing from southeast to northwest.
The Mu Us Sandy Land is located at the border of the Inner Mongolia Autonomous Region, Shaanxi Province and the Ningxia Hui Autonomous Region. It includes the Hengshan District, the Yuyang District, Dingbian County, Jingbian County and Shenmu City of Shaanxi Province; the Uxin Banner, the Otok Banner, the Otok Front Banner and the Ejin Horo Banner of the Inner Mongolia Autonomous Region; and Yanchi County of the Ningxia Hui Autonomous Region. The Mu Us sandy land lies within the ecotone zone, with the northwest area primarily being a pastoral region, while the southeast area is mainly an agricultural region [35]. The northwestern pastoral area predominantly contains artificial pasture, accounting for more than 60% of the total area in the northwest. Due to its terrain, the southeast is mainly focused on agriculture, but the grain output is extremely unstable owing to poor weather and natural conditions. The population of the Mu Us Sandy Land is approximately 579,000, and its GDP per capita is about CNY 288,000. Due to the unbalanced economy, underdeveloped public transportation and different natural conditions, the population distribution in the Mu Us Sandy Land is uneven, with the population density in the eastern part being significantly higher than that in the western part.

2.2. Data Sources

Data used in this paper primarily include Landsat images, meteorological data, elevation data, socioeconomic data and field data (Table 1).
(1)
Four Landsat images with 30 m spatial resolution were obtained from the Geospatial Data Cloud website (www.gscloud.cn, accessed on 1 December 2021), covering the whole study area. In order to accurately determine the degree of desertification of the Mu Us Sandy Land, summer images with cloud cover of less than 5% were selected. The data acquisition information is presented in Table 2.
(2)
Meteorological data were processed using daily meteorological data collected from 115 meteorological stations, accessed on 1 May 2022, including 9 reference stations, 31 basic stations, and 75 general stations around the study area. The data include mean annual temperature (Celsius), annual precipitation (mm), evaporation (mm), and mean annual wind speed (m/s). By using the kriging interpolation method, we mapped the spatial distribution of different meteorological indexes, with a spatial resolution of 30 m.
(3)
Elevation data was obtained from ASTER GDEM data archives from the Geospatial Data Cloud (www.gscloud.cn, accessed on 1 August 2021), containing 10 scenes that covered the study area. After processing, slope and aspect data of the study area were derived, with a spatial resolution of 30 m.
(4)
Socioeconomic data were obtained from the Ordos Statistical Yearbook from 2000 to 2021, including GDP, population, seeding area, livestock number, annual grass planting area, and annual afforestation area of Uxin Banner.
(5)
Field data consisted of 140 sampling points collected from the Mu Us Sandy Land in mid-July 2021 (the period of vegetation growth). Since the roots of Artemisia annularis and Salix salsa, which are most widely distributed in the study area, are relatively developed at a soil depth of 20–30 cm [36,37], soil samples were primarily collected at a depth of 20–30 cm. We collected soil nitrogen content, soil phosphorus content, soil potassium content, soil organic matter content, and soil fractal dimension for each sampling point, and then obtained raster data for each item using Kriging interpolation with a spatial resolution of 1 km.
The layout of sampling points followed four principles:
(1)
Uniformity: Sampling points should be as evenly dispersed in the study area as possible. We took the 20 km × 20 km grid as the basic unit and divided the study area into several units. At least 1 field survey site should be set up in each unit.
(2)
Compatibility: The selection of sampling points should take into account the characteristics of the overall ecological geological conditions of surrounding grids, so as to avoid the arrangement of sampling points in similar areas, which makes it difficult to control the overall regional characteristics of the study area.
(3)
Typicality: Vegetation types on dunes obviously vary from the top to the bottom. Therefore, for large dunes, sampling points were arranged at the top of the dune, the waist of the dune and the interdune beach.
(4)
Accessibility: In order to ensure the efficiency and safety of field work, the sampling points should be placed so as not to be too difficult to reach, leading to the abandonment of the survey.

3. Methodology

In this study, by utilizing the modified soil adjusted vegetation index–Surface Albedo model (MSAVI-Albedo), we constructed a desertification difference index (DDI) to extract the spatial-temporal evolution characteristics of desertification in the Mu Us Sandy Land for the years 1991, 2002, 2009 and 2021. Subsequently, the clustering distribution characteristics of desertification were analyzed based on the Moran’s I statistic. Finally, we examined the influence of soil, meteorological, topographic, and socioeconomic factors on the desertification formation and control process in the Mu Us Sandy Land (Figure 2).

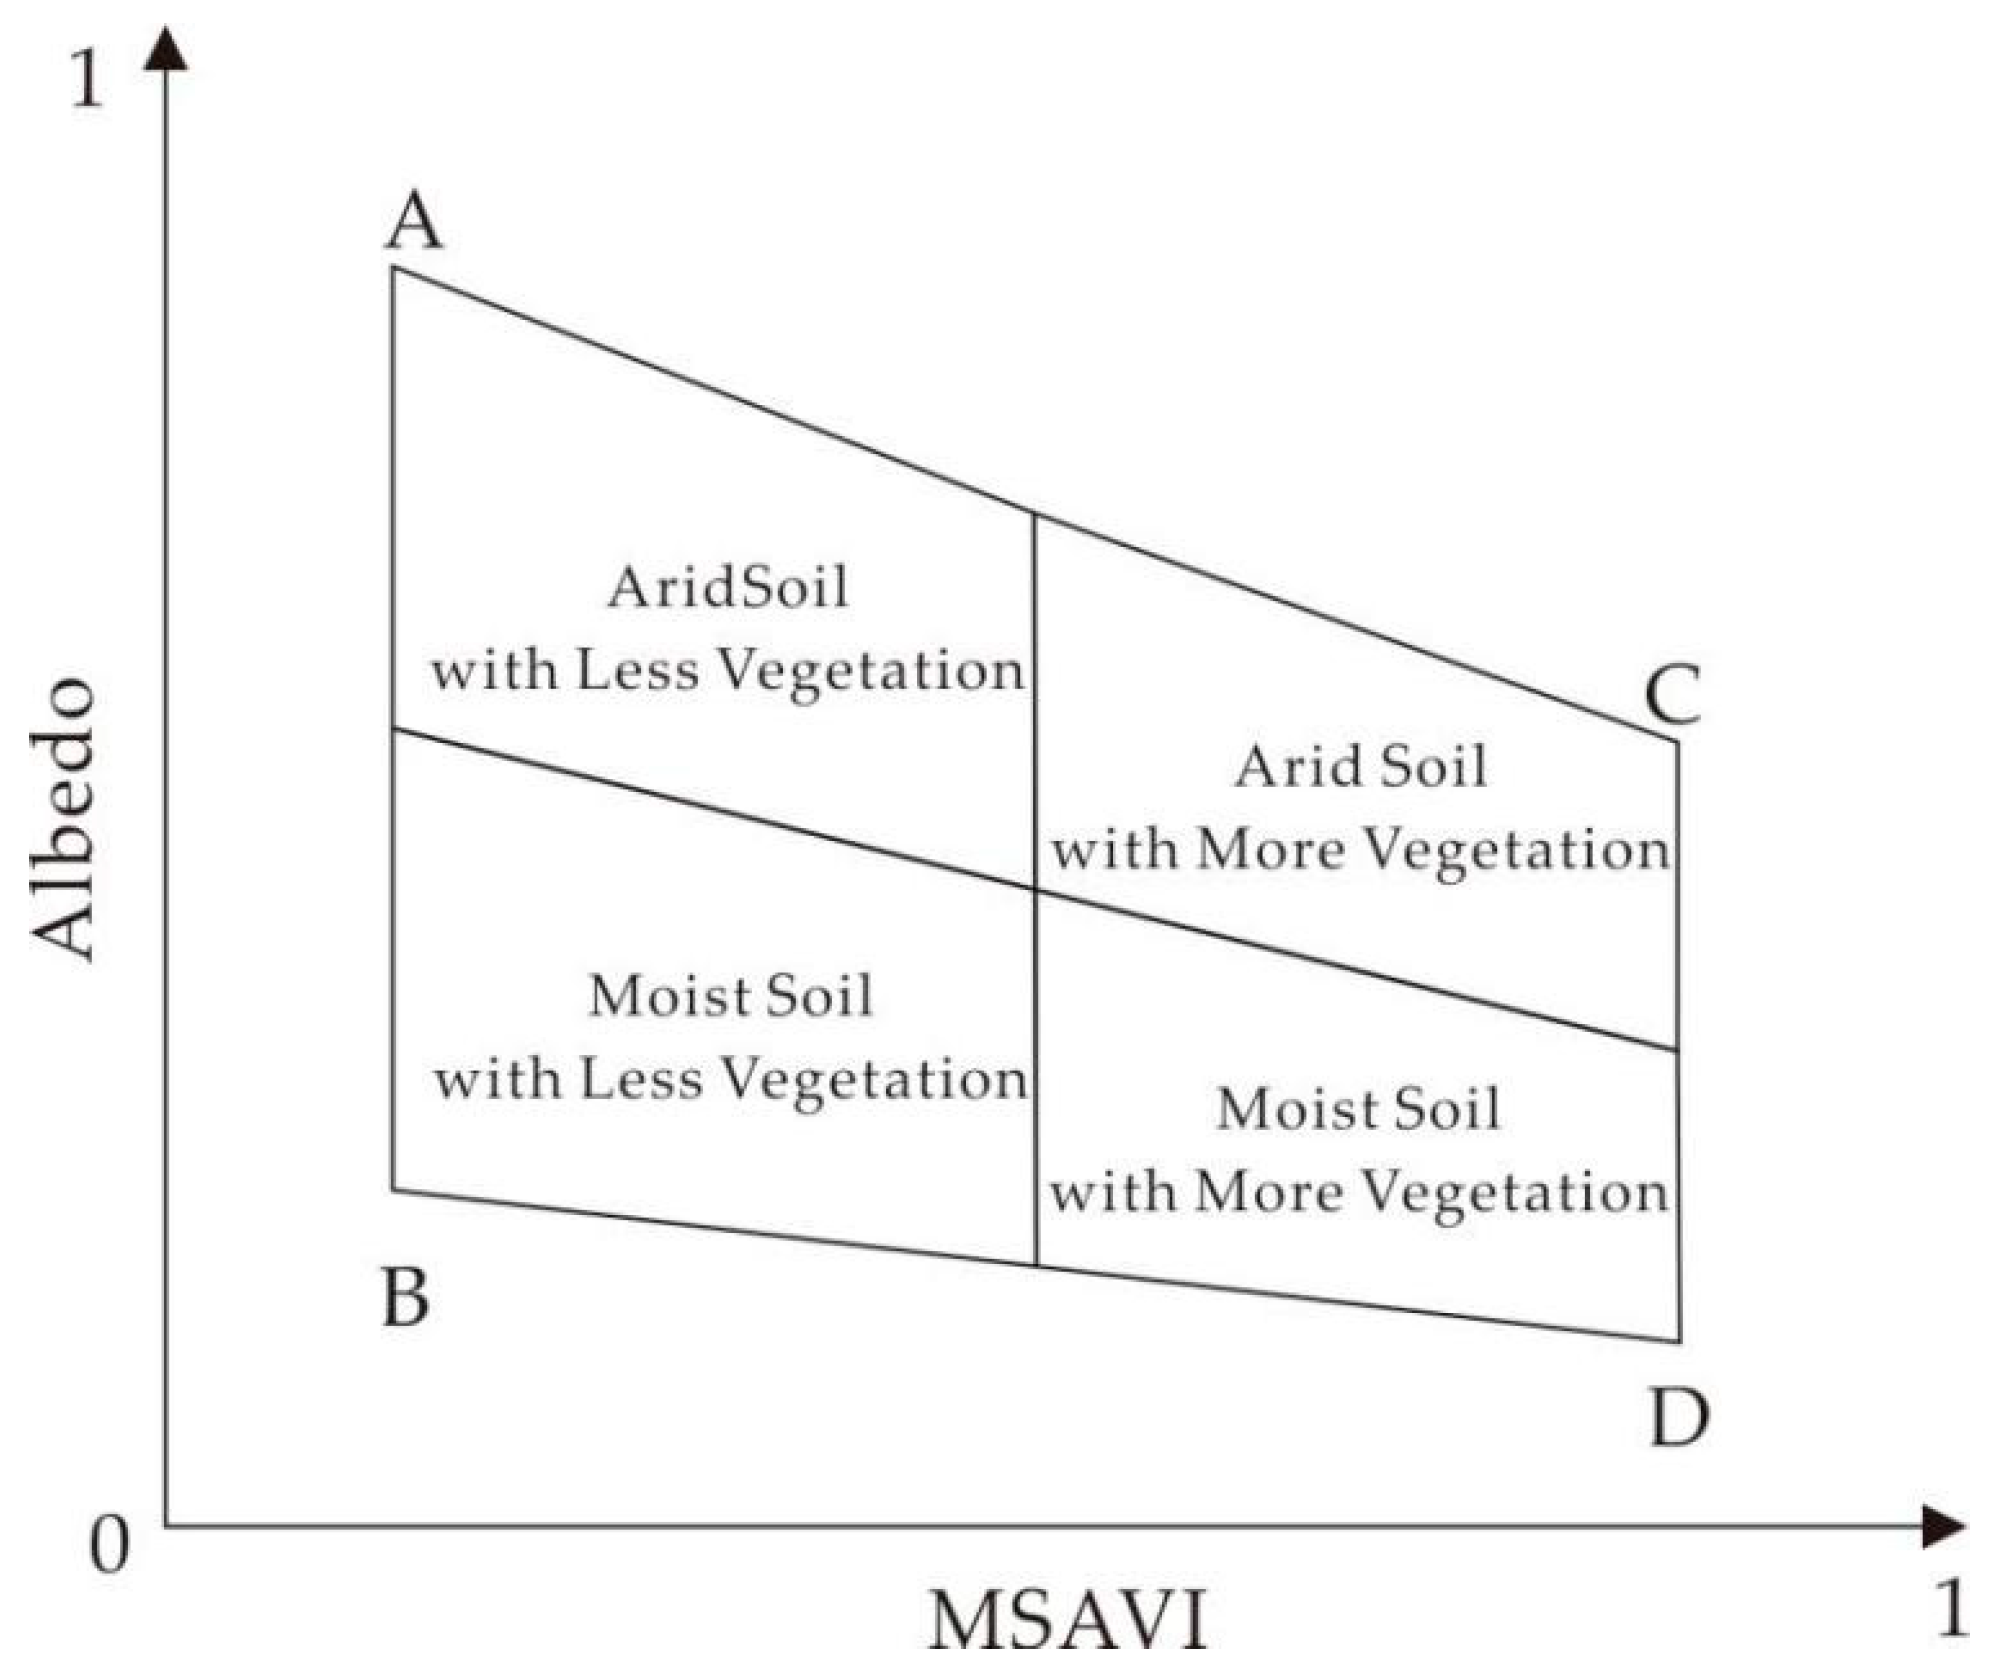
3.1. MSAVI-Albedo Model Building

Data preprocessing mainly included Landsat image preprocessing, water pixel elimination, MSAVI and Albedo calculation.
(1)
Landsat Image Preprocessing
In order to eliminate errors of position, shape and surface radiation intensity of remote sensing image caused by cloud, fog or transmission, this study used ENVI to preprocess remote sensing data. Radiometric calibration was used to eliminate radiation errors caused by sensors. FLAASH atmospheric correction was used to eliminate radiation errors caused by the atmosphere, and the Image-to-Image process was used to correct geometric errors between images.
(2)
Water Pixel Elimination
To avoid the interference of water pixels with the classification results of desertification, a modified normalized difference water index (MNDWI) was used to extract and eliminate water bodies. This index could better distinguish buildings and water bodies. The expression is as follows [38]:
MNDWI = N Green N SWIR N Green + N SWIR
where N Green is the reflectance of the green band and N SWIR is the reflectance of the short-wave infrared band.
(3)
MSAVI and Albedo Calculation
In areas with less vegetation cover, the Normalized Difference Vegetation Index (NDVI) is greatly affected by soil background and will not capture some of the vegetation information. Therefore, the Modified Soil Adjusted Vegetation Index (MSAVI) was adopted to reduce the influence of vegetation canopy information and soil background. The formula is as follows [39]:
MSAVI = 2 N NIR + 1 ( 2 N NIR + 1 ) 2 8 ( N NIR N RED ) 2
where NNIR is the reflectance of the near infrared band and NRED is the reflectance of the red band.
Surface Albedo (Albedo) can capture surface reflection of solar shortwave radiation. It is affected by surface water content and roughness, so that the lower the surface water content and vegetation coverage, the higher the Albedo and temperature, which can effectively represent changes in dryness and humidity on desertified land. The formula is as follows [40]:
Albedo = 0 . 356 N BLUE + 0 . 13 N GREEN + 0 . 373 N NIR + 0 . 085 N SWIR 1 + 0 . 072 N SWIR 2 0 . 0018
where N BLUE is the reflectance of the blue band, N GREEN is the reflectance of the green band, NNIR is the reflectance of the near-infrared band, N SWIR 1 and N SWIR 2   are the reflectance of the short-wave infrared band, and N7 represents the reflectance of band 1 to band 7 of the Landsat image.
MSAVI and Albedo were normalized, and the standard deviation was used to eliminate values outside the 99.7% confidence region. The formulas are as follows:
M = MSAVI MSAVI min MSAVI max MSAVI min
A = Albedo Albedo min Albedo max Albedo min
where MSAVImin and MSAVImax are the minimum and maximum values of MSAVI, and Albedomin and Albedomax are the minimum and maximum values of Albedo.

3.2. Classification of Desertification Based on Albedo-MSAVI

To perform the classification of desertification based on Albedo and MSAVI, we first unified the projection system, pixel size, and row number of the MSAVI and Albedo data. We then eliminated invalid data, thereby obtaining two-dimensional arrays of MSAVI and Albedo data for each pixel. We employed SPSS Statistic 24 software to generate a MSAVI-Albedo scatter plot and analyzed the change characteristics in Albedo in relation to the increase in MSAVI.
A significant negative correlation exists between MSAVI and Albedo. The correlation coefficients were −0.767, −0.819, −0.679 and −0.861 in 1991, 2002, 2009, and 2021, respectively. In Figure 3, Point A represents bare land characterized by low surface water content and low vegetation cover, indicative of a heavily desertified area. Point B represents bare land with high surface water content and low vegetation cover. Point C represents an arid vegetation area with low surface water content and high vegetation coverage, including some sandy plants. Point D represents a vegetation area with high surface water content and high vegetation coverage, typically characterized by the presence of water-loving vegetation. The surface form of D is limited by water volume, and the ecology is relatively fragile.
By using MSAVI and Albedo, the desertification difference index (DDI) can be constructed to quantitatively reflect the degree of desertification and analyze the spatial-temporal distribution of desertification in the Mu Us Sandy Land. We adopted a linear regression and a further calculation to derive the DDI as follows:
Albedo = a × MSAVI + b
DDI = ( 1 a ) × MSAVI Albedo

3.3. Classification of Desertification and Field Verification

We defined five degrees of desertification in the Mu Us Sandy Land according to China’s technical regulations for monitoring desertification [41]: extremely severe desertification, severe desertification, moderate desertification, mild desertification and no desertification. We then constructed classification criteria and markers suitable for the Mu Us Sandy Land (Table 3). By employing the natural discontinuity point grading method, we obtained desertification classification results for the Mu Us Sandy Land from 1991 to 2021. The cut-off point was determined using the Jenks natural breaks method based on statistics, which minimized the sum of internal variances at all levels. In September 2021, we visited the Mu Us Sandy Land and verified 140 field points in reference to the desertification criteria and marker table (Figure 4). Consequently, the classification accuracy of desertification in the Mu Us Sandy Land in 2021 was validated at 89.29%.

3.4. Clustering of Desertification Index

To discover the overall spatial autocorrelation of desertification, we employed the Global Moran’s I statistic and used the Local Indicators of Spatial Autocorrelation (LISA) to analyze the spatial aggregation pattern of desertification.
(1)
Global Moran’s I Statistic
The Global Moran’s I statistic primarily represents the spatial autocorrelation of objects and can reveal the correlation degree and spatial distribution characteristics within a research area. Its expression is as follows [42]:
I = 1 D 2 i = 1 n j = 1 n W ij ( y i   y ¯ ) ( y j   y ¯ ) i = 1 n j = 1 n W ij
where y i is the attribute value of position I , y j is the attribute value of position j ,   y ¯ is the average value of y i (i = 1,2,...,n), D 2 is the variance of y i and W ij is the spatial weight matrix.
The value range of Global Moran’s I statistic is [–1, 1] such that the greater the absolute value of I , the stronger the clustering, where I > 0 indicates positive spatial correlation (identical value clusting), I < 0 indicates negative spatial correlation (opposite value clustering), and I = 0 indicates no spatial autocorrelation (random distribution).
(2)
LISA Spatial Clustering
LISA determines the autocorrelation level of each pixel by combining the Local Moran’s I value with standardized test values. The standardized test value is calculated as follows [42]:
Z ( I i ) = I i E ( I i ) S ( I i )
where I i is the local Moran’s I value, Z ( I i ) is a standardized test value, and E ( I i ) and S ( I i ) are the expectation and variance of I i .

3.5. Geographic Detector

The geographic detector analyzes the consistency of the spatial distribution between the dependent variable and the independent variable through spatial differentiation, and thus measures the explanatory strength of each independent variable in relation to the dependent variable. We can use q to gauge the effect of driving factors on the spatial distribution of DDI in the Mu Us Sandy Land. The range of q lies between [0, 1]. The larger the value of q , the stronger the interpretation of the independent variable X to attribute Y. The expression is given as follows [43]:
q = 1 h = 1 L N h σ h 2 N σ 2
where h is the stratification of driving factors, N h is the number of units in layer h, and σ h 2 is the variance of the dependent variable on layer h.

4. Result and Discussion

4.1. Spatial Distribution of Desertification

4.1.1. Spatial-Temporal Distribution of Desertification

The degree of desertification in the Mu Us Sandy Land decreased gradually from northwest to southeast between 1991 and 2021 (Figure 5).
In 1991, extremely severe desertification areas accounted for 29.22% of the Mu Us Sandy Land, primarily distributed in stripes in the southwest of the Otok Front Banner and Dingbian County, scattered in the middle of the Uxin Banner, and distributed widely in the east and northwest of the Otok Banner, the Yuyang District and Jingbian County. Severe desertification and moderate desertification areas constituted 26.26% and 28.13%, respectively, mainly distributed in the Otok Banner, the Otok Front Banner and the Uxin Banner in the west and south of the Sandy Land. Mild desertification and no-desertification areas accounted for 12.21% and 4.16%, respectively, predominantly in Shenmu City and the Yuyang District in the northeast of the Sandy Land, and along the middle and lower reaches of the Hailiutuhe River, the Tuwei River and the Yuxi River.
In 2021, the desertification centers in the Mu Us Sandy Land had shifted to the west, and desertification was significantly mitigated. The proportion of extremely severe desertification areas decreased considerably to 5.62%, primarily located in Otok Banner and Otok Front Banner in the western part of the Mu Us Sandy Land. Severe desertification and moderate desertification areas constituted 14.73% and 29.95%, respectively. The area of severe desertification declined remarkably, especially in the eastern region, while moderate desertification areas remained stable. Mild desertification and no-desertification areas represented 31.37% and 18.33%, respectively, mainly distributed in the eastern part of the Uxin Banner, the Yuyang District and Shenmu City.

4.1.2. Interannual Change of Desertification

From 1991 to 2021, the desertification of the Mu Us Sandy Land exhibited a decreasing trend. The interannual change rate of the DDI was 0.095. The proportion of land with extremely severe desertification decreased from 29.22% in 1991 to 5.62% in 2021 (Table 4), and the proportion with no desertification increased from 4.16% to 18.33%.
Over the past 30 years, desertification has been significantly mitigated. Notably, desertification in the Hengshan District, the Yuyang District, Shenmu City, Dingbian County, and Jingbian County of Shaanxi Province has been effectively eliminated (Table 5). The degree of desertification in the Otok Banner and the Uxin Banner was reduced, with scattered desertification areas. However, some strip areas of desertification continued to be located in the Otok Front Banner. Overall, the regional sequence of mitigation in the Mu Us Sandy Land is southeastern, northeastern, and northwestern.
In the first period, from 1991 to 2002, the effect of desertification control was more significant than during the other decades, with 52.91%, 60.36%, 67.19% and 42.70% of extremely severe, severe, moderate and mild desertification land, respectively, being mitigated. The degree of desertification of Dingbian County, Jingbian County, the Hengshan District and the Yuyang District of Shaanxi Province, as well as the Otok Front Banner of the Inner Mongolia Autonomous Region, was reduced significantly. In the second period, from 2002 to 2009, the degree of desertification was mitigated slightly, with 64.55%, 60.13%, 44.91%, 18.55% of extremely severe, severe, moderate, and mild desertification land, respectively, being mitigated, primarily in the Uxin Banner and the Otok Banner of the Inner Mongolia Autonomous Region. In the third period, from 2009 to 2021, 52.90%, 58.22%, 43.79% and 19.74% of extremely severe, severely, moderate and mild desertification land, respectively, was mitigated, and the desertification area in Shenmu City was significantly reduced.

4.1.3. Desertification Cluster Distribution

By using the global Moran’s I Statistic and hypothesis test, we obtained global Moran’s I values 0.41 and 0.50 with p-value less than 0.001 for 1991 and 2021, respectively, which means that at the 99.9% significance level, the desertification distribution in the Mu Us Sandy Land in 1991 and 2021 exhibited a significant spatial positive correlation. This also indicates that pixels with higher or lower DDI were concentrated significantly. At the same time, the increasing global Moran’s I suggested that the spatial positive correlation of DDI in the Mu Us Sandy Land had increased, the clustering effect was more apparent, and the overall spatial difference of DDI among pixels had decreased.
In 1991 and 2021, the proportions of high-high (HH) clusters were 17.67% and 21.26%, respectively, and the proportions of low-low (LL) clusters were 24.14% and 27.87%, respectively, exhibiting a significant increasing trend. Compared to 1991, the distribution of desertification was more concentrated in 2021. As shown in Figure 6, HH clustering patches were mainly distributed in the eastern and southern regions of Shaanxi Province, and the HH patches in the Yuyang District, Jingbian County and Dingbian County shifted to LL patches, demonstrating that the desertification control results were remarkable. The LL clustering patches were mainly distributed in the Inner Mongolia Autonomous Region, where mixed HH and LL patches distributed in the Otok Banner and the Otok Front Banner were transformed into LL patches, showing that the distribution of desertification changed from different to uniform.

4.2. Driving Factors of Desertification

4.2.1. Driving Factors of Desertification Distribution

Three categories of driving factors—soil, meteorological, and topography factors—were selected to reveal the influence of each driving factor on the spatial differentiation of DDI in the Mu Us Sandy Land using the geographic detector. The effects of driving factors on desertification distribution in 2021 were ranked as follows: soil phosphorus (0.128) > precipitation (0.116) > evaporation (0.096) > soil fractal dimension (0.083) > soil nitrogen (0.0.065) > soil potassium (0.050) > soil organic matter (0.045) > temperature (0.041) > wind speed (0.025) > slope (0.023) > aspect (0.001).
The analysis revealed that the soil driving factors had the most significant influence on desertification distribution in the Mu Us sandy land. Soil organic matter, nitrogen, phosphorus, and potassium can provide energy for vegetation growth and development, while fractal dimension can reflect soil structure and water content. Among meteorological driving factors, precipitation and evaporation exerted a substantial impact on desertification distribution. This suggests that water volume plays a crucial role in the degree of desertification of the Mu Us Sandy Land. As the topography of the Mu Us Sandy Land is relatively flat, the influence of relief on desertification distribution is minimal.

4.2.2. Driving Forces of Desertification Change

Soil driving factors and topographic factors are relatively stable. Therefore, desertification change in the Mu Us Sandy Land is primarily influenced by meteorological factors and human factors. Changes in meteorological factors provide natural conditions for desertification evolution, while human factors significantly impact desertification control in areas such as land development and utilization, economic and social development, and afforestation policies. We explored the roles of natural and human factors in desertification control in the Mu Us Sandy Land based on the meteorological, economic, and social data from 1985 to 2021 in the Uxin Banner.
(1)
Meteorological Factors
The mean annual air temperature, annual precipitation and mean annual wind speed measured at the Uxin Banner meteorological station during 1985–2020 were statistically analyzed (Figure 7). The following observations can be made: (1) The mean annual air temperature increased at a rate of 0.01871 °C/a. The rising temperature increased surface evaporation, and at the same time, vegetation could enter the growth period earlier in spring, while vegetation decay in autumn was slowed [44]. (2) The annual precipitation increased at a rate of 1.0374 mm/a, and this increase of water was conducive to vegetation growth. (3) A significant decrease in the mean annual wind speed was observed at a rate of 0.00945 m/s per annum. This reduction was favorable for the stabilization of quicksand. Furthermore, vegetation growth contributed to the decline in wind speed. Owing to the progressive amelioration of the three meteorological driving factors, namely temperature, precipitation, and wind speed, the desertification of the Mu Us sandy land has experienced considerable improvement.
(2)
Human Factors
The impact of human factors on desertification control in the Mu Us Sandy Land was investigated through an analysis of socioeconomic data from the Uxin Banner, encompassing gross regional product (GDP), population, seeding area, end-of-year livestock, grass planting area and afforestation area.
Population scale, economic development and industrial structure can exert significant influence on the desertification process. From 2000 to 2020, the total population of the Mu Us Sandy Land (Figure 8) increased by 20.17%, and the population density rose from 8.05 person/km2 to 10.1 person/km2. The region’s GDP grew rapidly from CNY 1.049 billion to CNY 1.689 billion, with an average annual growth rate of 15.18%. Secondary industries experienced rapid growth, accounting for 69.36% in 2020. Population growth generated increased demands for food and fuel, promoting the rapid improvement of natural resource utilization efficiency. Economic development provided the material foundation for desertification control in the Mu Us Sandy Land. Simultaneously, the transformation of the industrial structure from traditional agriculture and animal husbandry to industry and service industries also enhanced land use efficiency and accelerated the desertification control process.
The seeding area and livestock number can represent the development of agriculture and animal husbandry, reflecting the utilization of natural resources. From 2000 to 2020, the seeding area of the Uxin Banner increased threefold, primarily due to the reclamation of wasteland and the conversion of farmland to grassland (forest). By the end of the year, the number of livestock increased from 605,500 to 1,294,400, significantly alleviating the grazing pressure on the sandy grassland by improving the sandy land’s degree of desertification.
Since 1949, the state has attached great importance to the prevention and control of desertification, deploying a series of key national ecological projects such as the construction of the Three-North Shelterbelt System and the project of returning farmland to forest (grassland). From 2000 to 2020, the average annual grass planting area and average annual afforestation area in the Uxin Banner were 28.71 thousand hectares and 11.47 thousand hectares, respectively. The forest coverage rate increased from 7% in the late 1980s to 32.92% in 2021, and the vegetation coverage reached 80%. The ecological environment of the sandy land is improving year by year.

5. Discussions

5.1. Desertification Dynamic

Remote sensing images and the model inversion method were applied to monitor the desertification dynamic of the Mu Us Sandy Land. Compared to previous studies, this study aimed to bring more public attention to the reasons for formation and the effects of controlling desertification. The findings of this study can provide basic data and technical support for the ecological restoration of other sandy lands. From 1991 to 2021, the desertification of the Mu Us Sandy Land has been mitigated, with 86.11%, 81.82%, 52.5%, and 37.42% of extremely severe, severe, moderate, and mild desertification areas, respectively, being ameliorated. Meanwhile, the ecological condition of desertification in China has improved significantly. The area undergoing desertification in China has changed from an average annual expansion of 10,400 km2 at the end of 1990s to an average annual reduction of 2424 km2 at the end of 2014s [8]. Despite these remarkable achievements, there is still a long way to go to control desertification in China [45]. China’s desertification land covers 2.61 million km2, accounting for 27.20% of the total land area [8]. Serious desertification still exists in the Otindag Sandy Land [46], Tengger Desert [47], Horqin Sandy Land [48], Shiyang River basin [49], Otindag Sandy Land [50], etc.

5.2. Effects of Natural Factors on Desertification

The phenomenon of desertification has existed throughout the quaternary period; thus, the impact of human activities on the landscape before the modern era only accounted for a small effect of the entire desertification process. Natural factors have played a decisive role in the formation of the Mu Us Sandy Land [51]. The Mu Us Sandy Land was formed by the accumulation of sediment transported by northwest winds blowing from Mongolia and Siberia, which is an alternating undulating landform of dune and bottomland [52]. The inflow area is located in the northwest of the Mu Us Sandy Land, while the outflow area is located in the east and southeast [53]. Meanwhile, the results of this paper show that the northwest and southeast of the Mu Us Sandy Land have the least desertification. The Mu Us Sandy Land is a semi-arid climate region in the middle temperate zone, where precipitation is low and decreases from southeast to northwest, resulting in desertification gradually increasing from southeast to northwest [54]. According to the field investigation, vegetation is usually distributed in low-lying areas, such as lakes, river channels and interdune lowlands, and the vegetation coverage gradually decreases with distance. A small amount of vegetation is distributed at the top of low dunes, while there is almost no vegetation at the top of higher dunes.

5.3. Effects of Human Factors on Desertification

In order to prevent the expansion of desertification, four major afforestation projects have been carried out in the world: the Roosevelt Shelterbelt Project in the United States [55], the Green Dam Project in five North African countries, the Great Stalin Transformation of Nature Project [56], and the Three-North Shelterbelt Project in China [57]. These four afforestation projects have had a significant impact and sparked enthusiasm for ecological restoration [58] in the world. The Mu Us Sandy Land has also influenced the Beijing-Tianjin sandstorm source control project and the conversion of farmland to forest (grass) project. In the past 30 years, China’s ecological restoration projects have played an important role in promoting the world’s greening process [59]. In addition to the implementation of afforestation projects, the government has created better conditions for the desertification control of the Mu Us Sandy Land by guiding land use and economic development [60]. At the same time, the policy of “banning grazing, resting grazing, and rotating grazing” was carried out and the demonstration base of agriculture and animal husbandry was established, so that the structure of livestock in grazing areas can be changed and grazing pressure on grassland in sandy areas can be alleviated [61].

6. Conclusions

In the past 20 years, the desertification of the Mu Us Sandy Land has been significantly improved, with the proportion of land undergoing extremely severe desertification decreasing from 29.22% to 5.62%, and the desertification being improved most obviously in the southeast region. At present, the desertification control in the Mu Us Sandy Land has been largely completed and has entered the stage of protection and maintenance. Natural factors play a leading role in the formation of sandy land. Of these, soil type and nutrient content play a decisive role, meteorological fluctuations such as temperature and precipitation can rapidly affect the desertification, and topographic fluctuations cause dunes to show vertical vegetation zonation with the increase of altitude. Human factors play a significant role in the control of sandy land. In addition to the series of ecological protection projects, the government also actively guides the population expansion, urban construction and economic development models so as to make the use of land and water resources more reasonable. The research methods and results of this paper provide a scientific basis for the ecological protection and rational utilization of other sandy lands, which will provide an effective reference for ecological environmental protection departments and disaster prevention departments.

Author Contributions

Conceptualization, X.J.; Methodology, X.J., J.L. (Jianyu Liu), J.L. (Jiafeng Liu) and G.L.; Software, W.Z.; Validation, J.L. (Jianyu Liu); Formal analysis, W.Z. and J.L. (Jiafeng Liu); Investigation, J.Y.; Resources, J.G.; Data curation, J.L. (Jianyu Liu); Writing—original draft, X.J. and J.L. (Jianyu Liu); Writing—review & editing, J.Y. and X.D.; Visualization, X.D.; Supervision, J.Y.; Project administration, X.D.; Funding acquisition, J.Y. All authors have read and agreed to the published version of the manuscript.

Funding

This research was funded by China Aero Geophysical Survey and Remote Sensing Center for Natural Resources grant number [2020YFL33] And The APC was funded by China Aero Geophysical Survey and Remote Sensing Center for Natural Resources grant number [ARGS2023X024].

Data Availability Statement

We have provided details regarding where data supporting reported results can be found. And the new data is unavailable due to privacy.

Conflicts of Interest

The authors declare no conflict of interest.

References

  1. UNCCD. United Nations Convention to Combat Desertification in Countries Experiencing Serious Drought and/or Desertification, Particularly in Africa; UNCCD: Paris, France, 1994. [Google Scholar]
  2. Reynolds, J.F.; Smith, D.M.S.; Lambin, E.F.; Turner, B.L.; Mortimore, M.; Batterbury, S.P.J.; Downing, T.E.; Dowlatabadi, H.; Femandez, R.J.; Herrick, J.E. Global desertification: Building a science for dryland development. Science 2007, 316, 847–851. [Google Scholar] [CrossRef] [Green Version]
  3. Zhang, Z.H.; Huisingh, D. Combating desertification in China: Monitoring, control, management and revegetation. J. Clean. Prod. 2018, 182, 765–775. [Google Scholar] [CrossRef]
  4. Xu, D.Y.; Zhang, X. Multi-scenario simulation of desertification in North China for 2030. Land Degrad. Dev. 2021, 32, 1060–1074. [Google Scholar] [CrossRef]
  5. Lu, Q.; Lei, J.Q.; Li, X.S. China’s combating desertification: National solutions and global paradigm. Bull. Chin. Acad. Sci. 2020, 35, 656–664. [Google Scholar]
  6. Zhu, J.J.; Zheng, X. The prospects of development of the Three-North Afforestation Program (TNAP): On the basis of the results of the 40-year construction general assessment of the TNAP. Chin. J. Ecol. 2019, 38, 1600–1610. [Google Scholar]
  7. Gao, Z.; Li, C.; Ci, L.; Yang, X. Engineering and Technological Measures for Combating Desertification; Higher Education Press: Beijing, China, 2010; pp. 427–463. [Google Scholar]
  8. National Forestry and Grassland Administration. Bulletin on the Status of Desertification and Desertification in China; National Forestry and Grassland Administration: Beijing, China, 2015.
  9. Lu, C.; Zhao, T.; Shi, X. Ecological restoration by afforestation may increase groundwater depth and create potentially large ecological and water opportunity costs in arid and semiarid China. J. Clean. Prod. 2018, 176, 1213–1222. [Google Scholar] [CrossRef]
  10. Cao, S. Impact of China’s large-scale ecological restoration program on the environment and society in arid and semiarid areas of China: Achievements, problems, synthesis, and applications. Crit. Rev. Environ. Sci. Technol. 2011, 41, 317–335. [Google Scholar] [CrossRef]
  11. Bryan, B.A.; Gao, L.; Ye, Y. China’s response to a national land—System sustainability emergency. Nature 2018, 559, 193–204. [Google Scholar] [CrossRef]
  12. Liu, X.; Lu, R.; Du, J.; Lyu, Z.; Wang, L.; Gao, S.; Wu, Y. Evolution of Peatlands in the Mu Us Desert, Northern China, Since the Last Deglaciation. J. Geophys. Res. Earth Surf. 2018, 123, 252–261. [Google Scholar] [CrossRef]
  13. Wang, X.; Chen, F.H.; Dong, Z.; Xia, D. Evolution of the southern Mu US desert in north China over the past 50 years: An analysis using proxies of human activity and climate parameters. Land Degrad. Dev. 2005, 16, 351–366. [Google Scholar] [CrossRef]
  14. Ding, Z.; Sun, J.; Liu, D. Stepwise advance of the Mu Us Desert since late Pliocene; Evidence from a red clay-loess record. Chin. Sci. Bull. 1999, 44, 1211–1214. [Google Scholar] [CrossRef]
  15. Wen, P.; Wang, N.; Wang, Y.; Huang, Y.; Cheng, H.; He, T. Fluvial incision caused irreversible environmental degradation of an ancient city in the Mu Us Desert, China. Quat. Res. 2021, 99, 1–13. [Google Scholar] [CrossRef]
  16. Feng, K.; Wang, T.; Liu, S.; Kang, W.; Chen, X.; Guo, Z.; Zhi, Y. Monitoring Desertification Using Machine-Learning Techniques with Multiple Indicators Derived from MODIS Images in Mu Us Sandy Land, China. Remote Sens. 2022, 14, 2663. [Google Scholar] [CrossRef]
  17. Zhu, Z.; Liu, S. Judgment on the concept of desertification and its development degree. Desert China 1984, 4, 2–8. [Google Scholar]
  18. Zhu, Z. The concept, causes, and control of land desertification in China. Quat. Res. 1998, 2, 145–155. [Google Scholar]
  19. Zhu, J.; Zhu, Z. Desertification Control in China; China Forestry Press: Beijing, China, 1999. [Google Scholar]
  20. Ringrose, S.; Matheson, W.; Tempest, F. The development and causes of Range Degradation Featuresin Southeast Botswana using Multi-temporal Landsat MSS Imagery. Photogrammetic Eng. Remote Sens. 1990, 56, 1253–1262. [Google Scholar]
  21. Hill, J.; Stellmes, M.; Udelhoven, T.; Röder, A.; Sommer, S. Mediterranean desertification and land degradation: Mapping related land use change syndromes based on satellite observations. Glob. Planet. Chang. 2008, 64, 146–157. [Google Scholar] [CrossRef]
  22. Afrasinei, G.M.; Melis, M.T.; Buttau, C.; Arras, C.; Zerrim, A.; Guied, M.; Ouessar, M.; Essifi, B.; Zaied, M.B.; Jlali, A. Classification Methods for Detecting and Evaluating Changes in Desertification-Related Features in Arid and Semi-arid Environments. Euro-Mediterr. J. Environ. Integr. 2017, 2, 21. [Google Scholar] [CrossRef] [Green Version]
  23. Du, Z.; Zhan, Y.; Wang, C. Dynamic Monitoring of Desertification in Horqin Sandy Land Based on MODIS NDVI. Remote Sens. Land Resour. 2009, 2, 14–18. [Google Scholar]
  24. Li, J.; Praseodymium, L.; Ji, L.; Dewati, A. Research on the application method of GIS based MODIS in environmental desertification monitoring. Xinjiang Meteorol. J. 2003, 2, 21–23. [Google Scholar]
  25. Javier, T.; Silva, P.; Barbosa, A.A.; Rodriguez, D.A.; De, O.; Sestini, M.F. Desertification trends in the northeast of Brazil over the period 2000–2016. Int. J. Appl. Earth Obs. 2018, 73, 197–206. [Google Scholar]
  26. Zhou, Y.Q.; Hu, Z.W.; Geng, Q.Q.; Ma, J.R.; Liu, J.Y.; Wang, M.; Wang, Y.C. Monitoring and analysis of desertification surrounding Qinghai Lake (China) using remote sensing big data. Environ. Sci. Pollut. Res. 2023, 30, 17420–17436. [Google Scholar] [CrossRef] [PubMed]
  27. Zeng, Y.N.; Xiang, N.P.; Feng, Z.D.; Hu, H. Albedo-NDVI space and remote sensing synthesis index models for desertification monitoring. J. Sci. Geogr. Sin. 2006, 26, 75–81. [Google Scholar]
  28. Lamaamri, M.; Lghabi, N.; Ghazi, A.; El Harchaoui, N.; Adnan, M.S.G.; Shakiul Islam, M. Evaluation of Desertification in the Middle Moulouya Basin (North-East Morocco) Using Sentinel-2 Images and Spectral Index Techniques. Earth Syst. Environ. 2022, 7, 473–492. [Google Scholar] [CrossRef]
  29. Becerril-Piña, R.; Díaz-Delgado, C.; Mastachi-Loza, C.A.; González-Sosa, E. Integration of remote sensing techniques for monitoring desertification in Mexico. Hum. Ecol. Risk Assess. 2016, 22, 1323–1340. [Google Scholar] [CrossRef]
  30. Wei, H.S.; Wang, J.L.; Cheng, K.; Li, G.; Ochir, A.; Davaasuren, D.; Chonokhuu, S. Desertification Information Extraction Based on Feature Space Combinations on the Mongolian Plateau. Remote Sens. 2018, 10, 1614. [Google Scholar] [CrossRef] [Green Version]
  31. Guo, B.; Wei, C.X.; Yu, Y.; Liu, Y.F.; Li, J.L.; Meng, C.; Cai, Y.M. The Dominant Influencing Factors of Desertification Changes in the Source Region of Yellow River: Climate Change or Human Activity? Sci. Total Environ. 2022, 813, 152512. [Google Scholar] [CrossRef] [PubMed]
  32. Deng, H.; Shu, S.G.; Song, Y.Q.; Xing, F.L. Distribution of sand dunes and sand shifts along the southern fringe of the Mu Us Desert since the Ming Dynasty. Chin. Sci. Bull. 2007, 52, 3128–3138. [Google Scholar] [CrossRef]
  33. Zhang, D.; Deng, H. Historical human activities accelerated climate-driven desertification in China’s Mu Us Desert. Sci. Total Environ. 2020, 708, 134–144. [Google Scholar] [CrossRef]
  34. Zhang, X.S. Ecological background, principles of management and optimized models of the Mu Us sandy grasslands. Acta Phytoecol. Sin. 1994, 18, 1–16. [Google Scholar]
  35. Wu, B.; Ci, L.J. Landscape change and desertification development in the Mu Us Sandland, northern China. Arid Environ. 2002, 50, 429–444. [Google Scholar] [CrossRef]
  36. Zhao, L.; Zhang, D.; Jin, J. Study on the distribution of soil water around Salix psammophila in semi arid and semi desert regions. J. Water Resour. Water Eng. 2012, 23, 63–66. [Google Scholar]
  37. Zhao, M.; Wang, W.; Wang, Z. Study on the biomass and root distribution characteristics of Artemisia psammophila in semi-arid sandy land. Geogr. Arid. Areas 2018, 41, 786–792. [Google Scholar]
  38. Xu, H. Modification of normalised difference water index (NDWI) to enhance open water features in remotely sensed imagery. Int. Remote Sens. 2006, 27, 3025–3033. [Google Scholar] [CrossRef]
  39. Qi, J.; Chehbouni, A.; Huete, A. A modified soil adjusted vegetation index. Remote Sens. Environ. 1994, 48, 119–126. [Google Scholar] [CrossRef]
  40. Liang, S. Narrowband to broadband conversions of land surface Albedo I algorithm. Remote Sens. Environ. 2001, 76, 213–238. [Google Scholar] [CrossRef]
  41. GB/T 24255-2009; Technical code of practice on the sandified land monitoring. General Administration of Quality Supervision, Inspection and Quarantine of the People’s Republic of China: Beijing, China, 2009.
  42. Wang, Y.; He, H. Spatial Data Analysis Methods; Science Press: Beijing, China, 2007; pp. 49–50. [Google Scholar]
  43. Wang, J.; Xu, C. Geographic Detectors: Principles and Prospects. J. Geogr. 2017, 72, 116–134. [Google Scholar]
  44. Yan, F.; Wu, B. Nearly 40 a maowusu sandy desertification process study. J. Arid. Areas Geogr. 2013, 4, 987–996. [Google Scholar]
  45. Wang, T. Study on the coordinated development of ecosystem and socio-economic system in desertification control: A case study of desertification control in semiarid area in North China. Acta Ecol. Sin. 2016, 36, 7045–7048. [Google Scholar]
  46. Zhu, F.; Lu, H.; Yi, S. Temporal and spatial variation law of Hunshandake sandy land vegetation based on NDVI index. Soil Water Conserv. China 2017, 69, 31–34. [Google Scholar]
  47. Li, D.; Ma, Q.; Zhang, J. Vegetation characteristics of the Tengger Desert. J. Desert Res. 2020, 40, 223–233. [Google Scholar]
  48. Cui, Z.; Ma, C.; Chen, D. Spatiotemporal variation of vegetation in the Horqin sandy land and its response to climate change from 1982-2015. Arid. Zone Res. 2021, 38, 536–544. [Google Scholar]
  49. Wei, W.; Yu, X.; Zhang, M. Dynamics of desertification in the lower reaches of Shiyang River Basin, Northwest China during 1995-2018. Chin. J. Appl. Ecol. 2021, 32, 2098–2106. [Google Scholar]
  50. Yi, Y.; Shi, M.; Wu, J.; Yang, N.; Zhang, C.; Yi, X. Spatio-Temporal Patterns and Driving Forces of Desertification in Otindag Sandy Land, Inner Mongolia, China, in Recent 30 Years. Remote Sens. 2023, 15, 279. [Google Scholar] [CrossRef]
  51. Lamchin, M.; Lee, J.; Lee, W.; Lee, E.; Kim, M.; Lim, C.; Choi, H.; Kim, S. Assessment of land cover change and desertification using remote sensing technology in a local region of Mongolia. Adv. Space Res. 2016, 57, 64–77. [Google Scholar] [CrossRef]
  52. Wu, B. Landscape Dynamics and Causes of Desertification in Mu Us Sandy Land. Ph.D. Thesis, Graduate University of Chinese Academy of Sciences, Beijing, China, 1997. [Google Scholar]
  53. Cheng, D.; Wang, W.; Hou, G. Relationship between vegetation and groundwater in Mu Us Sandy Land. J. Jilin Univ. Earth Sci. Ed. 2012, 42, 184–189. [Google Scholar]
  54. He, Q.; Liu, Z. Mu Us Desert-World rainstorm Center. Inn. Mong. Meteorol. 1996, 3, 5–15. [Google Scholar]
  55. Brain, S. The great Stalin plan for the transformation of nature. Environ. Hist. 2010, 15, 670–700. [Google Scholar] [CrossRef]
  56. Wang, Y.Q.; Yin, S.; Guo, E.L.; Peng, X.Q.; Guo, L.F.; Li, Y.W. Desertification dynamic analysis based on landsat-8 OLI image: Take XilinGol League as an example. Inn. Mong. Agric. Univ. 2018, 39, 58–63. [Google Scholar]
  57. Dahl, J. Progress and development of the prairie states forestry project. J. For. 1940, 38, 301–306. [Google Scholar]
  58. Liu, Q.; Zhang, Q.; Yan, Y.; Zhang, X.; Niu, J.; Svening, J. Ecological restoration is the dominant driver of the recent reversal of desertification in the Mu Us Desert (China). Clean. Prod. 2020, 268, 122241. [Google Scholar] [CrossRef]
  59. Tack, J.; Quanmen, F.; Kelsy, K.; Naugle, D. Doing more with less: Removing trees in a prairie system improves value of grasslands for obligate bird species. Environ. Manag. 2017, 198, 163–169. [Google Scholar] [CrossRef] [PubMed]
  60. Bai, J.; Yan, F. Process of Desertification and Its Driving Forces in the Mu Us Sandy Land in 2001-2012. J. Nanjing Norm. Univ. Nat. Sci. Ed. 2016, 39, 132–138. [Google Scholar]
  61. Wu, X.; Zou, X. Landscape pattern evolution and driving force analysis of the hinterland of Mu Us Sandy Land based on 3S: A case study of Wusen Banner in Inner Mongolia. Chin. Desert. 2010, 30, 763–769. [Google Scholar]
Figure 1. Geographical location of the study area.
Sustainability 15 10399 g001
Figure 2. Technology roadmap.
Sustainability 15 10399 g002
Figure 3. MSAVI-Albedo distribution characteristics.
Sustainability 15 10399 g003
Figure 4. Distribution of field sampling points.
Sustainability 15 10399 g004
Figure 5. Desertification Level in the Mu Us Sandy Land from 1991 to 2021.
Sustainability 15 10399 g005
Figure 6. Desertification Cluster Distribution in the Mu Us Sandy Land of 1991 and 2021.
Sustainability 15 10399 g006
Figure 7. Meteorological Factors in the Uxin Banner from 1985 to 2020.
Sustainability 15 10399 g007
Figure 8. Human Factors in the Uxin Banner from 1985 to 2020.
Sustainability 15 10399 g008
Table 1. Data Information.
Data TypeData FormatSpatial ResolutionData SourceExpiration Date
Landsat imagesRaster30 mwww.gscloud.cn1991, 2002, 2009, 2021
Meteorological dataRaster30 m115 Meteorological Stations2000–2021
Elevation dataRaster30 mwww.gscloud.cn2009
Socioeconomic dataNumber Government statistical report2000–2021
Field dataRaster1 kmSoil sample collection and detection2021
Table 2. Landsat Images Information.
YearSensor TypePath/Row (Date)
1991TM127/33 (15 July), 127/34 (15 July),
128/33 (23 August), 128/34 (23 August)
2002ETM+127/33 (23 September), 127/34 (23 September),
128/33 (29 August), 128/34 (29 August)
2009TM127/33 (30 June), 127/34 (30 June),
128/33 (23 July), 128/34 (23 July)
2021OLI127/33 (2 August), 127/34 (2 August),
128/33 (9 August), 128/34 (9 August)
Table 3. Classification criteria and markers of desertification in the Mu Us Sandy Land.
Desertification TypeVegetation CoverageSurface LandscapeDDI Tier ValueMarker Sample
Extremely severe desertification<10%Basically covered by quicksand, scattered vegetation.<−0.14Sustainability 15 10399 i001
Severe desertification10–25%The distribution of artemisia vegetation could be seen in semi-mobile sandy land with obvious wind-sand flow activity or quicksand texture.−0.14–0.12Sustainability 15 10399 i002
Moderate desertification20–40%Semi-fixed sandy land with no obvious wind-sand flow activity, containing semi-shrubby plants.0.12–0.37Sustainability 15 10399 i003
Mild desertification>40%Fixed sandy land or wind-eroded grassland with little or no wind-blown sand flow activity, mostly containing sandy thickets or herbs growing on lake sediments.0.37–0.79Sustainability 15 10399 i004
Table 4. Area of different degrees of desertification (Unit: km2).
Extremely Severe (4)Severe (3)Moderate (2)Mild (1)No (0)
19919574.308604.069218.894002.721362.55
20025307.566599.837122.479176.114509.89
20092179.735835.248929.7910647.575025.94
20211839.614820.609804.6210272.015999.77
Table 5. Desertification land transfer matrix (Unit: km2).
2002 2009
1991 432102002 43210
447.08%33.98%13.13%5.06%0.75%435.44%51.78%10.65%1.98%0.16%
38.27%31.36%35.50%21.91%2.96%33.15%36.71%49.05%10.39%0.70%
20.87%6.07%25.87%53.01%14.18%20.70%7.11%47.27%41.89%3.03%
10.37%2.27%9.62%45.03%42.71%10.24%1.74%17.72%61.74%18.56%
00.14%0.65%2.37%12.84%84.00%00.17%0.50%3.80%28.04%67.49%
2021 2021
2009 432101991 43210
447.11%36.78%11.56%3.11%1.44%413.89%24.21%31.58%22.55%7.77%
38.24%33.53%41.90%13.33%3.00%33.42%14.76%34.05%34.96%12.81%
21.91%14.02%40.28%36.36%7.43%21.60%11.43%34.47%35.36%17.14%
10.78%6.38%28.55%44.55%19.75%10.86%3.57%16.52%41.63%37.42%
00.32%1.44%9.25%28.83%60.15%00.60%1.21%3.13%16.10%78.96%
Disclaimer/Publisher’s Note: The statements, opinions and data contained in all publications are solely those of the individual author(s) and contributor(s) and not of MDPI and/or the editor(s). MDPI and/or the editor(s) disclaim responsibility for any injury to people or property resulting from any ideas, methods, instructions or products referred to in the content.

