Article

Ecosystem Service Value Estimation of Paddy Field Ecosystems Based on Multi-Source Remote Sensing Data

1
Key Laboratory of Digital Earth Science, Aerospace Information Research Institute, Chinese Academy of Sciences, Beijing 100094, China
2
International Research Center of Big Data for Sustainable Development Goals, Beijing 100094, China
3
University of Chinese Academy of Sciences, Beijing 100049, China
4
School of Resources and Environmental Sciences, Xinjiang University, Urumqi 830046, China
5
Geomatics College, Shandong University of Science and Technology, Qingdao 266590, China
6
Tianjin High Quality Agricultural Products Development Demonstration Center, Tianjin 301500, China
*
Author to whom correspondence should be addressed.
Sustainability 2022, 14(15), 9466; https://doi.org/10.3390/su14159466
Submission received: 15 June 2022 / Revised: 27 July 2022 / Accepted: 29 July 2022 / Published: 2 August 2022
(This article belongs to the Special Issue Land-Use Change and Ecosystem Services)

Abstract

:
A paddy field ecosystem (PFE) is an important component of an agricultural land ecosystem and is also a special artificial wetland with extremely high value. Taking Tianjin (a municipality city in China) as the research area and using multi-source remote sensing data, we improved the accounting framework of the ecosystem service value (ESV) of PFEs and the calibration of model parameters. The ESV of PFEs was mapped at medium-high resolution and fine-grain at the provincial scale. The results showed that: (1) the net ESV of PFEs in Tianjin in 2019 was RMB 29.68 × 10⁸, accounting for 0.21% of GDP. The positive ESV was RMB 35.53 × 10⁸, the negative ESV was RMB 5.84 × 10⁸, and the average ESV per unit area was RMB 5.47 × 10⁴/ha; (2) as a proportion of the ESV of PFE, the value of climate regulation (61.27%) was greater than the value of carbon fixation and oxygen release (15.29%), which was greater than the value of primary products supply (8.08%). The production value of PFEs is far lower than their ESV; (3) the total net ESV in Baodi District was RMB 16.85 × 10⁸, accounting for 56.77% of Tianjin’s ESV, and the net ESV per unit area was RMB 5.72 × 10⁴/ha, both of which were higher than in other districts; (4) the pixel-based hot spots analysis showed that the number of hot spots (high-value ESV) and cold spots (low-value ESV) reached 98.00% (hot spots 56.9%, cold spots 41.1%) with a significant cluster distribution. The hot spots were mostly distributed in Baodi District (37.8%) and the cold spots were mostly distributed in Ninghe District (17.2%). The research results can support agricultural development, improve countermeasures according to local conditions, and provide theoretical support for regional land use planning, ecological compensation policy formulation and ecological sustainable development. Our methodology can be used to assess the impact of land use change on ESV.

1. Introduction

Ecosystems provide a series of goods and services for human well-being that are the basis of human survival and development [1,2], have extremely high value and are irreplaceable natural capital [3]. Due to the continuous growth of population, rapid urbanization and industrialization, excessive demand for ecosystem services (ES) by human societies has led to the continuous reduction of ecosystem services and triggered a series of problems, such as environmental pollution, desertification and species extinction [4]. Therefore, the appreciation and correct evaluation of ES have become an urgent global problem.
The ES are the benefits that human beings obtain directly or indirectly from the ecosystem and can be divided into four types and 17 sub-types of provisioning, regulating, cultural and supporting services [4]. Researchers have tried to estimate the economic value of some ES since the 1980s [5,6] and Costanza [3] established the ES monetization accounting framework for 17 sub-types of 16 global ecosystems in 1997. Since then, the evaluation of ecosystem service value (ESV) has become a hot topic in academia. Due to the divergence of views among scholars on the evaluation of ESV, the most popular methods are the equivalent value per unit area (EVA) and the ecological service function equivalent (ESFE) methods. The former is the method proposed by Costanza that uses the value of ES per unit area of each ecosystem type multiplied by the total area of each ecosystem type to obtain the ESV of ecosystems in the region. Kreuter [7] criticized this method because land use types were used as proxies for ES; although they do not always match perfectly with biomes, and the unit area value equivalent of some types of ES was unreasonable. Xie [8,9] improved the method based on a survey of 500 Chinese ecologists, gaining wide application. This approach is based on land use/land cover (LULC) data with relatively few input parameters and is suitable for static or dynamic studies at different ecosystem types or different scales, such as global [10,11,12], national [13,14,15,16,17,18], small regions [19,20,21,22,23,24]. This application is not only limited to multiple types of ecosystems but also has a wide range of applications for single types of ecosystems, such as forests [25] and wetlands [26]. The shortcoming of the EVA method is that it does not consider the differences in habitats of ecosystems. For example, although the ESVs that forest ecosystems in sloping and flat areas can provide to prevent soil erosion must be different, the EVA method cannot reflect this difference. The gross ecosystem product (GEP) method was proposed by Ouyang [27,28,29] to calculate the accounting value of ES using market price surrogates. It first quantifies the ES in various types of ecosystems, and then uses economic assessment methods to estimate their values. This method is more suited to obtain the number of ES through ecological process simulations and has stronger explanatory power for ES. The GEP method has been applied to many pilot areas in China and has been selected as the basis of green development strategic planning and the index of government performance evaluation by many provinces. The shortcoming of the GEP method is that the transition depends on the statistical data with administrative divisions as the unit and requires many parameters, which leads to the cumbersome accounting process of ESV and low spatial resolution.
Rice is one of the world’s three major food crops. In China, more than 50% of the population relies on rice as a staple food. Every year, the area under paddy rice cultivation accounts for 18% of the total farmland [30], and rice grain yields account for 32% of total grain production. A paddy field ecosystem (PFE) has both farmland ecosystem and wetland ecosystem functions [31], providing not only food and industrial raw materials (such as straw) to meet human needs for food, but also rich ecological products to improve the living environment [32]. Continued population growth, rapid urbanization and the public perception of paddy fields as tools for only food production, ignoring their high value ES, such as carbon fixation and oxygen release, climate regulation and air purification, result in the continuous reduction of paddy planting area. This reduction not only threatens China’s food security, but also has a negative impact on the environment. Therefore, carrying out the evaluation of the ESV of a PFE, comprehensively revealing the ESV of the PFE, changes the public’s one-sided understanding of paddy ecosystems. Protecting the healthy development of a PFE can not only effectively ensure national food security but also improve the aesthetic of rural areas.
The vast majority of research on ESV evaluation of PFEs has focused on Asian countries. There is no unified consensus on the evaluation framework. Masumoto [33] and Xiao [34] separately conducted monetization accounting on the ecological service functions of PFEs, such as flood control and gas regulation. Chen [35] pioneered the provision of a comprehensive ESV evaluation framework for paddy ecosystems, which was used by Li [36], Zhou [37] and Xiao [38] in the Sichuan Basin, Zhejiang Province and Shanghai, respectively. The PFE was the main emission source of atmospheric greenhouse gases (CH4, CO2, N2O, etc.); rice paddy field cropping accounts for about 20% of emitted methane gas [39] and the use of pesticide and fertilizers leads to contamination of soil and water, generating negative ESV. The negative ESV of the PFE was included in the accounting framework to carry out the multifunctional net ESV evaluation. The study found that although intensively managed paddy fields also caused serious negative impacts on biodiversity [40], the number of organisms in paddy fields was still 16 times higher than in drylands [41]. Researchers have reached a consensus on ESV assessment methods. The physical ecological process simulation method combined with the market value method, the alternative cost method and the shadow engineering method have been widely used to account for ESV in PFEs [32,42,43,44], while the EVA method has been used successfully to account for ESV of PFEs [45,46,47].
In this study, we investigated the feasibility of multi-source remote sensing data to assess the ESV of PFEs in response to the neglect of habitat differences in the EVA method, the inadequate application of remote sensing techniques for the ESFE method, and the coarse granularity and the low credibility of the ESV evaluation results. The objectives of this study are: (1) to attempt to account for ESV of PFEs from multi-source remote sensing data instead of statistical data, and (2) to spatially map the ESV of PFEs at provincial scale with medium-high spatial resolution and fine grain size. Our study not only provides new ideas for standardizing and automating the evaluation of ESV of different types of terrestrial ecosystems, but also builds a new bridge for sustainable interaction between land use and ecological service functions.

2. Materials and Methods

2.1. Description of Study Area

Tianjin is located in the northeast of the North China Plain and downstream of the Haihe River Basin. It is one of the four municipalities directly under the central government and the largest port city in northern China, with geographical coordinates between 38°34′ and 40°15′ north latitude and 116°43′ and 118°4′ east longitude. Tianjin is located in the East Asian monsoon region and has a temperate monsoon climate with four distinct seasons. The annual average temperature is 14 °C, the coldest in January and the hottest in July. The annual average precipitation is 600 mm, about 70% of which is concentrated from July to August.
Tianjin has a long history of paddy cultivation. In recent years, its municipal government has given great importance to rice grain production and the planting area gradually increased from 17,400 ha in 2011 to 67,000 ha in 2021, with the main cultivars being Xiaozhan rice, which has been protected by the National Agricultural Products Geographical Indication Registration in 2020 [48].

2.2. Data Acquisition and Processing

2.2.1. Sentinel-2 Data

The Sentinel-2B image data used in this study were obtained from the European Space Agency (ESA, https://scihub.copernicus.eu/dhus/#/home) (accessed on 10 May 2021), with data imaged on 29 June, 23 August, and 7 October 2019, and tile numbers T50SNJ, T50SNH, T50SMH, and T50SMJ, respectively. The images had all less than 5% cloud cover. The SNAP software was used to pre-process the S2MSI1C data with atmospheric correction, resampling, mosaic, and cropping to generate 13 bands of multispectral images with a spatial resolution of 10 m. The data were mainly used for remote sensing interpretation of rice fields.

2.2.2. Gross Primary Productivity (GPP)

The GPP data were derived from the MOD17A2 product produced by NASA’s Land Processes Distributed Active Archive Center (LPDAAC) with 500 m spatial resolution and 8 days temporal resolution. In this study, GPP data for the 2019 rice growing season (1 May–31 August) in Tianjin were cropped and resampled to 10 m spatial resolution by bilinear interpolation method using the QGIS 3.22.1 software.

2.2.3. Evapotranspiration (ET)

The ET data were derived from the MOD16A2 product produced by NASA’s Land Processes Distributed Active Archive Center (LPDAAC) with 500 m spatial resolution and 8 days temporal resolution. In this study, ET data for the 2019 rice growing season (1 May–31 August) in Tianjin were cropped and resampled by the bilinear interpolation method using QGIS 3.22.1 software to obtain ET raster data with a spatial resolution of 10 m.

2.2.4. Precipitation and Temperature Data

Precipitation and temperature data were obtained from TerraClimate [49], a global land surface monthly climate and climate water balance dataset with a spatial resolution of 4638.3 m and a monthly temporal resolution. In this study, precipitation and temperature data for May–August 2019 in Tianjin were downloaded from Google Earth Engine (GEE). The data resampling and clipping pre-processing based on the bilinear interpolation method were performed in QGIS 3.22.1 software. Finally, the raster data of accumulated precipitation and average temperature of each month with a spatial resolution of 10 m were obtained.

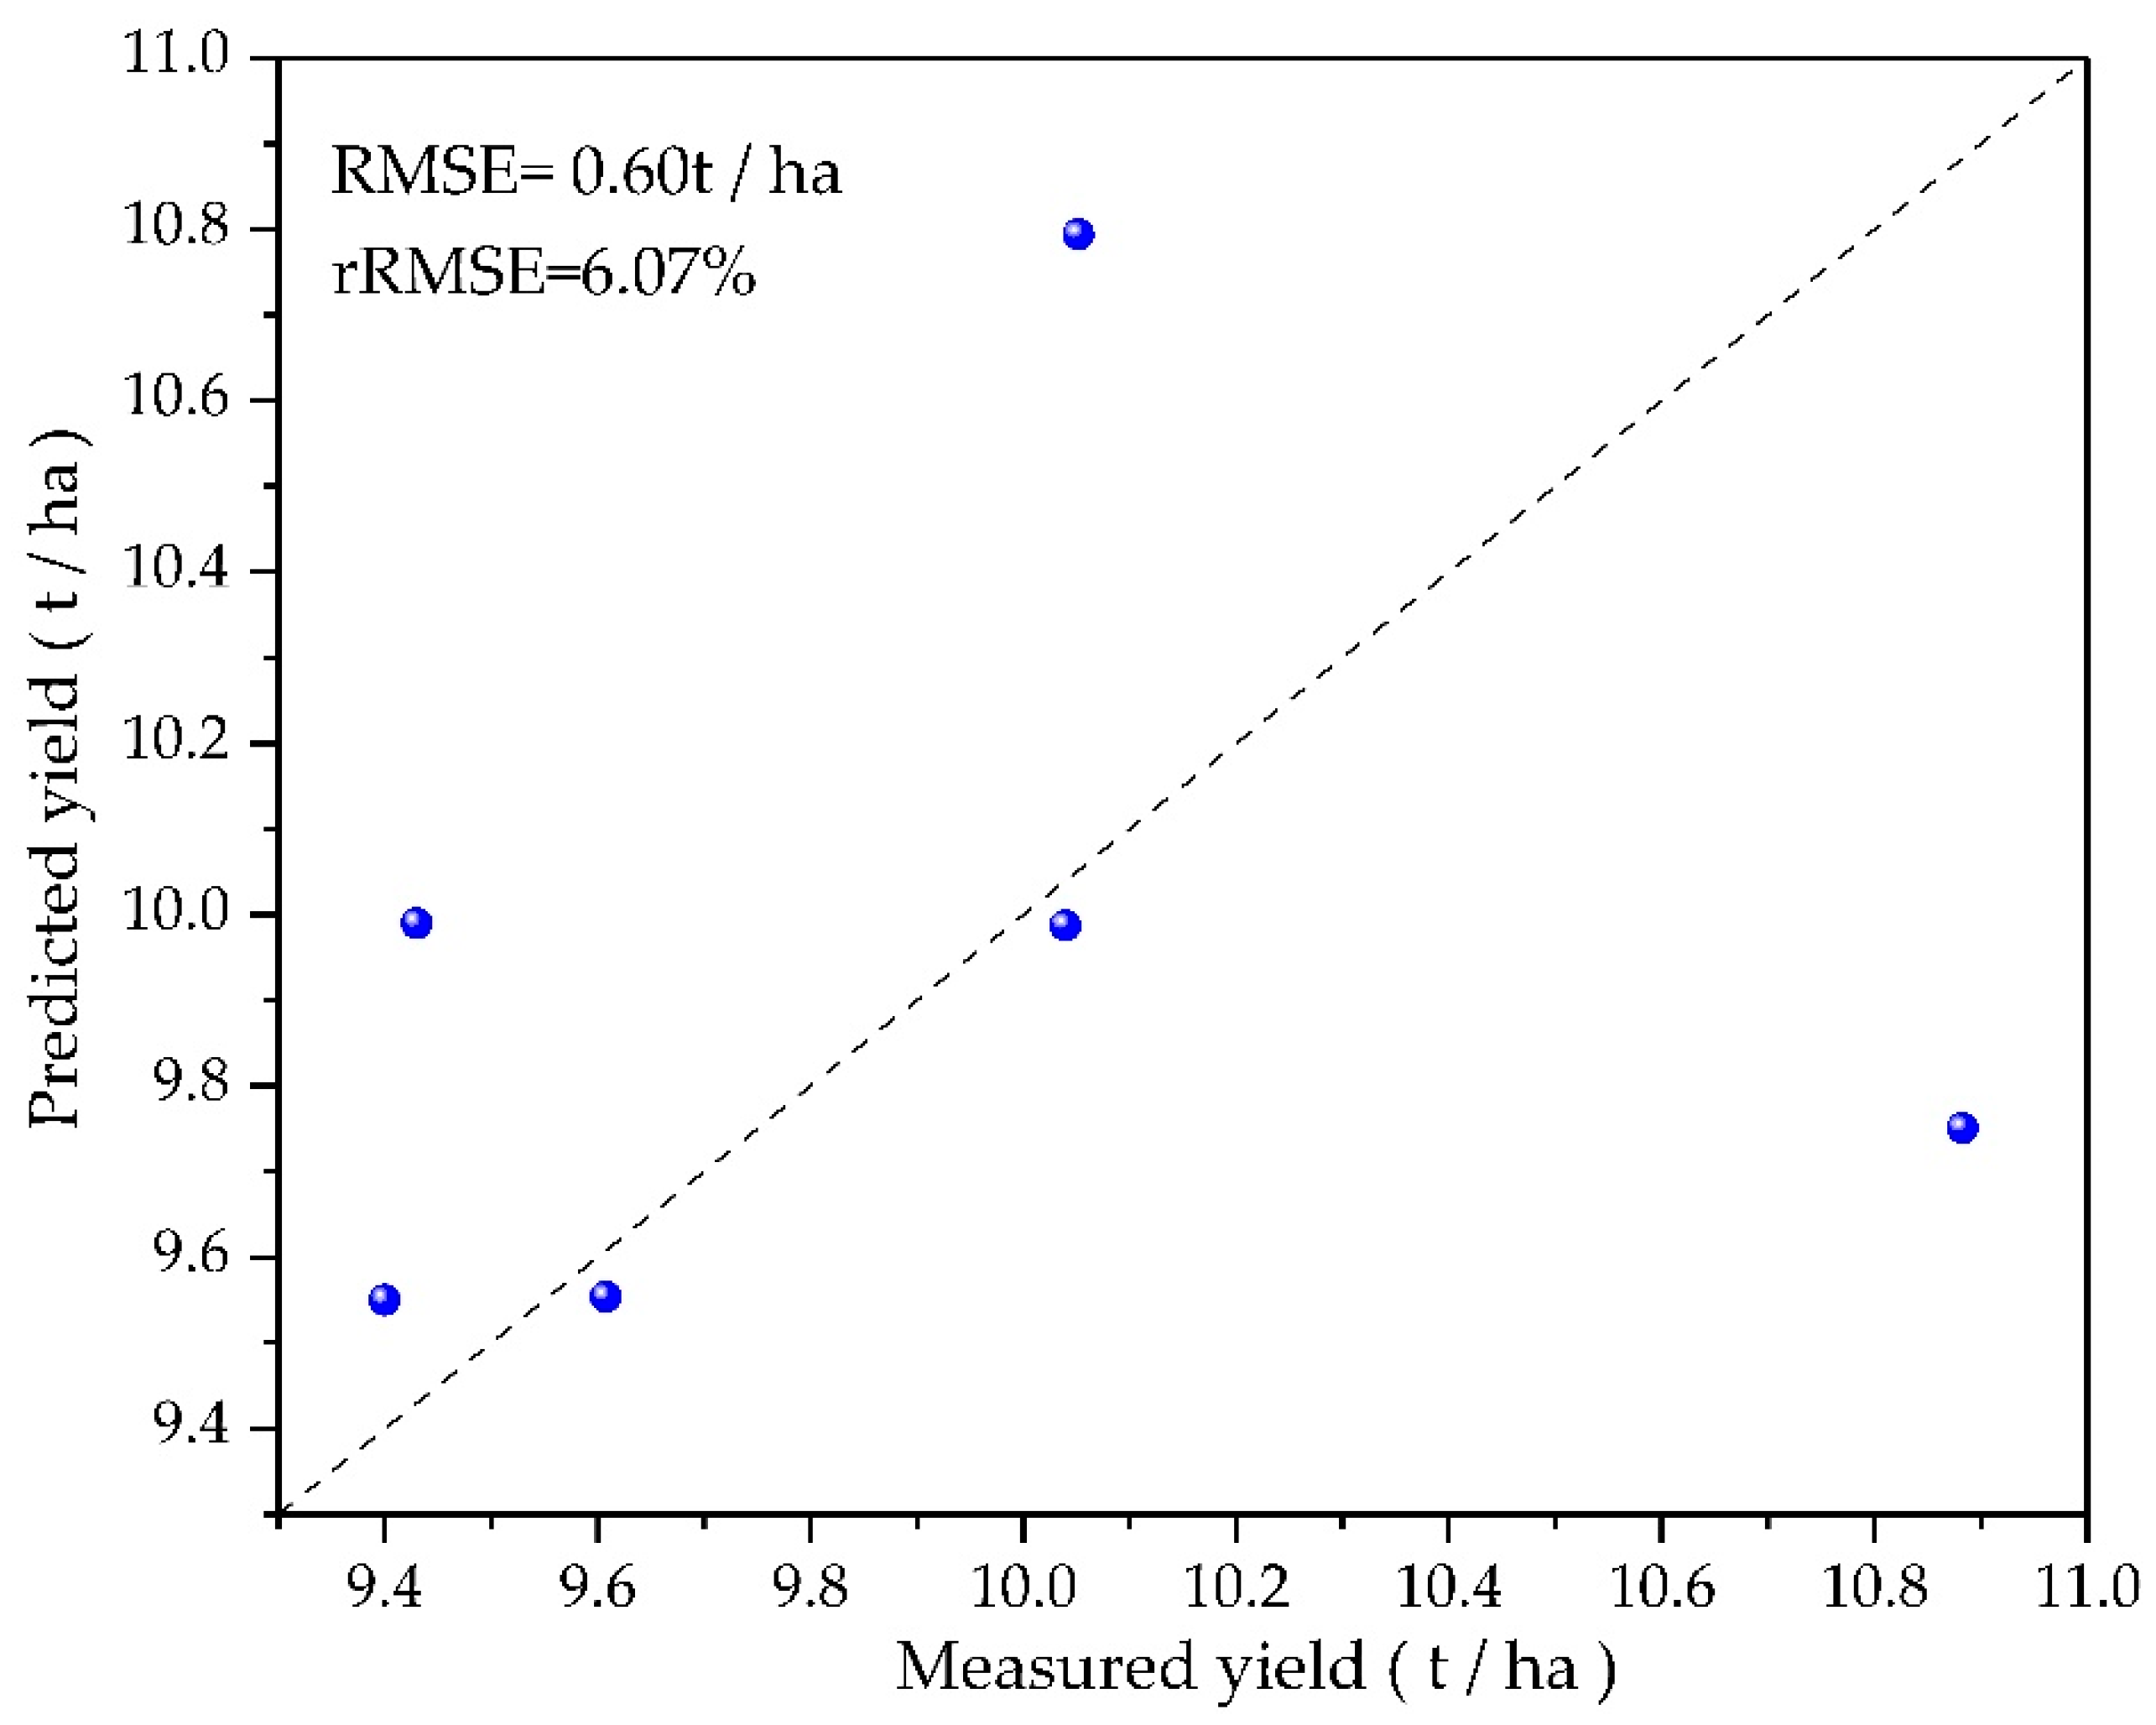
2.2.5. Rice Yield Data

Researchers collected four rice yield per unit area data obtained from the actual measurement of a measured rice field in Tianjin High Quality Agricultural Products Development Demonstration Center from 2017 to 2020, and the rice variety in this field was Xiaozhan rice. In addition, the researchers collected two rice yield data per unit area in Tianjin in 2019 and 2020 through the statistical annals released by the National Bureau of Statistics. In summary, six groups of rice yield per unit area data were used in this study to verify the accuracy of the rice yield estimation model proposed in this paper.

2.3. Methods

2.3.1. Remote Sensing Interpretation of Paddy Fields

Four types of feature locations (paddy fields, other vegetation, buildings and water) were collected as remote sensing interpretation marker samples by field survey in July 2019 (Figure 1). The number of samples were 120, 280, 69 and 51, respectively, with a sample size of 20 × 20 m. The sample locations were located using the GNSS system for the four to points. Seventy-five percent of the samples of each type were randomly selected for model training, and the remaining 25% of samples were used for accuracy verification. The remote sensing interpretation of Sentinel-2 data was performed in QGIS 3.22.1 software using the random forest classification method. The accuracy of the remote sensing interpretation was verified using a confusion matrix. The classification accuracy of rice in this study reached 98.3%.

2.3.2. ESV Accounting Methods

According to Millennium Ecosystem Assessment [4], Xiao [38], Ouyang [50] and Hu [51], the ESV accounting framework of the PFE was divided into four categories of provisioning services, regulating services, cultural services, and negative regulating values, with 12 subcategories for monetization estimation. Due to data limitations, we did not include support services in the accounting framework.
(1)
Provisioning service value
Among the provisioning service values, the primary products supply function is the most important contribution to human well-being and the primary service of PFE. In contrast, straw, as a renewable resource, can be used for fuel, feed, direct field return, and industrial processing. The market value approach was used to estimate the value of products.
I.
The value of primary products was estimated as:
E S 1 = E S f + E S s V c o s t ,
E S f = M f × P f ,
M f = t = 0 a G P P t × F × R × H I × r ,
E S s = M s × P s ,
M s = M f × K ,
V c o s t = M f × P c o s t ,
In Equation (1), ES1 is the provisioning value (RMB 10 k); ESf is the value of rice products (RMB 10 k); ES is the value of rice by-products (straw) (RMB 10 k); Vcost is the total cost of planting rice fields (RMB 10 k); in Equation (2), Mf is the rice yield (t). We improved the method of Peng [52] to map the rice yield in our study area. Pf is the market price of rice (RMB/t) and, according to field research, the average price of rice in Tianjin in 2019 was RMB 3000/t. In Equation (3), GPP (kg·C/m2) is the sum of GPP in each rice growing period; F is the conversion coefficient of carbon into rice biomass, which was set to 2.22; R is the proportion of above-ground rice biomass, which was taken as 0.90; HI is the rice harvest index, which was taken as 0.60; t ranges from 0 to a, indicating the rice growing period, which is 1 May–31 August according to rice phenology observations in Tianjin; r is a constant with a value of 1.4. In Equation (4), Ms is the rice by-product (straw) yield (t); Ps is the rice by-product (straw) market price (RMB/t); according to market research, the straw price of Tianjin in 2019 was RMB 50/t; in Equation (5), K is the rice straw coefficient and was set to 1.33 [53]; in Equation (6), Pcost is the cost of paddy cultivation (RMB/t), which mainly includes the purchase of production materials (seeds, fertilizers, agriculture, etc.), irrigation, tillage, and the cost of hired labor for agricultural production.
Comparing the measured yield data of rice in field plots with the predicted yield of rice, Figure 2 shows high prediction accuracy of rice yield; the root mean square error (RMSE) is 0.60 t/ha. The accuracy rate reaches 93.97%. Therefore, we assumed that the method for predicting rice yield in this study is effective and feasible.
(2)
Regulation services value
I.
Carbon fixation and oxygen release
Rice has the ability to absorb CO2 and release O2. According to the chemical reaction formula of photosynthesis, 1 g of plant dry matter can absorb 1.63 g of CO2 and release 1.2 g of O2. Referring to the calculation method of greenhouse gas inventory recommended by the IPCC [54], the ecological value of carbon sequestration and oxygen release is estimated by the carbon tax and industrial oxygen production methods. The calculation method is as follows:
E S 2 = V C + V O ,
V C = H × α × N C × P C ,
V O = H × β × P O 2 ,
H = ( M f + M s ) × γ ,
In Equation (7), ES2 is the value of carbon fixation and oxygen release from rice (RMB 10 k); Vc is the value of carbon fixed by rice (RMB 10 k) and Vo is the value of oxygen released from rice (RMB 10 k). In Equation (8), H is the amount of dry matter (t), α is the amount of CO2 that can be fixed by producing 1 g of plant dry matter (1.63 g), and Nc is the proportion of C in CO2 (27.27%). Pc is the Swedish carbon tax rate [55] of USD 150/t carbon, equivalent to RMB 996.34/t. In Equation (9), β is the amount of O2 released from 1 g of plant dry matter, with a value of 1.2 g, and Po2 is the industrial oxygen production cost of RMB 400/t. In Equation (10), Mf, Ms and γ are rice yield, rice by-product (straw) yield and rice economic coefficient, respectively; γ was set to 0.5.
II.
Climate regulation
The climate regulation effect of the PFE is to reduce the air temperature, reduce the range of temperature variation and increase air humidity through plant transpiration and water surface evaporation; thus, improving the comfort level of the human living environment. The energy consumed for cooling and humidification is used as the evaluation index of the climate regulation function, and its value is estimated using the alternative cost method:
E S 3 = E T × ξ × P c o a l ,
where, ES3 is the value of climate regulation (RMB 10 k); ET is the cumulative evapotranspiration (mm) from July to August; ξ is the heat consumed by evaporation of 1 mm of water in 1 hectare of paddy field, which is replaced by the combustion of 0.6114 t of standard coal [56]; Pcoal is the coal price 340 (RMB/t) [37].
III.
Groundwater recharge
The rice inundation period in the study area was up to 140 days. In addition to satisfying the growth and evaporation of crops, part of the water in the field seeps into the underground to replenish the groundwater resources. The other water is returned to rivers and lakes through the irrigation system and drainage. In this study, only the ecological value of groundwater replenishment was considered, and the market value method was used for calculation as:
E S 4 = ( I W + P r E T g r o w t h ) × P w ,
where, ES4 is the value of groundwater conservation (RMB 10 k); IW is the amount of irrigation water (mm) during the rice growing period, which was set at 608, Pr is the accumulated precipitation (mm) during the rice growing period (May-August); ETgrowth is the cumulative evapotranspiration (mm) in the rice growth period (May–August); Pw is the price of agricultural water (RMB/m3), which was set at 0.24 [57].
IV.
Flood regulation
A paddy field is a special type of artificial wetland which can divert and store rainwater and play a role in regulating and storing floods and reducing flood disasters [58]. This ecological value is calculated mainly using the shadow engineering method to estimate the construction and maintenance cost of the flood volume regulated and stored by a paddy field relative to a reservoir of the same capacity. The value of water storage and flood control is calculated according to the average height of a paddy field ridge, the daily average water depth in the field, the paddy field area and the construction and maintenance cost of flood control reservoirs with unit flood diversion capacity in the study area:
E S 5 = ( H r D w ) × C w
where, ES5 is the value of flood regulation and storage (RMB 10 k); Hr is the average height of the paddy field ridge (m); Dw is the average water depth (m) during the paddy inundation period; Cw reservoir unit storage project cost and maintenance costs [50] (RMB/m3), and the value of 1.51 was taken in this study. According to field investigations, the average height of a paddy field ridge in Tianjin is 0.40 m, and the average water depth of a paddy field during the inundation period is 0.10 m.
V.
Material purification
Rice can absorb harmful gases present in the air and decompose them into nontoxic substances. Rice also has good blocking, filtering and adsorption effects on air dust and can effectively purify the air and improve the atmospheric environment. The blocking effects on SO2, nitrogen oxide and dust are generally considered to be beneficial. A PFE can precipitate, remove, absorb and degrade pollutants through a series of physical and biochemical processes to maintain part or all of the ecological functions of the ecosystem. The substitute cost method was used to estimate the material purification value according to the cost of industrial pollution control:
E S 6 = E S a + E S w
E S a = A × i = 1 3 D i × P i
E S w = A × m = 1 2 Q m × P m
In Equation (14), ES6 is the value of material purification (RMB 10 k); ESa is the value of purified air (RMB 10 k); ESw is the value of water purification (RMB 10 k); in Equation (15), A is the paddy rice planting area (ha) in the study area; Di is the basic amount of sulfur dioxide(SO2), nitrogen oxide and dust blocking per unit area of paddy field annually (t/ha·a); Pi is the cost of purifying SO2, nitrogen oxides and blocking dust per unit area of paddy field (RMB/t); in Equation (16), Qm is the quantity of biochemical oxygen demand (BOD) and chemical oxygen demand (COD) purified per unit area of paddy field annually (kg/ha·a); Pm is the cost of water purified per unit area of paddy field (RMB/kg).
According to the standard pollutant discharge fee in Tianjin [59], the cost of paddy field to purify SO2, nitrogen oxide and control dust is 6300 RMB/t, 8500 RMB/t and 1500 RMB/t, respectively; the capacity of a paddy field to purify SO2, nitrogen oxide and control dust [60] is 0.045 t/ha· a, 0.033 t/ha·a and 0.92 t/ha·a, respectively. Lin [61] found that the removal rate of BOD in a paddy field ecosystem was about 4~17%, and the COD was between 4 and 16%. According to the environmental bulletin of Tianjin in 2019, the purification amount of BOD and COD were 17.07 kg/ha·a and 26.34 kg/ha·a, respectively. The cost of water purification treatment was 46.7 RMB/kg [62].
(3)
Cultural service value
I.
Landscape aesthetic value
A paddy field ecosystem can provide aesthetic and spiritual experiences to local residents, improving the value of the surrounding land. The hedonic pricing method was used to estimate the aesthetic value of the landscape:
E S 8 = A × P a ,
where, ES8 is the landscape aesthetic value (RMB 10 k); A for the study area rice planting area (ha); Pa is the premium per unit area due to ESV, which is 8.80 (RMB/ha·a) in this study [63].
(4)
Negative reconciliation value
In addition to the above ES, a PFE also has negative ES, such as greenhouse gas (GHG) emissions, water consumption, soil and water pollution caused by excessive use of agricultural chemicals and fertilizers, etc. Therefore, it is necessary to evaluate these negative values and reduce these negative impacts.
I.
Greenhouse gas emission
Since paddy fields are permanently under irrigation, which provides an anaerobic environment for the soil, the interaction of organic fertilizers, humus, and rice root secretions and decomposition in the soil lead to GHG emissions, such as CH4 and N2O [39]. The global warming potential (GWP) recommended by IPCC [54] was used to convert CH4 and N2O emissions into CO2 emissions [64], and the carbon tax method was used to estimate the negative regulation value of greenhouse gas emissions in PFE:
E S 9 = ( E C H 4 × G W P C H 4 + E N 2 O × G W P N 2 O × T N + T N × E N + T P × E P + T K × E K ) × P C
where, ES9 is the negative ESV caused by greenhouse gas emissions (RMB 10 k); GWPCH4 and GWPN2O are GWP for CH4 and N2O in the past 100-year time horizon, 28 and 265, respectively, according to the IPCC [54]; ECH4 is the CH4 emission factor per unit area of paddy field (kg/ha), and the value of 0.84 was adopted in this study [65]. EN2O (kg/ha) is the N2O emission generated per unit nitrogen application rate in a paddy field, and the value of 0.256 was adopted in this study [65]; The values of TN, TP and TK are the amount (kg/ha) of N, P and K fertilizers used per unit area of paddy field, which are 120, 128 and 112, respectively. EN, EP and EK represent the greenhouse gases (kg CE/kg) emitted during the production of N, P and K fertilizers, respectively, with values of 2.12 × 10⁻³, 6.4 × 10⁻⁴ and 1.8 × 10⁻⁴ in this study; Pc is the Swedish carbon tax rate [55] of USD 150/t carbon, equivalent to RMB 996.34/t, as in Equation (7).
II.
Water consumption
The water resource consumption of a PFE is mainly transpiration, evaporation and underground leakage. Underground leakage can supplement groundwater in rice planting areas, which does not belong to the direct consumption of rice growth and should be a positive ESV. Therefore, we estimated only the value of rice growth water consumption. The market value estimation method is as follows:
E S 10 = A × V r × P w ,
where, ES10 is the negative ESV (RMB 10 k) caused by water consumption; Vr is the water demand per unit area of paddy field, that is the evapotranspiration ET (mm) during the growth period of rice; Pw is the agricultural water price (RMB/m3) and the value taken in this study was 0.24 [57].
III.
Agrochemical pollution
A large amount of chemical fertilizers, herbicides and pesticides are used during the growth of rice, which are highly polluting the paddy fields, surrounding waters and soil. The environmental cost method was used to estimate them according to:
E S 11 = M f × C ,
where, ES11 is the negative ESV caused by the pollution of agrochemicals (RMB 10 k); Mf is rice yield (t); C is the cost of environmental pollution control caused by excessive use of agrochemicals, here assumed to be 0.11 (RMB/kg) [66].
(5)
NESV
The NESV of the PFE is the difference between the positive ESV and the negative ESV.
E S P = i = 1 8 E S i
E S N = E S 9 + E S 10 + E S 11
E S t o t a l = E S P E S N
In Equation (21), ESP is the sum of positive ESV of PFE; ESi represents the values of agricultural products, regulation service and landscape aesthetics; in Equation (22), ESN is the sum of negative ESV of PFE; ES9, ES10 and ES11 are the negative regulation values of greenhouse gas emission, water consumption and agrochemical pollution, respectively; in Equation (23), EStotal is the NESV of the PFE.
The parameter values for the model in this study case can be viewed in Supplementary Table S1.

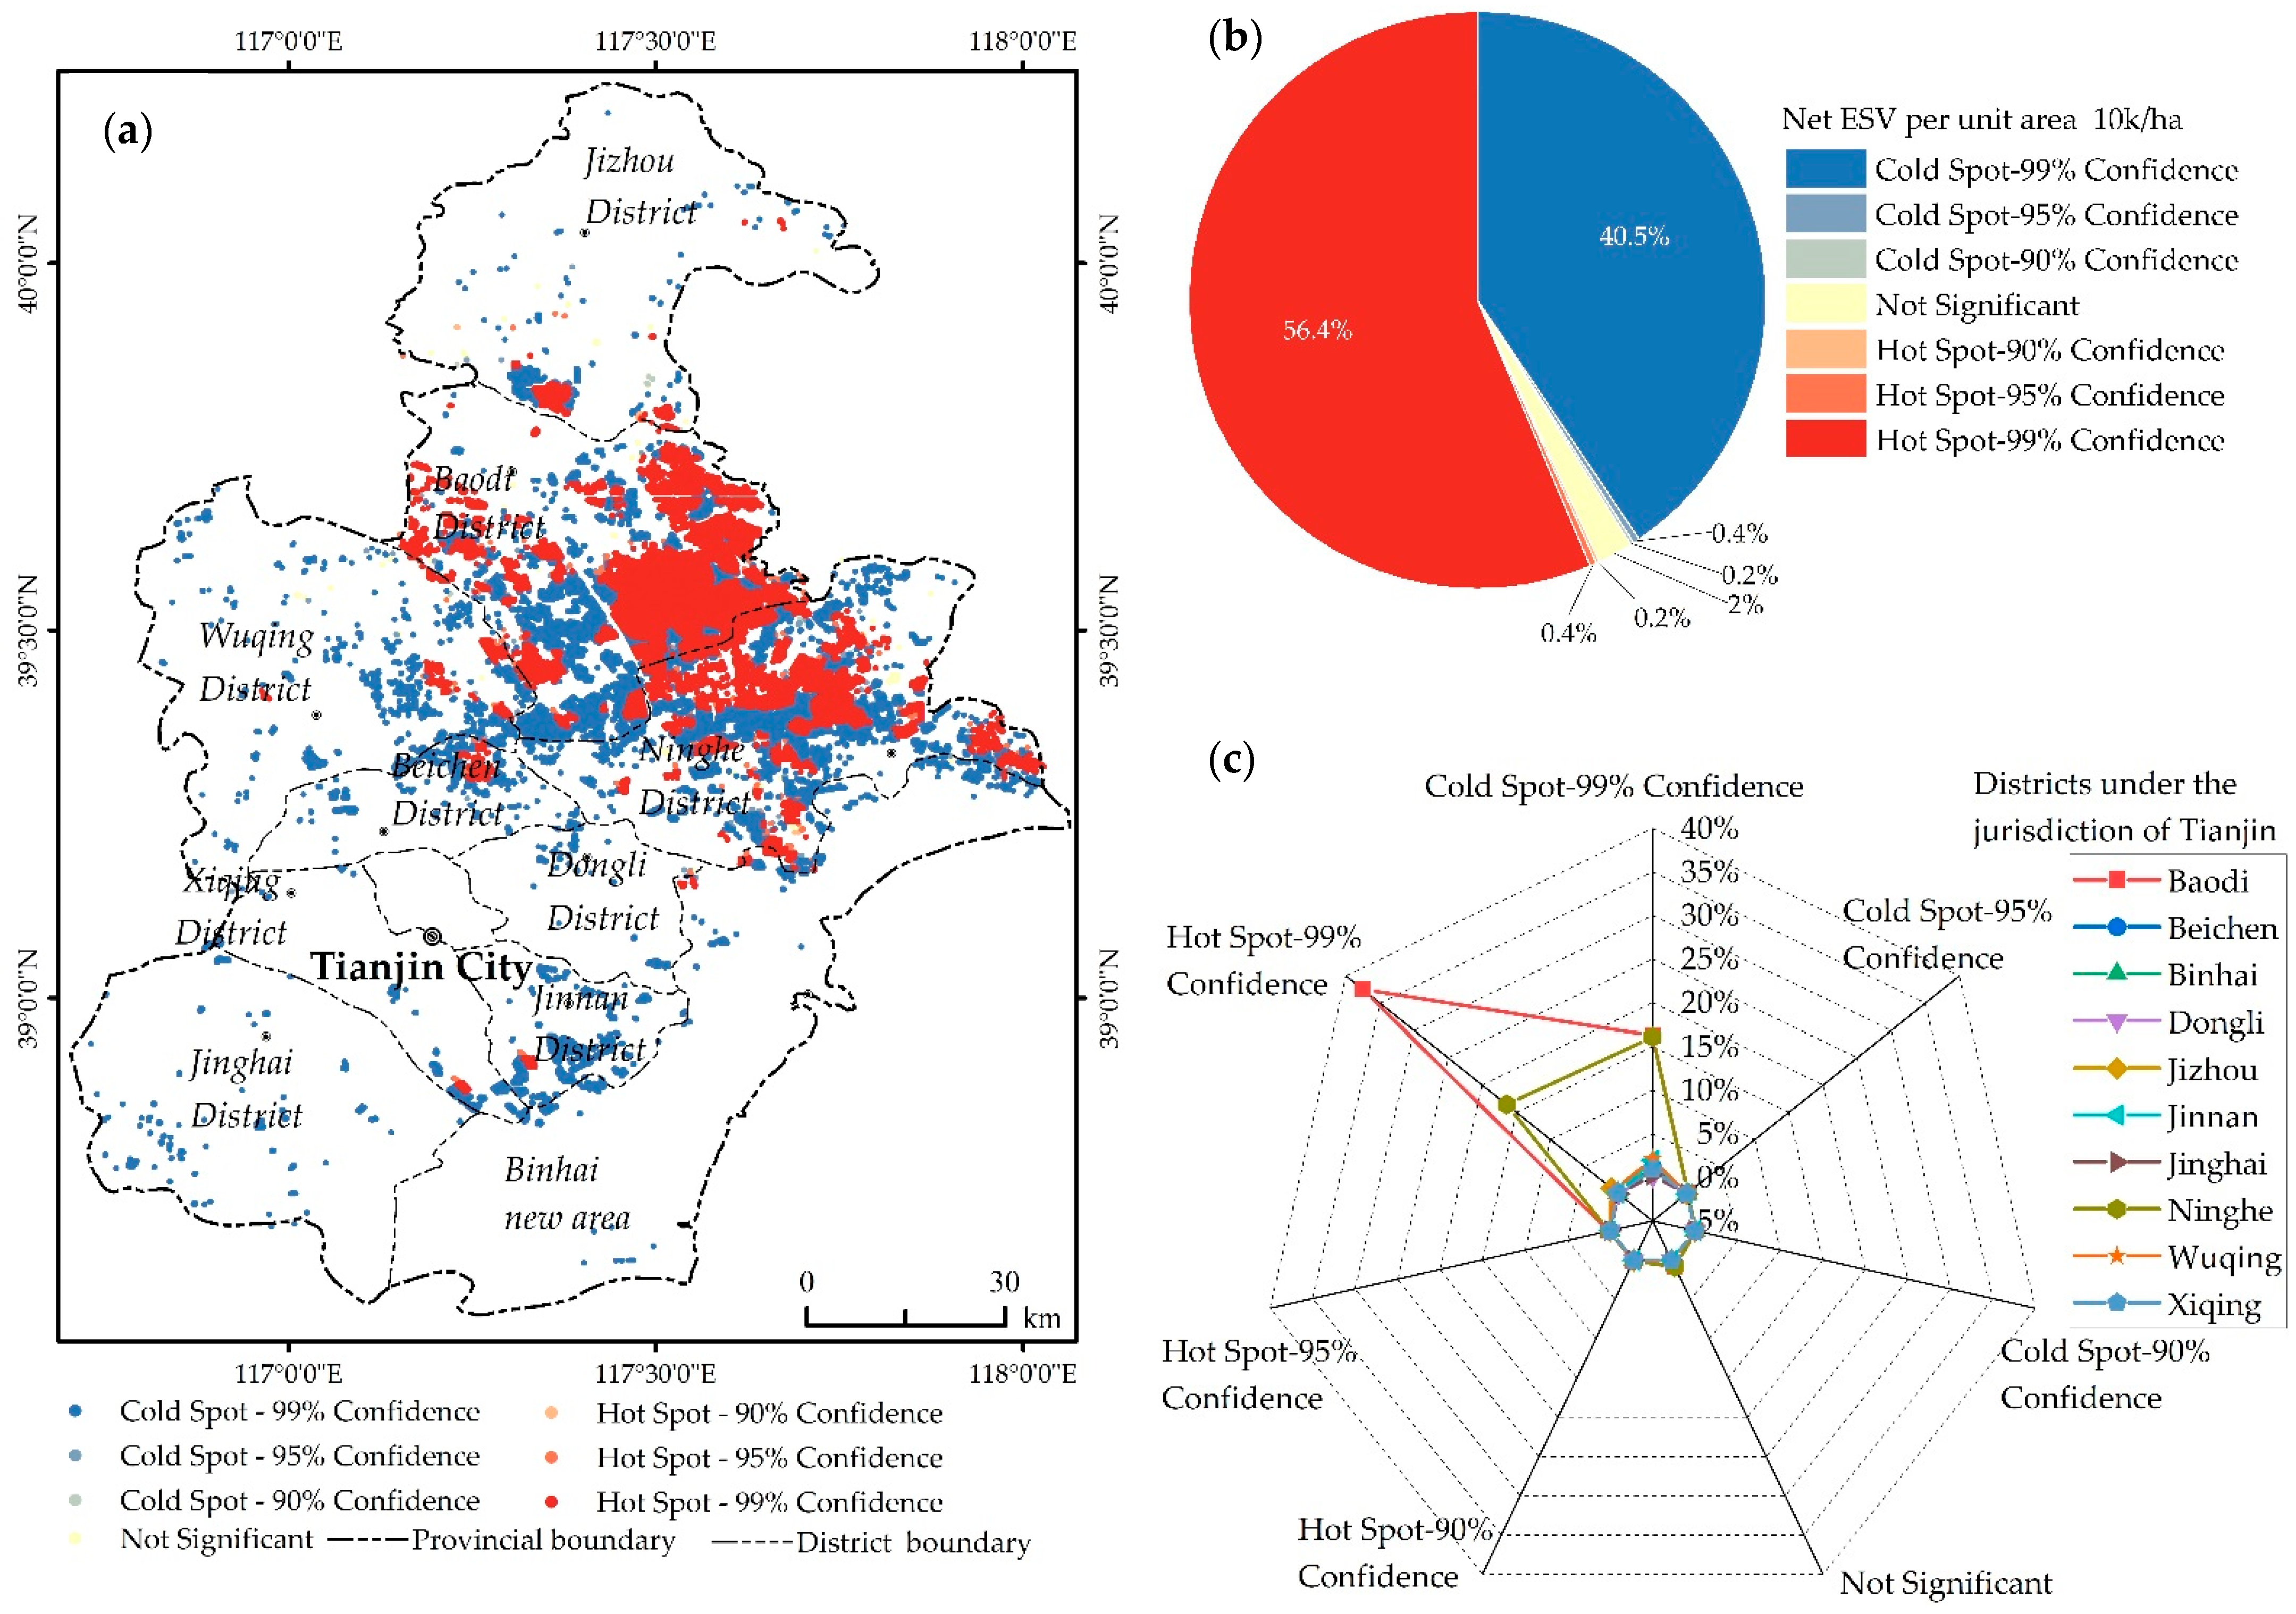
2.3.3. Hot Spot Analysis

Hot spot analysis calculates the Getis-Ord Gi* statistic for each feature in the dataset [67,68]. By analyzing the resulting z-scores and p-values, we can know the location of high or low value features clustering in space. z is the local sum of a feature and its neighbors compared to the sum of all features to produce a statistically significant value. The calculation method is as follows:
G i * = j = 1 n ω i , j x j j = 1 n x j n j = 1 n ω i , j j = 1 n x j 2 n ( j = 1 n x j n ) 2 [ n j = 1 n ω 2 i , j ( j = 1 n ω i , j ) 2 ] n 1
where, the Gi* statistic is the score of z; x j is the attribute value of feature j; ω i , j is the spatial weight between features i and j; n is the total number of elements.
For the positive z-score with significant statistical significance, the higher the z-score, the closer the high value (hot spot) clustering. For statistically significantly negative z-scores, the lower the z-scores, the closer the low (cold spot) clustering. In this study, the hot spot analysis tool of ArcGis 10.4 was used to quantitatively evaluate and map the spatial variability of net ESV in a PFE on a pixel-by-pixel basis. The z-score of the Getis-Ord Gi* statistics of each pixel was divided into seven classes, of which three hot spots indicated high-value net ESV clustering and were statistically significant, three cold spots corresponded to low-value net ESV clustering and were statistically significant, and one class was non-significant (Table 1).

3. Results

3.1. ESV of PFE

3.1.1. Provisioning Service Value

The value of primary products in a PFE in Tianjin in 2019 was RMB 15.64 × 10⁸, of which the value of rice and straw were RMB 15.30 × 10⁸ and RMB 0.34 × 10⁸, respectively. Due to the large cost input of paddy rice in the planting and production processes, the production cost should be deducted when calculating the value of primary products. The planting cost per unit yield of rice in Tianjin was RMB 2503.4/t [69], and the total production cost in 2019 was RMB 12.77 × 10⁸. According to Equation (1), the net ESV of primary products of PFE was 2.87 RMB 2.87 × 10⁸.

3.1.2. Regulating Service Value

In 2019, the value of a PFE regulation service in Tianjin was RMB 32.66 × 10⁸, of which the total value of carbon fixation and oxygen release was RMB 5.43 × 10⁸ (RMB 2.61 × 10⁸ for carbon fixation and RMB 2.82 × 10⁸ for oxygen release). The value of climate regulation was RMB 21.77 × 10⁸ while the value of groundwater conservation was RMB 0.84 × 10⁸. The flood storage value RMB 2.46 × 10⁸. The material purification value was RMB 2.15 × 10⁸, of which RMB 1.05 × 10⁸ for air purification and RMB 1.10 × 10⁸ for water purification.

3.1.3. Cultural Service Value

The aesthetic value of a PFE landscape in Tianjin in 2019 was RMB 0.0048 × 10⁸.

3.1.4. Negative Reconciliation Value

In 2019, the negative ESV of PFE in Tianjin was RMB 5.84 × 10⁸, of which the negative value of greenhouse gas (GHG) emissions was RMB 4.95 × 10⁸, the negative value of water consumption was RMB 0.33 × 10⁸, and the negative value of agricultural chemicals pollution was RMB 0.56 × 10⁸.

3.1.5. Net Ecosystem Service Value

The net ESV of paddy field ecosystems in Tianjin in 2019 was RMB 29.68 × 10⁸ (Table 2), accounting for 0.21% of the GDP (RMB 1.41 × 10¹²). The average ESV per unit area was RMB 5.47 × 10⁴/ha, of which the positive ESV was RMB 6.55 × 10⁴/ha and the negative ESV was RMB 1.08 × 10⁴/ha, with the former being 6.08 times that of the latter, further demonstrating that PFEs combine the functions of both wetland and farmland ecosystems, and that their ecological service function plays a prominent role in the overall ecosystem.
The analysis of the positive ESV items shows the value of climate regulation (61.27%) > the value of carbon fixation and oxygen release (15.29%) > the value of primary products supply (8.08%). The sum of the values of regulation and cultural services was 11.4 times that of the provisioning services, which further indicates that the provisioning value of the PFE is far lower than the ESV it provides. This contradicts the view that paddy fields only have grain production value. The public tends to seriously underestimate the value of PFEs.
The net ESV classification statistics show that the highest proportion of net ESV per unit area was RMB 50–60 k/ha, accounting for 39.7%, followed by RMB 60–70 k/ha, accounting for 39.7% (Figure 3a,b). These two grades accounted for 67.8% of the net ESV of PFEs in Tianjin. Spatially, Baodi District had the highest ESV, accounting for 56.77% of the city’s ESV, followed by Ninghe District, accounting for 33.56% of the city’s ESV. The proportion of net ESV per unit area in Baodi District and Ninghe District was also higher than in other districts. The proportion of RMB 50–60 k/ha and RMB 60–70 k/ha grades in Baodi District reached 39.53% (Figure 3c).

3.2. Quantity of Products in PFE

3.2.1. Quantity of Primary Products

The total primary products of PFE in Tianjin in 2019 was 118.82 × 10⁴ t (Table 3), of which the total rice production was 51.00 × 10⁴ t with a unit area yield of 9400.20 kg/ha and the total rice by-products (straw) production was 67.82 × 10⁴ t with a unit area yield of 12,502.27 kg/ha.

3.2.2. Quantity of Regulating Service Materials

In 2019, in Tianjin the carbon sequestration of a PFE was 26.15 × 10⁴ t, the amount of oxygen release was 565.58 × 10⁴ t, the groundwater recharge amount was 2.72 × 10⁸ m3, the flood control amount was 1.63 × 10⁸ m3, the SO2, nitrogen oxide and dust blocking amount were 0.24 × 10⁴ t, 0.18 × 10⁴ t and 4.99 × 10⁴ t, respectively, and the BOD and COD were 0.09 × 10⁴ t and 0.14 × 10⁴ t, respectively.

3.2.3. Quantity of Material of Negative Regulating Service

The greenhouse gas emissions from PFEs in Tianjin in 2019 were 49.69 × 10⁴ t and irrigation water consumption was 6.17 × 10⁸ m3.

3.3. Spatial Distribution of Ecosystem Service Value

The hot spot analysis shows that the distribution of net ESV in Tianjin is clustered (Figure 4a), that is, the number of hot and cold spots is 98.00% (Figure 4b), and only 2% of the sample points (ESV pixels) are discrete. Among the clustering points, hot spots with confidence of 99% and z-score > 2.58 and cold spots with z-score < − 2.58 account for 96.90% of the total sample points (ESV pixels). In space (Figure 4a,c), the hot spots are mainly distributed in Baodi and Ninghe districts, accounting for 37.79% and 16.63%, respectively, while hot spots in other districts accounted for only 2.52%. Compared with the hot spots, the distribution of cold spots is relatively scattered, and is highest in Ninghe District, accounting for 17.19%, followed by Baodi District, accounting for 16.48%, and the proportion of other areas is 8.28%.
Combined with Figure 3a and Figure 4a, the net ESV per unit area in the southeast of Baodi District, the middle of Ninghe District and the south of Jizhou District was generally higher than that in the southwest of Baodi District, Xiqing District and Jinnan District, which was mainly due to the relatively concentrated distribution of paddy fields in these areas, excellent rice varieties, high field management level and relatively high rice yield.

4. Discussion

The PFEs have a high potential value. While they have been studied by many scholars, there is no unified framework for accounting for the ESV of PFEs. The assessment of their ESV is based on limited data, which has led to serious doubts about the credibility of the results. The main difference between this study and other ESV evaluation research of PFEs is that we emphasized the importance of multi-source remote sensing data. In this study, remote sensing data were used to calculate the ESV of PFEs at the pixel scale, replacing the data obtained from statistical methods to the maximum extent. This approach overcomes the neglect of spatial differences in PFE habitats in previous studies and makes up for the lack of parameter reliability in the model. Therefore, we believe that the results obtained by our method are more reliable.

4.1. Comparison of Existing Studies

According to Table 4, the value of climate regulation in this study is generally higher than in other research results based on empirical values to estimate the cooling effect of paddy fields. For example, Liu [56] estimated that the duration of persistent hot days in Suzhou in 2012 was 23 days, and the average daily evapotranspiration of paddy fields was about 6.89 mm/d. Xue [44] and Nie [62] estimated that the duration of air conditioning in Hunan Province in summer was 30 days, and the average daily use time was 6 h. The difference in empirical parameters directly leads to different evaluation results. In this study, according to the meteorological data of Tianjin, the hottest time is July to August. Therefore, the daily ET data of these two months were used to calculate the cooling effect value, which objectively reflects the climate regulation function of PFEs. The main reason for the low value of groundwater recharge in this study compared to most existing studies is that the price of agricultural water in this study area differs significantly from other study areas. For example, the price of water in Liu [56] and Li [36] were RMB 3.2/m3 and RMB 0.67/m3, respectively, while the price of agricultural water in this study area was RMB 0.24/m3. In addition, previous researchers used a unified soil infiltration rate to calculate the groundwater recharge. However, soil quality differences between plots will lead to large errors in soil infiltration rate, which will affect the estimation accuracy of groundwater recharge. In this study, the amount of paddy field irrigation water plus precipitation minus evapotranspiration during the rice growth period was used to calculate the groundwater recharge. This method overcomes the error of soil water infiltration rates caused by soil types and texture differences in different plots or regions, and improves the estimation accuracy of groundwater recharge.
There is large variability in the ESV per unit area of PFEs estimated by different researchers, and the main reasons are as follows: (1) the differences in economic development level, natural conditions, rice varieties and field management level between regions lead to different rice yield and cost input, which leads to large differences in some evaluation indexes; (2) price factors have a large impact on ESV, with differences in rice prices and agricultural water prices in different regions, while the combined effect of currency devaluation and other factors can lead to changes in ESV in different years; (3) inconsistencies in evaluation frameworks and methodologies have led to differences in the content and details of accounting by different researchers, such as Zheng [43] did not remove the cost of rice production from the value of supply services; (4) in some water-rich areas where agricultural water is free, and where groundwater replenishment in paddy ecosystems is real, the question of whether to calculate the ESV of this function or the appropriate value to be placed on the price of water for estimating it is a challenge for further research.
The research on ESV evaluation originated from Europe and the United States, and has been unprecedentedly developed in China. Especially in recent years, Chinese scholars have accounted for more than 60% of the research on the ESV evaluation of PFEs. This is mainly because the Chinese government has paid more attention to ecological protection year by year, so that the ecological service value can be applied to specific work, such as policy formulation and performance evaluation. We focused on the comparison of research results of different scholars in China, and did not conduct a comparative analysis of research results outside China. This is mainly because different planting systems, planting costs and management methods in different countries make it difficult to conduct a comparative analysis of the ESV of PFEs between countries.

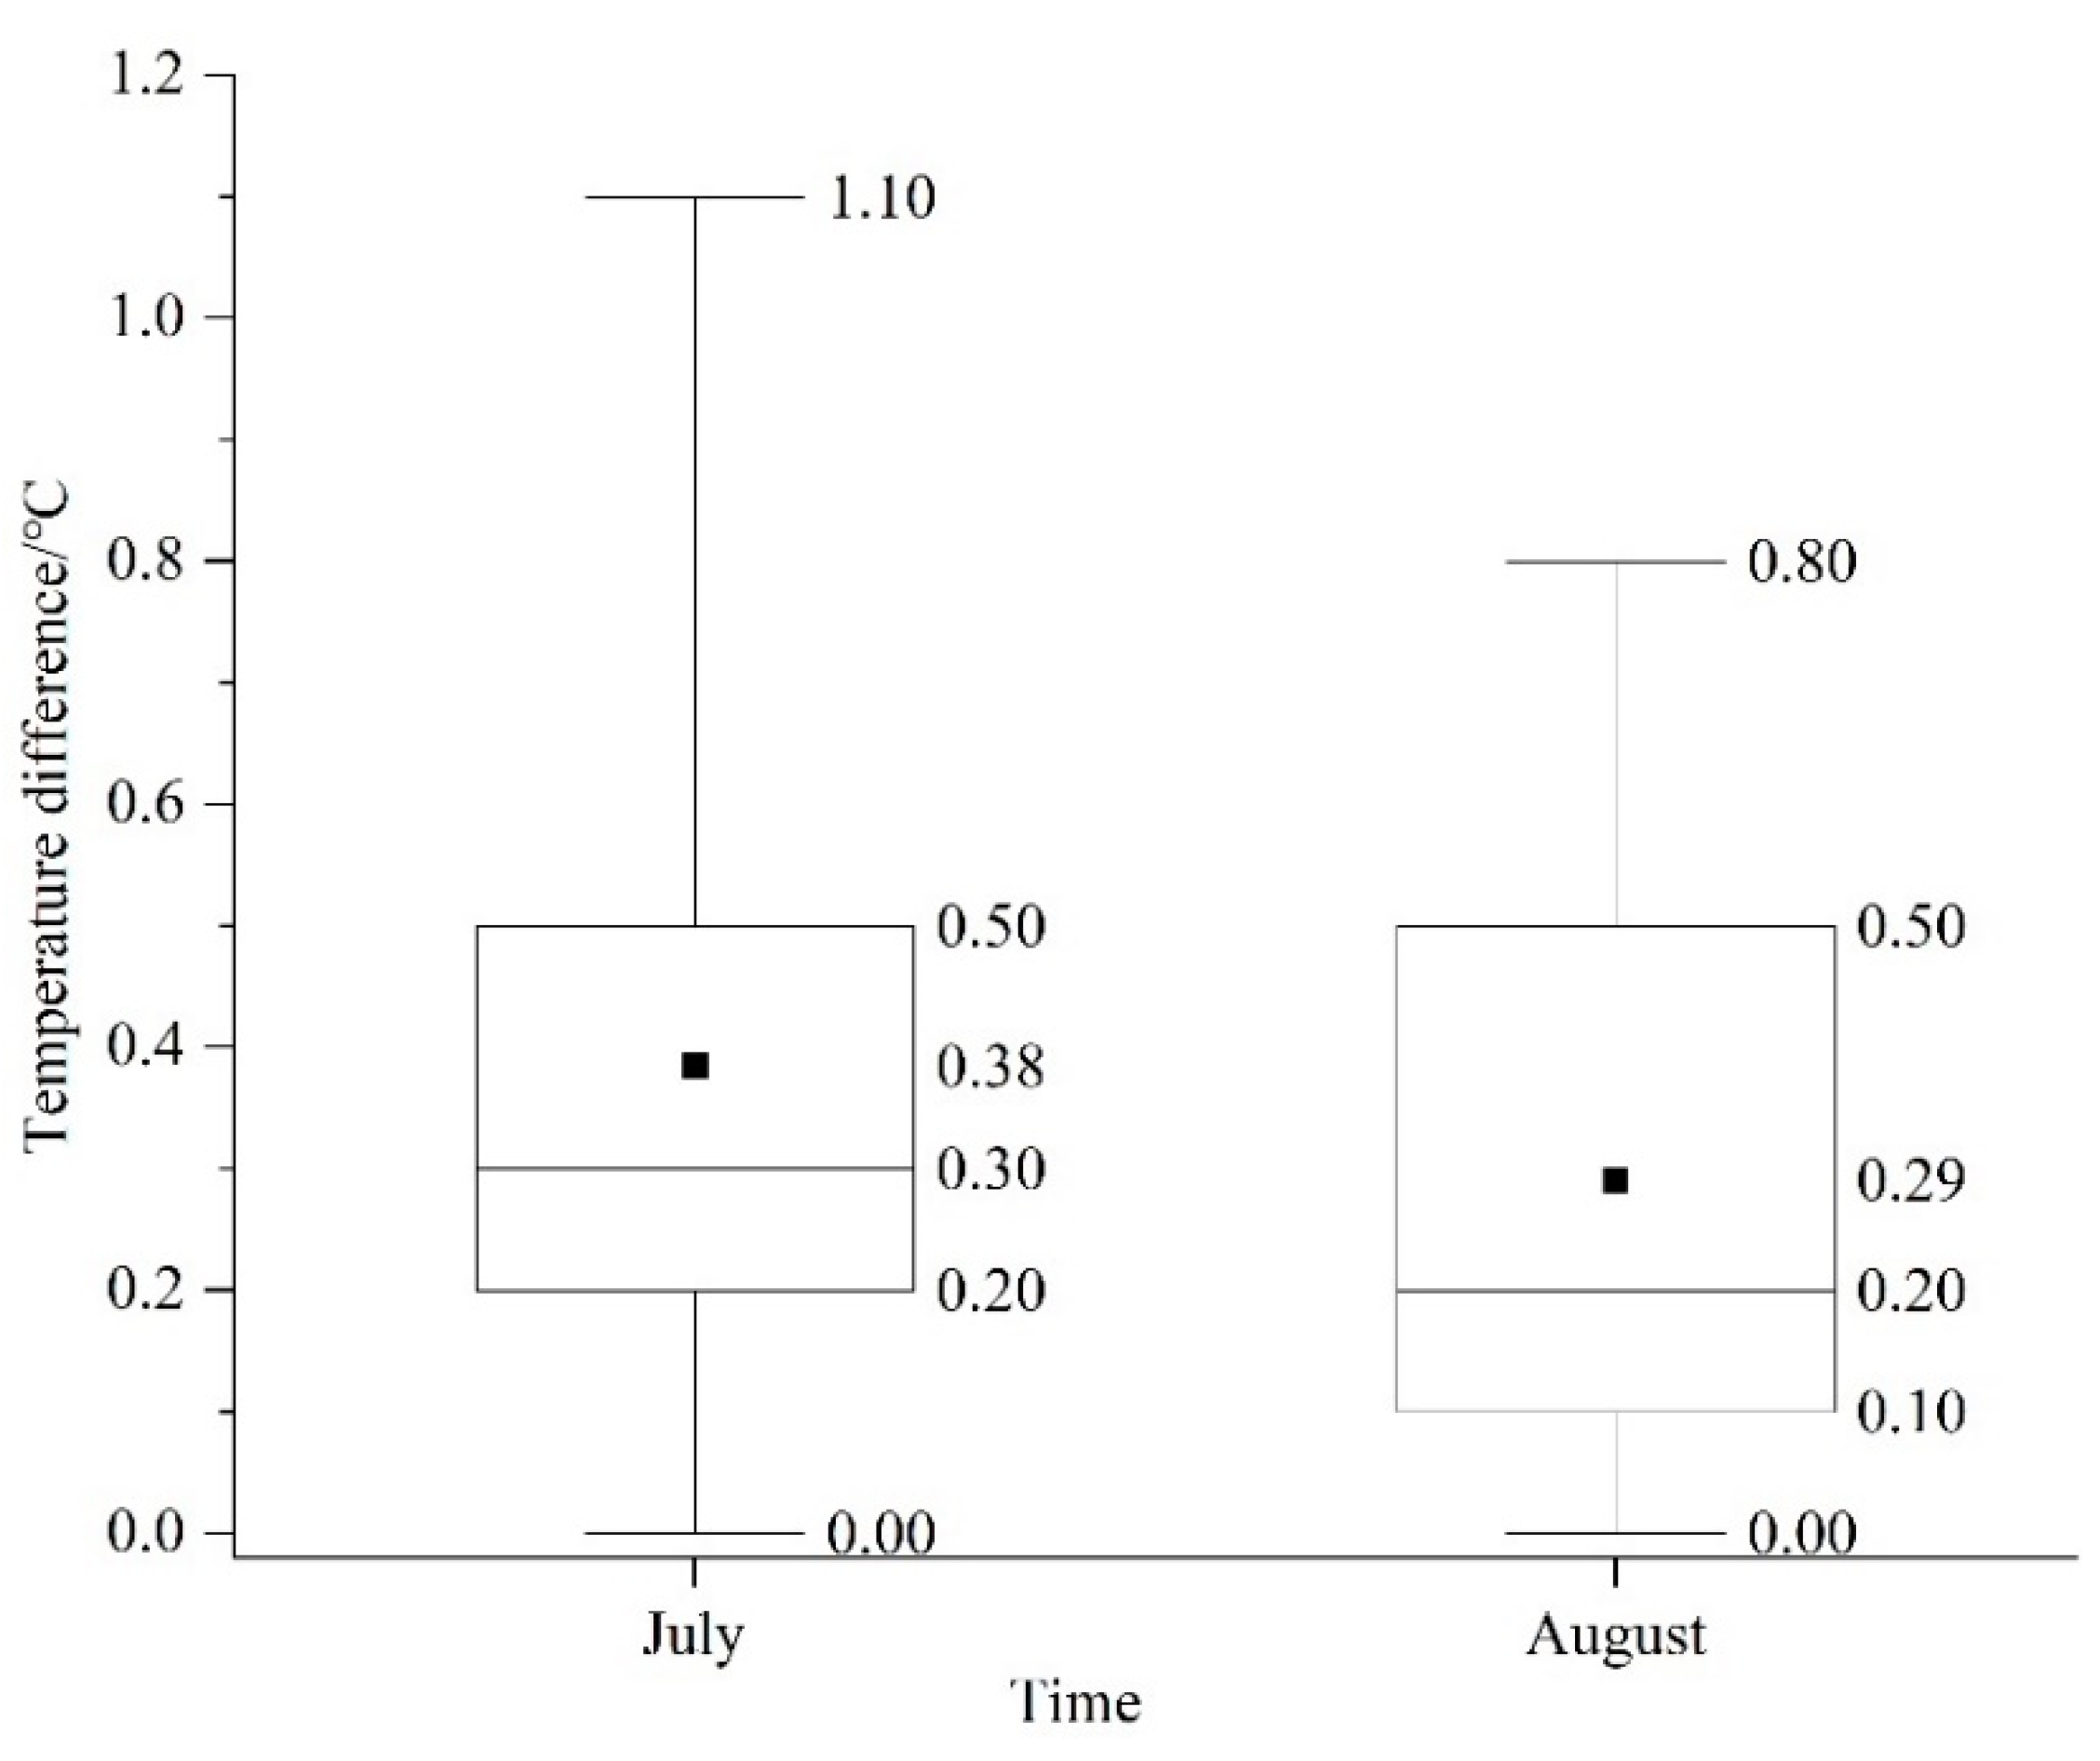
4.2. Cooling Function of Paddy Fields

We randomly selected 45 built-up areas and 45 paddy field sample points from the remote sensing, interpreted the sign samples, counted the temperatures of each point in July and August, and calculated the temperature difference between the built-up area and the paddy field. The results show that the temperatures in the paddy field were lower than those in the built-up area (Figure 5), with the average temperature difference between the two in July and August of 0.38 °C and 0.29 °C, respectively, and the maximum temperature difference is 1.10 °C and 0.80 °C, respectively, which is consistent with Kim’s [74] studies. Because rice needs to remain flooded throughout the growing season, rice plant transpiration and water evaporation will play a role in reducing the temperature and increasing the air humidity, so a cold island is formed in the paddy field. According to the calculation, the value of climate regulation services of PFEs in Tianjin accounts for 61.05% of the positive ESV, which is the largest category in ESV. The total cooling effect of rice paddy fields reaches 240 mm, which is equivalent to the heat of burning 7.96 × 10⁶ t of standard coal, which indicates that the climate regulation effect of PFEs is significant and can greatly improve the comfort level of a human living environment.

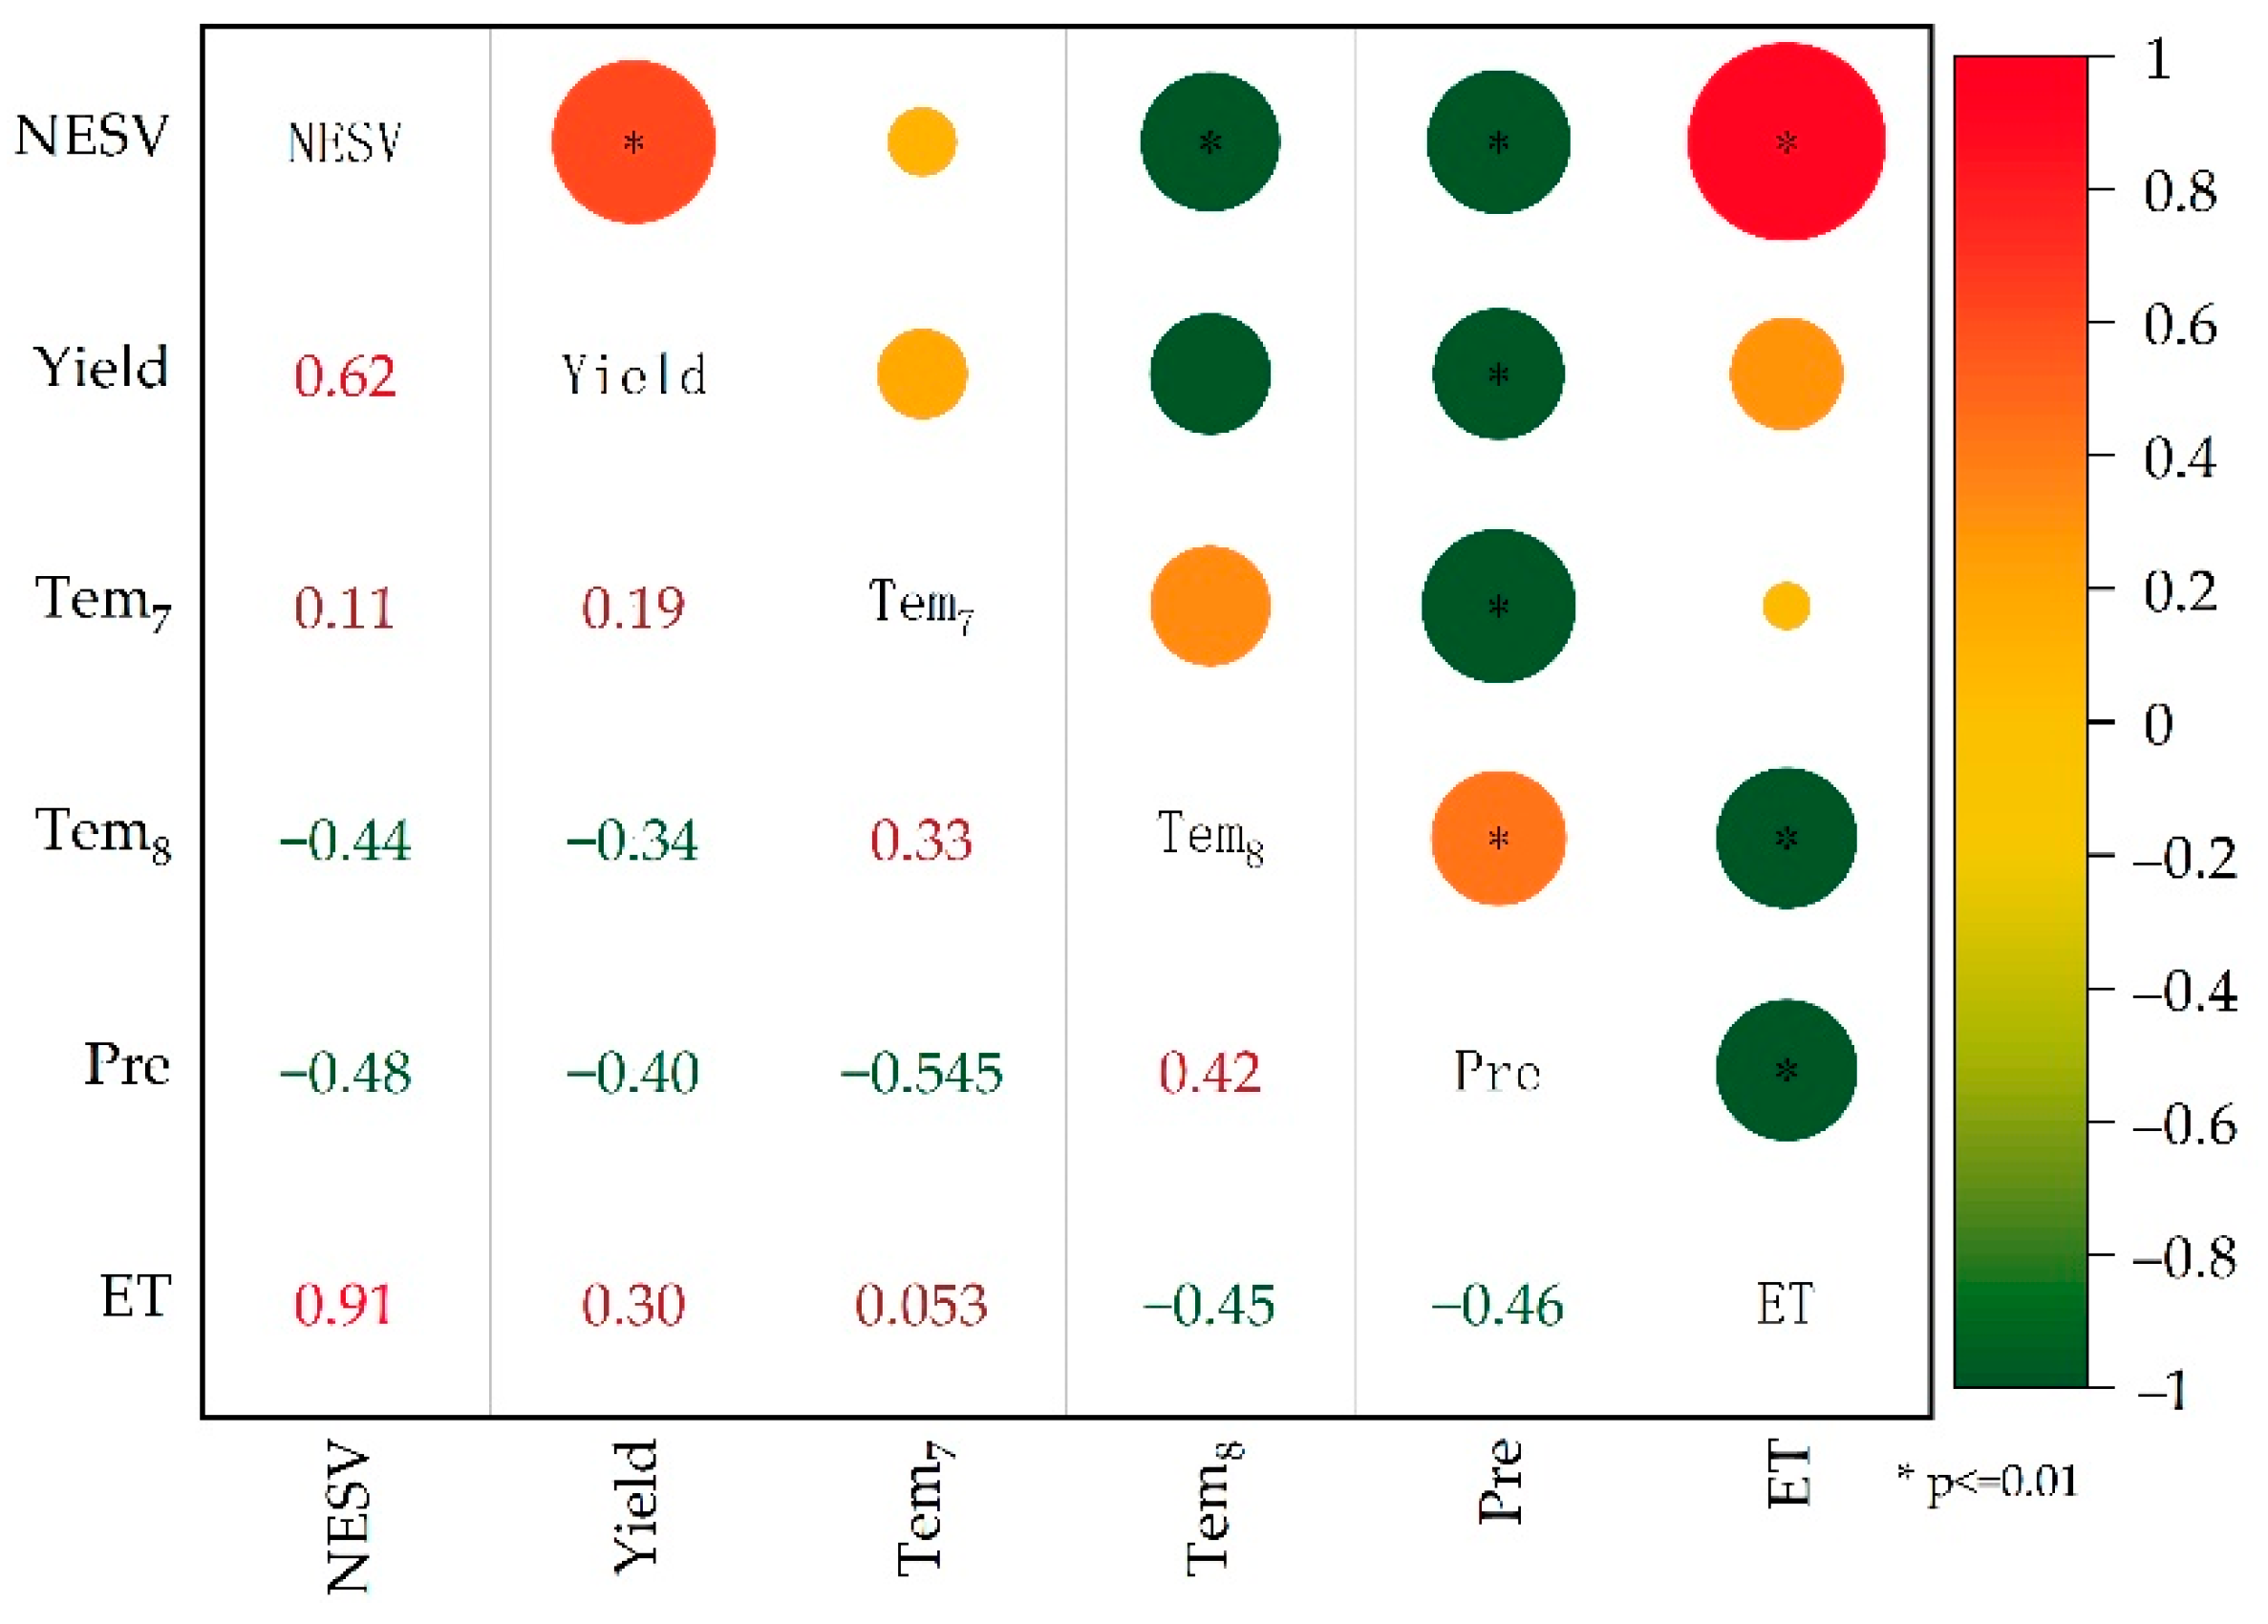
4.3. Influencing Factors of ESV

The net ESV, rice yield, precipitation, ET, and average temperature in July and August of 45 paddy field samples were randomly selected in the remote sensing interpretation marker samples. The Pearson correlation coefficient of each statistic was calculated with the Origin 2022 software and mapped (Figure 6). The results show that net ESV was positively correlated with rice yield and ET and negatively correlated with precipitation and average temperature in August, and passed the 0.01 level significance test. ET has the strongest correlation between net ESV and the absolute correlation coefficient between the average temperature in August, and net ESV is only lower than ET, while ET and the average temperature in August represent the climate regulation service function of a rice field ecosystem, which further confirms that the PFE exerts an important climate regulation function. Rice yield directly affects the ESV of supply services, carbon fixation and oxygen release, and these two ESVs account for 20.38% of the positive ESV, which shows a significant correlation between rice yield and net ESV of 0.618. The proportion of positive ESV influenced by ET and rice yield reached 87.01%. Therefore, the accuracy of ET and rice yield indicators directly determines whether the accounting of ESV in PFEs is reasonable. Due to the differences in rice varieties and paddy field management, rice growth and rice yield are spatially heterogeneous. Because rice growth affects the transpiration of vegetation, the ET will also vary spatially. Previous studies evaluating the ESV of PFEs have adopted uniform yield parameters, and thus could not be used to describe spatial patterns. In this study, the accuracy of rice yield estimation using GPP remote sensing data reached 99.74%. ET data were daily products calculated using the Penman model, and the accuracy of verification with the ground flux tower was greater than 85% [75]. Therefore, the high-precision parameters with spatial differences input in this study can overcome the shortcomings of ignoring the spatial heterogeneity of parameters in previous studies and improve the credibility of ESV assessments.

4.4. Recommendations and Prospect

The negative ESV of the PFE in the study area accounted for 19.69% of the net ESV, of which the GHG emission value accounted for 16.68%. Relevant studies suggest that appropriate reduction of nitrogen fertilizer, rational application of biochar and denitrification modifiers, combined with scientific control of irrigation time and water quantity, can achieve double effects of GHG emission reduction and yield assurance in paddy fields [65,76,77]. Therefore, to reduce GHG emissions, water consumption and the negative ESV of PFEs, we suggest to reduce the use of nitrogen fertilizer, increase the use of biochar, nitrification inhibitors and iron supplements, choose to plant drought-resistant rice varieties, gradually change the irrigation method of rice fields from long-term flooding to medium-term sunning, and reduce the amount of water used for irrigation, among other methods.
With the continuous enrichment of remote sensing data sources and the emergence of new algorithms, the role of multi-source remote sensing data in the study of ESV accounting is becoming increasingly important. Higher spatial resolution data, such as evapotranspiration and precipitation, can help the fine accounting of ESV. The retrieval of GHG emission data from remote sensing data at high temporal resolution and medium-high spatial resolution will enable more accurate accounting of the negative ESV of paddy ecosystems and help guide rice planting.

5. Conclusions

In this study, we integrated multi-source remote sensing data, improved the ESV accounting framework of PFEs based on physical ecological processes, and conducted a study on the estimation of the ESV of PFEs in Tianjin in 2019. (1) The fusion of multi-source remote sensing data can replace statistical data, accurately obtain evaluation model parameters, enhance the credibility of evaluation results, and enable spatial mapping of ESV of PFEs at the provincial scale at medium-high spatial resolution. (2) The net ESV of PFEs in Tianjin in 2019 was RMB 29.68 × 10⁸, accounting for 0.21% of GDP, and the average ESV per unit area was RMB 5.47 × 10⁴/ha. (3) The value of PFE regulating services is 11.4 times higher than the value of products, and the value of climate regulation accounts for 61.27% of the positive service value, validating the outstanding ecological role of PFE. (4) The total net ESV of Baodi District was RMB 16.85 × 10⁸, which was higher than that of other districts, and the net ESV per unit area shows significant spatial clustering, with 56.9% and 41.1% for hot spots (high-value ESV) and cold spots (low-value ESV), respectively. In this study, we realized a pixel-based ESV accounting of PFEs based on physical ecological processes, demonstrating the potential of multi-source remote sensing data in this ESV accounting framework, and provided a reference for using ESV accounting research based on physical ecological processes. Furthermore, our research finding not only provides data support for agricultural ecological compensation and agricultural sustainable development policy formulation, but also provides a methodology for evaluating the impact of land use change on ESV.

Supplementary Materials

The following supporting information can be downloaded at: https://www.mdpi.com/article/10.3390/su14159466/s1, Supplementary Table S1: List of parameter values for the model in this study case.

Author Contributions

Conceptualization, T.H., K.W. and W.H.; methodology, T.H., K.W. and W.H.; formal analysis, T.H., K.W. and W.H.; investigation, Y.L. and Y.Y.; resources, Z.L. and Y.Y.; writing—original draft preparation, T.H.; writing—review and editing, T.H.; visualization, T.H.; supervision, K.W. and W.H.; project administration, K.W.; funding acquisition, K.W. All authors have read and agreed to the published version of the manuscript.

Funding

This research was funded by the National Key Research and Development Plan Program (grant no. 2019YFE0125300).

Institutional Review Board Statement

Not applicable.

Informed Consent Statement

Not applicable.

Data Availability Statement

Data are available from the authors upon reasonable request as the data need further use.

Acknowledgments

We appreciate the critical and constructive comments from three anonymous reviewers and thank all editors that participated in the revision process.

Conflicts of Interest

The authors declare that they have no known competing financial interests or personal relationships that could have appeared to influence the work reported in this paper.

References

  1. Daily, G.C. Nature’s Services: Societal Dependence on Natural Ecosystems; Yale University Press: New Haven, CT, USA, 1997. [Google Scholar] [CrossRef]
  2. Daily, G.C.; Derqvist, T.; Aniyar, S.; Arrow, K.; Dasgupta, P.; Ehrlich, P.R.; Folke, C.; Jansson, A.; Jansson, B.; Kautsky, N.; et al. The value of nature and the nature of value. Science 2000, 289, 395–396. [Google Scholar] [CrossRef] [PubMed] [Green Version]
  3. Costanza, R.; D’Arge, R.; de Groot, R.; Farber, S.; Grasso, M.; Hannon, B.; Limburg, K.; Naeem, S.; O’Neill, R.V.; Paruelo, J.; et al. The value of the world’s ecosystem services and natural capital. Nature 1997, 387, 253–260. [Google Scholar] [CrossRef]
  4. Millennium Ecosystem Assessment: Ecosystems and Human Well-Being; World Resources Institute: Washington, DC, USA, 2005.
  5. Pearce, D.W.; Turner, R.K.; Turner, R.K. Economics of Natural Resources and the Environment; Johns Hopkins University Press: Baltimore, MD, USA, 1990. [Google Scholar]
  6. Kramer, R.A.; Sharma, N.P.; Munasinghe, M. Valuing Tropical Forests: Methodology and Case Study of Madagascar; World Bank: Bretton Woods, NH, USA, 1995. [Google Scholar]
  7. Kreuter, U.P.; Harris, H.G.; Matlock, M.D.; Lacey, R.E. Change in ecosystem service values in the San Antonio area, Texas. Ecol. Econ. 2001, 39, 333–346. [Google Scholar] [CrossRef]
  8. Xie, G.; Lu, C.; Leng, Y.; Zheng, D.; LI, S. Ecological assets valuation of the Tibetan Plateau. J. Nat. Resour. 2003, 18, 189–196. [Google Scholar] [CrossRef]
  9. Xie, G.; Zhen, L.; Lu, C.; Xiao, Y.; Chen, D. Expert knowledge based valuation method of ecosystem services in China. J. Nat. Resour. 2008, 23, 911–919. [Google Scholar] [CrossRef]
  10. Costanza, R.; de Groot, R.; Sutton, P.; van der Ploeg, S.; Anderson, S.J.; Kubiszewski, I.; Farber, S.; Turner, R.K. Changes in the global value of ecosystem services. Glob. Environ. Change 2014, 26, 152–158. [Google Scholar] [CrossRef]
  11. Song, X. Global Estimates of Ecosystem Service Value and Change: Taking Into Account Uncertainties in Satellite-based Land Cover Data. Ecol. Econ. 2018, 143, 227–235. [Google Scholar] [CrossRef]
  12. Sannigrahi, S.; Bhatt, S.; Rahmat, S.; Paul, S.K.; Sen, S. Estimating global ecosystem service values and its response to land surface dynamics during 1995–2015. J. Environ. Manag. 2018, 223, 115–131. [Google Scholar] [CrossRef]
  13. Li, G.; Fang, C.; Wang, S. Exploring spatiotemporal changes in ecosystem-service values and hotspots in China. Sci. Total Environ. 2016, 545, 609–620. [Google Scholar] [CrossRef]
  14. Song, W.; Deng, X. Land-use/land-cover change and ecosystem service provision in China. Sci. Total Environ. 2017, 576, 705–719. [Google Scholar] [CrossRef] [PubMed]
  15. Xie, G.; Zhang, C.; Zhen, L.; Zhang, L. Dynamic changes in the value of China’s ecosystem services. Ecosyst. Serv. 2017, 26, 146–154. [Google Scholar] [CrossRef]
  16. Xing, L.; Xue, M.; Wang, X. Spatial correction of ecosystem service value and the evaluation of eco-efficiency: A case for China’s provincial level. Ecol. Indic. 2018, 95, 841–850. [Google Scholar] [CrossRef]
  17. Yu, Y.; Yu, M.; Lin, L.; Chen, J.; Li, D.; Zhang, W.; Cao, K. National Green GDP Assessment and Prediction for China Based on a CA-Markov Land Use Simulation Model. Sustainability 2019, 11, 576. [Google Scholar] [CrossRef] [Green Version]
  18. Liu, Y.; Sun, H.; Shi, L.; Wang, H.; Xiu, Z.; Qiu, X.; Chang, H.; Xie, Y.; Wang, Y.; Wang, C. Spatial-Temporal Changes and Driving Factors of Land-Use Eco-Efficiency Incorporating Ecosystem Services in China. Sustainability 2021, 13, 728. [Google Scholar] [CrossRef]
  19. Xue, M.; Luo, Y. Dynamic variations in ecosystem service value and sustainability of urban system: A case study for Tianjin city, China. Cities 2015, 46, 85–93. [Google Scholar] [CrossRef]
  20. Hu, M.; Li, Z.; Wang, Y.; Jiao, M.; Li, M.; Xia, B. Spatio-temporal changes in ecosystem service value in response to land-use/cover changes in the Pearl River Delta. Resour. Conserv. Recycl. 2019, 149, 106–114. [Google Scholar] [CrossRef]
  21. Wang, Y.; Zhang, S.; Zhen, H.; Chang, X.; Shataer, R.; Li, Z. Spatiotemporal Evolution Characteristics in Ecosystem Service Values Based on Land Use/Cover Change in the Tarim River Basin, China. Sustainability 2020, 12, 7759. [Google Scholar] [CrossRef]
  22. Zhou, Y.; Zhang, X.; Yu, H.; Liu, Q.; Xu, L. Land Use-Driven Changes in Ecosystem Service Values and Simulation of Future Scenarios: A Case Study of the Qinghai–Tibet Plateau. Sustainability 2021, 13, 4079. [Google Scholar] [CrossRef]
  23. Xi, H.; Cui, W.; Cai, L.; Chen, M.; Xu, C. Evaluation and Prediction of Ecosystem Service Value in the Zhoushan Islands Based on LUCC. Sustainability 2021, 13, 2302. [Google Scholar] [CrossRef]
  24. Wang, B.; Yang, T. Assessing Impact of Land Use Change on the Ecosystem Service Value in Yinchuan City from 1980 to 2018. Sustainability 2021, 13, 8311. [Google Scholar] [CrossRef]
  25. Xu, Y.; Xiao, F. Assessing Changes in the Value of Forest Ecosystem Services in Response to Climate Change in China. Sustainability 2022, 14, 4773. [Google Scholar] [CrossRef]
  26. Meng, L.; Dong, J. LUCC and Ecosystem Service Value Assessment for Wetlands: A Case Study in Nansi Lake, China. Water 2019, 11, 1597. [Google Scholar] [CrossRef] [Green Version]
  27. Ouyang, Z.; Wang, X.; Miao, H. A primary study on Chinese terrestrial ecosystem services and their ecological-economic values. Acta Ecol. Sin. 1999, 19, 607–613. [Google Scholar] [CrossRef]
  28. Ouyang, Z.; Zhu, C.; Yang, G.; Xu, W.; Zheng, H.; Zhang, Y.; Xiao, Y. Gross ecosystem product: Concept, accounting framework and case study. Acta Ecol. Sin. 2013, 33, 6747–6761. [Google Scholar] [CrossRef]
  29. Ouyang, Z.; Song, C.; Zheng, H.; Polasky, S.; Xiao, Y.; Bateman, I.J.; Liu, J.; Ruckelshaus, M.; Shi, F.; Xiao, Y.; et al. Using gross ecosystem product (GEP) to value nature in decision making. Proc. Natl. Acad. Sci. USA 2020, 117, 14593–14601. [Google Scholar] [CrossRef]
  30. Area of Main Crops. Available online: https://data.stats.gov.cn/easyquery.htm?cn=C01 (accessed on 20 May 2022).
  31. Lin, W.; Xu, D.; Guo, P.; Wang, D.; Li, L.; Gao, J. Exploring variations of ecosystem service value in Hangzhou Bay Wetland, Eastern China. Ecosyst. Serv. 2019, 37, 100944. [Google Scholar] [CrossRef]
  32. Rasheed, S.; Venkatesh, P.; Singh, D.R.; Renjini, V.R.; Jha, G.K.; Sharma, D.K. Ecosystem valuation and eco-compensation for conservation of traditional paddy ecosystems and varieties in Kerala, India. Ecosyst. Serv. 2021, 49, 101272. [Google Scholar] [CrossRef]
  33. Masumoto, T. Multifunctional roles of paddy irrigation in monsoon Asia. In Proceedings of the 3rd World Water Forum(WWF), Agriculture, Food and Water, Kyoto, Japan, 22–23 March 2003; pp. 324–327. [Google Scholar]
  34. Xiao, Y.; Xie, G.; Lu, C.; Ding, X.; Lv, Y. The gas regulation function of rice paddy ecosystems and its value. J. Nat. Resour. 2004, 19, 617–623. [Google Scholar] [CrossRef]
  35. Chen, D.; Chen, J.; Luo, C. Discussion on paddy field ecosystem service and its economic value evaluation Method. Environ. Sci. Technol. 2005, 61–63, 112–113. [Google Scholar] [CrossRef]
  36. Li, X.; Chen, S.; Chen, Y.; Gao, W.; Ma, Y.; Ma, L. Evaluation of the multi-cropping ecosystem services under conservation tillage paddy field in Sichuan basin. Acta Ecol. Sin. 2006, 26, 3782–3788. [Google Scholar] [CrossRef]
  37. Zhou, X.; Li, F.; Xu, C.; Fang, F. Evaluation of ecosystem service value of paddy field constructed wetland in Zhejiang. J. Zhejiang Agric. Sci. 2009, 971–974. [Google Scholar] [CrossRef]
  38. Xiao, Y.; Xie, G. Comprehensive Valuation of the Ecosystem Services of Rice Paddies in Shanghai. Resour. Sci. 2009, 31, 38–47. [Google Scholar] [CrossRef]
  39. Yan, X. Methane emission from rice fields in mainland China: Amount and seasonal and spatial distribution. J. Geophys. Res. 2003, 108. [Google Scholar] [CrossRef]
  40. Natuhara, Y. Ecosystem services by paddy fields as substitutes of natural wetlands in Japan. Ecol. Eng. 2013, 56, 97–106. [Google Scholar] [CrossRef]
  41. Yoon, C.G. Wise use of paddy rice fields to partially compensate for the loss of natural wetlands. Paddy Water Environ. 2009, 7, 357–366. [Google Scholar] [CrossRef]
  42. Li, F.; Xu, C.; Zhou, X.; Fang, F. Study on ecological compensation mechanism of terraced rice based on ecosystem service value. China Rice 2011, 17, 11–15. [Google Scholar] [CrossRef]
  43. Zheng, C.; Guo, X.; Zu, Y.; He, Y.; Xu, Y. Evaluation on service value of paddy field ecosystem in Yuanyang terraces. Ecol. Sci. 2018, 37, 124–130. [Google Scholar] [CrossRef]
  44. Xue, B.; Zhang, L.; Zhang, T.; Sun, W.; Li, Z. Evaluation of paddy field eco-system’s service value: Taking example Hunan province for example. China Rural. Water Hydropower 2020, 52–57. [Google Scholar]
  45. Yang, T.; Sun, Y. Evaluation of the net value of paddy ecosystem services in China. J. China Agric. Univ. 2020, 25, 159–172. [Google Scholar] [CrossRef]
  46. Fu, Z.; Liu, Q.; Yang, T. Evaluation of the net value of paddy ecosystem services in Hunan province. J. Hunan Univ. Arts Sci. Sci. Technol. 2021, 33, 58–62. [Google Scholar] [CrossRef]
  47. Liu, Y.; Zhou, Q.; Yu, Q.; Wu, W. Analysis of spatial pattern and ecological service value changes of large-scale regional paddy fields based on remote sensing data. Smart Agric. 2020, 2, 43–57. [Google Scholar] [CrossRef]
  48. Announcement No. 290 of the Ministry of Agriculture and Rural Affairs of the People’s Republic of China. Available online: http://www.moa.gov.cn/govpublic/ncpzlaq/202005/t20200509_6343524.htm (accessed on 10 May 2022).
  49. Abatzoglou, J.T.; Dobrowski, S.Z.; Parks, S.A.; Hegewisch, K.C. TerraClimate, a high-resolution global dataset of monthly climate and climatic water balance from 1958–2015. Sci. Data 2018, 5, 170191. [Google Scholar] [CrossRef] [PubMed] [Green Version]
  50. Ouyang, Z.; Xiao, Y.; Zhu, C.; Zheng, H. Theory and Method of Gross Ecosystem Product (GEP) Accounting; Science Press: Beijing, China, 2021. [Google Scholar]
  51. Hu, X.; Wu, J.; Zhang, X. Study of the Methodology of Evaluating Paddy Ecosystem’s Multifunction. Environ. Prot. Sci. 2017, 43, 75–81. [Google Scholar] [CrossRef]
  52. Peng, D. The Study on the Method of Rice Yield Estimation Using Statistical and MODIS Data. Ph.D. Thesis, Zhejiang University, Hangzhou, China, 2009. [Google Scholar]
  53. Li, Q. Main crop straw resources and utilization ways in Tianjin. Sci. Technol. Tianjin Agric. For. 2018, 44–46. [Google Scholar] [CrossRef]
  54. Pachauri, R.K.; Allen, M.R.; Barros, V.R.; Broome, J.; Cramer, W.; Christ, R.; Church, J.A.; Clarke, L.; Dahe, Q.; Dasgupta, P.; et al. Climate Change 2014: Synthesis Report. Contribution of Working Groups I, II and III to the Fifth Assessment Report of the Intergovernmental Panel on Climate Change; IPCC: Geneva, Switzerland, 2014. [Google Scholar]
  55. Wen, Y.; Sun, Q.; Yan, Y.; Xiao, M.; Song, W.; Yang, J. Impacts of the terrestrial ecosystem changes on the carbon fixation and oxygen release services in the Guangdong-Hong Kong-Macao Greater Bay Area. Acta Ecol. Sin. 2020, 40, 8482–8493. [Google Scholar] [CrossRef]
  56. Liu, L.; Yin, C.; Qian, X. Calculation methods of paddy ecosystem service value and application: A case study of Suzhou City. Prog. Geogr. 2015, 34, 92–99. [Google Scholar] [CrossRef]
  57. Implementation Opinions on Promoting the Comprehensive Reform of Agricultural Water Price in Our City. Available online: http://www.tj.gov.cn/zwgk/szfgb/wjhySite/202005/t20200520_2462856.html (accessed on 10 May 2022).
  58. Yoshikawa, N.; Nagao, N.; Misawa, S. Evaluation of the flood mitigation effect of a Paddy Field Dam project. Agr. Water Manag. 2010, 97, 259–270. [Google Scholar] [CrossRef]
  59. Notice on the Adjustment of Emission Fee Collection Standards for Four Pollutants such as SO2 in Tianjin. Available online: http://sthj.tj.gov.cn/ZWGK4828/ZCWJ6738/sjwj/202010/t20201020_3963185.html (accessed on 10 May 2022).
  60. Ma, X.; Ren, Z.; Sun, G. The calculation and assessment to the values of air purification by vegetation in Xi’ an City. Chin. J. Eco-Agric. 2004, 12, 185–187. [Google Scholar]
  61. Lin, Y. Analysis on Environment and Educational Economic Benefit of Rice Field Ecological Management in Guandu Natural Park. Master’s Thesis, Taiwan University, Taipei, Taiwan, 2002. [Google Scholar]
  62. Nie, J. Study on Multifunctional Value of Rice Field Ecosystem in Hunan Province. Master’s Thesis, Hunan Agricultural University, Changsha, China, 2012. [Google Scholar]
  63. Xie, G.; Xiao, Y.; Zhen, L.; Chun, X. Study on ecosystem services value of food production in China. Chin. J. Eco-Agric. 2005, 13, 10–13. [Google Scholar]
  64. Pal, S.; Debanshi, S. Methane emissions only negligibly reduce the ecosystem service value of wetlands and rice paddies in the mature Ganges Delta. Environ. Sci. Pollut. R 2022, 29, 27894–27908. [Google Scholar] [CrossRef] [PubMed]
  65. Zhang, X. Characteristics of CH4 and N2O Emissions and the Reduction Strategy in Paddy Fields, Shanghai Region. Ph.D. Thesis, Shanghai Jiao Tong University, Shanghai, China, 2016. [Google Scholar]
  66. Xiang, P.; Huang, H.; Yan, H.; Zhou, Y.; Zheng, H. Environmental cost of rice production in Dongting Lake area of Hunan Province. Chin. J. Appl. Ecol. 2005, 16, 183–189. [Google Scholar]
  67. Ord, J.K.; Getis, A. Local spatial autocorrelation statistics: Distributional issues and an application. Geogr. Anal. 1995, 27, 286–306. [Google Scholar] [CrossRef]
  68. Mitchel, A. The ESRI Guide to GIS Analysis, Volume 2: Spartial Measurements and Statistics; ESRI Press: Redlands, CA, USA, 2005. [Google Scholar]
  69. National Development and The Reform Committee. National Compendium of Agricultural Product Cost-Benefit Data 2021; China Statistical Press: Beijing, China, 2021.
  70. Niu, L. Ecological Funcation Evaluation of Qingyuan Paddy Field. Master’s Thesis, Shenyang Agriculture University, Shenyang, China, 2018. [Google Scholar]
  71. Wang, K.; Huang, G.; Luo, Q.; Li, Z. Evaluation of ecological service value of rice field multi-cropping planting system in the hilly area of Jiangnan. Acta Agric. Jiangxi 2010, 22, 157–160. [Google Scholar] [CrossRef]
  72. Zhou, Z. Study on the Benefits of Ecological and Economic of Different Farmland Ecological System in Jinjing Town Changsha County. Master’s Thesis, Hunan Agricultural University, Changsha, China, 2014. [Google Scholar]
  73. Yang, Y. Paddy field ecosystem services valuation in the Jiang yan city. Master’s Thesis, Yangzhou University, Yangzhou, China, 2011. [Google Scholar]
  74. Kim, T.; Gim, U.; Kim, J.S.; Kim, D. The multi-functionality of paddy farming in Korea. Paddy Water Environ. 2006, 4, 169–179. [Google Scholar] [CrossRef]
  75. He, S.; Tian, J.; Zhang, Y. Millennium Ecosystem Assessment. Verification and comparison of three high-resolution surface evapotranspiration products in North China. Resour. Sci. 2020, 42, 2035–2046. [Google Scholar] [CrossRef]
  76. Tang, J.; Wang, J.; Li, Z.; Wang, S.; Qu, Y. Effects of Irrigation Regime and Nitrogen Fertilizer Management on CH4, N2O and CO2 Emissions from Saline–Alkaline Paddy Fields in Northeast China. Sustainability 2018, 10, 475. [Google Scholar] [CrossRef] [Green Version]
  77. Yang, S.; Xiao, Y.; Sun, X.; Ding, J.; Jiang, Z.; Xu, J. Biochar improved rice yield and mitigated CH4 and N2O emissions from paddy field under controlled irrigation in the Taihu Lake Region of China. Atmos. Environ. 2019, 200, 69–77. [Google Scholar] [CrossRef]
Figure 1. Map of the study area. Points of different shapes and colors in (b) are samples of remote sensing interpretation signs collected through field surveys.
Sustainability 14 09466 g001
Figure 2. Comparison of predicted rice yield with measured rice yield.
Sustainability 14 09466 g002
Figure 3. Map of net ESV per unit area: (a) pixel-by-pixel map of net ESV per unit area; (b) percentage of Net ESV of each level in Tianjin; (c) percentage of Net ESV per unit area in each district of Tianjin.
Sustainability 14 09466 g003
Figure 4. Hot spot analysis of net ESV. (a) Hot spot analysis mapping of net ESV per unit are; (b) percentage of z-score of each level in Tianjin; (c) percentage of z-score level in each district of Tianjin.
Sustainability 14 09466 g004
Figure 5. Temperature difference between urban and paddy in July and August.
Sustainability 14 09466 g005
Figure 6. Correlation between ESV and Influencing Factors. NESV is the net ESV of the PFE; Yield is the yield of rice; Tem7 and Tem8 are the average temperatures in July and August, respectively; Pre is the total rainfall during the rice growing season; ET is the total evapotranspiration in the rice growing season.
Sustainability 14 09466 g006
Table 1. The z-score classification of Getis-Ord Gi* statistics.
Type of SpotZ-ScoreConfidence (%)
Hot spot>2.5899
Hot spot2.58 ≥ z > 1.9695
Hot spot1.96 ≥ z > 1.6590
Not Significant spot1.65 ≥ z ≥ −1.65/
Cold spot−1.96 ≤ z < −1.6590
Cold spot−2.58 ≤ z < −1.9695
Cold spotz < −2.5899
Table 2. The ecosystem service value (ESV) of a paddy field ecosystem (PEF) in Tianjin in 2019.
Ecological Service TypesItemsESV
RMB 10 k
Value of Unit Area
RMB/ha
Percentage %
Provisioning servicesPrimary products supply2.875293.258.08
Regulating serviceCarbon fixation and oxygen release5.4310,014.8115.29
Climate regulation21.7740,124.5861.27
Groundwater recharge0.841545.782.36
Flood regulation2.464530.006.92
Material purificationair purification1.051944.002.97
water purification1.102027.253.10
Cultural serviceLandscape aesthetics0.00488.800.01
Positive ESV summary35.5365,488.47/
Negative regulation serviceGreenhouse gas emission4.959126.44 84.72
Water consumption0.33611.595.68
Agricultural chemical pollution0.561034.02 9.60
Negative ESV summary5.8410,772.04/
Net total ESV29.6854,716.42/
Ratio (%) is the ratio of each positive (negative) value to the sum of positive (negative) values.
Table 3. Quantity of ecological service products of PFE in Tianjin in 2019.
Ecological Service TypesItemsMeasurement IndicatorsUnitQuantity of Physical Product
Provisioning servicesPrimary products supplyrice104 t51.00
straw104 t67.82
Regulating serviceCarbon fixation and oxygen releasecarbon fixation104 t26.15
oxygen release104 t565.58
Groundwater recharge108 m32.72
Flood regulation108 m31.63
Material purificationPurified airSO2104 t0.24
nitrogen oxide104 t0.18
dust blocking104 t4.99
Water purificationBOD104 t0.09
COD104 t0.14
Negative regulation serviceGreenhouse gas emission104 t49.69
Water consumption108 m36.17
Table 4. Comparison table of ESV per unit area of PFE unit: RMB/ha.
Ecological Service TypesItemsThis Study[36]
A
[37]
B
[38]
C
[42][44]
F
[56]
G
[62]
H
[70]
I
[71]
J
[72]
K
[73]
L
DE
Provisioning servicesPrimary products supply5293893333,685977813,87712,11522,10011,913364315,50018,622 16,69717,590
Regulating serviceCarbon fixation and oxygen release10,015873419,152/11,14197262300329510,64316,50024,282 50713430
Climate regulation40,125/16,17411,40616,17515,294170032,9428131000//26,330
Groundwater recharge154645,931/189111,51812,00915,00019,2009000600///
Flood regulation4530//////347314631400//3000
Material purificationair purification1944/47,313941///2610///204500
water purification2027/12,530///8002027810/ /
Cultural serviceLandscape aesthetic9/////10 9////
Subtotal65,48863,598128,85424,01652,71149,144 41,91075,47026,38135,00042,904 21,97250,850
Negative regulation serviceGHG emission9126///23852385 18,30082447524600//10,140
Water consumption612///////4071300///
Agricultural chemical pollution1034//////1018691100/19611240
Subtotal10,772///2385238518,300926212,28610000 196111,380
Net total ecosystem service value54,71663,598128,85424,01650,32646,75923,61066,20714,09534,00042,904 20,01139,470
Note: the uppercase letters after the literature serial number represent the study area, and A-L represent Sichuan Basin, Zhejiang Province, Shanghai City, Kunyang Township of Zhejiang Province, Mingdai Township of Zhejiang Province, Hunan Province, Suzhou City, Hunan Province, Qingyuan County, Yujiang County, Changsha County and Jiangyan City, respectively.
Publisher’s Note: MDPI stays neutral with regard to jurisdictional claims in published maps and institutional affiliations.

