Abstract
Providing sustainable public housing solutions is one of the major challenges for countries with emerging economies. Based on the panel data of eight metropolitan cities in South Korea from 2017 to 2021, this study uses the entropy value method and coupling coordination model to evaluate the quantitative interaction between the life-cycle and the public housing systems, followed by the OLS regression model to explore their level of coupling coordination and its influencing factors. The findings reveal the following: (1) The support of public housing welfare by the life cycle had previously been effective in alleviating housing conflicts. (2) The main evaluation values of the indicators had their focus shifted from the quantitative supply to the growth of households, housing cost affordability, and housing size. (3) Overall, the average level of coupling and coordination among Korean cities has risen substantially, but the development of the public housing system still lags behind the change in the life cycle of each city’s composite index. As a result, policymakers should reasonably allocate policies by focusing on their long-term benefits. (4) The supply for emerging families, infrastructure allocation, and the affordability of housing are important factors for improving the level of coordination that should be considered.
1. Introduction
The public housing system in Republic of Korea (hereafter ‘Korea’) began in the late 1980s and was introduced to alleviate the negative effects of the rapid expansion of urbanization, such as the phenomenon of rapid population growth that occurred in the metropolitan area of Seoul over a short period and the rapid increase in apartment sales prices. Since 2015, the government has supported housing welfare policies such as housing rent subsidies, rental deposit financing support, home renovation, and home repair support to improve the quality of housing while increasing its supply [1]. However, with the rapid aging of Korean society and the proliferation of one- and two-person households, the needs of people for housing have changed accordingly. To further respond to the new needs of residents, in 2018, the Ministry of Land, Infrastructure, Transport, and Tourism (MLIT) released the Roadmap for Housing Welfare, a policy that, for the first time, pointed out that family characteristics and housing demand patterns differ due to different life cycles, so differentiated development in housing supply, housing finance policies, and housing welfare should be achieved [2]. Thus, Korea began to incorporate housing needs at each life-cycle stage into housing welfare and support specific targets in the dead-end zone of public housing supply from a policy perspective.
The family life cycle reflects a person’s progress through the change process spanning birth to death, including the formation, expansion, and then gradual disintegration of a family [3], according to which the residential preferences in the family life cycle can be predicted by analyzing residential movement. Specifically, the increase in the number of adults in the family, the presence or absence of young children, and increases in income increase the size of the family residence and result in movement into better residential environments, such as safer environments that offer better access to education; conversely, a decrease in dwelling size tends to result from a decrease in the number of family members and in retirement income due to children becoming independent, divorce, or the death of a spouse [4,5,6]. At the same time, the corresponding expenditures rise when families move and the family size changes [7,8,9], and in order to provide phased residential stability to groups with a reduced burden on household assets during movement [10,11], in general, depending on the family life cycle, a variety of changes in family size and membership characteristics, income levels, and residential costs need to be broadly considered based on the phases of the formation and expansion of a family. In general, it is necessary to adjust the size of housing and facilities required according to the stages of formation, expansion, and shrinking of a family [12] so that the supply of public housing can be in line with them, which is particularly important.
However, the subsequent implementation and development of these policies in Korea have been unsatisfactory. First, the life-cycle housing welfare policy gradually evolved into a commercial instrument, which is a deviation from the original purpose of its implementation, and, in 2021, the Seoul Housing and Communities Corporation began to apply this policy to commercial housing development [13]. Second, the image of public housing has been perceived as negative [14,15,16] and has come to be associated with low-income residential areas in Korea. According to statistics from 2019, 72.4% of public rental housing has an area of less than 60 m2, the willingness to move in is generally low, and such public housing areas are gradually becoming low-lying areas in the city. Finally, the uneven supply and demand for public housing and the continued low interest rate exert a variety of external effects on the residential market. According to statistics from the Ministry of Land, Infrastructure, and Transport, the national public rental housing stock (the number of public rental housing units currently in operation, including vacancy rates) was 1.737 million units as of 2020. The rate of public rental housing stock in Korea (based on the stock of 1,737,000 units) minus 10-year leases (resale after 10 years) and heirloom leases is only 5.8%, which is only 0.3% more than the rate of 5.5% seen in 2019 [17]. The insufficient supply of public housing and its low occupancy rate, combined with the sharp increase in the price of rental housing on the market, have led to the issue of rising housing costs for disadvantaged groups becoming the main focus of society once again [18,19,20].
In 2022, to further solve the contradiction between the supply of and demand for public housing, and to alleviate the housing pressure felt by low-income groups, the Korea Land and Housing Corporation announced the launch of a public housing integration project that aimed to break through the limitations of the existing public housing planning system and policy support, and to assess and analyze the vacancy rate through POEs (post-occupancy evaluations). The objective of the project was to identify the needs of residents by using POE assessments and analyzing vacancy rates, and to design a new rental housing planning system and the provisioning of corresponding public resources based on the needs of residents [21]. The first projects were based on the life-cycle stages, with a total supply of 21 types of household layouts that met the needs of each stage. This initiative that not only aimed to improve the quality of housing and the adequacy of supply for the demand, but also marked the formal conversion of the life-cycle system from the previous housing welfare policy into a part of the public housing system. In summary, it is worthwhile at this stage to analyze the coordination relationship between the life-cycle welfare policy and the public housing system from 2018 to the present.
Therefore, this study takes this discussion of the timeliness of policies into account and addresses the above issues by quantitatively analyzing the coupling coordination between the two systems of life-cycle population distribution and public housing for five years spanning from 2017 to 2021, using eight major cities in Korea as the target research area. An OLS regression model was selected to explore the factors affecting the coupling coordination and to analyze the existing problems and their potential pathways for improvement. Specifically, the objectives of this study are three-fold: (1) to explore the 12 indicators of the life-cycle structure and public housing system in eight major cities in Korea over the last five years and to analyze the evolution of the indicators used to characterize the life-cycle and public housing systems; (2) to explore the degree of coupling coordination between these two systems and to conduct a trend analysis, classification, and comparison based on a composite index; and (3) to analyze the factors affecting the degree of coupling coordination. Based on the results of the above analysis, we discuss the impact on the sustainability of the coupling and coordination between the life-cycle and public housing systems to provide a referential basis for formulating reasonable public housing supply policies and supporting policies that match life cycles, thus alleviating social housing conflicts and achieving the coordinated development of the population and public housing through the next stage of policy formulation. In addition, this study improves the concept of the Korean public housing system based on existing studies, provides a new perspective on theoretical research methods by analyzing the inter-system coordination as a research theme, and fills the theoretical gap in the study of the adaptive development of the life-cycle model at the public housing level by incorporating the life cycle into the coupled coordination model to construct an indicator system between it and the public housing system. For the development of the public housing system, this work provides a referential basis for the formulation of reasonable supply policies and supportive policies that are compatible with life cycles, the targeted alleviation of social housing conflicts, the coordinated development of the population and public housing, and the next stage of policy formulation.
2. Literature Review
Korea’s public housing policy was formed and developed through a combination of its national economic and social contradictions and other factors. First, an analysis of the existing literature on its systematic development shows that along with the change in the regime, the housing policy also presented distinct limitations in its timeliness and application. First, in the turbulent developmental period of public housing after the foreign exchange crisis of 1997, the housing market in Korea entered an unprecedented trough, and the shortage of housing units and the rising housing prices and rents led to a high incidence of social evils; however, the government took active housing measures. The government began to promote housing market stability by providing cheaper-than-market public rental housing during the turbulent decade from 2002 to 2012 [22]. However, then came the global financial crisis of 2008, which brought the Korean housing system as a whole into a period of stagnation. In 2013, the main social conflict shifted from the economy to demographic changes as the economy recovered [23]; the housing problems of groups such as young people and newly married couples came to the attention of society, and the supply of public housing began to be gradually restored and expanded to ensure housing stability for low-income groups.
As the total supply of public housing in Korea has increased, the vacancy rate has also increased. An analysis of the literature shows that this problem is mainly due to the general negative evaluation of public housing by residents. Some researchers have attributed this negative perception to class separation due to income differences [24,25]. Because the purpose of early public housing provision was to provide safe and quality housing for squatters during a severe housing shortage, negative terms, such as indifference, permissiveness, avoidance, and frustration, were often associated with public housing, thus furthering the vicious cycle of membership stigma. Some authors have also attributed psychological exclusion to physical spatial segregation, such as that due to using fences, high walls, and poor amenities in interior spaces during the planning of the initial public housing campus [26,27,28].
In order to optimize the image of public housing and improve the efficiency of the public housing supply, the government has tried various means of solving these problems in the subsequent supply. A review of the existing literature in chronological order shows that the first attempts were made in the form of housing, and a mixed social housing model was adopted. However, studies have shown that conflicts were frequent during the whole process from the initial recruitment of residents to the management of occupancy and transfer, and the conflicts were gradually intensified due to the structural problems that were internally accumulated and eventually caused by the public nature. Thus, it could be seen that the model of mixed social housing could partially alleviate the conflicts among residents, but it did not seem to completely solve the problem of class exclusion in the long run. Secondly, from the perspective of the population using the supply, the subdivision of public rental housing policy targets had a positive aspect due to the subdivision of this population starting in 2014; these subdivisions accounted for basic livelihood security recipients, disabled people, and elderly people, as well as young people, entrepreneurs, college students, newly married couples, and families with many children. Thus, policy support was provided for specific groups in need of housing stability and the realization of customized housing benefits was promoted and moved forward. Finally, at the level of policy support, the life-cycle housing welfare support policy was proposed in 2018, and the Korean housing policy, which was previously formed with the supply of public rental housing as its center, was expanded to a number of fields, such as housing annuities or housing subsidies, as the scope of the welfare policy expanded, and its center was converted into the housing welfare policy [29]. During its subsequent development, the policy evolved from the level of supporting the stability of housing for low-income groups to a more general and multidimensional housing welfare policy—in particular, it was considered that the demand for housing welfare differed depending on the life cycle. The need for an in-depth study of the coordination between this life-cycle welfare policy and the public housing system is also increasing.
Secondly, the coordination relationship between the life cycle and the public housing system in Korea has not been explicitly mentioned in the existing available literature; most studies have used the housing welfare policy proposed in 2018 as the basis for life-cycle-related analyses. Only one study from the public housing perspective mentioned in its conclusion that the life cycle should be included in the public housing system [30]; the life-cycle system has not been directly studied from the perspective of public housing. Thirdly, in terms of research directions, most of the studies focused on household consumption and housing finance [31,32,33,34,35,36], residential demand [30,37], and especially occupancy satisfaction [38,39]. Finally, from the perspective of existing research findings, supply and demand were mixed together [40,41,42,43]; the direction of policy recommendations does not touch the root of the problem, and there is still much room for research.
International studies on the relationship between the two have focused on household housing consumption and housing stability, and they have not explicitly addressed the issue of coordination. First of all, in 2004, a French researcher studied the relationship between housing cost burden and life-cycle changes and found that life-cycle costs are not directly related to the cost burden for renters, but the focus was on household demographics [44]. However, some researchers pointed out that providing public housing according to the life cycle prolongs the time that households are supported by policies [45] and that policies can delay the normal development of a household’s life cycle. Second, in terms of housing stability, in 1974, the authors of [46] pointed out that a household’s life cycle is an important variable with an influence on satisfaction with public housing occupancy. Subsequent researchers have also taken [47,48] housing stability as a starting point, again verifying that changes in living space and a household’s life cycle are the main causes of stability, and they pointed out that behavioral patterns in residential mobility must include consideration of housing needs at different life-cycle stages [49]. In recent years, affected by the COVID-19 epidemic, the international research direction in the field of public housing has shifted from family consumption patterns to policy research on residential health and public housing systems and the provision low-income groups with a good, open external environment and more diverse options [50]. Supportive policies have also become a new research trend [51,52].
3. Research Design
3.1. Research Subjects
In this study, considering the regional representativeness and national influence of the selected cities, as well as data accessibility and operability, eight cities in the first level of administrative districts according to the administrative divisions of the National Statistical Office of Korea were finally selected (Figure 1). Their economic strength, city size, and regional radiation are deemed representative, and the eight cities are divided according to east, central, west, and northeast based on their geographical locations and economic development levels (Table 1).

Figure 1.
Distribution of eight metropolitan cities in Korea.

Table 1.
Division of cities.
For the purpose of empirical analysis, the family life cycle is divided into four stages based on family activities as follows: family entry (emerging family), family formation, family with school-age children, and family contraction. By coupling the coordination model with the entropy value method, we examine the state of the life cycle and public housing system in Korea across different administrative regions from 2016 to 2021. Specifically, by constructing the evaluation index system of the life cycle and public housing system in Korea, we have quantified and analyzed the coupling and coordination relationship between the life cycle and the public housing system in Korea from 2016 to 2021. Then, based on this, we analyzed the trend of coupling and coordination indices in the different regions of Korea and compared them by category to manage the integration of the life cycle and public housing system in Korea, to accelerate the life cycle housing supply, and to ensure the provisioning of all-stage housing security for households.
3.2. Data Sources
The data used for this study were obtained from the housing reality survey published periodically by the Ministry of Land, Infrastructure, Transport, and Tourism. Since 2006, the Ministry of Land, Infrastructure, Transport and Tourism (MLIT) has been conducting a housing survey every two years in Korea. In this paper, the survey data were used to analyze home ownership in each of the life-cycle age groups; the existing public housing situation was selected for secondary collation, and missing data were provided through interpolation.
3.3. System Construction
Based on the principles of index system construction, this paper combines the existing research and selects a total of 12 indicators for two subsystems using the principles of objectivity, systematicity, and applicability of data, as shown in Table 2.
Table 2.
System coupling coordination evaluation index system and weighting coefficients.
The population subsystem is evaluated according to the 4 stages of the life-cycle demographic structure, which is both a key element in its interaction with the housing rental market and a reflection of the current state of urban demographic development. The equilibrium of the public housing system is influenced by both supply and demand; thus, this study generalizes the public housing system based on supply and demand with reference to the 2017–2021 Residential Reality Survey and related literature. Four indicators are selected to reflect the supply side of the market: occupancy rate, housing supply scale, local support situation, and affordability of living costs. Among them, the occupancy rate is an important indicator of housing rental market activity, as it reflects the supply situation of the housing rental market, and the rent-to-income ratio is used to measure the relationship between the cost of rent and household income, indirectly reflecting the impact of rent on the living standard of tenants.
The population drives the development of the housing rental market; the housing rent-to-sale ratio refers to the ratio of rent per square meter of usable area of housing to housing price, which can be used to evaluate the degree of deviation between property price and property value, and this indicator influences resident’s choice of purchasing or renting.
hij = (Xij − minXij)/(maxXij − minXij)
hij = (maxXij − Xij)/(maxXij − minXij)
In this model, Xij is the original index data, i.e., the j (j = 1, 2, 3,..., m) index in the i (i = 1, 2, 3,..., m) region. xij denotes the jth evaluation index value of city i; xjmin and xjmax denote the minimum and maximum values of index j, respectively. hij denotes that the standardized data of each index are in the range of [0, 1].
Second, on this basis, the weight Uij of the jth index of region i is calculated through Model (3).
In this model, hij is the standardized value of indicator j of object i. According to the weight of indicator j in region i, its information entropy ej and information redundancy gj (coefficient of variability) can be found using Models (4) and (5).
where d is the number of years to be evaluated. To ensure that the value of information entropy is within [0, 1], the value of lnd needs to be greater than zero. The greater the information redundancy g, the higher the importance of the indicator in the evaluation system, and vice versa. According to Equations (1)–(5), the weight wj of each index and the comprehensive index hi of each region can be calculated according to Models (6) and (7).
The weights of the indicators are shown in Table 1.
3.4. Calculation of the Coupling Degree
Coupling refers to a closely coordinated and mutually influential interaction between two or more systems. To further study the development status and coupling and coordination development types among the changing life-cycle population groups and the public housing system in Korea, this paper mainly adopts the coupling model for analysis. Specifically, the coupling degree expressed by Model (8) is used to determine the degree of interaction between the two, and the coupling coordination degree is used to analyze the coupling coordination status of the two across different regions.
In this model, C is the coupling degree between the life cycle and the housing rental market, and the value range is [0, 1]. Li and Ri are the comprehensive evaluation values of the urban life cycle and housing rental market, i ∈ 1, 2,..., 35, respectively, which are calculated by linear comprehensive evaluation through Formula (9).
In this model, fij(x) is the combined evaluation value of the i subsystem (life cycle and public housing system) in year j; Wl is the weight of the i indicator in each subsystem; and Wlj is the utility value of the i indicator of each subsystem in the jth year.
3.5. Calculation of Coupling Coordination Degree
The coupling degree model can be used to understand the degree of interaction between the life cycle and the public housing system, but it cannot reflect whether the subsystems constrain each other at a low level or promote each other at a high level. Therefore, based on the coordination degree expressed in Formula (10), it is also necessary to introduce the coupling coordination degree function in Equation (11), which can reflect both the degree of coordination between systems and the stage of coordination development.
where Z is the coupling coordination index; T is the coordination degree; L and R are the evaluation values of the life cycle system and public housing system, respectively; and α and β are the pending coefficients of the life cycle system and public housing system, respectively, which are the weights of each subsystem in the integrated development. Most of the subsystem weights are assigned the same weight in existing studies based on the condition that the sum of the weights is 1. In this paper, we believe that the division of the life cycle is as important as the sustainable development of the public housing market, but it is more difficult to simultaneously coordinate the advancement of the life cycle and the development of the public housing systems; so, to ensure the objectivity of the results, both the coefficients of α and β are taken to be 0.5.
According to the model, the range of coupling coordination values mainly falls between 0 and 1. When the value is closer to 1, it indicates that the coupling coordination degree of the two subsystems in the region is better. Based on this, the coupling coordination degree is divided into ten levels, as shown in Table 3.
Table 3.
Evaluation criteria for coupling coordination.
4. Analysis of Results
4.1. Evaluation Index of the Subsystem
This section focuses on the evaluation of the coupling and coordination status of the life-cycle and public housing systems in Korea from 2017 to 2021, which includes the evaluation of the comprehensive index of the life-cycle and public housing systems as well as the analysis of the coupling degree, coordination degree, and change characteristics of the coupling and coordination degrees of the two subsystems.
First, based on the entropy value method, the weights of 12 indicators in 8 major cities from 2017 to 2021 were calculated, and the evolution of the weights of the index system, as shown in Figure 2, is discussed. From 2017 to 2021, the dominant indicators are highlighted as X2 and X5, which shifted from X11 to X12 after 2019 and continues to date, while the X8 indicators had a greater degree of change and showed a decreasing trend in 2021. Therefore, balancing the demographic structure and the public housing supply by shifting the focus from the quantitative supply to the number of households in the formative years, housing cost affordability, and the housing area, is a key point in the balanced development of indicators.
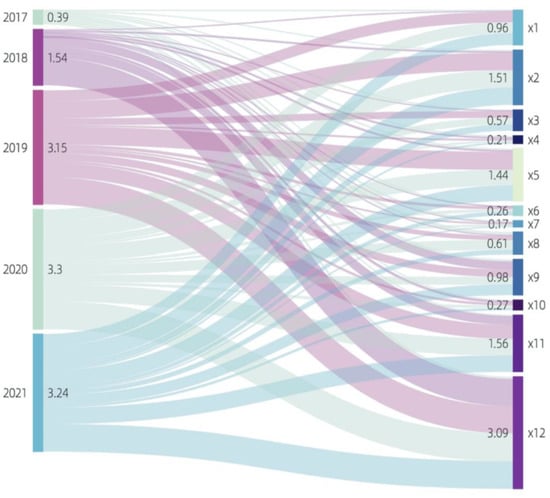
Figure 2.
Evolution of the indicators used to describe the life cycle and public housing system (2017–2021).
Meanwhile, based on the weights determined by the entropy value method, the comprehensive index of the eight cities’ demographic structures and public housing systems were obtained, and the calculation results are shown in Figure 3. In terms of the subsystems within cities, the overall changes in the demographic subsystem and public housing system in most cities are stable, and the public housing supply is relatively weaker than the life-cycle development, so there is further need for development. The change that occurred between 2017 and 2018 shows that the Korean government’s residential welfare support policy has a significant positive effect from a life-cycle perspective. The policy measures introduced by the national and local governments have significantly contributed to the resolution of housing conflicts in Korean cities. The life-cycle system has seen a shift from 2018 to 2019, except for Gwangju City, which is improving, and the state of stability is further reflected by the limitations of the existing policies (Table 4). In terms of the public housing subsystem, all areas except Busan lag behind the life-cycle system development, mainly because of a mismatch between the supply and demand structures and insufficient supply in the housing rental market of these cities. In the past few years, Korea’s cities have focused on increasing the total supply of public housing, but this supply has been underestimated in all cities in terms of life-cycle development, and the supply of public housing should be guided by life-cycle adequacy as the key to coordinated development.
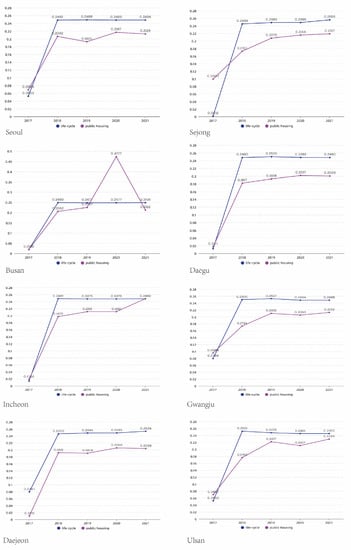
Figure 3.
Comprehensive evaluation of eight cities (2017–2021).
Table 4.
Coupling values compared with coordination values (2017 and 2021).
4.2. Coupling Coordination Degree Analysis
Based on the composite index for Korea from 2017 to 2021, the coupling model was applied to calculate the degree of coupling, coordination, and coupling coordination between the two system pairs, and the results are shown in Table 5. First, the coordination degree model is applied to measure the adequacy of coordination between demographics and housing supply. Most of the cities are at the basic degree of primary coordination after 2017, and the system coupling coordination still requires improvement but shows an overall growth trend. Among Korean cities, only Busan City had attained the level of premium coordination by 2020, but this level falls sharply after that. This suggests that the level of adequate coordination between demographics and public housing supply is low in most cities and that while some incentive housing policies are showing short-term effects, long-term sustainability is still needed.
Table 5.
Comparison of coupling coordination degree and coupling coordination level (2017 and 2021).
The coupling degree between the life cycle and public housing system in Korea is between [0.90, 0.98] in the last five years, which is in a high coupling state, indicating that the life cycle and public housing system in Korea are in a relatively close state. However, most cities show a decreasing trend in coupling degree of [0.91, 0.94] in 2021. On the one hand, the effective configuration of the life cycle has led to the optimization of the public housing system, and on the other hand, the current public housing system in Korea is less adaptive and cannot cope well with the impact of life-cycle development; thus, further improvements are needed.
A comparison of the degree of coupling between the two systems shows that the Korean life cycle is highly correlated with the public housing system, which creates a synergy that plays a mutually reinforcing role in the high-quality development of the public housing system. After five years of policy adjustment and development, the level of coordination in most cities rose from an original [0.01, 0.05] low coordination stage to the [0.68, 0.72] level of basic coordination. Therefore, strengthening the coordination of the life cycle and public housing systems is the key to achieving the high-quality development and sustainability of public housing in Korea.
Finally, the coupling coordination degree model was used to calculate the degree of balance and adequate aggregation between population growth and housing supply. The coupling coordination degree of the eight cities is shown in Figure 4, and the differences between these cities are not obvious; all of them are at the basic coupling stage. From the data, Korea’s coupling coordination degree can be seen to develop relatively smoothly after 2017, and in terms of the proportion of coupling coordination development, those provinces that had good dislocation between 2018 and 2021 show a steadily rising degree of coordination. Among them, the coupling coordination of Busan City soared in 2020, reaching [0.99] at one point.
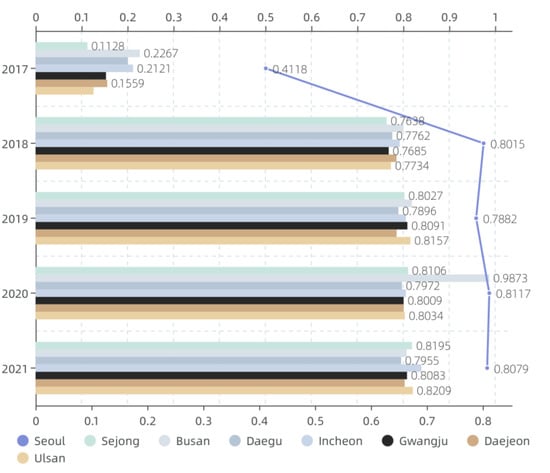
Figure 4.
The trend of coupling coordination degree and coupling coordination level (2017–2021).
In summary, the degree of balance and adequacy between demographics and the public housing supply among Korean cities during the study period was generally at a moderate to high level. The number of cities with moderate and severe dysfunction decreased, and the relationship between the interaction and coordinated development of the two subsystems improved. According to the inertia trend and the prediction made from the evolutionary status, the coupled and coordinated development level of the two subsystems will continue to see a reduction in dysfunction in both the short term and the long term.
From the spatial analysis of the coupling coordination degree (Figure 5), we can see that since 2018, the overall trend of change has been slow, the spatial distribution is surrounded, the central section is slower and the imbalance is more serious, the peripheral cities have achieved better-coordinated development, and the coordination level between the population cycle and housing rental market in most cities has increased slightly. The 2017 spatial distribution, except for the northern cities, was in a very uncoupled stage, during which time Seoul city had the highest level of coupling coordination. Among cities, the coupling coordination level of Seoul city in the northern region increased faster but remained basically close to the overall national average, indicating that the coupling coordination relationship between the two was strengthened by the government’s policy inclination and the emphasis placed on the harmonious and orderly development of the agricultural economy and ecological environment. In 2018, as the country began to pay attention to the systematic and life-cycle conformity of the public housing supply, the overall national coordination level soared into the primary dislocation phase. In a subsequent development, the overall level of coordination between the population and public housing market became better in eastern cities than in central, southwestern, and northern cities, particularly the coupling coordination value of >0.9 that occurred in 2020, and it has remained at a high level of coordination throughout recent years. The overall development is slower for the central cities, especially in Daegu, which has been at the primary coordination stage since 2018, and the coupling coordination relationship between the two needs to be improved in this city.

Figure 5.
Spatial distribution of the coupling coordination degree for eight cities in Korea (2017–2021).
5. Analysis of Influencing Factors
5.1. Model and Influence Factor Selection
Under the premise of ensuring data availability, 12 factors were selected, and these factors were classified into 3 categories: life cycle, public housing development, and resident demand. The integrated coupling coordination value varies between 0 and 1. To avoid bias in the data results, each dataset was first subjected to natural logarithm processing, and after processing, it was brought into the OLS regression in Formula (12) for analysis.
5.2. Analysis Results
Through OLS regression analysis and the use of the robust standard error regression method, it can be seen from the above Table 6 that the model R-squared value is 0.996, which means that the independent variables selected in this paper can explain 99.64% of the reason for the change in coupling coordination. The model passed the F test (F = 335.232, p = 0.000 < 0.05); thus, the model holds.
Table 6.
Results of OLS regression analysis.
The final specific analysis shows that with the change in population structure, only Ln_X1 is positively correlated in the population life cycle system with a regression coefficient value of 0.181 and shows a 0.05 level of significance (t = 2.016, p = 0.044 < 0.05). This implies that Ln_X1 has a significant positive relationship on Ln_Coupling_D_coupling coordination, so the policy support and housing supply of public housing in the formative life stage should be emphasized in the next development. Only Ln_X7 data results in the public housing development system having a negative relationship with the coupling coordination value, where the regression coefficient value of Ln_X7 is 0.008 but nonsignificant (t = 0.608, p = 0.544 > 0.05). This implies that the government should focus on the construction and distribution of living facilities around public housing, while increasing the supply and that housing affordability is also one of the key considerations, so the rationality and effectiveness of the existing housing financial support policies can be further examined. The regression coefficient value of Ln_X9 is 0.043 and shows a 0.01 level of significance (t = 3.749, p = 0.000 < 0.01), and the regression coefficient value of Ln_X11 is 0.053 and shows a 0.01 level of significance (t = 3.214, p = 0.001 < 0.01). This indicates that the relationship between residents’ housing demand and the coupling coordination value is positive and significant; therefore, improving residential satisfaction and securing residential stability positively impact coupling coordination.
6. Future Policy Directions and Conclusions
In 2018, South Korea first proposed the incorporation of life-cycle demand into public housing welfare support policies, and this lasted until 2022, when the life cycle was formally applied to the public housing supply. This study differs from previous studies because it combined the coupling degree and coupling coordination models to quantitatively evaluate the coupling coordination between the life-cycle population distribution and the public housing system based on panel data from 2017 to 2021 for eight wide-area cities in South Korea. Overall, the policy was effective in improving the coordination index of the housing system after its implementation in 2018 and had a significant effect on initially alleviating the demographic and housing conflicts at all stages. However, with the demographic changes in Korea, the ratio of the aging population to one-person households continues to be high, and the system development entered a stagnant period during 2019–2021. Some cities adopted housing incentives to solve the problem but without touching the root of the problem, thus only bringing short term effects. The specific findings of the study are as follows:
- (1)
- In terms of temporal changes, during the study period from 2017 to 2021, when using the life cycle as a type of housing welfare policy, the combined level of the life-cycle subsystem and the public housing subsystem increased, and each index showed a trend of first decreasing and then increasing, which was significantly effective in initially easing the population and housing conflicts at each stage. However, after 2018, due to demographic changes, the gap between the two subsystems gradually widened, and the housing subsystems in the vast majority of the cities were unable to cope with the fluctuations in the life cycle; in addition, the development of the public housing system still lagged behind the changes in the life cycle according to the comprehensive index of each city, and this trend continued until 2021.
- (2)
- In terms of the evolution of the indicators, the main values of the indicators evolved from a focus on quantitative supply to long-term households, housing cost affordability, and housing size. The focus on the affordability of households in the formative years and on the public housing supply area were the key points for achieving coordination between the two systems at this stage, and improving the degree of matching in the housing supply system became the key to breaking imbalances in the indicators. The trend of indicator evolution in a previous article was also verified through a final regression analysis of that article, and the results showed that costs of households in the formative years, the surrounding facilities, and increases in the proportion of supply were the keys for improving the coupling of the system. The results showed that the cost of households in the formative period, the ratio of surrounding facilities, and increases in the supply were the keys for improving the level of system coupling.
- (3)
- In terms of the spatial distribution, there were no cities that were in an unbalanced state at the time of the study. The average coupling coordination level of all of the Korean wide-area cities significantly improved. However, it should be noted that the coupling degree was high, but the overall coordination was low, and some cities even showed extremely rapid changes in values, such as Busan City in 2020 and Incheon City in 2021. In order to improve the degree of coordination, we should also pay attention to the degree of stability, arrange the supply quantity and direction of public housing in a reasonable way, and adjust imbalances from the internal structure of the policy system by combining the local housing supply and demand.
Policy development direction: (1) The supply of public housing should be increased and the living area of housing should be expanded. It was found that the demand for housing and the stabilizing effect of public rental housing vary according to the life cycles of households, so the next phase should focus on the area of public housing for households that are in a formative stage to further balance the supply and demand structure for public housing. (2) Cities should formulate policies based on specific life cycles and the comprehensive numerical and dynamic development of the public housing system, and they should consider the long-term benefits of their policies. The data at this stage show that although these cities are in the stage of quality coordination, the situation of the subsystems varies, and further optimization is needed. (3) At the same time, coupling is a dynamic evolutionary process, and the optimal coupling degree is not a static value, but rather an interval (or an optimal-fit interval) relative to different developmental stages and external conditions. In the current stage, we should perform city-specific repairs to address internal system problems and adjust the fit interval to achieve coordinated development.
Finally, the limitations of this study and future research plans will be discussed. Firstly, in this study, when studying the dynamic evolution of the coupled and coordinated development of life cycles and public housing at the city level, the period selected was limited to 2017–2021 due to limitations in data integrity, and it was not possible to fully demonstrate the long-term dynamic changes in the development of the public housing system; secondly, this study only selected the life-cycle population distribution and public housing system for analysis and summary, and economic factors were not considered. For this reason, the scope of this study will be broadened in the next study to analyze the coordination and influence of these three factors in order to increase the credibility of the conclusions and recommendations. In addition, when reviewing Korea’s public housing policy, we found that the customized public housing proposed by the government of Seoul in 2014 has achieved phased results in improving supply efficiency and improving the negative image of public housing, which has a certain research value. The developmental model and characteristics of this topic will be discussed separately as a case study in the next publication.
Author Contributions
All the authors contributed extensively to the work presented in this paper. Conceptualization, Z.D.; methodology, Z.D.; investigation and resources, Z.D.; data curation, Z.D.; supervision, S.K. All authors have read and agreed to the published version of the manuscript.
Funding
This research received no external funding.
Institutional Review Board Statement
Not applicable.
Informed Consent Statement
Informed consent was obtained from all subjects involved in the study.
Data Availability Statement
Raw data were obtained from the Housing Statistics Yearbook. The data was available at https://stat.molit.go.kr/portal/cate/statFileView.do?hRsId=327&hFormId= (accessed on 25 April 2023).
Conflicts of Interest
The authors declare no conflict of interest.
References
- Chung, S.H.; Kim, S.-J.; Park, S.-Y.; Kim, J.H. Past, Present, and Future of Social Housing in Seoul: Where is Social Housing Heading to? Sustainability 2020, 12, 8165. [Google Scholar] [CrossRef]
- Comprehensive Housing Plan. Available online: https://opengov.seoul.go.kr/public/84597 (accessed on 24 April 2023).
- Boddy, M.; Gray, F. Filtering Theory, Housing Policy and the Legitimation of Inequality. Policy Politics 1979, 7, 39–54. [Google Scholar] [CrossRef]
- Marekwica, M.; Schaefer, A.; Sebastian, S. Life cycle asset allocation in the presence of housing and tax-deferred investing. J. Econ. Dyn. Control. 2013, 37, 1110–1125. [Google Scholar] [CrossRef]
- Speare, A., Jr. Homeownership, life cycle stage, and residential mobility. Demography 1970, 7, 449–458. [Google Scholar] [CrossRef]
- Mariger, R.P. A Life-Cycle Consumption Model with Liquidity Constraints: Theory and Empirical Results. Econometrica 1987, 55, 533–557. [Google Scholar] [CrossRef]
- Miao, Y.U.; Yuning, G. The puzzle of counter life-cycle of Chinese household saving rate: An analysis based on the perspective of competitive saving. China Popul. Resour. Environ. 2021, 31, 33–42. [Google Scholar]
- Myers, D.; Pitkin, J.; Park, J. Estimation of Housing Needs amid Population Growth and Change. Hous. Policy Debate 2010, 13, 567–596. [Google Scholar] [CrossRef]
- Mulder, C.H. Population and Housing: A Two-Sided Relationship. Demogr. Res. 2006, 15, 401–412. [Google Scholar] [CrossRef]
- Lindh, T.; Malmberg, B. Demographic Perspectives in Economic Housing Research. In International Encyclopedia of Housing and Home January; Springer: Berlin/Heidelberg, Germany, 2012; pp. 319–324. [Google Scholar]
- Tomoko, K. Housing challenges in shrinking and aging Japanese cities. Abstr. ICA 2019, 1, 1–2. [Google Scholar]
- Chung, J.C.; Cho, S.J. A study on long-term housing demand projections due to demographic change. Land Plan. 2005, 40, 37–46. [Google Scholar]
- SH Corporation Announces Housing Brands by Life Cycle. Available online: https://webzine.i-sh.co.kr/41/?q=YToyOntzOjEyOiJrZXl3b3JkX3R5cGUiO3M6MzoiYWxsIjtzOjQ6InBhZ2UiO2k6Njt9&bmode=view&idx=6778785&t=board (accessed on 24 April 2023).
- Lee, D.E.; Seo, W.S. Comparative Study on Perception of Public Housing by Family Life Cycle in Seoul. SH Urban Res. Insight 2017, 7, 37–53. [Google Scholar]
- Public Rental Ratio’ Tops in OECD. Available online: https://www.nocutnews.co.kr/news/5896023 (accessed on 24 April 2023).
- Park, K.; Seo, W. Effects of Residential Instability of Renters on Their Perceived Health Status: Findings from the Korean Welfare Panel Study. Int. J. Environ. Res. Public Health 2020, 17, 7125. [Google Scholar] [CrossRef] [PubMed]
- Lee, B.; Park, Y.; Seo, K.H. A Study on Shared Housing as an Alternative Housing Option to Young Adults: From the Perspectives of Providers and Users. Korea Territ. Urban Plan. Assoc. 2021, 56, 235–251. [Google Scholar]
- Jung, H.-J.; Nam, S.-J. Focusing on the Current Status and Tasks of Social Housing Policy. Korean Assoc. Public Adm. 2018, 997. Available online: https://kiss-kstudy-com-ssl.oca.korea.ac.kr/ExternalLink/Ar?key=3799778 (accessed on 24 April 2023).
- Min, A.H.; Choi, S.K. Design Characteristics of Public Housing in France for the Sustainable Development- Focused on Social Housing in Paris. KIEAE J. 2020, 20, 67–77. [Google Scholar]
- Haeun, J.; Euijune, K. A Study on The Housing Consumption Problem in Young Single-Person Household-Focusing on Reduction of Housing Area. J. Korean Reg. Sci. Assoc. 2018, 34, 49–59. [Google Scholar]
- Kim, K.; Park, J. A Study on Reduction of the Stigma Against Residents in Public Rental Housing Focusing on Social-Mix of Residents. Korea Spat. Plan. Rev. 2023, 116, 3–23. [Google Scholar]
- Lee, H.S.; An, S.M.; Lee, Y.S. Trend of Common Space in Multi-unit Dwelling Through Domestic Research Focused on the Research Published in Domestic Journals. J. Korean Inst. Inter. Des. 2018, 27, 126–135. [Google Scholar]
- Jin, J.I.; Lee, S.G.; Kim, J.S.; Kim, J.W. The Effects of Spatial Environments of Public Rental Housing on Residents’ Satisfaction-Based on Multi-level Model. J. Real Estate Anal. 2018, 4, 15–31. [Google Scholar]
- Jin, Y.H. Residential satisfaction and contributing factors of housing benefit recipients and public housing residents: A comparative study between 2016 and 2020 Housing Survey Data. J. Korean Urban Manag. Assoc. 2023, 36, 109–126. [Google Scholar]
- Kim, S.Y. Analysis of the Housing Benefits for the Housing Rights Realization: Focused on the Housing Rent Support. J. Korean Urban Manag. Assoc. 2020, 33, 101–124. [Google Scholar]
- Lee, H.S.; Yeo, G.S. Research on welfare housing for the underprivileged groups living in inadequate housing. Public Law J. 2011, 12, 363–388. [Google Scholar]
- Lee, H.R. A Study on the Housing Welfare Law for Socio-economically Weak People. Real Estate Law Rev. 2019, 23, 107–141. [Google Scholar]
- Jin, Y.K. A first step toward establishing life-cycle customized housing welfare. Plan. Policy 2018, 118–119. Available online: https://www.dbpia.co.kr/journal/articleDetail?nodeId=NODE07295860 (accessed on 24 April 2023).
- New Integrated Public Rental Housing Plan for Residential Space Innovation. Available online: https://blog.naver.com/bloglh/222753638635 (accessed on 24 April 2023).
- Seung, G.S.; Inyeob, J. Life-Cycle Home Ownership and Residential Patterns: An Empirical Analysis of Home Ownership Across Generations. LHI J. Land Hous. Urban Aff. 2021, 12, 31–40. [Google Scholar]
- Jung, J.I.; Young, L.; Youn, J. Factors Related to Residential Independence in the Public Rental Housing: Focused on the Income and Expenses in Households. Consum. Policy Educ. Rev. 2022, 18, 51–71. [Google Scholar]
- Mincheol, K. Housing support plan reflecting housing consumption characteristics by life cycle. KRIHS Policy Brief 2017, 603, 1–8. [Google Scholar]
- Lee, H.; Lee, J.A.; Kim, S.H. A Study on the Housing Consumption Change in Life Cycle. Korea Hous. Environ. J. 2015, 13, 139–150. [Google Scholar]
- Song, J.H.; Kim, Y.I. Housing Market and Life-Cycle Pattern of Household Consumption and Savings. J. Korean Econ. Anal. 2013, 19, 230. [Google Scholar]
- Jinhee, K. A Study on the Relation between the Aging Population and Consumption in Korean Households, August 2020; Korea Maritime University Graduate School: Busan, Republic of Korea, 2020. [Google Scholar]
- Lee, H.B. An Analysis on the Selection Factors for the Main Bank of Housing Mortgage Loan - Focused on Life Cycle. Korea Real Estate Acad. Rev. 2015, 62, 176. [Google Scholar]
- Park, D.C.; Choi, J.M. The Mismatch between the Supply and Demand for Residential Space by Public Rental Housing Life Cycle Stage. Urban Stud. 2019, 15, 283–316. [Google Scholar]
- Han, S.J.; Jun, H.J. Differential residential satisfaction and factors affecting residential satisfaction by household’s life cycle and housing tenure. Korean Adm. Soc. 2021, 55, 409–446. [Google Scholar]
- Min, J.O.; Chang, H.J. A Study on the Policy Effect Analysis of Public Rental Housing: Focusing on Rent Reduction and Improvement in Housing Satisfaction. Hous. Res. 2019, 27, 5–33. [Google Scholar]
- Lee, G.J.; Kim, G.Y.; Park, C.G. Direction of public housing supply policy considering demand by region and class. Natl. Territ. Policy Brief 2020, 1–8. Available online: https://www.dbpia.co.kr/Journal/articleDetail?nodeId=NODE09412523 (accessed on 24 April 2023).
- Kang, B.G.; Seo, J.H. A study on the improvement of public rental housing system—Focusing on the methodology for supplying public rental housing. Real Estate Manag. 2021, 24, 157–184. [Google Scholar]
- Yang, F. Consumption over the life cycle: How different is housing? Rev. Econ. Dyn. 2009, 12, 423–443. [Google Scholar] [CrossRef]
- Karahan, F.; Ozkan, S. On the persistence of income shocks over the life cycle: Evidence, theory, and implications. Rev. Econ. Dyn. 2013, 16, 452–476. [Google Scholar] [CrossRef]
- DeVaney, S.A.; Chiremba, S.; Vincent, A.M. Life Cycle Stage and Housing Cost Burden. J. Financ. Couns. Plan. 2004, 15, 31–39. [Google Scholar]
- Cortes, A.; Lam, K.; Fein, D. Household Life Cycle and Length of Stay in Housing Assistance Programs. Cityscape 2008, 10, 117–156. [Google Scholar]
- Angrist, S.S. Dimensions of well-being in public housing families. Environ. Behav. 1974, 6, 495–516. [Google Scholar] [CrossRef]
- Clark, W.A.; Onaka, J.L. Life cycle and housing adjustment as explanations of residential mobility. Urban Stud. 1983, 20, 47–57. [Google Scholar] [CrossRef]
- Bonnar, D. Life cycle factors and housing choice in the private sector: A temporal economic study using path analytic approaches. Urban Stud. 1979, 20, 47–57. [Google Scholar]
- Kendig, H.L. Housing Careers, Life Cycle, and Residential Mobility: Implications for the Housing Market. Urban Stud. 1984, 21, 271–283. [Google Scholar] [CrossRef]
- Rodarte Costa, E.V. Reframing the “Deserving” Tenant: The Abolition of a Policed Public Housing. Univ. Pa. Law Rev. 2022, 170, 811–851. [Google Scholar]
- Yekimov, S.; Meerson, A.; Egorushkina, T.; Nianko, V.; Kucherenko, D. State support and regulation of housing and communal services during the Covid-19 pandemic. AIP Conf. Proc. 2021, 2442, 070002. [Google Scholar]
- Rita, N.; Garboden, P.M.E.; Darrah-Okike, J. “You Have to Prove that You’re Homeless”: Vulnerability and Gatekeeping in Public Housing Prioritization Policies. City Community 2023, 22, 83–104. [Google Scholar] [CrossRef]
Disclaimer/Publisher’s Note: The statements, opinions and data contained in all publications are solely those of the individual author(s) and contributor(s) and not of MDPI and/or the editor(s). MDPI and/or the editor(s) disclaim responsibility for any injury to people or property resulting from any ideas, methods, instructions or products referred to in the content. |
© 2023 by the authors. Licensee MDPI, Basel, Switzerland. This article is an open access article distributed under the terms and conditions of the Creative Commons Attribution (CC BY) license (https://creativecommons.org/licenses/by/4.0/).