Article

Interannual Variability of Energy and CO2 Exchanges in a Remnant Area of the Caatinga Biome under Extreme Rainfall Conditions

by
Keila R. Mendes
1,*,
Ana M. S. Marques
1,
Pedro R. Mutti
1,2,
Pablo E. S. Oliveira
1,2,
Daniele T. Rodrigues
3,
Gabriel B. Costa
1,4,
Rosaria R. Ferreira
1,
Any C. N. da Silva
2,
Leonardo F. Morais
1,
José Romualdo S. Lima
5,
Antonio C. D. Antonino
6,
Rômulo S. C. Menezes
6,
Cláudio M. Santos e Silva
1,2,* and
Bergson G. Bezerra
1,2
1
Climate Sciences Post-Graduate Program, Federal University of Rio Grande do Norte, Natal 59078-970, RN, Brazil
2
Department of Atmospheric and Climate Sciences, Federal University of Rio Grande do Norte, Natal 59078-970, RN, Brazil
3
Department of Statistic, Federal University of Piauí, Teresina 64049-550, PI, Brazil
4
Biosciences Post-Graduate Program (PPG-BIO), Federal University of West Pará, Santarém 68035-110, PA, Brazil
5
Academic Unit of Garanhuns, Federal University of the Agreste of Pernambuco, Garanhuns 55292-270, PE, Brazil
6
Department of Nuclear Energy, Federal University of Pernambuco, Recife 50740-545, PE, Brazil
*
Authors to whom correspondence should be addressed.
Sustainability 2023, 15(13), 10085; https://doi.org/10.3390/su151310085
Submission received: 8 March 2023 / Revised: 31 May 2023 / Accepted: 15 June 2023 / Published: 26 June 2023
(This article belongs to the Section Air, Climate Change and Sustainability)

Abstract

:
Research focusing on energy, water vapor, and CO2 exchanges over the Caatinga Biome is recent. Consequently, there exist research gaps on this topic that limit our ability to understand and project interannual and long-term variations in the CO2 cycle of this environment. Thus, the objective of this study was to evaluate the behavior of the energy and CO2 balances of the Caatinga Biome under extreme rainfall conditions (extreme drought and intense rainfall) using simulations of the SITE model (Simple Tropical Ecosystem Model). Meteorological data from the years 2009 (heavy rainfall) and 2012 (extreme drought) obtained from an INMET automatic station were used. Relationships between monthly GPP and NEE values and rainfall were also analyzed. Although the SITE model had been previously calibrated for the region, adjustments to the calibration were necessary for our study due to the extreme climatic values of the selected years. The results highlight the impact of rainfall on energy and mass exchanges over the Caatinga, particularly evident in the partitioning of the energy balance and the CO2 balance. In 2009 (during heavy rainfall), the fraction of Rn converted into LE was nearly 6% higher compared to the values observed in 2012 (during extreme drought). Regarding CO2, it was found that the Caatinga behaved as a sink, even under extreme drought conditions (2012), with annual average values of −1.86 µmol m−2 s−1 (2009) and −0.81 µmol m−2 s−1 (2012). Relationships between monthly GPP and NEE values and rainfall were also investigated, revealing an asymptotic relationship between the components of CO2 balance and rainfall. It was evident that both the monthly values of GPP and NEE tend to stabilize when monthly rainfall volumes exceed 200 mm.

1. Introduction

Terrestrial ecosystems have served as substantial sinks for atmospheric carbon dioxide (CO2), absorbing an average of 25–30% of annual anthropogenic emissions [1,2]. Humid tropical forests, such as the Amazon rainforest, exemplify CO2 sinks based on their 20-year average behavior. However, they have occasionally acted as neutral or even CO2 sources [3] due to distinctive seasonal patterns of carbon exchange, meteorological variables, and water use efficiency [4]. These differences arise from both inherent characteristics of the biome and the influences of extreme events and fire impacts in the region [5,6]. Therefore, further studies are necessary to comprehensively understand the intricacies of the biosphere-atmosphere interaction within these environments.
The CO2 concentration is currently increasing at a rate exceeding the worst projection of the Intergovernmental Panel on Climate Change [7]. Forests play a crucial role in regulating global climate change through both the emission of greenhouse gases into the atmosphere, either through burning or deforestation, as well as through the absorption of carbon from the atmosphere through growth. Forests are particularly important because they store a larger amount of carbon in their trees and soil than currently exists in the atmosphere [7]. Consequently, aspects of biogeochemical cycles have been the subject of increasing research, particularly using the eddy covariance technique (EC) to estimate in situ carbon fluxes [8,9,10].
Climate modeling studies predict that rainfall patterns in tropical dry forests will change, resulting in an overall reduction in rainfall and an intensification of dry intervals. These changes are expected to increase the susceptibility of these forests to drought [11,12,13]. In this context, it is crucial to comprehensively understand how forest carbon fluxes vary spatially, and their underlying control mechanisms. This understanding is essential for accurately assessing the global carbon balance [14].
On a global scale, seasonally dry tropical forests (SDTFs) are highly fragile, highly endangered, and poorly studied environments compared to wet tropical forests and savannas [10,15]. The Caatinga Biome occurs exclusively in Brazil, located in the northeast region of the country (NEB), and corresponds to the largest continuous area of seasonally dry tropical forest (SDTF) in South America [16]. This area is characterized by the occurrence of annual rainfall predominantly below 800 mm, which is spatially and temporally irregular. It experiences high temperatures, abundant solar radiation, and high evaporative demand, resulting in an almost permanent condition of water deficiency [10,17,18]. Despite recent studies on heat and mass exchange in the Caatinga Biome [10,19,20,21,22,23], there is still a lack of studies with broader spatial and temporal scopes on the soil-vegetation-atmosphere relationship, especially regarding CO2. Logically, the studies represent important milestones, but they are specific and cover limited time aforementioned periods. Further improvements are needed in understanding the behavior of the Caatinga in terms of CO2 exchange during anomalous years (wet or dry, with high temperatures) and normal years. Additionally, there is a scarcity or near absence of studies on trends in the magnitude of CO2 balance components and their respective relationships with rainfall trends.
Typically, studies with larger spatial and/or temporal scales are conducted using remote sensing data [4,18,24,25] or via modeling [2,26,27,28,29,30]. Studies using soil-vegetation-atmosphere transfer (SVATS) models are a viable alternative for determining and evaluating energy and CO2 fluxes in various ecosystems. This alternative is particularly valuable, considering the complexity and cost of setting up in situ experiments (such as EC flux towers) to assess the potential impact of climate change on ecosystem functioning [31,32].
The SITE (Simple Tropical Ecosystem) model is a simple point-based (offline) model that uses an integration interval ( d t ) . It incorporates site-specific data on temperature, horizontal wind speed, specific humidity, and photosynthetically active radiation (PAR) [33,34]. The SITE model was originally developed to study the response of tropical ecosystems to varying environmental conditions while adequately representing the functioning of the ecosystem. It considers the main physical, chemical, and biological processes involved in energy and carbon fluxes.
It has been employed because of its biogeochemical and biophysical character that encompasses various surface processes, including infrared radiation balance above the canopy, solar radiation balance, aerodynamic processes, canopy physiology and transpiration, canopy water balance, mass and energy transfer in the atmosphere, soil heat fluxes in two layers, soil water, and carbon flux and equilibrium [23]. Studies carried out using the SITE model have yielded promising results both within its intended scope [35], and in an experimental site within a tropical semi-deciduous forest in the southern Amazon Basin [34] and the Caatinga ecosystem [21,23].
Little is known about how the Caatinga acts regarding CO2 exchanges under conditions of extreme drought and in years of heavy rainfall. Therefore, this study aims to assess the energy and CO2 balances of the Caatinga Biome when exposed to extreme rainfall conditions (including both extreme drought and heavy rainfall). Additionally, it aims to evaluate the source/sink dynamics of the Caatinga under these extreme conditions while demonstrating the compensation and saturation of gross primary productivity (GPP), net ecosystem exchange (NEE), and net ecosystem productivity (NEP) as influenced by monthly rainfall.

2. Materials and Methods

2.1. Study Area

We used a dataset composed of two years of extreme climate behavior: heavy rainfall in 2009 and extreme drought in 2012. We chose 2009 and 2012 based on [18], which characterizes the climatic variability of the region. The study indicates that the annual rainfall totals in the region is typical of a tropical-arid climate, ranging between 400 mm and 800 mm. Considering a climatological perspective with 30 years of observation, 2009 was the rainiest year, while 2012 was the driest. To calibrate the SITE model, we used a set of two years (2014 and 2015) of EC data. The EC system was installed in a fragment of the Caatinga biome (Figure 1), located in the Seridó Ecological Station (ESEC-Seridó), where the exchanges of energy fluxes and CO2 were systematically and uninterruptedly monitored for two consecutive years (2014–2015) [10].
The monitoring was performed using a flux tower equipped with an EC system, in addition to instruments for measuring soil heat flux, shortwave, and longwave radiative components. The tower belongs to the INSA (National Institute of the Semiarid) and is part of the NOWCDCB network (National Observatory of Water and Carbon Dynamics in the Caatinga Biome). The tower is situated at the ESEC-Seridó (6°34′42″ S, 37°15′05″ W 205 m above sea level) near the municipalities of Serra Negra do Norte and Caicó, in the State of Rio Grande do Norte, Brazilian Semiarid (Figure 1).
The climate in the region is semiarid, and the ESEC-Seridó exhibits a distinctive type of caatinga characterized by its dry and sparse nature, with bushes and trees reaching heights of up to 2 m. The soils of the Seridó region are formed on a crystalline shield and have moderate natural fertility, especially in the alluvial lowlands. However, these soils are subjected to an irregular and limited distribution of rainfall. The vegetation develops on a shallow and stony soil, resulting in distinct physiognomies within the boundaries of the conservation unit. These variations are influenced by factors such the type of soil, water availability, and topography [36,37].

2.2. Micrometeorological Measurements and Application of the SITE (Simple Tropical Ecosystem) Model

The procedure for calculating hourly NEE values can be found in [21,38]. The CO2 flux calculation involved a series of procedures that included: coordinate rotation correction using the planar fit method, sonic virtual temperature correction, corrections for density fluctuation (WPL-correction), and frequency response correction. After the calculations, a robust quality control and filtering process was performed to detect and exclude spikes and physically inconsistent data. Subsequently, gap-filling was performed. A detailed description of the complete methodology is described in previous research: [10,20,21,39]. The partitioning of CO2 fluxes was performed using the algorithm reported in [40], which uses the nighttime period to divide NEE into Reco and GPP. During the night, GPP is assumed to be zero, and therefore, NEE is equal to Reco. The nighttime fluxes were adjusted with respect to air temperature through the Lloyd and Taylor equation [41]. In both the filtering and gap-filling procedures, we used an online tool from the Max Plank institute—https://www.bgc-jena.mpg.de/REddyProc/ui/REddyProc.php, accessed on 25 March 2022.
The energy balance, Rn and G, were directly measured, while LE and H were determined using high-frequency data measured by the EC system as described by [10,39].
Micrometeorological data measured at the tower, located 11 m above the surface, were used as input data SITE simulations. Observations included air temperature, rainfall, horizontal wind speed, downward shortwave and longwave radiation, and specific humidity.
The model was calibrated and validated for the study region considering the years 2014 and 2015 [32]. Energy balance data (Rn, LE, H, and G) were used, where Rn represents the radiation balance, H denotes the sensible heat flux (heating of the air near the surface), LE corresponds to the latent heat flux (evaporation of water from the soil and transpiration of plants), and G represents the heat flux in the soil (heating of the soil). The carbon balance (GPP, Reco, and NEE) was obtained using the EC method during two consecutive years (2014 and 2015) in the ESEC-Seridó.
For model calibration, ref. [32] adopted the sequential method, selecting parameters with the highest probability of influencing the model’s outcome. These parameters include the initial soil moisture fraction (θg/θd), stomatal conductance coefficient (m), maximum capacity of the Rubisco enzyme (Vmax), typical dimension of leaves (du), typical dimension of stems (ds), leaf width (w), and specific leaf area (SL), based on previous sensitivity analyses [34,42]. Table 1 presents the calibration parameters used for the Caatinga biome by [32].
The performance of the model was evaluated and analyzed using Taylor diagrams, which display the Pearson correlation coefficient (r), standard deviations (SD) between the observations and simulated data, and root mean square error (RMSE). Additionally, the model’s performance was assessed using the following statistical measures: median absolute error (MAE) and Willmott’s index of agreement (d). Further details regarding the model validation can be found in [32].
The SITE model was used to compute a multi-year series of the energy and CO2 balance of a Caatinga area within the ESEC-Seridó. In the present study, the model input data consisted of meteorological data observed in 2009 (1019.6 mm of rainfall), considered a wet year compared to the region’s climatology which has an annual average below 800 mm, and in 2012 (198.2 mm of rainfall) was characterized as a year with extremely low rainfall. These measurements were obtained from an automatic weather station belonging to the INMET (National Institute of Meteorology) network.
A regression analysis was conducted to examine the relationships between the monthly values of CO2 balance components (GPP, NEE, and NEP) and rainfall. The quality of the model fit was assessed through the coefficient of determination (R2) and significance (p-value < 0.05) using the R software, version 4.2.1 [48].

3. Results and Discussion

Rainfall, Temperature and Radiation

The choice of the years 2009 and 2012 was based on previous analyses by [18], which identified these two years as having rainfall extremes. Specifically, 2009 exhibited a rainfall anomaly of approximately +400 mm while 2012 had an anomaly of approximately −400 mm in the ESEC-Seridó region. The selection of these years was primarily motivated by the influence of rainfall on energy and mass exchange (water vapor and CO2) in tropical regions, as demonstrated by studies conducted by [10,20,21].
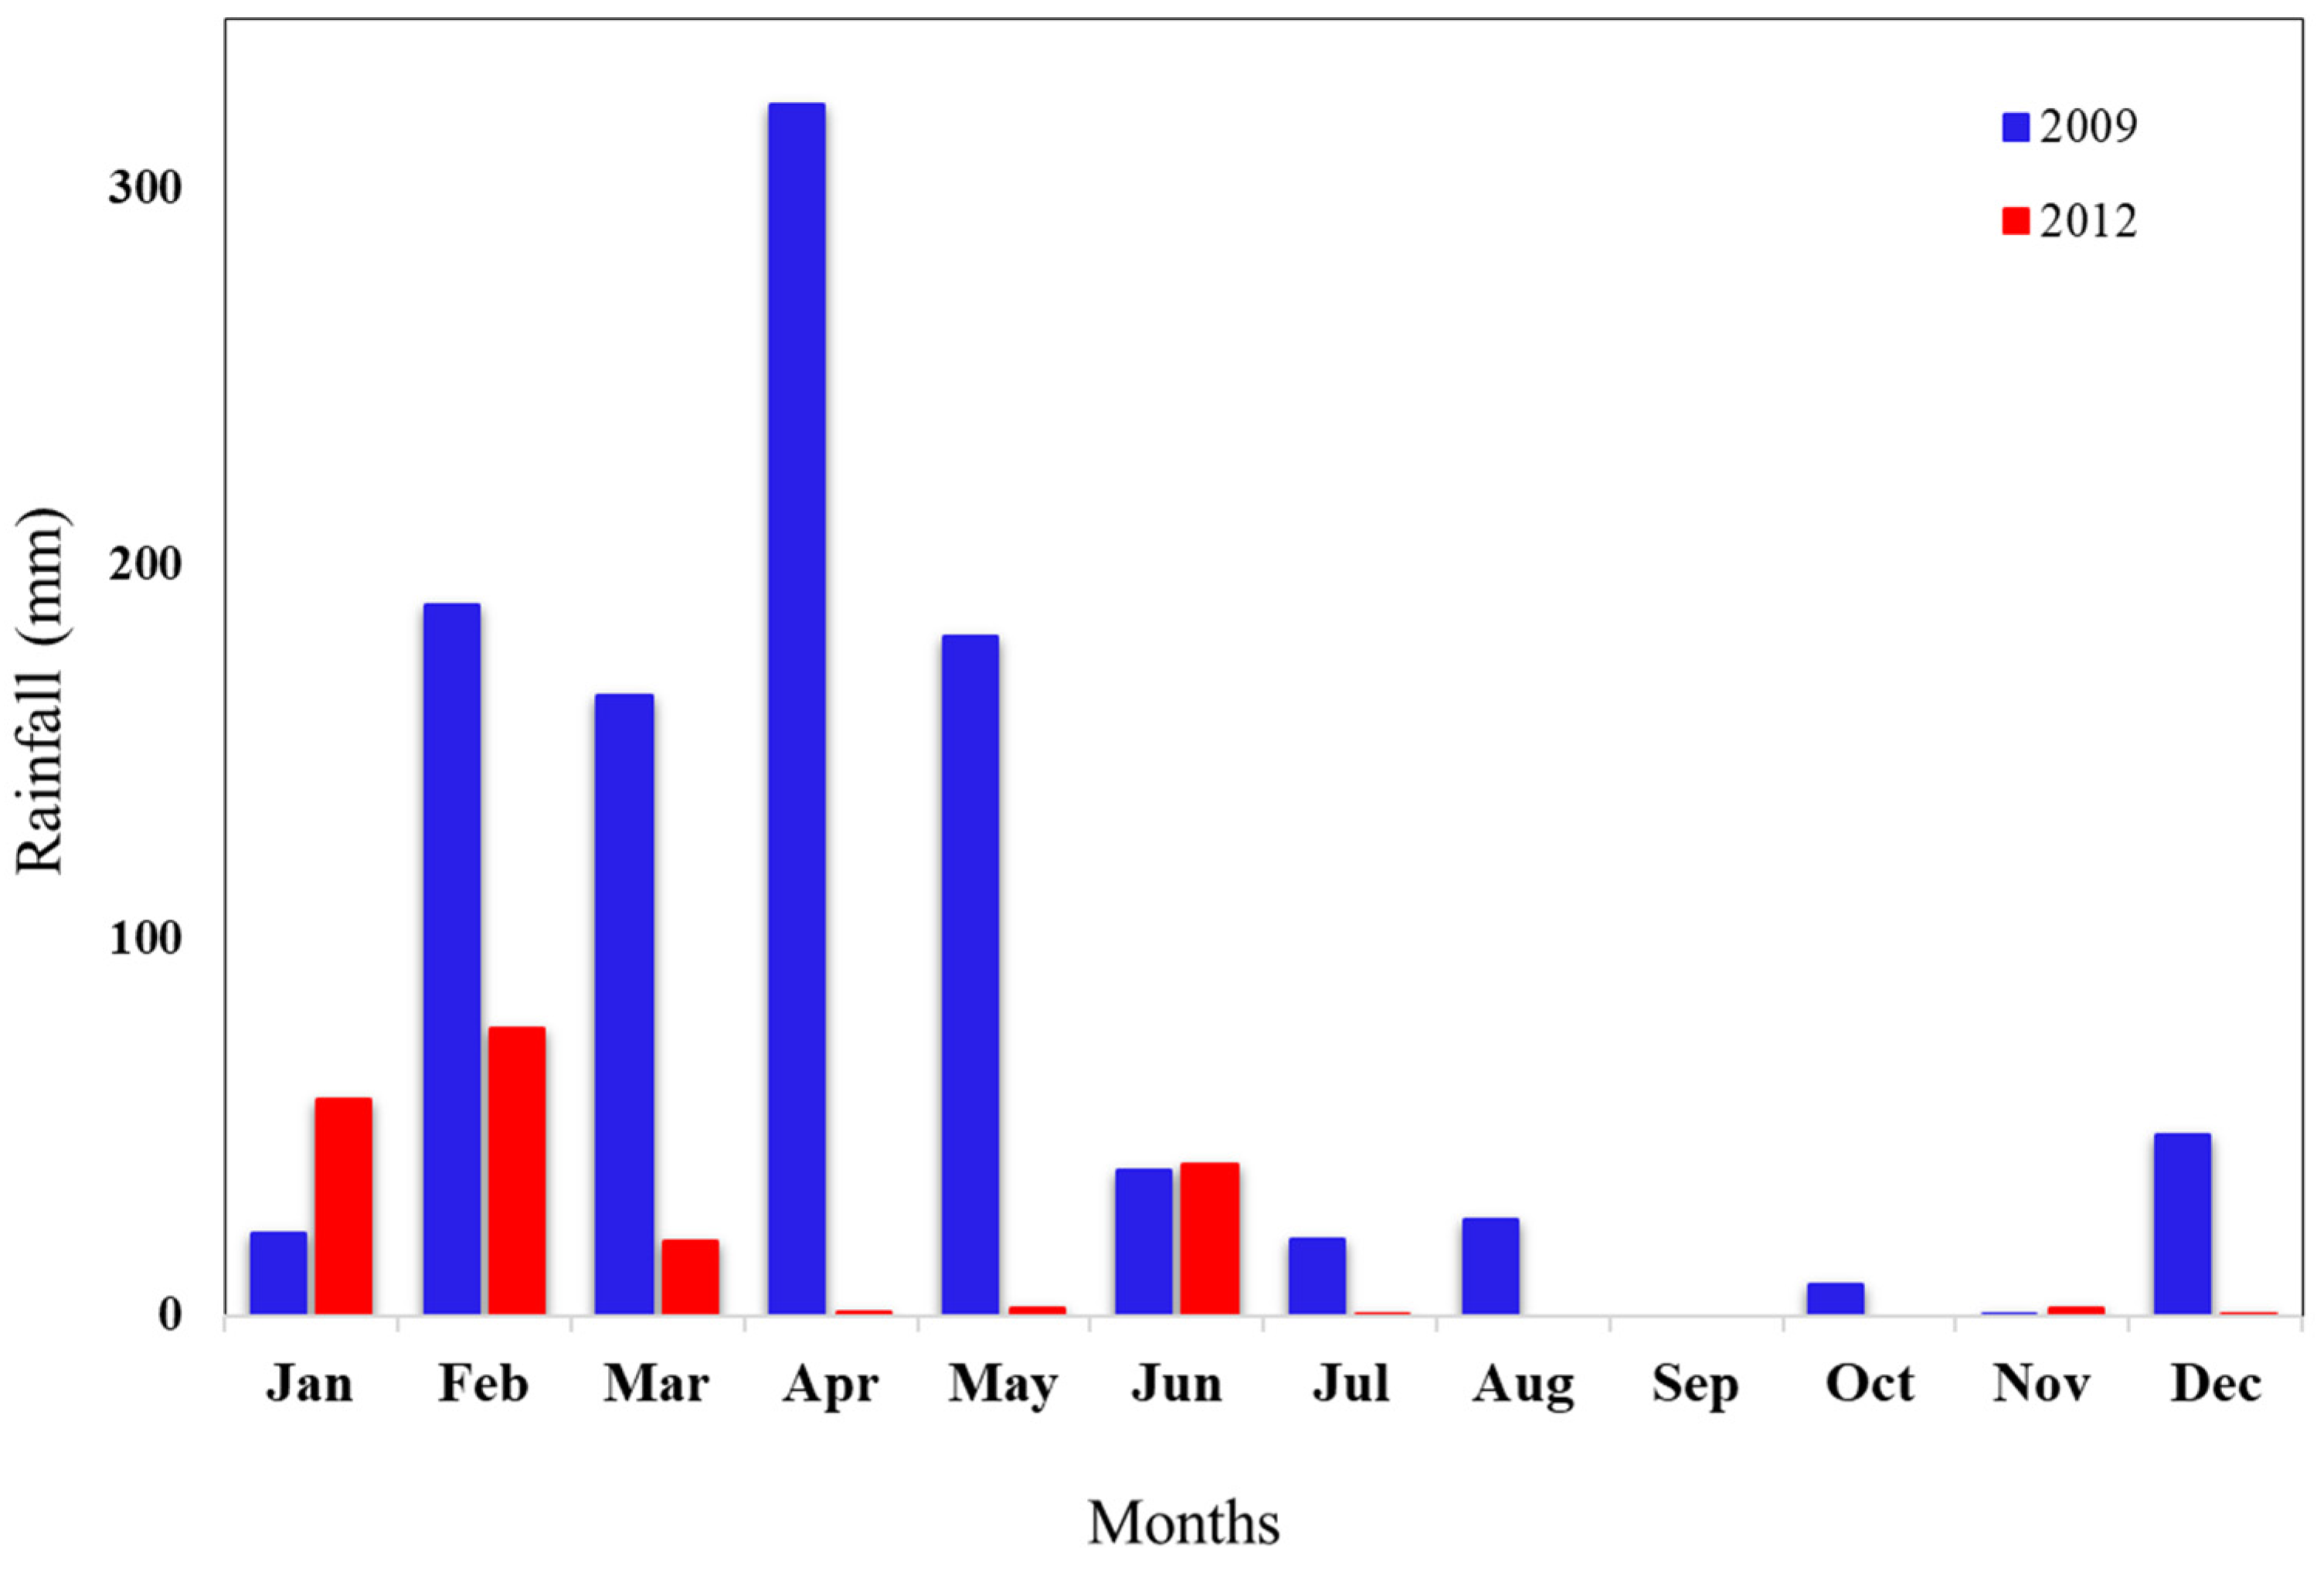
Differences in rainfall amount and distribution were observed between the two study years (Figure 2). Annual rainfall in 2009 and 2012 were 1019.6 mm and 198.2 mm, respectively, while the mean annual climatological precipitation is 758 mm [32].
The months from February to May showed the highest volumes and a greater regularity in 2009 (857 mm—84% of total rainfall) and 2012 (98.60 mm—50% of total rainfall). In the dry season (from July to December), rainfall rarely occurs, with negligible values recorded in 2009 (102.20 mm—10% of total rainfall) and 2012 (2.20 mm—1% of total rainfall).
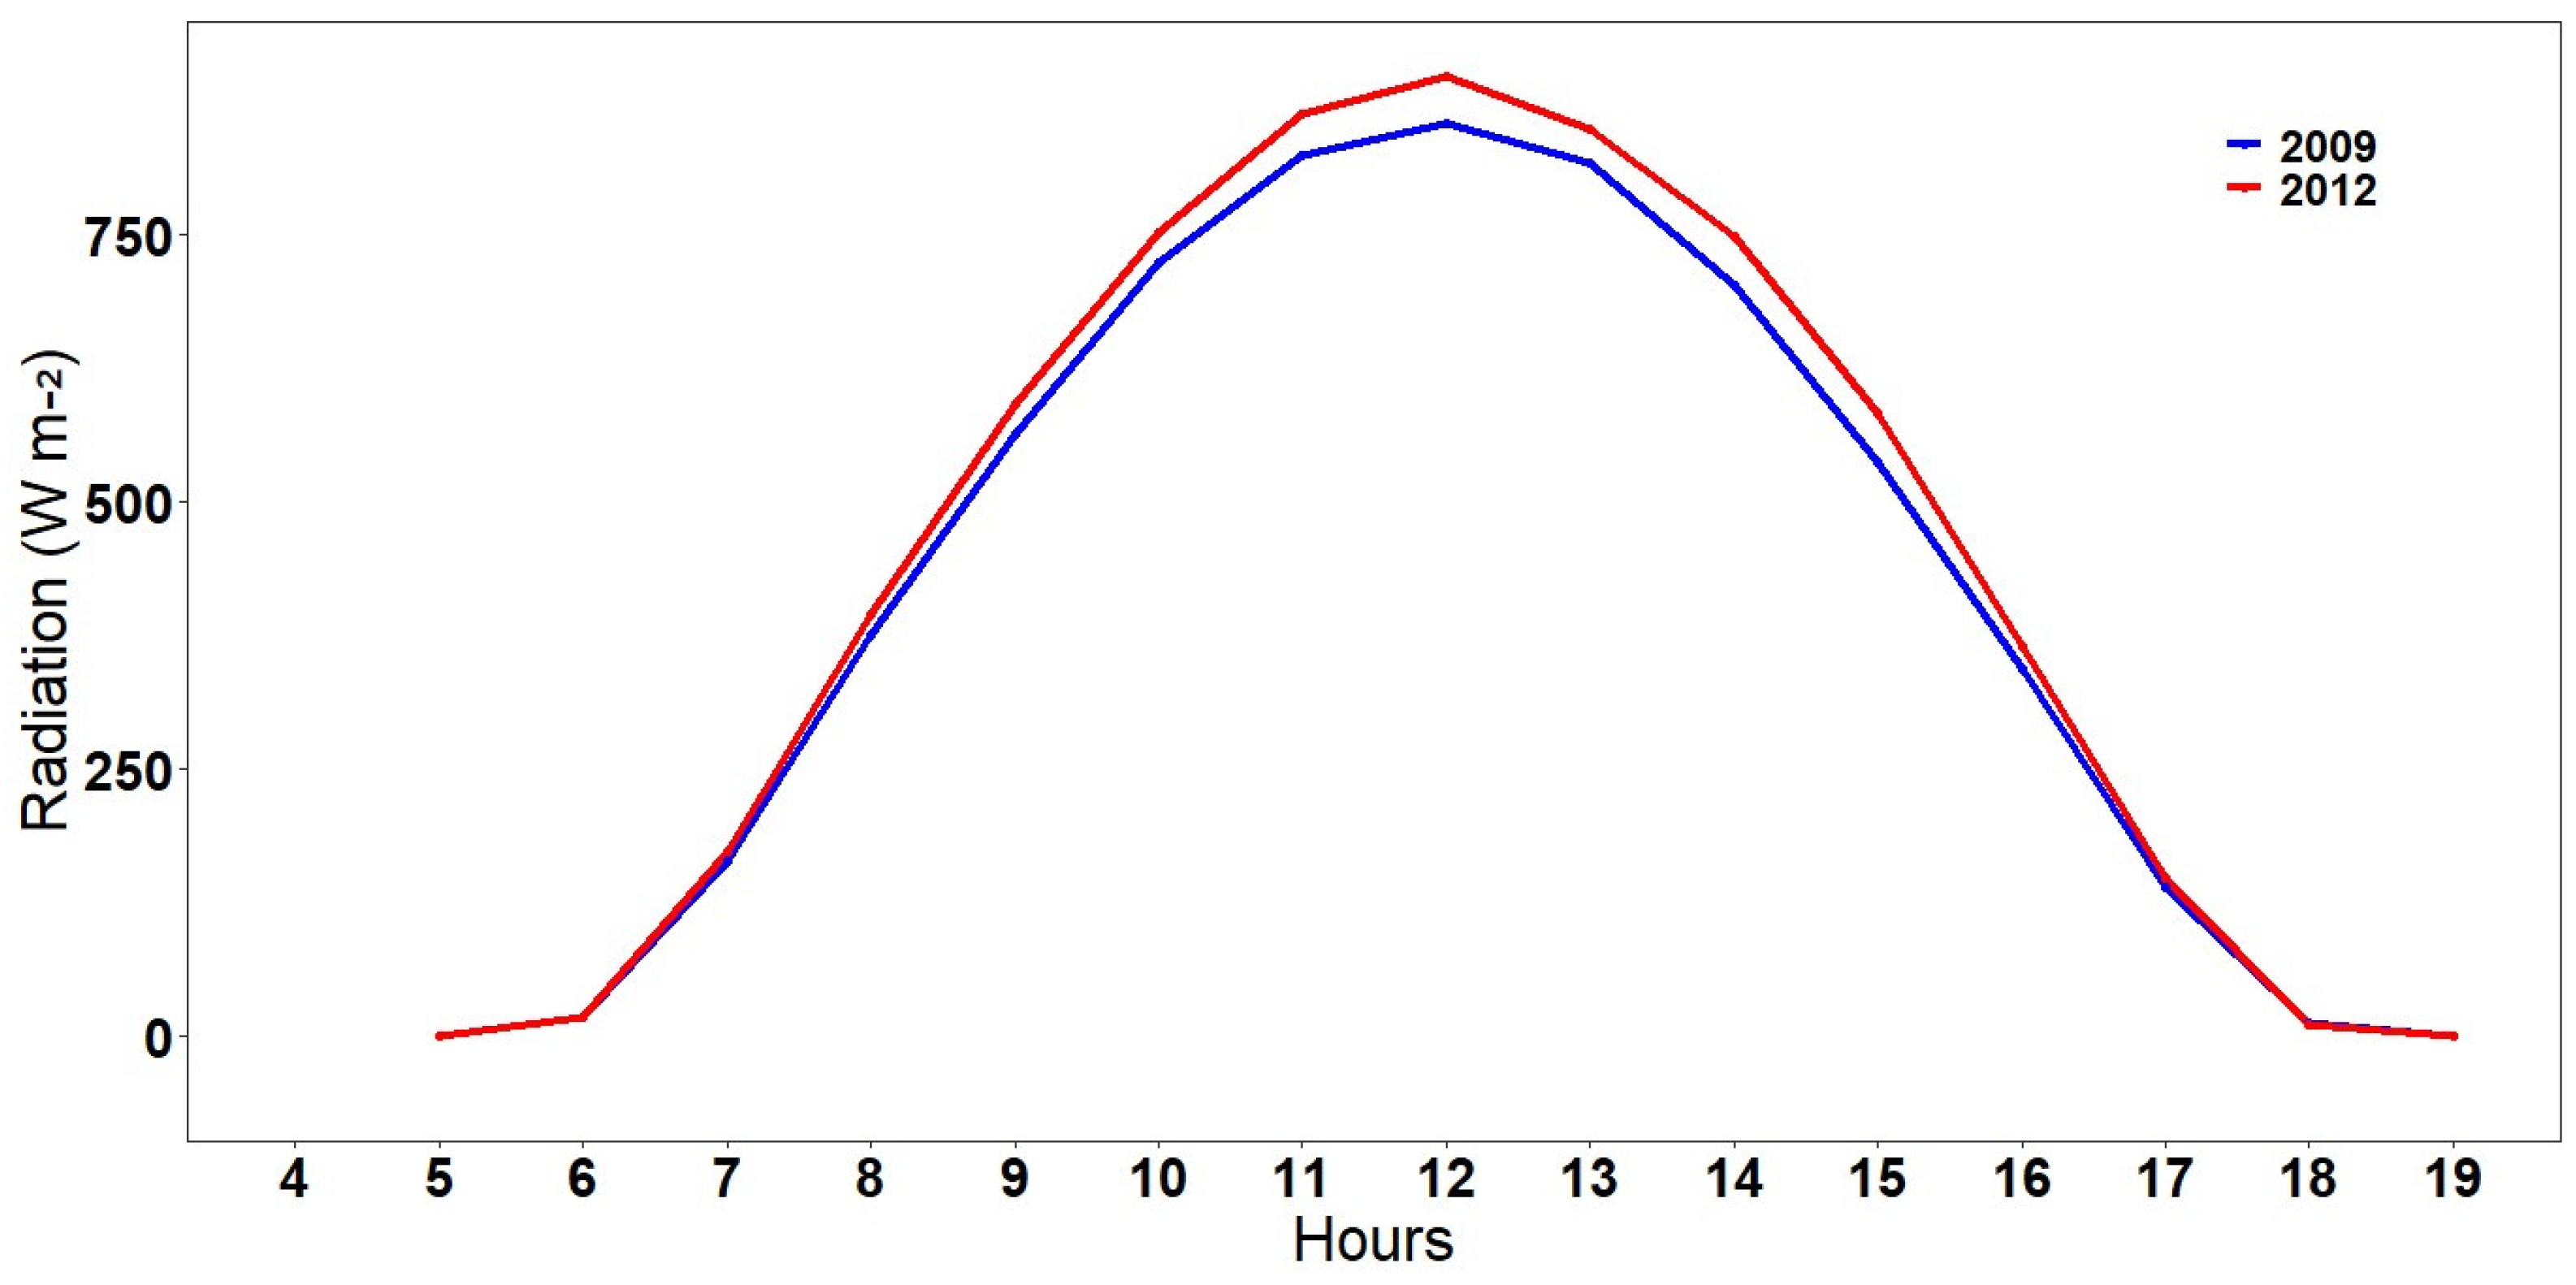
Figure 3 illustrates the hourly cycle of global radiation (Rg) over the two years. It can be observed that Rg exhibited a similar behavior in both years. However, it is noteworthy that Rg was slightly higher in 2012 (490.20 Wm−2) compared to 2009 (466.50 Wm−2), which is likely associated with lower cloud cover in 2012. This is supported by the fact that rainfall in 2012 was substantially below both the climatological average and that of the year 2009 [18].
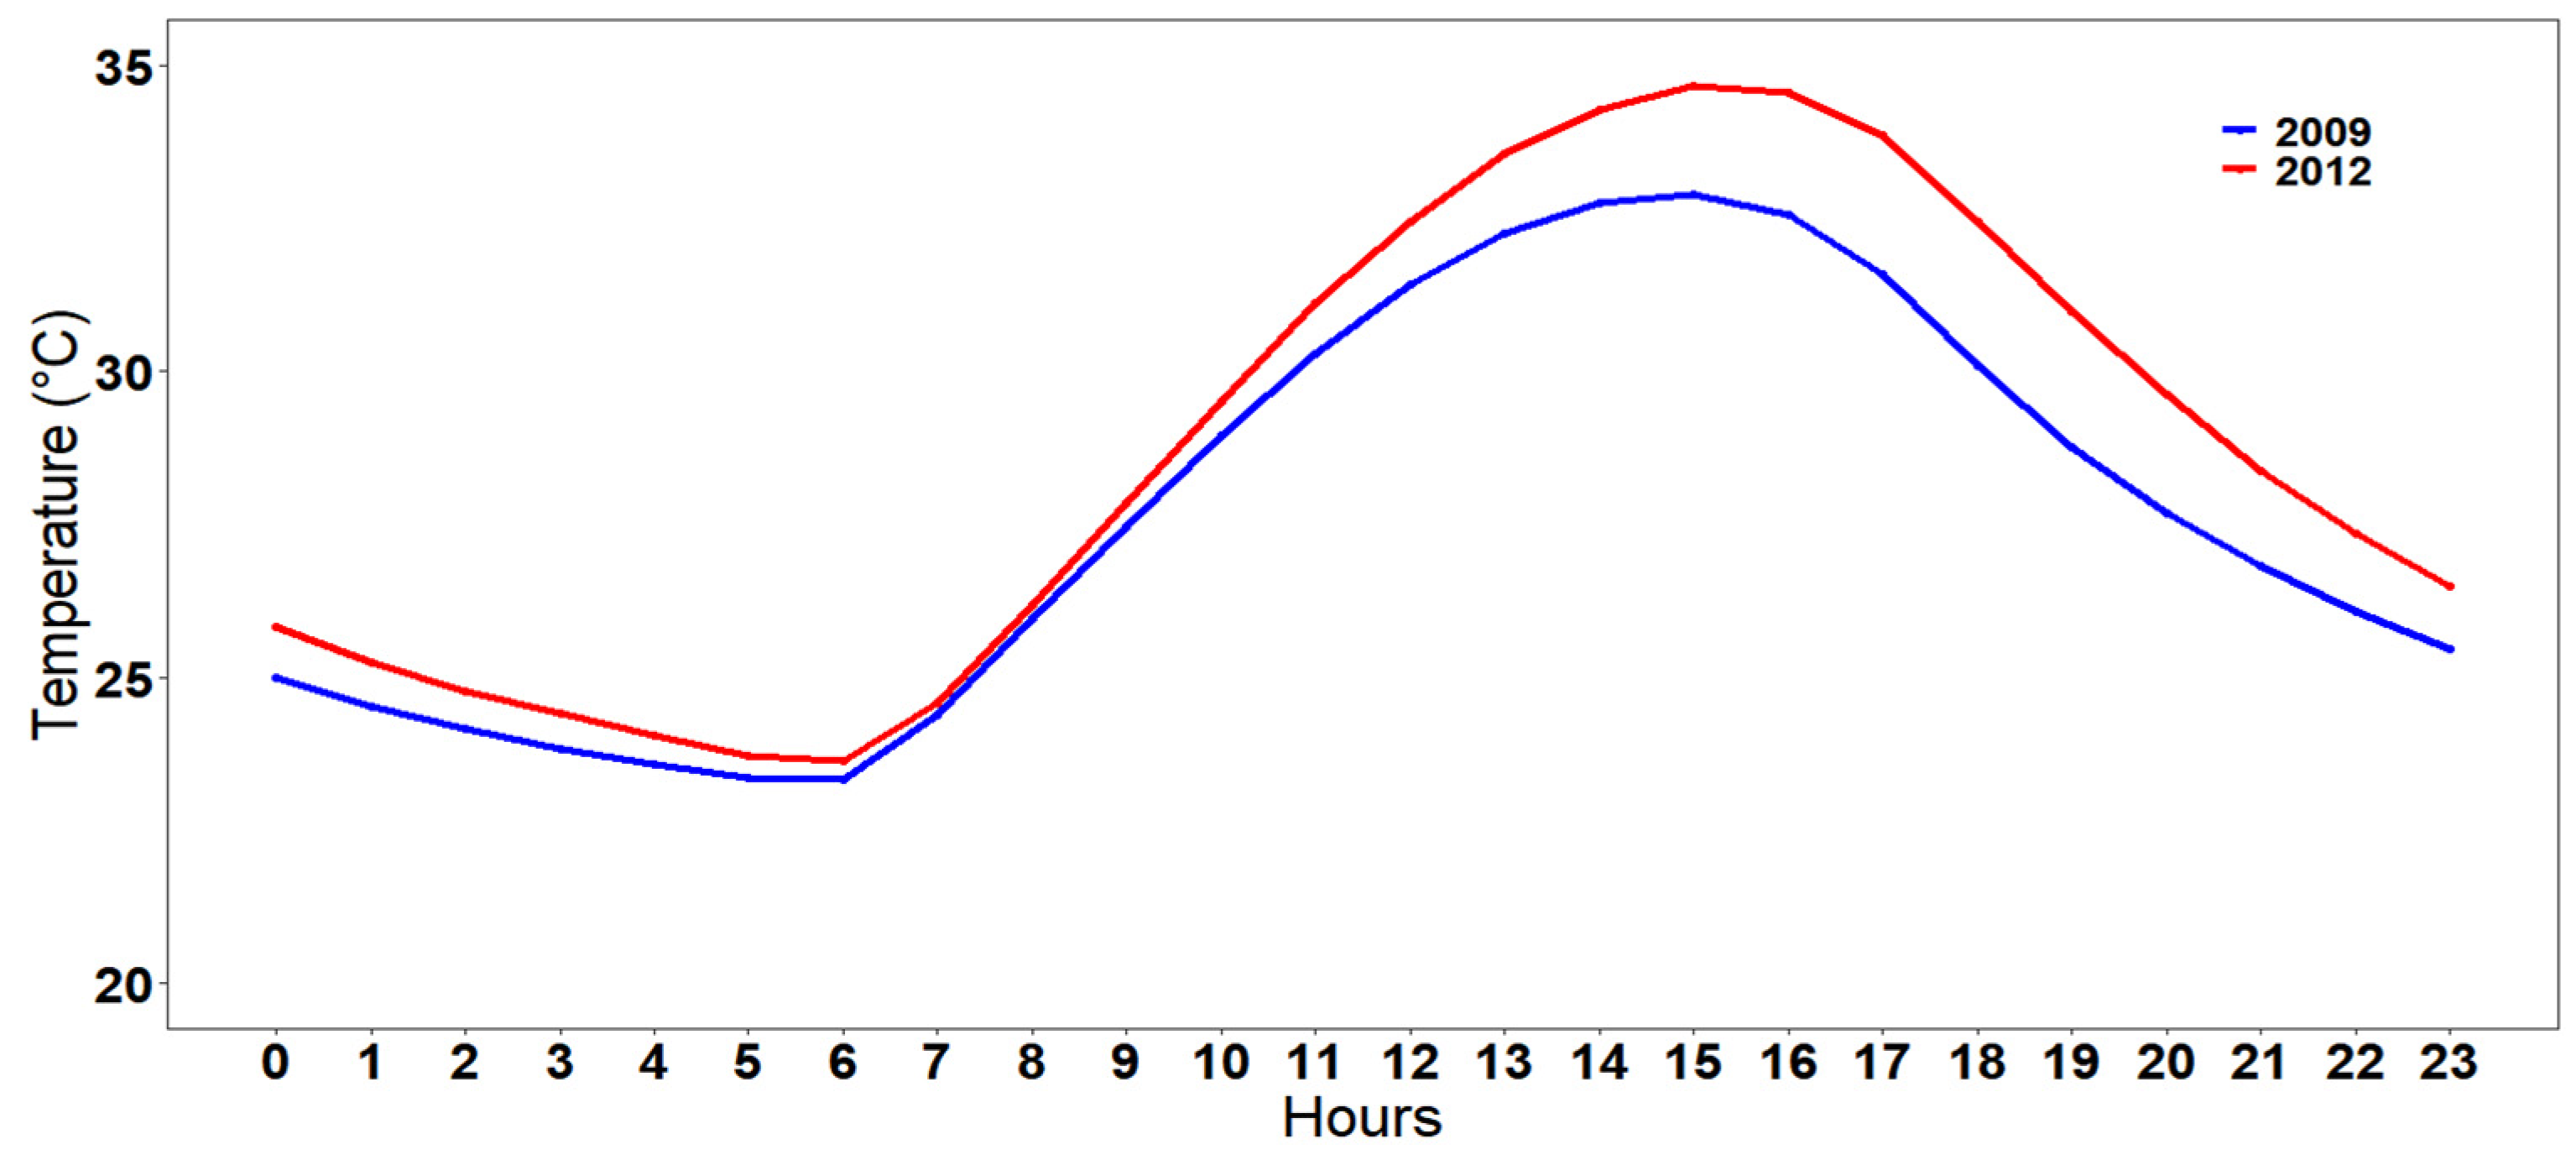
As expected, the air temperature in 2012 was also higher than in 2009 (Figure 4). The hourly cycle reveals that not only was the average temperature observed in 2012 higher than in 2009, but the minimum and maximum temperatures were also higher (23.6 °C and 35 °C, respectively) compared to 2009 (23.3 °C and 32 °C, respectively). This difference in air temperature is probably associated with the difference in rainfall between the two years.
The daily cycle of meteorological variables is primarily influenced by Earth’s rotation and, consequently, the daily cycle of solar radiation. However, the daily cycle of air temperature is also affected by longwave radiation, specifically terrestrial and atmospheric radiation. For this reason, the maximum daily temperature occurs between 2 and 3 pm, which is more than two hours after the maximum incidence of solar radiation.
According to [49], it is currently known that changes in climate are conditioned by temporal and/or spatial variations in temperature, and that these changes are in turn determined by the energy balance at the Earth’s surface. Therefore, any change in the energy balance will directly impact the fluctuations in air temperature, winds, and possibly rainfall.

4. Energy Balance

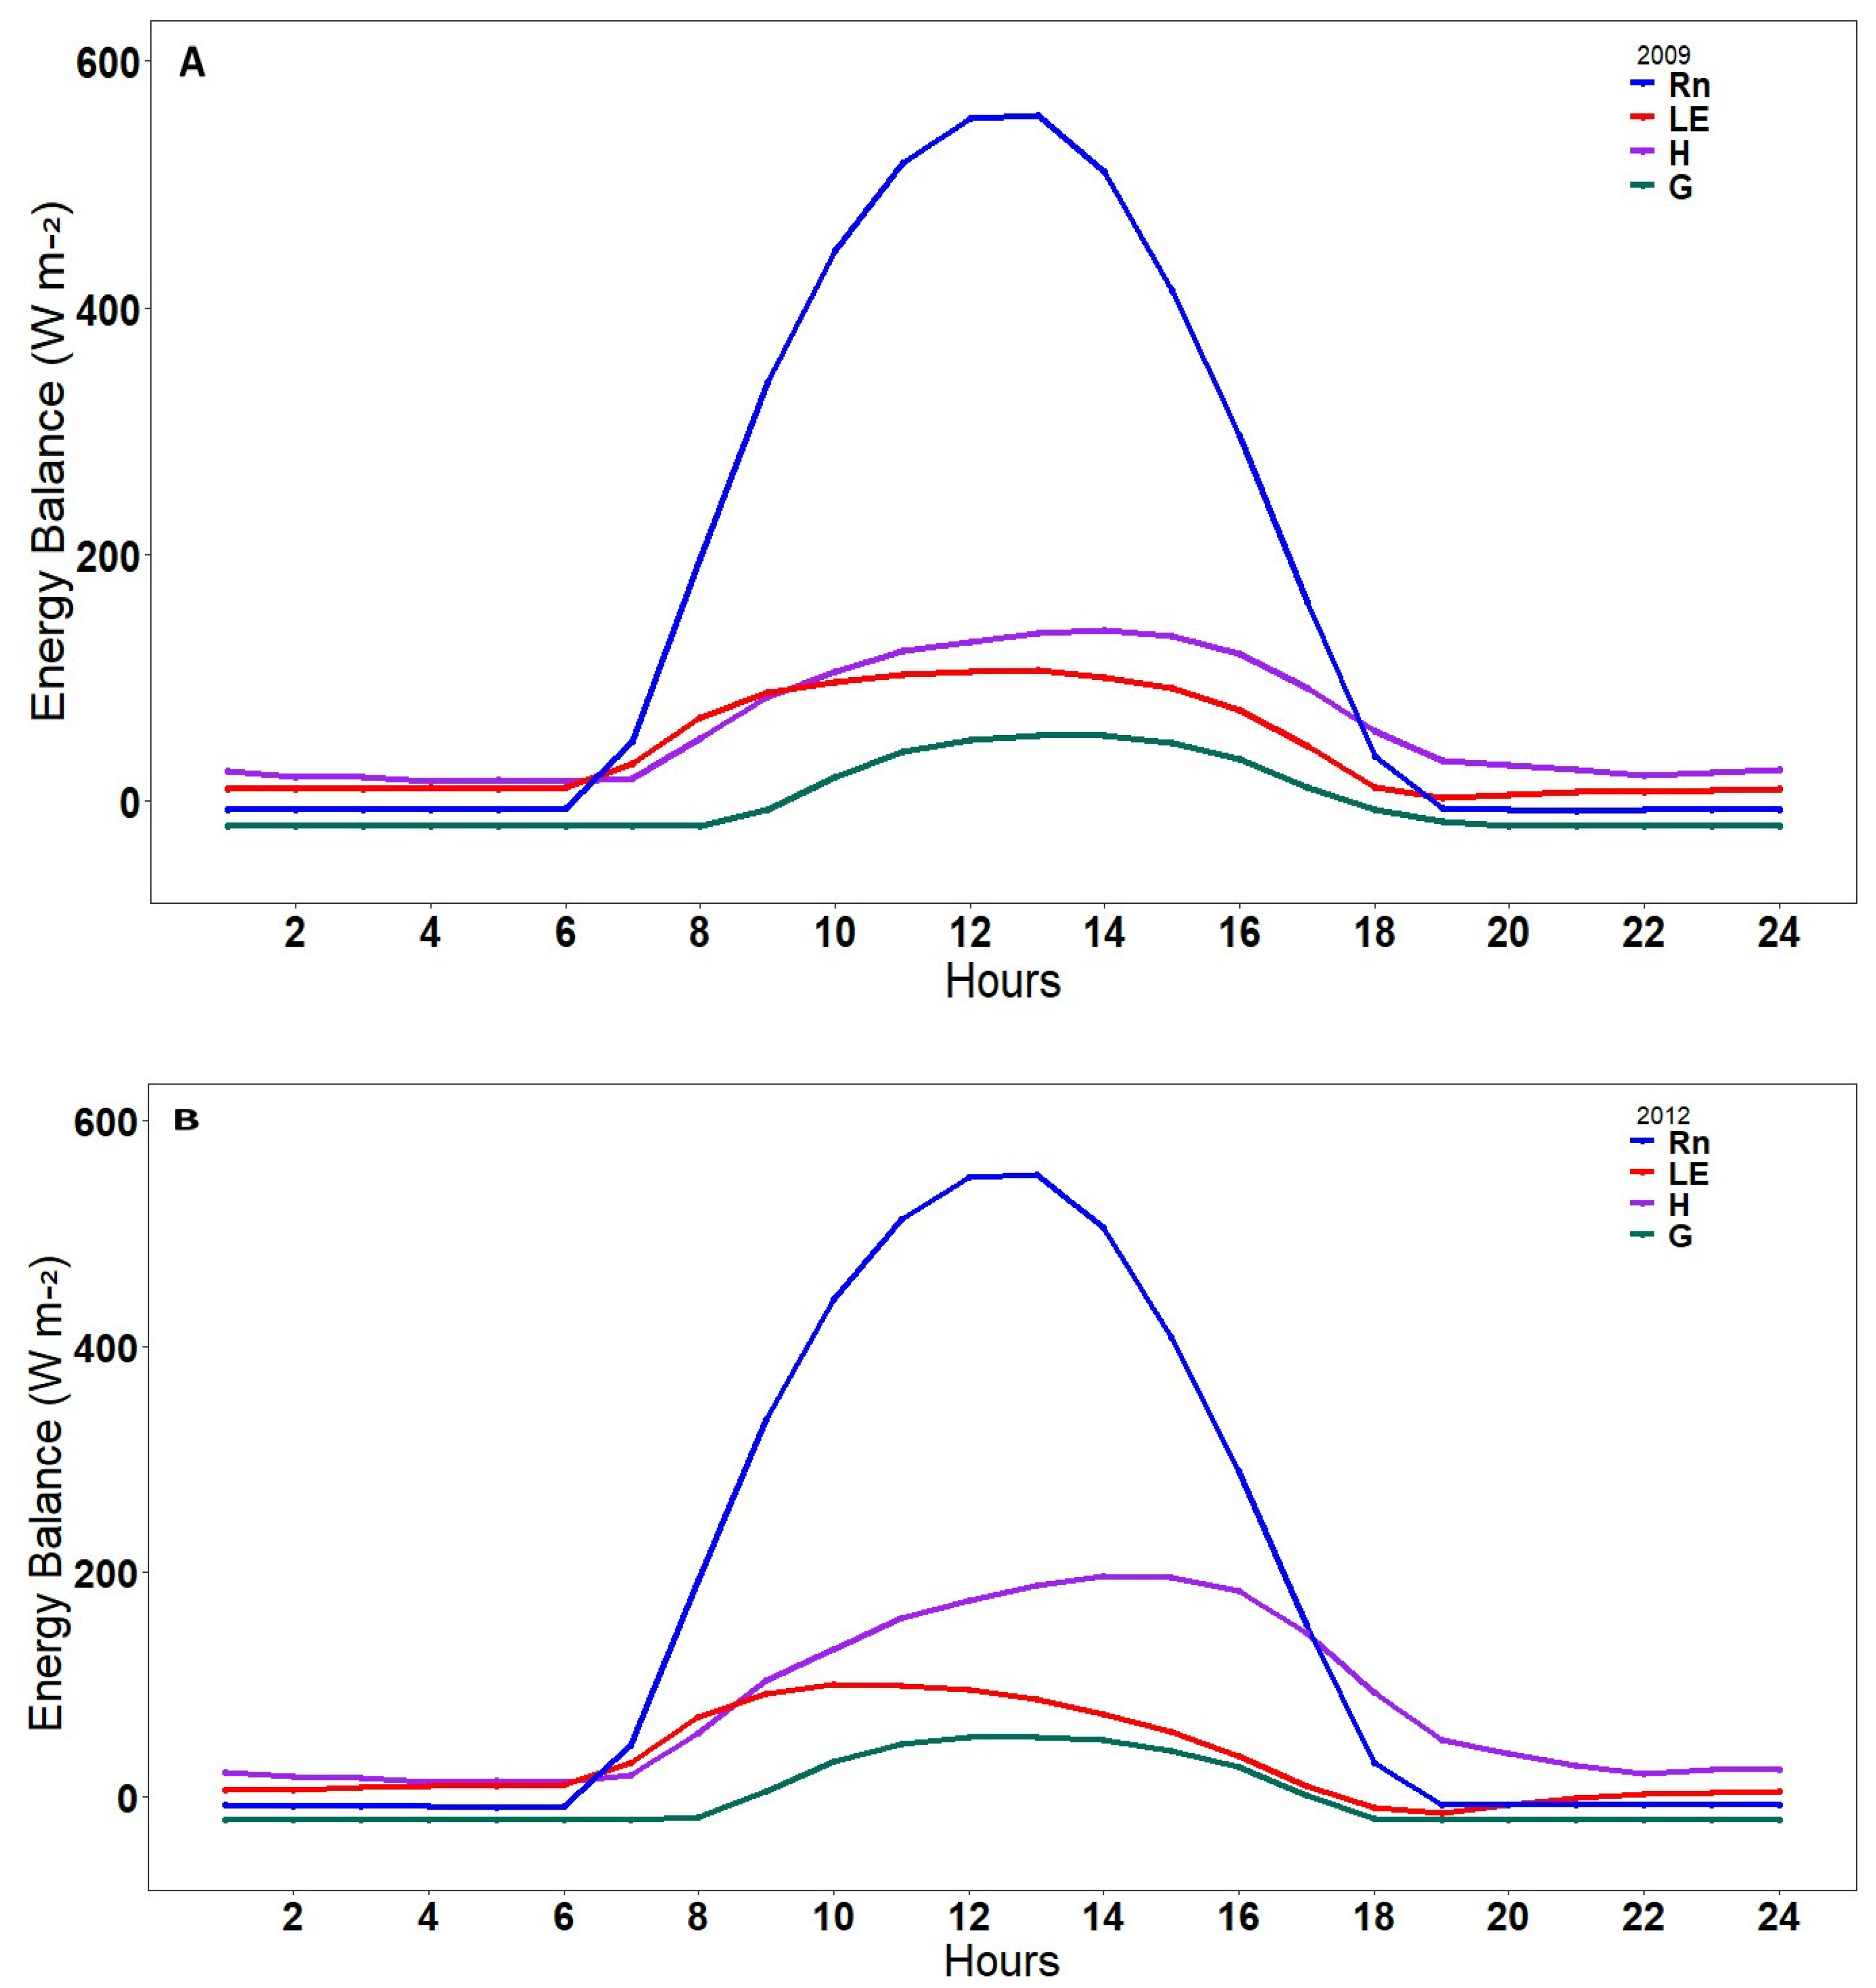
Figure 5 shows the average daily cycle of the simulated energy balance in the study area for the years 2009 and 2012. In general, the daily pattern of Rn agrees with that of solar radiation. This correspondence has been observed across different ecosystems and in regions with different climatic conditions [10,50,51]. Rn is negative or approaches zero during the nighttime, when radiative cooling of the surface dominates and presents positive values during the day because of the incidence of solar radiation.
In general, the average daily behavior of the energy balance components (Rn, H, LE and G) agreed with the daily pattern of solar radiation in both years. The exceptions were H and LE during 2012 (Figure 5B). The maximum value of LE was reached at approximately 09:00, whereas the maximum value of H was observed around 14:00 local time. H increased continuously from 09:00 h until 14:00 h while LE decreased within the same time interval.
Maximum LE occurred at 09:00 h, coinciding with the daily period when the Caatinga exhibits the maximum stomatal opening, according to [20]. After this time, also according to [20], VPD steadily increases until 14:00 h. During this time interval, Caatinga plants exert greater control over evapotranspiration by progressively reducing stomatal aperture to prevent excessive water loss [20,21]. Consequently, most of the available energy within this period (from 09:00 to 14:00 h) is converted into H.
The soil heat flux (G) has negative values throughout most of the day and night. Positive values are only observed between 9:00 a.m. and 5:00 p.m. (local time), reaching a maximum of 53.87 Wm−2 in 2009 and 53.14 Wm−2 in 2012. In 2009, the values of G were higher compared to 2012.
Table 2 presents the annual and seasonal averages (dry and wet seasons) of the components of the energy balance and their respective partitions. It can be noted that the annual and seasonal averages of Rn varied little, from 163.4 to 170.2 Wm−2, which is a difference of less than 5%. This small difference is due to little seasonal variation in solar radiation, the main modulator of Rn [10,50,51]. Such radiation behavior is typical of tropical regions, especially at low latitudes (below 10°). The fact that the year 2009 was rainier does not substantially alter the partition of energy fluxes compared to 2012 in this biome. As demonstrated in previous studies [4], the water use efficiency and evapotranspiration patterns respond more strongly to consecutive wet days rather than the amount of water precipitated in a given month, which can occur on isolated days.
Additionally, according to Table 2, it can be observed that the energy balance closure (EBC) simulated by the SITE model showed a seasonal variation ranging from 0.58 to 0.86, with an overall average of ~0.70 for the two years. This value is considered satisfactory, albeit lower than the values obtained experimentally using the EC method [10,39,52,53]. The relatively modest closure observed with the SITE model simulations is likely associated with discrepancies between the model’s results and the observed values, as reported by [34,35]. Although these studies were conducted in different environments, they revealed a consistent pattern in the SITE simulations: an overestimation of LE and an underestimation of H. Additionally, ref. [32] also noted that, in general, the SITE model overestimates Rn and underestimates G, which theoretically implies a higher available energy compared to observed values.
Studies indicate that in the Caatinga, the majority of available energy is converted into sensible heat flux during the dry season, and the partitioning of energy flux is directly associated with vegetation characteristics and changes in land use [10,19,23]. In fact, the SITE model struggles to represent the variability of latent heat (LE) and sensible heat (H) throughout the day, likely due to the model’s failure to account for daily changes in certain environmental parameters such as soil moisture fraction and diurnal variations in the stomatal opening and closure of plants.
In relation to LE and H, Table 2 shows a condition of nearly constant water deficiency in the region, as H consistently surpasses LE, even during the comparatively wetter year of 2009. This behavior of LE and H in the Caatinga has been previously investigated and discussed in the scientific literature [10,19,22].
Table 2 also clearly shows the influence of rainfall on the seasonality of the energy balance components and their partitions. During the wet season, the portion of Rn converted to LE is nearly 60% higher compared to the dry season. On the other hand, the portion of Rn converted to H during the dry season is almost twofold higher than in the wet season. The role of rainfall is also illustrated in the interannual relationship. In 2009, a year characterized by higher rainfall, H was almost 50% higher than LE on an annual basis. Similarly, in 2012, H exceeded LE with a difference of more than 100%. The portion of Rn converted to LE was more than 25% in 2009 and 20% in 2012. In contrast, the portion of Rn converted to H was slightly above 35% in 2009 while it reached nearly 50% in 2012. These seasonal and interannual variations in the values of the energy balance components and their respective partitions have also been widely reported in the literature within tropical and/or semiarid environments [10,22,39].
In relation to G, results indicate that the mean annual value was higher in 2009 compared to the value simulated in 2012. This difference is likely attributed to more intense rainfall, which interfered with the temperature differences between the atmosphere and the soil, as well as runoff. These factors are important parameters for quantifying G in the model, as they represent energy loss from the soil to the atmosphere. Despite these differences, their absolute values did not affect the difference between available energy (Rn–G) for both years, since the difference was similar to those observed in the Rn values. This implies that, in terms of energy availability, both years were practically equal.
The absence of rainfall during the dry season in the Caatinga can lead to changes in the energy balance, causing an increase in H fluxes and a decrease in LE fluxes. These changes modify the turbulent exchanges of heat and moisture that occur between the surface and the atmosphere [54,55,56].
When comparing LE between seasons, it was observed that the averages with greater amplitudes occurred during the wet season, reaching almost 60 Wm−2. In contrast, during the dry season, these values remained below 40 Wm−2 throughout the year 2009. The lower LE rates observed in the dry season can be attributed to reduced water availability for plants, resulting from lower rainfall rates [10,57,58]. Table 2 shows that, in most cases, the residual values are higher than the fluxes.
Regarding the behavior of H, substantially higher values were observed during the dry season (88.8 Wm−2 in 2009 and 117.8 Wm−2 in 2012) compared to the wet season (41.8 Wm−2 in 2009 and 53.6 Wm−2 in 2012). It is noteworthy that H values during the year of intense drought surpassed those observed during the year of intense rainfall. This distinction is due to the influence of biomass in regulating the energy exchanges between the atmosphere and the surface in the Caatinga. The ecosystem experiences alternating periods of high and low biomass, which are entirely controlled by rainfall [20,59].
Another noteworthy result shown in Table 2 refers to the residual of the energy balance, R, which accounted for 40% of Rn in 2009 and approximately 30% of Rn in 2012. In other observational studies, this residual is approximately 25% [10,19]. Energy balance calculations in tropical forests have exhibited higher residues, with values fluctuating between 16% and 25% [8]; in FLUXNET towers, the range is wider, ranging from 4% to 36% [60]. The SITE model has consistently demonstrated a tendency to underestimate H values, particularly during the dry season, as reported by [32] in the Caatinga and [34] in the Amazon.
Caatinga plants close their stomata in response to low water availability, which effectively reduces water transfer to the atmosphere, resulting in decreased evapotranspiration. Consequently, the energy consumption required to heat the air (H) increases [61]. According to the literature, the annual proportion of Rn converted into H in the Caatinga varies from approximately 40% to 60% [10,19,22]. Similar ranges of values have also been observed by [62] in the semiarid region of the Loess Plateau in China and by [61] in the Mongolian Plateau. In the present study, this percentage was less than 40% during the dry season in both years, indicating values lower than those reported in the literature. This finding strongly suggests that the SITE model tends to underestimate H.
According to [56], the characteristics of Caatinga vegetation directly influence the daily cycle of thermohygrometric variables and the variables that compose the energy balance. In addition, atmospheric conditions also play a decisive role in the variations of H and LE values at different times of the year in the Caatinga.

CO2 Balance

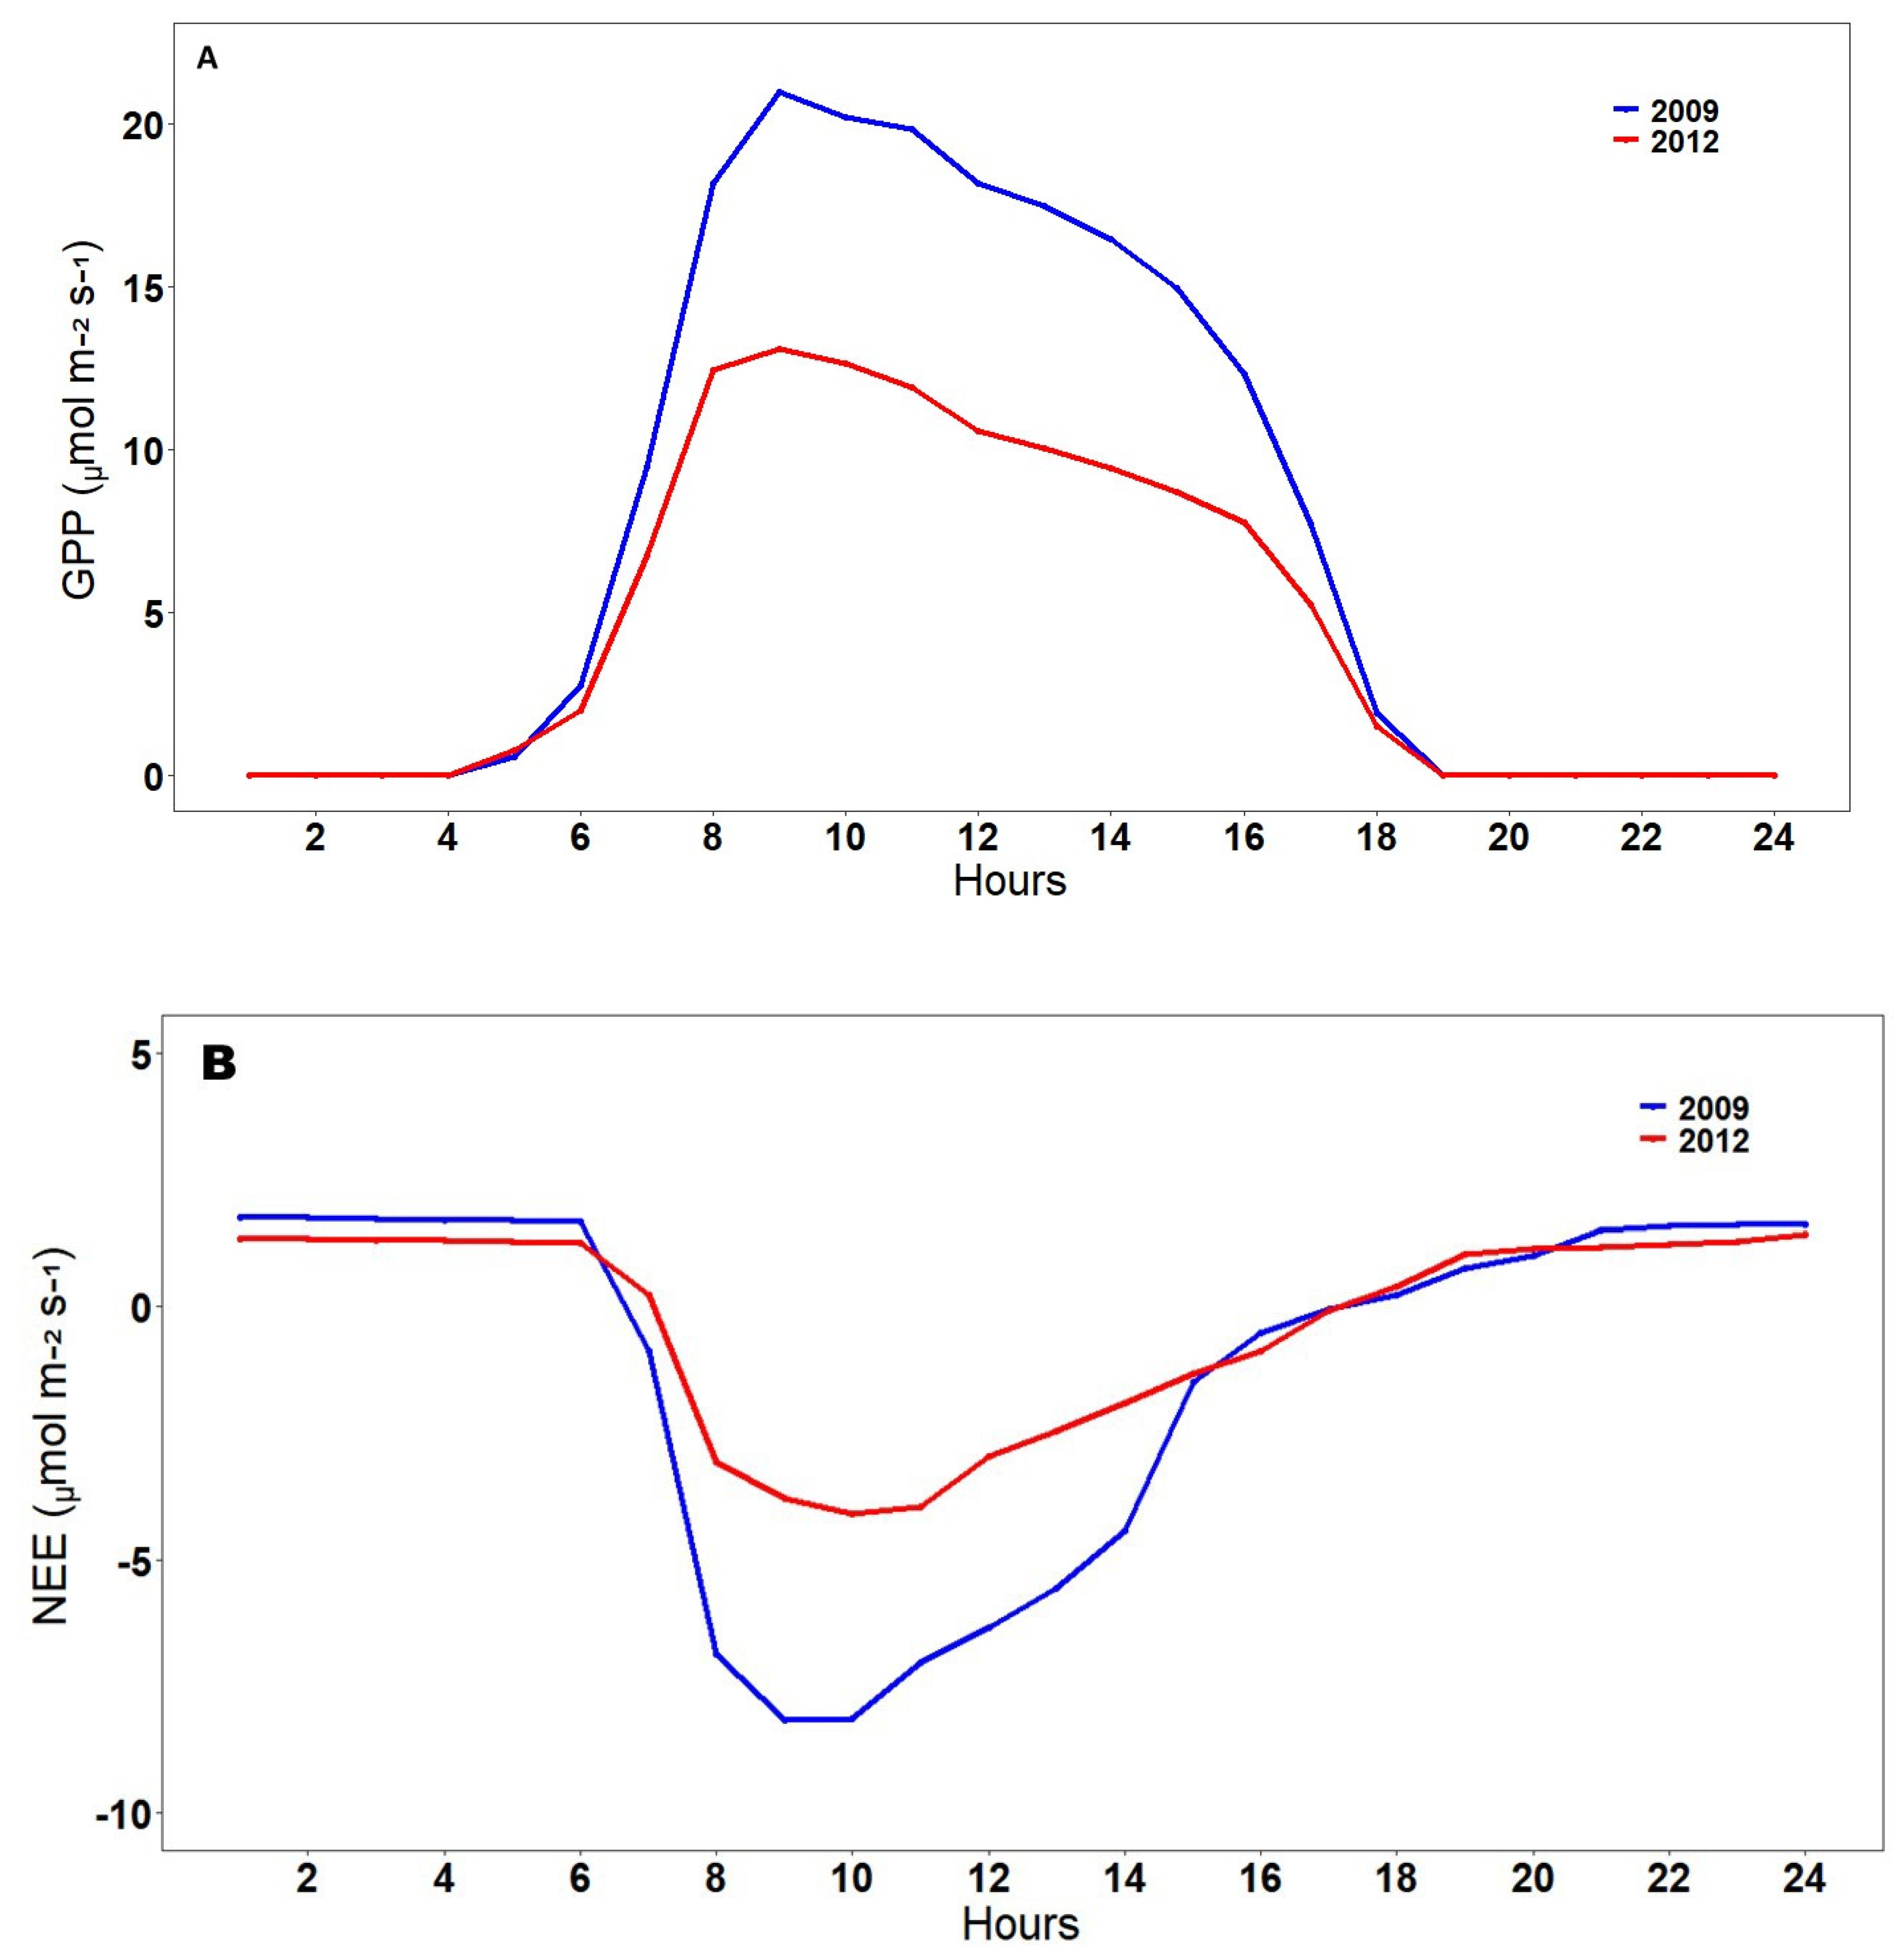
The hourly averages of GPP and NEE simulated by the SITE model for the years 2009 and 2012 are presented in Figure 6, illustrating the observed effect of rainfall on both variables. The maximum daily mean gross CO2 fixation (GPP) during 2009 was approximately 64% higher than in 2012. On the other hand, the maximum daily average net fixation was almost three times higher than the corresponding value in 2009.
Figure 6 also shows that maximum assimilation of CO2 (both gross and net) occurred between 09:00 h and 10:00 h local time, which corresponds to the period of stomatal opening in Caatinga species as reported by [20]. This coincides with the time of day when maximum CO2 assimilation rates are observed. Maximum stomatal opening suggests that the SITE model satisfactorily represents the physiological mechanisms of Caatinga plants regarding CO2 exchange. Nevertheless, in some experimental studies conducted in the region, the agreement between periods of maximum stomatal opening and maximum assimilation of CO2 was not observed. Instead, the maximum assimilation (both gross and net) coincided with the peak availability of radiation [21,39]. These studies suggest that, besides plant physiological mechanisms, meteorological variables, especially VPD and solar radiation, exert significant influences [20,21].
Maximum NEE values were −8 µmol m−2 s−1 in the wetter year (2009) and −4 µmol m−2 s−1 in the dry year (2012). The maximum hourly NEE values in our study are similar to those reported by [4,19,21] in fragments of preserved Caatinga and by [63] in China’s typical forests [64] in a savanna forest in southeastern Brazil. Ecophysiological studies indicate that CO2 assimilation can be influenced by the diurnal cycle [65] of air temperature, RH and VPD. In this study, the decline in GPP and NEE after noon can be attributed to the increase in air and soil temperature [21]. Thus, it can be argued that the coupling of the physiological mechanisms of Caatinga plants to the diurnal cycles of environmental factors is crucial for determining CO2 fluxes in the biome.
A typical diurnal pattern was observed in all seasons, where GPP and NEE increased shortly after dawn, reaching their maximum values between 09:00 h and 10:00 h, and subsequently declining after noon to reach the lowest values (near zero) in the late afternoon. This positive behavior of GPP can be attributed to the absorption process associated with photosynthesis. The positive values of CO2 flux and NEE during the night indicate that the ecosystem is releasing CO2.
CO2 fluxes and GPP were higher in 2009. By analyzing the hourly cycle of NEE, one can observe that the ecosystem absorbs CO2 (negative values) during the day and emits CO2 (positive values) during the nighttime, while also responding to rainfall patterns. GPP showed high values until July, corresponding to the peaks of observed rainfall. GPP values decreased later on with the progression of the dry season, reaching their lowest values in November, indicating that water availability largely influences GPP patterns and the conditions for CO2 capture.
The mean diurnal value (06:00 h–17:00 h) of NEE was −3.98 µmol m−2 s−1 in 2009 and −1.91 µmol m−2 s−1 in 2012. The nocturnal values (05:00 h–24:00 h) were 1.42 µmol m−2 s−1 in 2009 and 1.19 µmol m−2 s−1 in 2012. These results indicate minimal variability in CO2 emissions to the atmosphere during the night. During the day, there was a predominant uptake of CO2 with a maximum peak observed at 10:00 h in both years. The values of this peak were −8.14 µmol m−2 s−1 in 2009 and −4.09 µmol m−2 s−1 in 2012, showing a remarkable variability between the two years. This finding is consistent with the expected pattern of lower NEE variability at night and higher variability during the daytime.
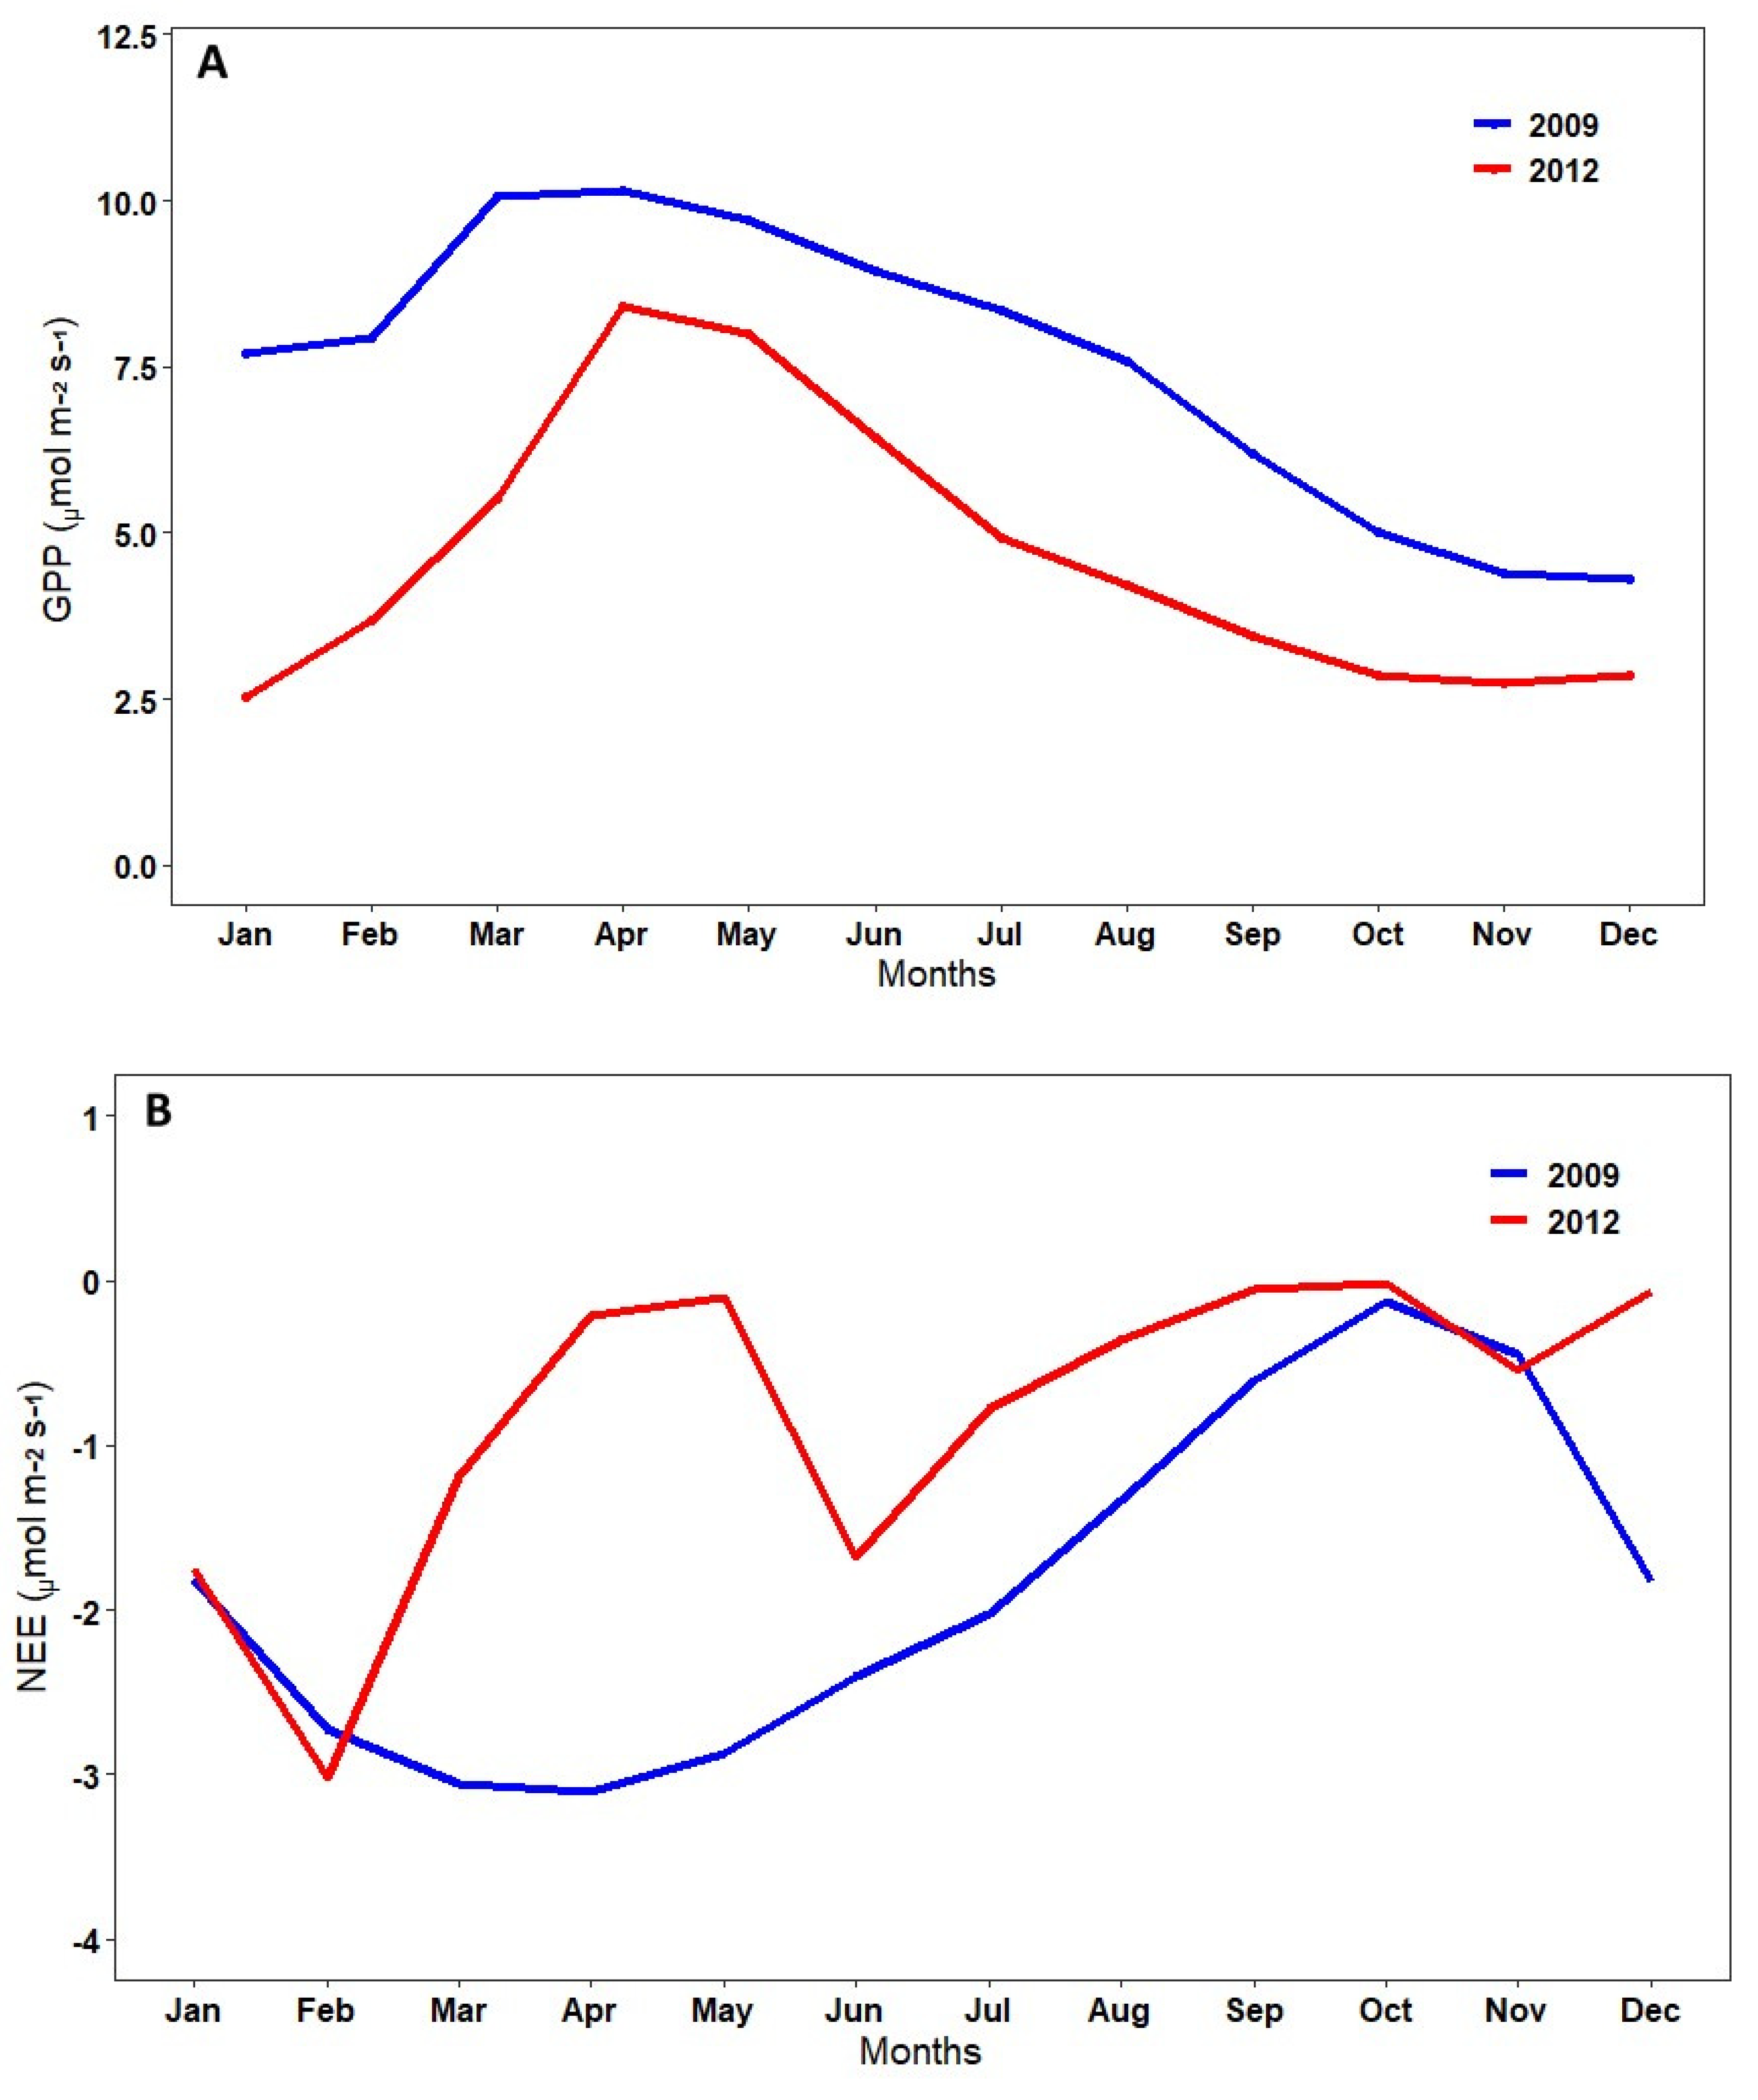
Figure 7 shows the mean monthly values of GPP and NEE in 2009 and 2012, respectively, evidencing the existence of distinct seasonal variability. The annual mean GPP varied from 7.52 µmol m−2 s−1 in 2009 to 4.62 µmol m−2 s−1 in 2012, showing an increase at the onset of the wet season, especially in April. The annual average NEE was −1.86 µmol m−2 s−1 in 2009 and −0.81 µmol m−2 s−1 in 2012. With the onset of the dry season in May, the GPP reduced in magnitude. In 2009, GPP values were higher compared to 2012. The monthly variation of GPP in the study area was influenced by the seasonality of rainfall.
This behavior of GPP has been reported by [56], who explains that it is attributed to the response of Caatinga plants’ phenological dynamics to the increased availability of water for leaf development. Thus, a more robust leaf area enhances the capacity for light absorption and the photosynthetic uptake of CO2, leading to higher vegetation productivity, as previously shown by [66].
Figure 8 shows the relationships between the monthly values of the CO2 balance components (GPP, NEE and NEP) and rainfall. According to [67], NEP is the net production of the ecosystem, which accounts for the net primary production minus carbon losses due to heterotrophic respiration. NEP is essentially the diurnal NEE, reflecting carbon uptake during the day. It is calculated from 08:00 h to 16:00 h, resulting in negative values.
It is possible to observe that during the wettest year (2009), the saturation of GPP, NEE, and NEP occurred at approximately 300 mm of monthly rainfall, followed by a subsequent stabilization of the fitted curve. On the other hand, the fitted curve in 2012 was almost linear, without reaching saturation for GPP, NEE, or NEP due to the low rainfall rates.
The variation in CO2 flux was significantly adjusted with rainfall during the wet season (R2 = 0.488) for GPP, NEE (R2 = 0.761), and NEP (R2 = 0.701). In extreme drought conditions, the coefficients of determination were also significant for GPP (R2 = 0.750), NEE (R2 = 0.912), and NEP (R2 = 0.722). Therefore, rainfall has exerted a significant influence on the behavior of the CO2 flux components.

5. Conclusions

In summary, the SITE model satisfactorily reproduced the seasonal variability of both energy and carbon balance. This is a pioneering study on the analysis of CO2 exchange under conditions of extreme drought (2012 with 198.2 mm) and heavy rainfall (2009 with 1019.6 mm) in relation to the climatology (758.0 mm). It reveals the impacts of contrasting precipitation years on the intra- and interannual variability of energy fluxes and CO2 fluxes in the Caatinga biome. In general, the results showed the relationship between rainfall seasonality, energy balance partitioning, and the dynamics of the CO2 balance in the Caatinga. The annual mean GPP varied from 7.52 µmol m−2 s−1 in 2009 to 4.62 µmol m−2 s−1 in 2012, and the NEE was 57% higher in the wettest year (2009) compared to the extremely dry year (2012) due to surface water scarcity.
H and LE exhibited significant differences between the studied years, even during the dry and wet seasons, with H consistently higher regardless of the time of year. Even in the year with above-average rainfall, H remained higher than LE. However, this predominance is likely associated with the tendency of the SITE model to underestimate fluxes, mainly due to the model’s limitation in capturing LE peaks during periods of extreme drought. On the other hand, net radiation showed seasonality linked to variations in solar radiation, which was similar in the years 2009 and 2012. The direct influence of rainfall on CO2 exchanges is shown through the strong relation (R2 > 0.48) observed in the regression analyses between GPP, NEE, NEP, and rainfall.
The monthly values of the CO2 balance components exhibit an asymptotic relationship with rainfall during the wet season, stabilizing after a monthly rainfall threshold of 300 mm. GPP, NEE, and Reco are directly influenced by the occurrence of rainfall in the Caatinga biome. In the year with high rainfall values (2009), the release of CO2 to the atmosphere was reduced. On the other hand, in the year with low rainfall values (2012), the peaks of carbon uptake were lower, but this was offset by a reduction in Reco. Nevertheless, the Caatinga biome continued to act as a sink for CO2 even during the year of extreme drought.
Given the importance of terrestrial carbon sinks to the global climate, attention is needed to create and strengthen policies to mitigate greenhouse gas emissions and to restore and protect seasonally dry tropical forests.

Author Contributions

Conceptualization, K.R.M., A.M.S.M., C.M.S.e.S. and B.G.B.; methodology, K.R.M., A.M.S.M., B.G.B. and C.M.S.e.S.; validation, K.R.M., A.M.S.M., C.M.S.e.S., B.G.B., P.R.M., P.E.S.O., D.T.R., G.B.C., R.R.F., A.C.N.d.S., L.F.M., J.R.S.L., A.C.D.A. and R.S.C.M.; formal analysis, K.R.M., A.M.S.M., C.M.S.e.S., B.G.B., P.R.M., P.E.S.O., D.T.R. and G.B.C.; writing—original draft preparation, K.R.M., A.M.S.M. and B.G.B.; writing—review and editing, K.R.M., A.M.S.M., C.M.S.e.S., B.G.B., P.R.M., P.E.S.O., D.T.R. and G.B.C.; visualization, K.R.M., A.M.S.M., C.M.S.e.S., B.G.B., P.R.M., P.E.S.O., D.T.R., G.B.C., R.R.F., A.C.N.d.S., L.F.M., J.R.S.L., A.C.D.A. and R.S.C.M. All authors have read and agreed to the published version of the manuscript.

Funding

This research was funded by National Council for Scientific and Technological Development (CNPq) grant number 420854/2018-5 and for the productivity grant conceded to the authors C.M.S.e.S. and B.G.B. (grant nº 310781/2020-5 and 314257/2021-7, respectively), and to FUNPEC/UFRN for financial support (Project nº 372022). To National Council for Scientific and Technological Development (CNPq) for the research productivity grant of the author C.M.S.e.S. (Process nº 303802/2017-0) and the financial support in the NOWCDCB project: National Observatory of Water and Carbon Dynamics in the Caatinga Biome (INCT-MCTI/CNPq/CAPES/FAPs 16/2014, grant: 465764/2014-2 and MCTI/CNPq Nº 28/2018, grant 420854/2018-5).

Institutional Review Board Statement

Not applicable.

Informed Consent Statement

Not applicable.

Data Availability Statement

Not applicable.

Acknowledgments

The authors are thankful to the Brazilian National Institute of Semi-Arid (INSA) for funding the project which originated the EC data used in this study. We are also thankful to ICMBio (Chico Mendes Institute for Biodiversity Conservation) for providing access to the experimental site and to ESEC-Seridó (Ecological Station of Seridó) for supporting experimental activities.

Conflicts of Interest

The authors declare no conflict of interest.

References

  1. Le Quéré, C.; Peters, G.P.; Andres, R.J.; Andrew, R.M.; Boden, T.A.; Ciais, P.; Friedlingstein, P.; Houghton, R.A.; Marland, G.; Moriarty, R.; et al. Global carbon budget 2013. Earth Syst. Sci. Data 2014, 6, 235–263. [Google Scholar] [CrossRef] [Green Version]
  2. Ahlström, A.; Raupach, M.R.; Schurgers, G.; Smith, B.; Arneth, A.; Jung, M.; Reichstein, M.; Canadell, J.G.; Friedlingstein, P.; Jain, A.K.; et al. The dominant role of semi-arid ecosystems in the trend and variability of the land CO2 sink. Science 2015, 348, 895–899. [Google Scholar] [CrossRef] [Green Version]
  3. Araujo, K.D.; Dantas, R.T.; Andrade, A.P.D.; Parente, H.N. Cinética de Evolução de Dióxido de Carbono em Área de Caatinga em São João do Cariri-PB. Rev. Arvore 2011, 35, 1099–1106. [Google Scholar] [CrossRef] [Green Version]
  4. Costa, G.B.; Mendes, K.R.; Viana, L.B.; Almeida, G.V.; Mutti, P.R.; Silva, C.M.S.e.; Bezerra, B.G.; Marques, T.V.; Ferreira, R.R.; Oliveira, C.P.; et al. Seasonal Ecosystem Productivity in a Seasonally Dry Tropical Forest (Caatinga) Using Flux Tower Measurements and Remote Sensing Data. Remote Sens. 2022, 14, 3955. [Google Scholar] [CrossRef]
  5. Marengo, J.A.; Souza, C.M.; Thonicke, K.; Burton, C.; Halladay, K.; Betts, R.A.; Alves, L.M.; Soares, W.R. Changes in Climate and Land Use Over the Amazon Region: Current and Future Variability and Trends. Front. Earth Sci. 2018, 6, 228. [Google Scholar] [CrossRef]
  6. Le Quéré, C.; Raupach, M.R.; Canadell, J.G.; Marland, G.; Bopp, L.; Ciais, P.; Conway, T.J.; Doney, S.C.; Feely, R.A.; Foster, P.; et al. Trends in the sources and sinks of carbon dioxide. Nat. Geosci. 2009, 2, 831–836. [Google Scholar] [CrossRef] [Green Version]
  7. Masson-Delmotte, V.; Zhai, P.; Pirani, A.; Connors, S.L.; Péan, C.; Chen, Y.; Berger, S.; Huang, M.; Yelekçi, O.; Yu, R.; et al. Climate change 2021: The physical science basis. In Contribution of Working Group I to the Sixth Assessment Report of the Intergovernmental Panel on Climate Change; IPCC: Geneva, Switzerland, 2021. [Google Scholar]
  8. Araújo, A.C.; Nobre, A.D.; Kruijt, B.; Elbers, J.A.; Dallarosa, R.; Stefani, P.; Randow, C.; von Manzi, A.O.; Culf, A.D.; Gash, J.H.C.; et al. Comparative measurements of carbon dioxide fluxes from two nearby towers in a centralAmazonian rainforest: The Manaus LBA site. J. Geophys. Res. 2002, 107, 8090. [Google Scholar] [CrossRef] [Green Version]
  9. Malhi, Y.; Aragão, L.E.O.C.; Metcalfe, D.B.; Paiva, R.; Quesada, C.A.; Almeida, S.; Anderson, L.; Brando, P.; Chambers, J.Q.; Costa, A.C.L.; et al. Comprehensive assessment of carbon productivity, allocation and storage in three Amazonian forests. Glob. Chang. Biol. 2009, 15, 1255–1274. [Google Scholar] [CrossRef]
  10. Campos, S.; Mendes, K.R.; da Silva, L.L.; Mutti, P.R.; Medeiros, S.S.; Amorim, L.B.; Santos, C.A.; Perez-Marin, A.M.; Ramos, T.M.; Marques, T.V.; et al. Closure and partitioning of the energy balance in a preserved area of a Brazilian seasonally dry tropical forest. Agric. For. Meteorol. 2019, 271, 398–412. [Google Scholar] [CrossRef]
  11. Feng, X.; Porporato, A.; Rodriguez-Iturbe, I. Changes in rainfall seasonality in the tropics. Nat. Clim. Change 2013, 3, 811. [Google Scholar] [CrossRef]
  12. Chadwick, R.; Good, P.; Martin, G.; Rowell, D.P. Large rainfall changes consistently projected over substantial areas of tropical land Nat. Clim. Change 2016, 6, 177. [Google Scholar]
  13. Brito, S.S.B.; Cunha, A.P.M.A.; Cunningham, C.C.; Alvalá, R.C.; Marengo, J.A.; Carvalho, M.A. Frequency, duration and severity of drought in the Semiarid Northeast Brazil region. Int. J. Climatol. 2018, 38, 517–529. [Google Scholar] [CrossRef]
  14. Fernández-Martínez, M.; Vicca, S.; Janssens, I.A.; Luyssaert, S.; Campioli, M.; Sardans, J.; Estiarte, M.; Peñuelas, J. Spatial variability and controls over biomass stocks, carbon fluxes, and resource-use efficiencies across forest ecosystems. Trees 2014, 28, 597–611. [Google Scholar] [CrossRef]
  15. Koch, R.; Almeida-Cortez, J.S.; Kleinschmit, B. Revealing areas of high nature conservation importance in a seasonally dry tropical forest in Brazil: Combination of modelled plant diversity hot spots and threat patterns. J. Nat. Conserv. 2017, 35, 24–39. [Google Scholar] [CrossRef]
  16. Särkinen, T.; Iganci, J.R.; Linares-Palomino, R.; Simon, M.F.; E Prado, D. Forgotten forests—Issues and prospects in biome mapping using Seasonally Dry Tropical Forests as a case study. BMC Ecol. 2011, 11, 27. [Google Scholar] [CrossRef] [Green Version]
  17. Dombroski, J.L.D.; Praxedes, S.; de Freitas, R.; Pontes, F. Water relations of Caatinga trees in the dry season. S. Afr. J. Bot. 2011, 77, 430–434. [Google Scholar] [CrossRef] [Green Version]
  18. Mutti, P.R.; da Silva, L.L.; Medeiros, S.D.S.; Dubreuil, V.; Mendes, K.R.; Marques, T.V.; Lúcio, P.S.; Silva, C.M.S.; Bezerra, B.G. Basin scale rainfall-evapotranspiration dynamics in a tropical semiarid environment during dry and wet years. Int. J. Appl. Earth Obs. Geoinform. 2019, 75, 29–43. [Google Scholar] [CrossRef]
  19. Silva, P.F.; de Sousa Lima, J.R.; Antonino, A.C.D.; Souza, R.; de Souza, E.S.; Silva, J.R.I.; Alves, E.M. Seasonal patterns of carbon dioxide, water and energy fluxes over the Caatinga and grassland in the semi-arid region of Brazil. J. Arid. Environ. 2017, 147, 71–82. [Google Scholar] [CrossRef]
  20. Marques, T.V.; Mendes, K.; Mutti, P.; Medeiros, S.; Silva, L.; Perez-Marin, A.M.; Campos, S.; Lúcio, P.S.; Lima, K.; dos Reis, J.; et al. Environmental and biophysical controls of evapotranspiration from Seasonally Dry Tropical Forests (Caatinga) in the Brazilian Semiarid. Agric. For. Meteorol. 2020, 287, 107957. [Google Scholar] [CrossRef]
  21. Mendes, K.R.; Campos, S.; da Silva, L.L.; Mutti, P.R.; Ferreira, R.R.; Medeiros, S.S.; Perez-Marin, A.M.; Marques, T.V.; Ramos, T.M.; Vieira, M.M.D.L.; et al. Seasonal variation in net ecosystem CO2 exchange of a Brazilian seasonally dry tropical forest. Sci. Rep. 2020, 10, 9454. [Google Scholar] [CrossRef]
  22. Borges, C.K.; Dos Santos, C.A.C.; Carneiro, R.G.; Da Silva, L.L.; De Oliveira, G.; Mariano, D.; Silva, M.T.; Da Silva, B.B.; Bezerra, B.G.; Perez-Marin, A.M.; et al. Seasonal variation of surface radiation and energy balances over two contrasting areas of the seasonally dry tropical forest (Caatinga) in the Brazilian semi-arid. Environ. Monit. Assess. 2020, 192, 524. [Google Scholar] [CrossRef]
  23. Silva, A.C.; Rêgo Mendes, K.; Santos E Silva, C.M.; Torres Rodrigues, D.; Brito Costa, G.; Thainara Corrêa Da Silva, D.; Rodrigues Mutti, P.; Rodrigues Ferreira, R.; Guedes Bezerra, B. Energy Balance, CO2 Balance, and Meteorological Aspects of Desertification Hotspots in Northeast Brazil. Water 2021, 13, 2962. [Google Scholar] [CrossRef]
  24. Mu, Q.; Zhao, M.; Running, S.W. Improvements to a MODIS global terrestrial evapotranspiration algorithm. Remote Sens. Environ. 2011, 115, 1781–1800. [Google Scholar] [CrossRef]
  25. Huang, S.; Li, H.; Wang, M.; Qian, Y.; Steenland, K.; Caudle, W.M.; Liu, Y.; Sarnat, J.; Papatheodorou, S.; Shi, L. Long-term exposure to nitrogen dioxide and mortality: A systematic review and meta-analysis. Sci. Total Environ. 2021, 776, 145968. [Google Scholar] [CrossRef]
  26. Cunha, A.P.M.A.; Alvalá, R.C.; Sampaio, G.; Shimizu, M.H.; Costa, M.H. Calibration and Validation of the Integrated Biosphere Simulator (IBIS) for a Brazilian Semiarid Region. J. Appl. Meteorol. Climatol. 2013, 52, 2753–2770. [Google Scholar] [CrossRef]
  27. Jaeger, E.B.; Stöckli, R.; Seneviratne, S.I. Analysis of planetary boundary layer fluxes and land–atmosphere coupling in the regional climate model CLM. J. Geophys. Res. 2009, 114, D17106. [Google Scholar] [CrossRef] [Green Version]
  28. Pilotto, I.L.; Rodríguez, D.A.; Tomasella, J.; Sampaio, G.; Chou, S.C. Comparisons of the Noah-MP land surface model simulations with measurements of forest and crop sites in Amazonia. Meteorol. Atmos. Phys. 2015, 127, 711–723. [Google Scholar] [CrossRef]
  29. Manoli, G.; Ivanov, V.Y.; Fatichi, S. Dry-Season Greening andWater Stress in Amazonia: The Role of Modeling Leaf Phenology. J. Geophys. Res. Biogeosci. 2018, 123, 1909–1926. [Google Scholar] [CrossRef] [Green Version]
  30. Oliveira, M.L.; dos Santos, C.A.C.; Santos, F.A.C.; de Oliveira, G.; Santos, C.A.G.; Bezerra, U.A.; de B. L. Cunha, J.E.; da Silva, R.M. Evaluation of Water and Carbon Estimation Models in the Caatinga Biome Based on Remote Sensing. Forests 2023, 14, 828. [Google Scholar] [CrossRef]
  31. Andrade, N.L.R.D.; Aguiar, R.G.; Sanches, L.; Alves, É.C.R.D.F.; Nogueira, J.D.S. Partição do saldo de radiação em áreas de floresta amazônica e floresta de transição Amazônia—Cerrado. Rev. Bras. Meteorol. 2009, 24, 346–355. [Google Scholar] [CrossRef]
  32. Mendes, K.R.; Campos, S.; Mutti, P.R.; Ferreira, R.R.; Ramos, T.M.; Marques, T.V.; dos Reis, J.S.; Vieira, M.M.d.L.; Silva, A.C.N.; Marques, A.M.S.; et al. Assessment of site for CO2 and energy fluxes simulations in a seasonally dry tropical forest (Caatinga ecosystem). Forests 2021, 12, 86. [Google Scholar] [CrossRef]
  33. Vilani, M.T.; Pinheiro, M.; Alves, L.S.; de Andrade, N.L.R.; de Carvalho Alves, M.; de Souza Nogueira, J. Modelling net ecosystem CO2 exchange by simple tropical ecosystem model. J. Converg. Inf. Technol. 2010, 5, 11. [Google Scholar]
  34. Sanches, L.; de Andrade, N.L.R.; Costa, M.H.; Alves, M.d.C.; Gaio, D. Performance evaluation of the SITE model to estimate energy flux in a tropical semi-deciduous forest of the southern Amazon Basin. Int. J. Biometeorol. 2011, 55, 303–312. [Google Scholar] [CrossRef]
  35. Santos, S.N.M.; Costa, M.H. A simple tropical ecosystem modelo f carbon, water and energy fluxes. Ecol. Model. 2004, 176, 291–312. [Google Scholar] [CrossRef]
  36. Costa, C.A.G.; Lopes, J.W.B.; Pinheiro, E.A.R.; Araújo, J.C.; Gomes-Filho, R.R. Spatial behaviour of soil moisture in the root zone of the Caatinga biome. Rev. Ciência Agronômica 2013, 44, 685–694. [Google Scholar] [CrossRef] [Green Version]
  37. Queiroz, L.P.; Cardoso, D.; Fernandes, M.F.; Moro, M.F. Diversity and Evolution of Flowering Plants of the Caatinga Domain. In Caatinga: The Largest Tropical Dry Forest Region in South America; Da Silva, J.M.C., Leal, I.R., Tabarelli, M., Eds.; Springer: Cham, Switzerland, 2017; pp. 23–63. [Google Scholar]
  38. Jensen, R.; Herbst, M.; Fribog, T. Direct and indirect controls of the interanual variability in atmospheric CO2 exchange of three contrasting ecosystems in Denmark. Agric. For. Meteorol. 2017, 233, 12–31. [Google Scholar] [CrossRef]
  39. Bezerra, B.G.; e Silva, C.M.S.; Mendes, K.R.; Mutti, P.R.; Fernandes, L.S.; Marques, T.V.; Silva, C.L.C.; Campos, S.; de Lima Vieira, M.M.; Urbano, S.A.; et al. CO2 exchanges and evapotranspiration of a grazed pasture under tropical climate conditions. Agric. For. Meteorol. 2022, 323, 109088. [Google Scholar] [CrossRef]
  40. Reichstein, M.; Falge, E.; Baldocchi, D.; Papale, D.; Aubinet, M.; Berbigier, P.; Bernhofer, C.; Buchmann, N.; Gilmanov, T.; Granier, A.; et al. On the separation of net ecosystem exchange into assimilation and ecosystem respiration: Review and improved algorithm. Glob. Change Biol. 2005, 11, 1424–1439. [Google Scholar] [CrossRef]
  41. Lloyd, J.; Taylor, J.A. On the Temperature Dependence of Soil Respiration. Funct. Ecol. 1994, 8, 315–323. [Google Scholar] [CrossRef]
  42. Costa, M.H.; Nunes, E.L.; Senna, M.C.A.; Imbuzeiro, H.M.A. Estado-da-arte da simulação da taxa de fixação de carbono de ecossistemas tropicais. Rev. Bras. Meteorol. 2009, 24, 179–187. [Google Scholar] [CrossRef]
  43. Santos, M.G.; Oliveira, M.T.; Figueiredo, K.V.; Falcao, H.M.; Arruda, E.C.; Almeida-Cortez, J.; Sampaio, E.V.S.B.; Ometto, J.P.H.B.; Menezes, R.S.C.; Oliveira, A.F.M.; et al. Caatinga, the Brazilian dry tropical forest: Can it tolerate climate changes? Theor. Exp. Plant. Physiol. 2014, 26, 83–99. [Google Scholar] [CrossRef]
  44. Lima-Silva, P.S.L.; Cunha, T.M.S.; Souza, A.D.; de Paula, V.F.S. Equations for leaf area estimation in some species adapted to the Brazilian Semi-arid. Rev. Caatinga 2007, 20, 18–23. [Google Scholar]
  45. Mendes, K.R.; Granja, J.A.; Ometto, J.P.; Antonino, A.C.; Menezes, R.S.; Pereira, E.C.; Pompelli, M.F. Croton blanchetianus modulates its morphophysiological responses to tolerate drought in a tropical dry forest. Funct. Plant Biol. 2017, 10, 1–13. [Google Scholar] [CrossRef]
  46. Rezende, L.F.C.; Arenque-Musa, B.C.; Moura, M.D.; Aidar, S.D.T.; Von Randow, C.; Menezes, R.S.C.; Ometto, J.P.B.H. Calibration of the maximum carboxylation velocity (Vcmax) using data mining techniques and ecophysiological data from the Brazilian semiarid region, for use in Dynamic Global Vegetation Models. Braz. J. Biol. 2016, 76, 341–351. [Google Scholar] [CrossRef]
  47. Pagoto, M.A.; Roig, F.A.; Ribeiro, A.S.; Lisi, C.S. Influence of regional rainfall and Atlantic sea surface temperature on tree-ring growth of Poincianella pyramidalis, semiarid forest from Brazil. Dendrochronologia 2015, 35, 14–23. [Google Scholar] [CrossRef]
  48. R Core Team. R: A Language and Environment for Statistical Computing; R Foundation for Statistical Computing: Vienna, Austria, 2022; Available online: https://www.R-project.org/ (accessed on 1 August 2022).
  49. Monteiro, F. Correlações entre os ciclos solares e o regime pluviométrico na Região Geográfica Intermediária de Caicó/RN. Master’s Dissertation, Universidade Federal do Rio Grande do Norte, Natal, Brazil, 2020. [Google Scholar]
  50. Kaminsky, K.Z.; Dubayah, R. Estimation of surface net radiation in the boreal forest and northern prairie from shortwave flux measurements. J. Geophys. Res. Atmos. 1997, 102, 29707–29716. [Google Scholar] [CrossRef]
  51. Alados, I.; Foyo-Moreno, I.; Olmo, F.; Alados-Arboledas, L. Relationship between net radiation and solar radiation for semi-arid shrub-land. Agric. For. Meteorol. 2003, 116, 221–227. [Google Scholar] [CrossRef]
  52. Kuricheva, O.A.; Avilov, V.K.; Dinh, D.B.; Sandlersky, R.B.; Kuznetsov, A.N.; Kurbatova, J.A. Seasonality of energy and water fluxes in a tropical moist forest in Vietnam. Agric. For. Meteorol. 2021, 298–299, 108268. [Google Scholar] [CrossRef]
  53. Jin, Y.; Liu, Y.; Liu, J.; Zhang, X. Energy Balance Closure Problem over a Tropical Seasonal Rainforest in Xishuangbanna, Southwest China: Role of Latent Heat Flux. Water 2022, 14, 395. [Google Scholar] [CrossRef]
  54. Oliveira, M.B.L.; Santos, A.J.B.; Manzi, A.O.; Alvalá, R.C.d.S.; Correia, M.d.F.; de Moura, M.S.B. Trocas de energia e fluxo de carbono entre a vegetação de Caatinga e a atmosfera no Nordeste Brasileiro. Rev. Bras. Meteorol. 2006, 21, 378–386. [Google Scholar]
  55. Teixeira, A.H.D.C.; Bastiaanssen, W.G.; Ahmad, M.D.; Moura, M.D.; Bos, M.G. Analysis of energy fluxes and vegetation-atmosphere parameters in irrigated and natural ecosystems of semi-arid Brazil. J. Hydrol. 2008, 362, 110–127. [Google Scholar] [CrossRef] [Green Version]
  56. Souza, L.S.B.; Moura, M.S.B.; Sediyama, G.C.; Silva, T.G.F. Balanço de energia e controle biofísico da evapotranspiração na Caatinga em condições de seca intensa. Pesqui. Agropecuária Bras. 2015, 50, 627–636. [Google Scholar] [CrossRef] [Green Version]
  57. Galvão, J.A.D.C.; Fisch, G. Balanço de energia em áreas de floresta e de pastagem na Amazônia. Rev. Bras. Meteorol. 2000, 15, 25–37. [Google Scholar]
  58. Priante Filho, N.; Hayashi, M.M.S.; De Nogueira, J.S.; Campelo, J.H., Jr.; Nunes, P.C.; Sanches, L.; Couto, E.G.; Hoeger, W.; Raiter, F.; Trienweiler, J.L.; et al. Comparison of the mass and energy exchange of a pasture and a mature transitional tropical forest of the southern Amazon basin during the wet-dry season transition. Glob. Change Biol. 2004, 10, 863–876. [Google Scholar] [CrossRef]
  59. Schwinning, S.; Sala, O.E. Hierarchy of responses to resource pulses in arid and semi-arid ecosystems. Oecologia 2004, 141, 211–220. [Google Scholar] [CrossRef] [PubMed]
  60. Wilson, K.; Goldstein, A.; Falge, E.; Aubinet, M.; Baldocchi, D.; Berbigier, P.; Bernhofer, C.; Ceulemans, R.; Dolman, H.; Field, C.; et al. Energy balance closure at FLUXNET sites. Agric. For. Meteor. 2002, 113, 223–243. [Google Scholar] [CrossRef] [Green Version]
  61. Carvalho, H.F.S. Dinâmica dos fluxos de energia e água na caatinga e cana-de-açúcar irrigada no Semiárido brasileiro. Master’s Dissertation, Universidade Federal do Vale do São Francisco, Juazeiro, BA, Brazil, 2017. [Google Scholar]
  62. Yu, B.; Liu, G.; Liu, Q.; Wang, X.; Feng, J.; Huang, C. Soil moisture variations at different topographic domains and land use types in the semi-arid Loess Plateau, China. Catena 2018, 165, 125–132. [Google Scholar] [CrossRef]
  63. Chen, Z.; Yu, G.; Wang, Q. Magnitude, pattern and controls of carbon flux and carbon use efficiency in China’s typical forests. Glob. Planet. Change 2019, 172, 464–473. [Google Scholar] [CrossRef]
  64. Rocha, H.R.; Freitas, H.C.; Rosolem, R.; Juárez, R.I.; Tannus, R.N.; Ligo, M.A.; Cabral, O.M.R.; Dias, M.A.S. Measurements of CO2 exchange over a woodland savanna (Cerrado Sensu stricto) in southeast Brasil. Biota Neotrop. 2002, 2, 1–11. [Google Scholar] [CrossRef] [Green Version]
  65. Gitelson, A.A.; Gamon, J.A.; Solovchenko, A. Multiple drivers of seasonal change in PRI: Implications for photosynthesis 2. Stand level. Remote Sens. Environ. 2017, 190, 198–206. [Google Scholar] [CrossRef] [Green Version]
  66. Dalmolin, A.C.; de Almeida Lobo, F.; Vourlitis, G.; Silva, P.R.; Dalmagro, H.J.; Antunes, M.Z.; Ortíz, C.E.R. Is the dry season an important driver of phenology and growth for two Brazilian savanna tree species with contrasting leaf habits? Plant Ecol. Dordr. 2015, 216, 407–417. [Google Scholar] [CrossRef]
  67. Moreira, D.S. Simulação numérica do ciclo do carbono na Amazônia. Ph.D. Thesis, Instituto Nacional de Pesquisas Espaciais, São José dos Campos, Brazil, 2013. [Google Scholar]
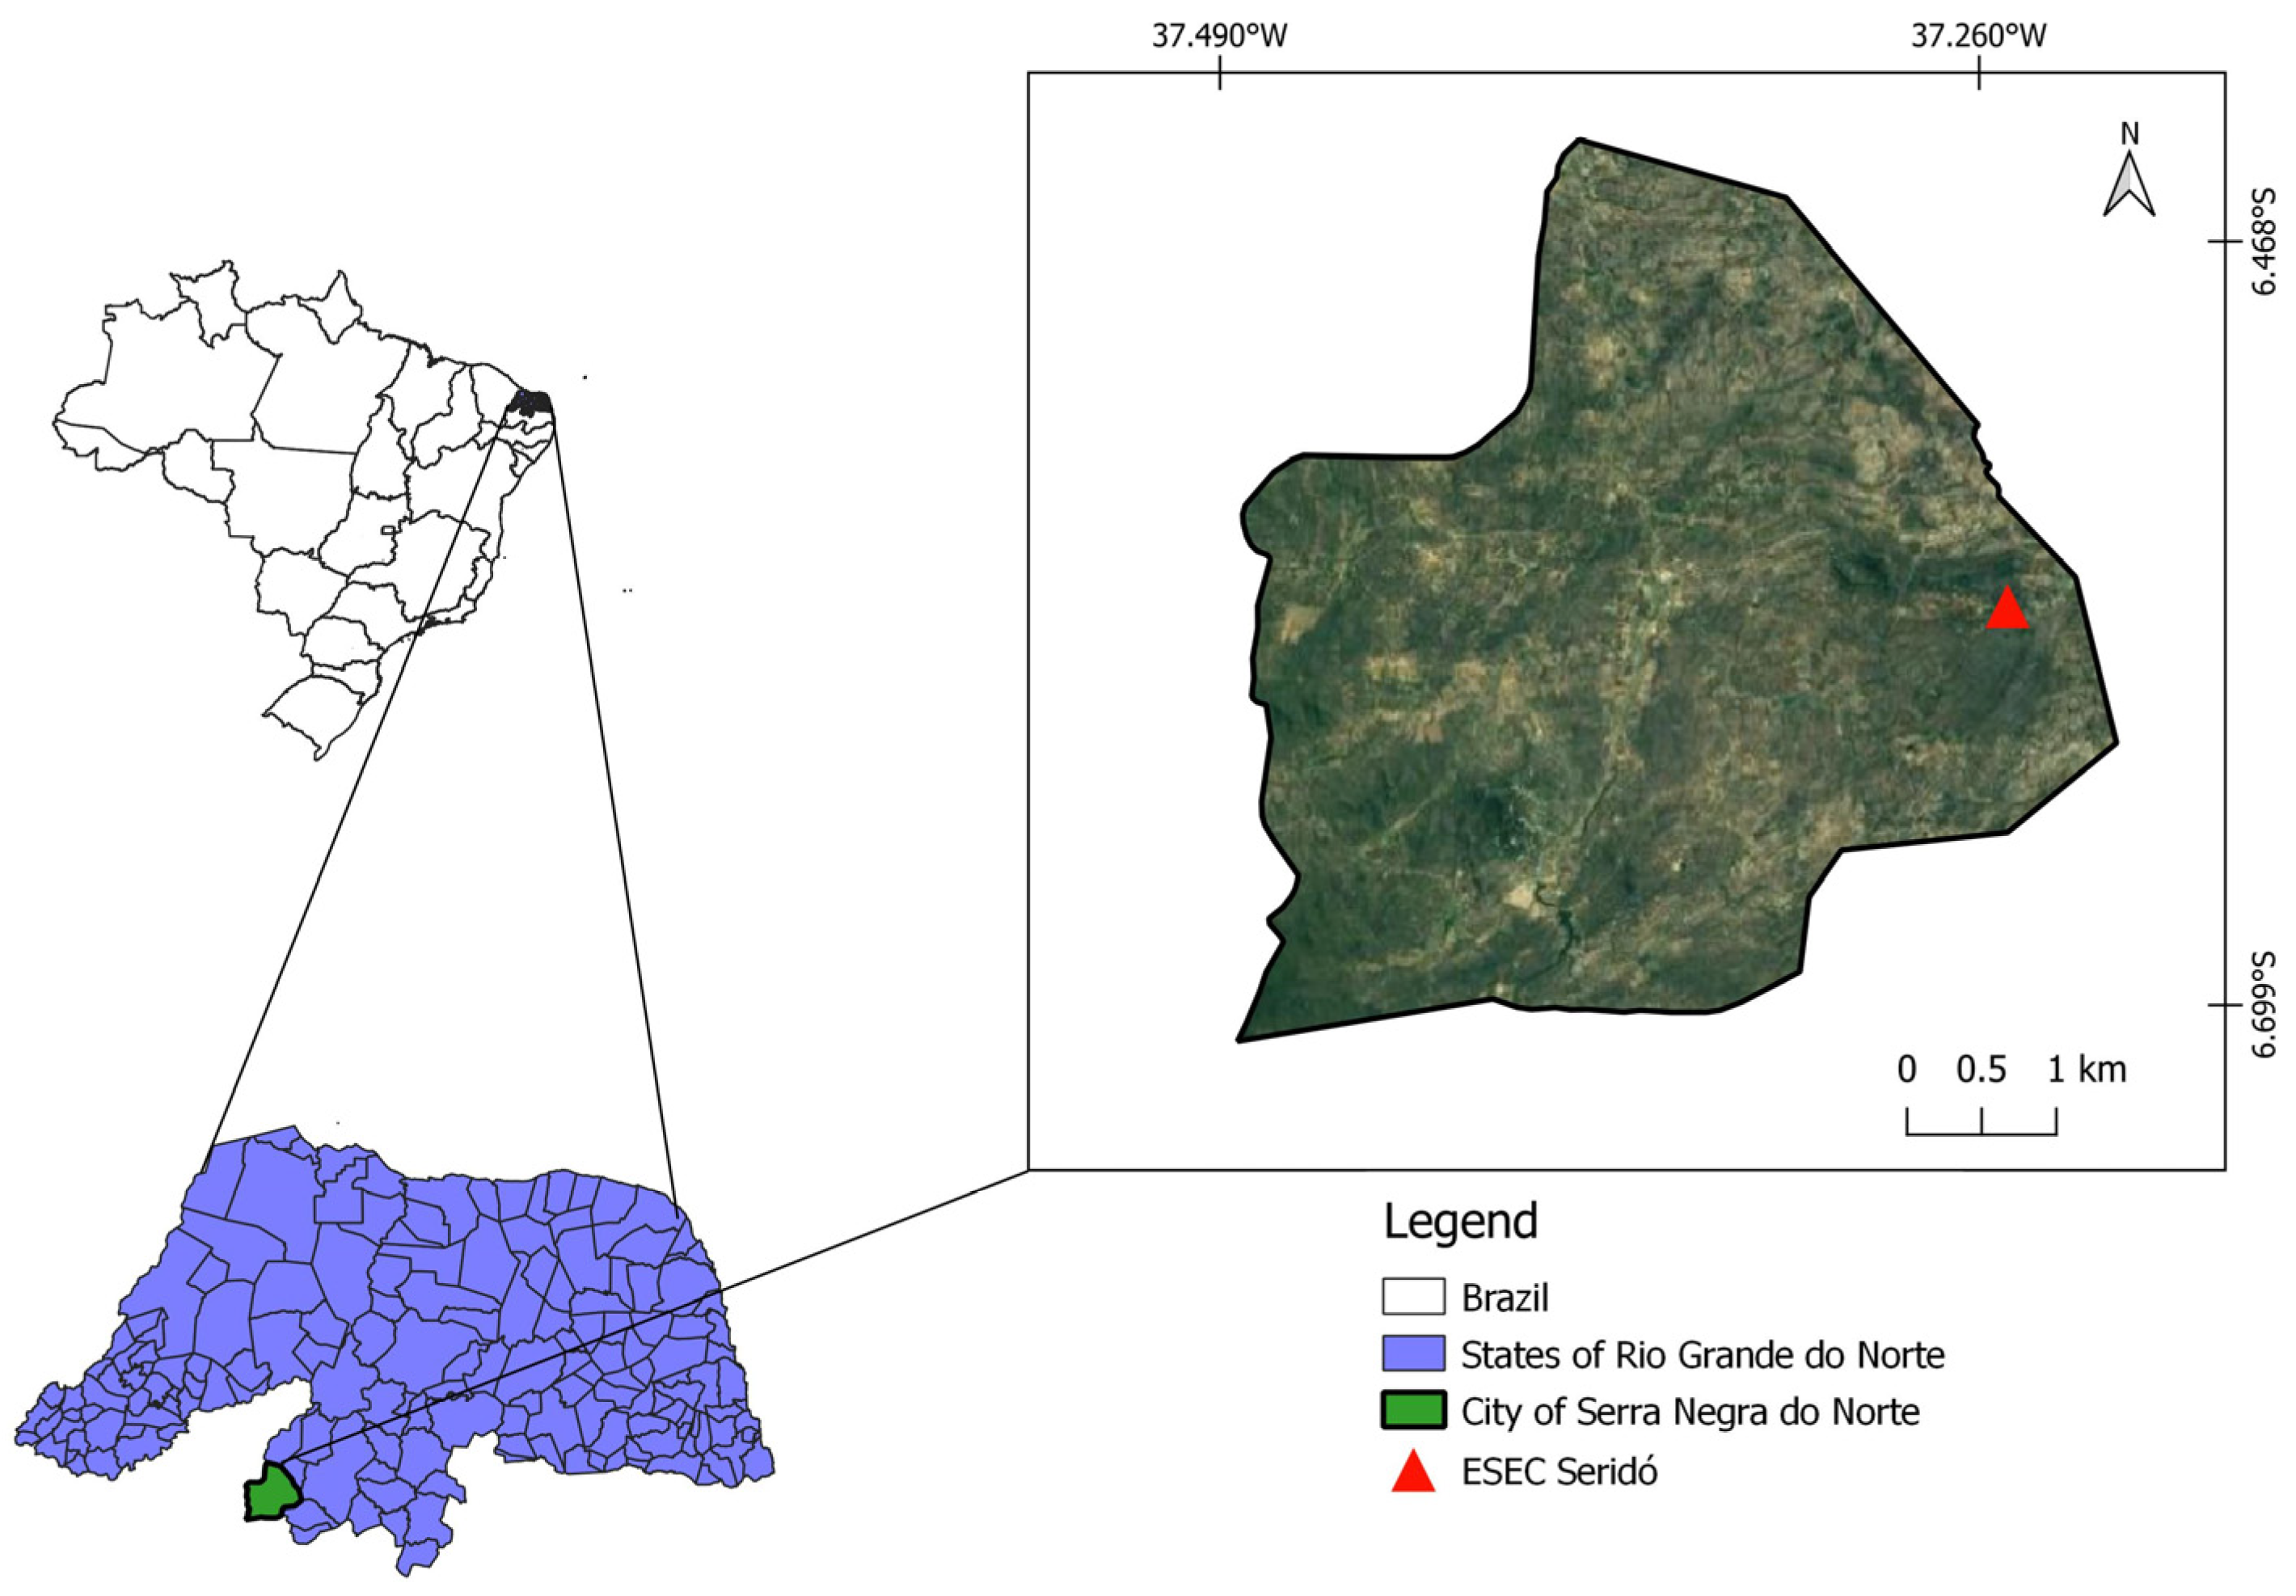
Figure 1. Geographical location of the micrometeorological tower installed in the ESEC-Seridó, Brazil.
Sustainability 15 10085 g001
Figure 2. Average monthly rainfall (mm) observed during the years 2009 and 2012 in Seridó-RN.
Sustainability 15 10085 g002
Figure 3. Annual mean hourly cycle of global solar radiation (Wm−2) observed during the years 2009 and 2012 in Seridó-RN.
Sustainability 15 10085 g003
Figure 4. Hourly cycle of mean air temperature (°C) observed during the years 2009 and 2012 in Seridó-RN.
Sustainability 15 10085 g004
Figure 5. Hourly cycle of the energy balance components (Wm−2) simulated during the years 2009 (A) and 2012 (B).
Sustainability 15 10085 g005
Figure 6. Hourly cycle of GPP (A) and NEE (B) simulated during the years 2009 and 2012.
Sustainability 15 10085 g006
Figure 7. Monthly average of GPP (A) and NEE (B) simulated during the years 2009 and 2012.
Sustainability 15 10085 g007
Figure 8. Regression analysis of simulated CO2 flux components with monthly accumulated rainfall during the years 2009 (blue) and 2012 (red). Equations: (A) GPP 2009 = 6.102 + 0.025x – 4 × 10−5x2 R2 = 0.488, GPP 2012 = 3.305 + 0.065 R2 = 0.750, (B) NEE 2009 = −0.900 − 0.019x + 4 × 10−5x2 R2 = 0.761, NEE 2012 = −0.264 − 0.033x R2 = 0.912, (C) NEP 2009 = −3.545 − 0.038x + 8 × 10−5x2 R2 = 0.701, NEP 2012 = −2.864 − 0.045x R2 = 0.722.
Sustainability 15 10085 g008
Table 1. Calibrated parameters: specific leaf area (sla, m2 leaf kg−1 C), typical dimension of leaves (du, m), typical dimension of stems (ds, m), leaf width (w, m), stomatal conductance coefficient (m, dimensionless), maximum capacity of the Rubisco enzyme (Vmax, μmol CO2 m−2 s−1), and initial soil moisture fraction (θg/θd, dimensionless). θg is the mass-based soil water content expressed in gravimetric soil moisture content, θd is soil moisture content.
Parameters Wet SeasonDry SeasonSource
InitialCO2 Flux Calibrated
Specific leaf area (sla)13.014.523.5[32,43]
typical dimension of leaves (du)0.0720.0560.032[32,44]
typical dimension of stems (ds)0.10.050.05[32,44]
Leaf width (w)0.10.060.03[32,44]
Stomatal conductance coefficient (m)10.08.04.0[17,32,43,45]
Maximum capacity of the Rubisco enzyme (Vmax)75 × 10−690 × 10−650 × 10−6[32,43,46]
Initial soil moisture fraction (θg/θd)0.360.225 0.105[32,36,47]
Table 2. Annual averages of Rn, LE, H, and G, in addition to the closure residual (R) and partitioning of the energy balance.
2009 (Heavy Rainfall)2012 (Extreme Drought)
AnnualWet SeasonDry SeasonAnnualWet SeasonDry Season
Rn (Wm−2)166.4170.2166.7163.4167.4164.4
LE (Wm−2)42.659.035.932.843.526.0
H (Wm−2)60.641.888.880.453.8115.6
G (Wm−2)0.90.80.70.70.30.6
R (Wm−2)62.368.641.349.569.822.2
ED (Wm−2)165.6169.4166.0162.7167.1163.8
EBC0.620.600.750.700.580.86
LE/Rn (%)25.634.021.520.026.016.0
H/Rn (%)36.424.553.349.232.170.3
G/Rn (%)0.50.480.40.40.20.3
R/Rn (%)402040302040
Disclaimer/Publisher’s Note: The statements, opinions and data contained in all publications are solely those of the individual author(s) and contributor(s) and not of MDPI and/or the editor(s). MDPI and/or the editor(s) disclaim responsibility for any injury to people or property resulting from any ideas, methods, instructions or products referred to in the content.