Article

Finding Sustainable Countries in Renewable Energy Sector: A Case Study for an EU Energy System

by
Shoeib Faraji Abdolmaleki
,
Danial Esfandiary Abdolmaleki
and
Pastora M. Bello Bugallo
*
TECH-NASE Research Group, Department of Chemical Engineering, Universidade de Santiago de Compostela, 15782 Santiago de Compostela, Spain
*
Author to whom correspondence should be addressed.
Sustainability 2023, 15(13), 10084; https://doi.org/10.3390/su151310084
Submission received: 19 March 2023 / Revised: 12 June 2023 / Accepted: 20 June 2023 / Published: 26 June 2023
(This article belongs to the Special Issue Sustainable Development Goals and Role of Energy)

Abstract

:
This study aims to identify sustainable countries within the European Union in terms of renewable energy. The objective is to support renewable alternatives and enhance sustainability in the renewable sector among the top economic countries. The study reviews key drivers of sustainable development, establishes criteria for each dimension, and selects up-to-date indicators. The fuzzy analytical hierarchy process and expert judgments are employed to rank the countries, ensuring unbiased results, and reducing uncertainty. The findings indicate that Sweden, Belgium, Ireland, France, Germany, Spain, the Netherlands, Poland, and Italy exhibit their positions from the most advanced to the lower sustainable countries, respectively. Energy and environmental indicators play a primary role as the most influential drivers. Economic factors contribute as tertiary drivers, while social and institutional indicators have a relatively minor influence. Notably, Sweden, Belgium, and Ireland, despite being among the last three in terms of economic ranking, emerge as the most sustainable countries in renewable energy, surpassing stronger economies such as France, Germany, and Spain. On the other hand, the Netherlands, Poland, and Italy, as middle economy countries, rank lower in terms of sustainability. These results provide insights for harnessing renewable energy in high-growth economies and offer valuable policy advice for implementation.

Graphical Abstract

1. Introduction

Long-term development plans that address environmental issues require the consideration of RE as the best option, leading to a direct association between RE and SD [1,2]. All nations must guarantee their access to a reliable energy source. Due to continuing power sector adjustments and foreign policy issues, this is especially the case for EU member states [3]. In fact, one of the core areas of SD is sustainable energy, which has ties to the environment, politics, and the economy. Therefore, nations are encouraged to incorporate a common understanding of SD into all aspects of their energy enterprises, financial plans, and decision-making [4].
RE exhibits a profound correlation with several SDGs, making its effective implementation capable of influencing these SDGs positively [5]. To effectively achieve the SDGs, it is evident that additional efforts beyond current policies and strategies will be necessary. The energy sector, being a fundamental enabler of all development activities, requires a thorough analysis of the efforts and energy required to implement these goals, considering the specific context of each country [6]. The integration of the SDGs into local and national development plans, both in the long and medium terms, is expected to have a significant impact on the energy sectors of countries, potentially requiring substantial efforts and energy investments to attain the SDGs [7]. Therefore, it is essential to explore the relationship between the energy sector and the implementation of the SDGs [6]. This analysis carries a significant implication, clearly signaling the future trajectory of investments in the energy sector. It highlights a notable shift towards RE and energy efficiency, offering investors increased confidence and assurance.
RE exhibits a strong synergy with several SDGs, and its successful deployment can have a significant impact on these goals. For instance, Swain and Karimu (2020) examined the synergistic effect of renewable electricity prices on selected SDGs in EU countries [5]. Their findings indicate a strong cooperation between renewable electricity prices and SDG 7 (affordable and clean energy) and SDG 8 (decent work and economic growth). Furthermore, they found that SDG 12 (responsible production and consumption) accounted for a significant portion of future renewable electricity price variation, while SDG 7 (affordable and clean energy) and SDG 13 (climate action) were mainly influenced by SDG 8 and SDG 12, respectively. Additionally, bridging the gap between carbon emissions and economic development is crucial for attaining the SDGs. The role of RE in rebalancing environmental and economic conditions is a topic of considerable discussion. Saidi and Omri (2020) assessed the impact of RE on carbon emissions and economic growth in fifteen major RE-consuming countries. Their results revealed the efficiency of RE in promoting economic growth and reducing carbon emissions, thus contributing to SD [8].
The advancements in new energy technologies utilizing RES have led to rapid improvements and expansions in the field. However, given the diverse configurations and complexities associated with RES, the concept of system optimization has emerged as a tangible approach [9]. Fortunately, the development of computational technologies and new algorithms has facilitated the adoption of various optimization perspectives. Additionally, the recent availability of user-friendly tools specifically designed for energy planners, even with limited software development skills, has greatly assisted energy professionals in the planning and design of hybrid RE systems, alleviating concerns about the underlying mathematical complexities [10,11].
The EU has established challenging goals for lowering GHG emissions in conjunction with expanding the use of RES and raising energy efficiency. However, to further reduce GHG emissions, countries with already constrained fossil fuel power output must take further steps, as the expansion of RES is occasionally impractical due to technological limitations. Institutional frameworks and public views of smart grids are also factors in the promotion of RE. The relevant state structures must contend with various issues that either support or hinder smart grids and energy systems in general. When formulating tactics for increasing the share of RES in the energy mix, these concerns must be taken into consideration [12]. Therefore, it is crucial to evaluate the sustainability of RES to reach the higher stability of the energy system. The usage of these sources has favorable implications on the economy and ecology [13,14].
It has been shown in recent studies that the development of RE has led to economic growth (or vice versa) and the reduction of greenhouse gases (e.g., [15,16,17]). Energy generated using renewable resources has favorable, varied quantities, and short- and long-term economic consequences [18,19]. Therefore, in a few middle-income countries as opposed to a few high-income countries, RE has a bigger impact on the green economy. The establishment of policies to enhance energy production from renewable sources is thus regarded as one of the grounds for pursuing this goal in some nations, along with the improvement of macroeconomic metrics [20]. Additionally, the latest studies in OECD member countries show that the implementation of renewables is critical to reducing fossil fuels and meeting greater environmental sustainability [21]. The stability of an energy system is quite influential in meeting the energy demand in different sectors, including technical characteristics, economic and investment attractiveness, and the existence of diverse energy sources, all of which should be carried out with an emphasis on SD.
Numerous studies have been conducted across various fields related to RE and SD. In the EU, especially, Wang and Zhan (2019) [22] aimed to assess the sustainability of RE by conducting a systematic and quantitative analysis of data from 18 European countries. These countries were carefully selected to ensure they represented a substantial proportion of RE consumption within the EU [22]. Davidson et al. (2021) [23] carried out an investigation into the impact of renewable energy consumption on economic growth in EU countries. Their study revealed a positive relationship between renewable energy consumption and economic growth in these nations. This research offered valuable insights into the potential for developing renewable energy sources while simultaneously fostering economic growth [23]. Marinaş et al. (2018) [14] carried out a study on the relationship between renewable energy consumption and economic growth in central and eastern European countries. The short-term perspective revealed a transition towards a new energy paradigm, while the long-term approach corresponded to the long-term equilibrium of the analyzed factors. The findings indicated that, in the short run, the dynamics of GDP and RE consumption were independent in Romania and Bulgaria. However, in Hungary, Lithuania, and Slovenia, an increase in RE consumption contributed to improved economic growth [14]. Ntanos et al. (2018) [13] investigated the association between energy consumption derived from renewable energy sources and the economic growth of twenty-five European countries, as measured by GDP per capita. The study findings indicated a correlation between GDP (dependent variable) and various independent variables including RES and non-RES energy consumption, gross fixed capital formation, and labor force in the long run. Additionally, the results revealed a stronger correlation between the consumption of RES and the economic growth of countries with a higher GDP compared to those with a lower GDP [13]. Abbasi et al. (2020) [24] investigated the impact of renewable and non-renewable energy on economic growth in Pakistan. Through their empirical analysis, they discovered a notable long-term asymmetric relationship between renewable energy and terrorism, both positively and negatively impacting economic growth. Additionally, they found a significant negative effect of non-renewable energy consumption on economic growth [24].
However, there is a lack of research specifically examining the sustainability of renewables in different countries or energy systems. To determine whether the EU’s most economically influential countries are also the most sustainable in the RE sector, this study examines the sustainability of RE within the top economically performing nations in the EU (Germany, France, Italy, Spain, the Netherlands, Poland, Sweden, Belgium, and Ireland). It investigates significant variables by considering an appropriate sustainable framework to identify their potencies and shortcomings. An energy system’s security of supply can be improved by better understanding how sustainable the RES is in that system, particularly for the EU countries that stand on the side of energy demands. This is while the EU has been emphasizing the reduction of CO2 [25], particularly contemplating significant strategies and emphasizing the need to reduce greenhouse gases [26]. Examining the existing sustainability situation in the selected countries can assist in adopting appropriate policies, moving swiftly to develop strategies, and achieving appropriateness in accomplishing both short-term and long-term goals. The FAHP is used to reduce uncertainty and prevent biased outputs, to analyze the sustainability of RE, and to cope with complex and multifaceted data. Furthermore, the interrelationships between sustainability drivers enable decision-makers to extend the capabilities of top economy nations to others and provide reasonable solutions.

2. Materials and Methods

In this research, a multistep approach is taken to assess the sustainable status of RE in the top economic countries of the EU (Figure 1).
Firstly, the identified countries are evaluated. Then, a set of indicators is selected in step two, through a review of the relevant literature and expert input. Next, in step three, the required data are collected from available databases and the most up-to-date ones are used to provide a better understanding of the sustainable outlook of renewables in the coming future. In addition, the nominated countries for the study are selected considering their economy in the Union. In the fourth step, the experts are utilized to weigh the indicators and consider their importance in the study through a questionnaire. The FAHP method is then used in step five to develop a hierarchical classification of the sustainability status of renewables, incorporating less uncertainty. The obtained ranking determines the sustainable status of renewables in the wealthy countries of the Union (step six), and based on this, the influential factors on sustainability are discussed, and potential ways to improve the conditions of this energy system are proposed.

3. Development

3.1. Case Study (Step 1)

For this study, the countries with the top economies in the EU are selected from the International Monetary Fund (https://www.imf.org/en/Data (accessed on 20 November 2022)). Therefore, Germany, France, Italy, Spain, the Netherlands, Poland, Sweden, Belgium, and Ireland are the top ten economic countries, respectively, and they are alternatives.

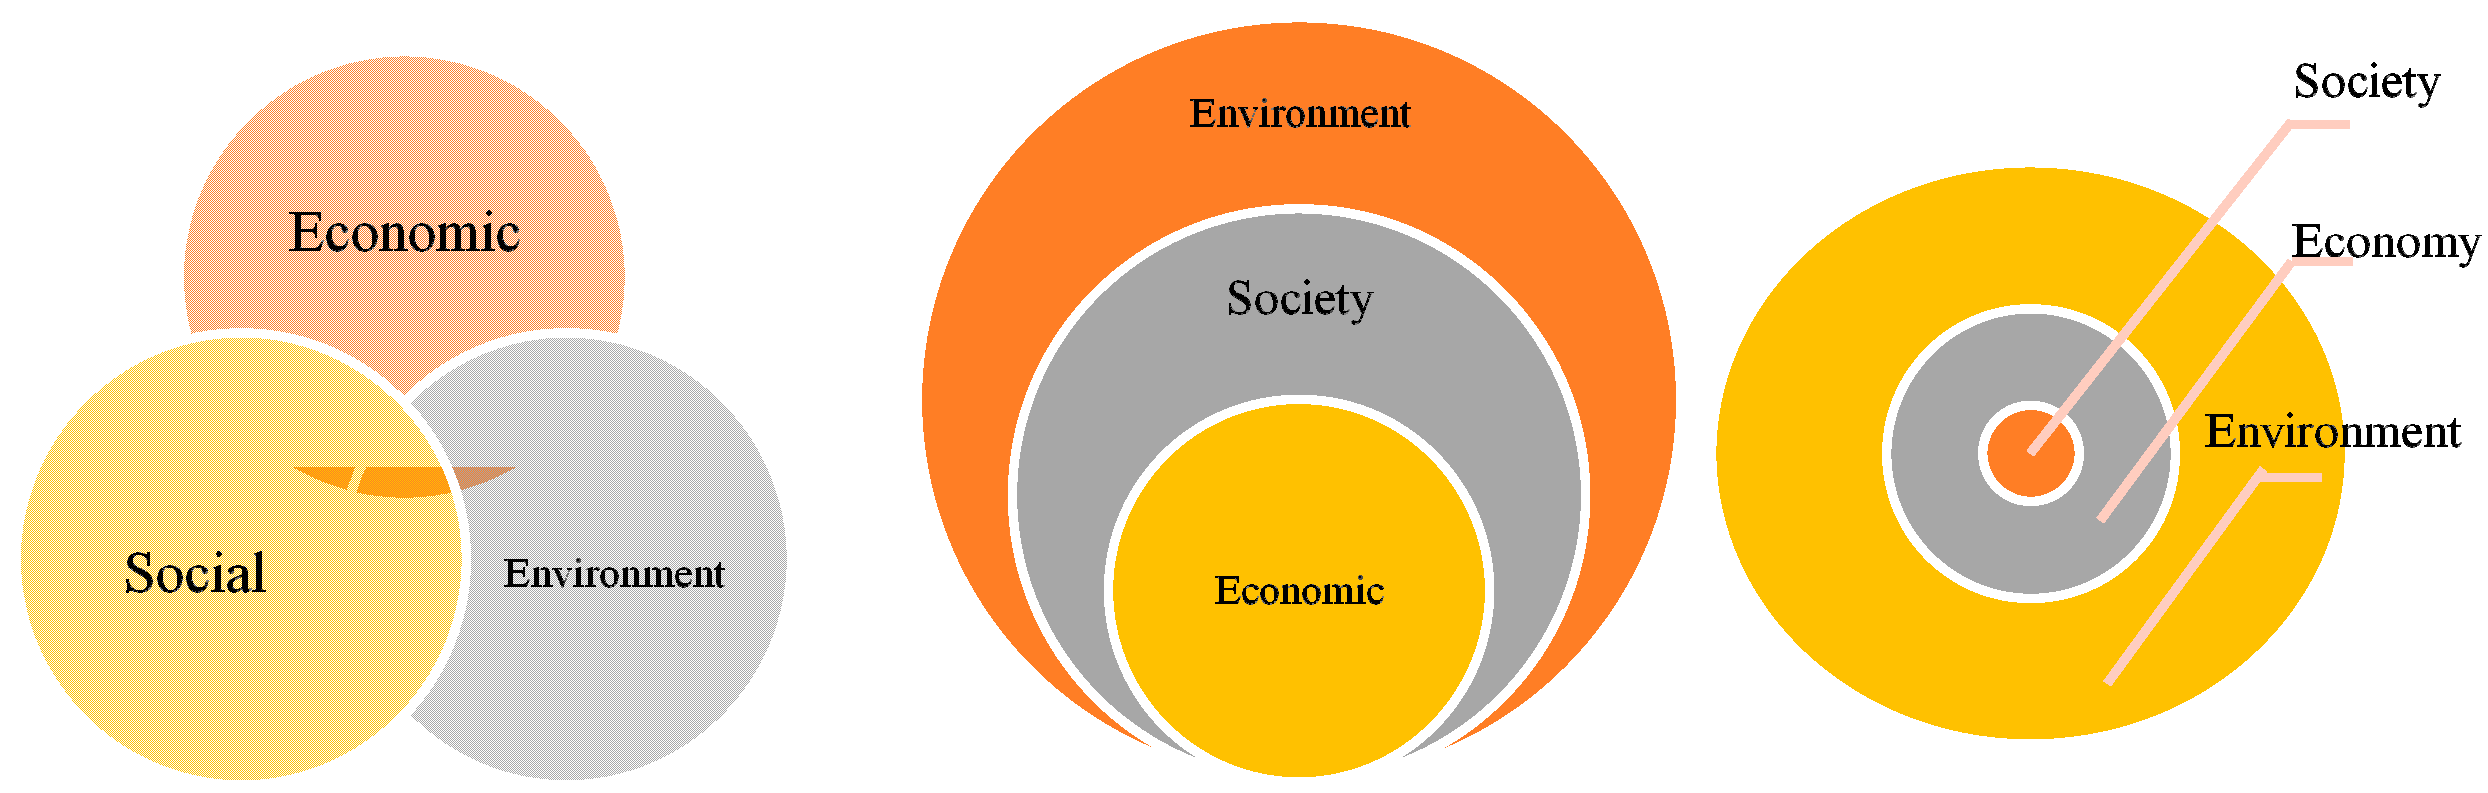
3.2. Sustainable Criteria and Framework (Step 2)

3.2.1. Drivers

To evaluate the sustainability of RE in the previously mentioned countries, this study first looks for essential drivers of SD and reviews the criteria for each dimension. Various individuals have different perspectives on sustainability. Therefore, choosing the criteria is not always easy. For example, when all dimensions have the same size and importance, sustainability occurs, according to the Triple Bottom Line (TBL), which measures all drivers and their relative relevance [27,28] (Figure 2, left). On the other hand, the three nexus circles recognize the economy as a community organization, while both are environmentally dependent [29] (Figure 2, middle). Furthermore, some consider the economy as a tool for allocating resources to preserve or improve environmental sustainability and social well-being [30] (Figure 2, right).
However, the literature suggests that SD can be evaluated using more drivers such as technical and institutional ones (e.g., [31,32,33]), which are considered tools for the sustainability assessment in RE [34]. While other dimensions could potentially be defined, these five dimensions collectively offer a robust representation of the multidimensionality of energy sustainability [34].
The primary drivers should be considered to adequately define renewables and integrate the idea of sustainability. The authors of numerous works of literature about the sustainability of RES have focused on different examples. The successful deployment of RE aligns strongly with several SDGs, underscoring its potential impact on achieving these goals. However, integrating the SDGs into local and national development planning demands significant effort and energy, particularly within the energy sector, which serves as a crucial enabler for all developmental activities [6]. Therefore, it becomes imperative to analyze the specific context of each country and determine the necessary effort and energy required to implement these goals. The attainment of the SDGs will undoubtedly influence the energy sector, with certain countries necessitating greater exertion and energy to accomplish these objectives [7,35]. In this study, the main drivers are defined so that they convey the primary objective of analyzing the sustainability of chosen nations from the perspective of renewables, in addition to meeting the criteria for picking indicators.

3.2.2. Indicator Selection

General sustainability indicators should be capable of providing numerical values that accurately reflect the sustainability outcomes and dimensions of the evaluated system. This enables users to compare different systems in terms of their sustainability and make informed decisions by selecting the most sustainable option with the lowest overall costs, encompassing economic, environmental, and resource-related considerations [36]. When selecting a family of criteria, it is essential to consider criteria that are unambiguous, comprehensive, and representative of all perspectives; monotonically related to sustainability; and non-redundant, with each criterion being distinct [37]. Previous research has emphasized the practical usefulness and measurability of indicators in the assessment of RE technologies.
To ensure the relevance of indicators and facilitate effective communication with decision-makers and the public, experts should focus on establishing a clear relationship between the indicators and the underlying facts they represent [38]. Pintér et al. (2005) [39] and Krellenberg et al. (2010) [40] argued that a smaller set of indicators holds greater relevance for decision-making. However, given the diverse range of goals and targets, relying solely on a limited number of indicators that decision-makers can easily comprehend is unrealistic [39,40]. Composite indicators can serve as valuable complements to single indicators without necessitating significant changes to the existing indicator framework. They enable explicit assessments of trade-offs between policies, as policies often impact different indicators in opposing ways [41].
The selection of indicators ideally begins with the identification of a comprehensive set of potential indicators, followed by the application of well-defined and widely accepted methods to select the most appropriate ones [41,42]. Empirical studies examining the historical influence of indicators on desired objectives, the impact of policy measures on indicators, and correlations between various indicators can support this selection process [43].
Techniques described by Dawoud et al. (2018) [44] and Tezer et al. (2017) [45] can be employed using different computational approaches to optimize a sustainability function based on predefined variables and constraints [44,45]. Sustainability objectives incorporate criteria (indicators or KPIs measured with numerical values) to mathematically formulate the function to be maximized (e.g., share of RE) or minimized (e.g., minimum GHG emissions) [11]. Hence, the direction of each indicator (criteria) influences the sustainability measurements positively or negatively.

3.2.3. Principles to Select Indicators of This Study

To choose a suitable set of indicators for the assessment, this study addresses the following requirements: (a) using highlighted criteria that are delivered by institutions, organizations, governments, and in the literature; (b) they must present the country-scale circumstances and move forward from localization to globalization; (c) the direction of the effectiveness of the criteria on RE and SD should be clear (being positive or negative); (d) availability (they could provide enough existing data); (e) understandable (how they can link RE and SD). Further, there are numerous indicators available for evaluating sustainability.
However, to be compatible with the nominated countries, indicator selection requires a suitable proxy to introduce improved information and data. For example, the population of these countries varies from one to another, which affects energy needs. Regarding Bekhrad et al. (2020) [46], per capita or per population measures are commonly used when comparing options or indicators across different populations for several reasons. Firstly, dividing the indicator value by the population size provides an average value per person, enabling fairer comparisons and standardization. Secondly, per capita measures highlight disparities and inequalities between populations, accurately assessing the distribution and impact of factors and promoting equality. Additionally, evaluating indicators on a per person basis helps assess the impact of policies on the intended population, offering insights into relative successes and challenges for a comprehensive policy assessment [46]. In summary, per capita measures facilitate fair comparisons, identify disparities, and support policy evaluation, making them important for analyzing indicators across populations.

3.3. Data Sources, and Information Gathering (Step 3)

This study utilizes the most up-to-date data available on the indicators to ensure the accuracy and relevance of the findings. Therefore, the data are related to the years 2022 (if available) and 2021. To advance the goals of energy sustainability, the study focuses on investigating the current sustainability of RE. The obtained results are expected to contribute significantly to the advancement of energy sustainability objectives. After choosing the pertinent indicators for each driver, the data are extracted and computed. One specific issue that needs to be considered is the varying periodicity of the measurement of some indicators [47].
Most of the data have been picked up from Eurostat (https://ec.europa.eu/eurostat/ (accessed on 25 November 2022)), the World Bank (https://data.worldbank.org/ (accessed on 25 November 2022)), BP Statistical Review (https://www.bp.com/ (accessed on 25 November 2022)), IEA (2022) [48], the World Population Review (https://worldpopulationreview.com/ (accessed on 26 November 2022)), Trading Economics (https://tradingeconomics.com/ (accessed on 24 November 2022)), and the United Nations Development Program (https://hdr.undp.org/ (accessed on 22 November 2022)).
Considering the literature review and the established criteria selection guidelines, a comprehensive sustainable framework is developed (based on drivers in Section 3.2.1). Thirteen indicators are chosen from various databases to align with the established framework.

3.4. FAHP Application, Expert Viewpoints, and Ranking (Steps 4, 5, and 6)

The FAHP methodology is used to rank the selected countries. The objective of this study is divided into hierarchical levels, such as a primary goal, principal drivers, sub-criteria, and alternatives, and then each level is subjected to a pairwise comparison. The hierarchy gives professionals a broad perspective of the intricate links present in the context and enables them to judge if pieces belonging to the same level are equivalent. The weights of the factors are then determined by a pairwise comparison using nine levels-scales. The pairwise comparison, however, creates uncertainty because it depends on expert judgment. The fuzzy theory is added to the basic AHP created by [49], preventing influenced outcomes and lowering ambiguity [50,51].
A framework for solving problems is a methodical process for outlining the components of any issue. By breaking down an issue into its smaller constituent parts, it organizes the core rationality and then just requires straightforward pairwise comparison judgments to establish priorities in each hierarchy [52].
Recent research has focused on fuzzy energy policymaking and a fuzzy RE sustainability assessment. In addition, they considered different scopes of sustainability. For example, some of the authors (e.g., [33,53,54]) evaluated the sustainability of RE as a general tendency. However, from the viewpoints, they selected different initial drivers for their studies with the AHP method. To assess RE sources, Ahmad and Tahar (2014) [53] and Haddad et al. (2017) [55] considered the technical driver plus the three main drivers of sustainability (environment, economic, and social) [53,55]. The information of previous studies is gathered up in Table 1. FAHP is mostly employed in RE technology and system assessments, where researchers used AHP with fuzziness and provided expert judgment ratings to be linguistic phrases, crispy values, or fuzzy numbers to choose amongst RE sustainability studies.
The use of FAHP has many applications. This study pursues Chang’s method to add a fuzzy approach to the AHP [67]. This approach contributes to the issue by selecting the fuzzy priorities of comparison proportions with triangular membership functions (Table 2). It also introduces a way connected to the utilization of triangular numbers in pairwise comparisons. The triangular fuzzy number can be defined by a triplet (l, m, u). The definition of the membership function µ(X) is given in Figure 3.
The FAHP technique using Chang’s method can be briefly explained with the following steps:
  • Making a decision matrix for the alternatives (countries) regarding each criterion
Make a fuzzy questionnaire (using experts’ viewpoints), then define fuzzy numbers for performing the pairwise comparisons (Table 3). In this case, seven experts are invited to fill out the questionnaire with the given weight. Then, all the weights are normalized and used for the evaluation.
2.
Calculating the summation of all levels (lj, mj, uj) (SM), (Equation (1)):
S M = j = 1 m M g i j = j = 1 m l j , j = 1 m m j , j = 1 m u j ,
M g i j introduces fuzzy numbers.
3.
Calculating the sum of all rows together (SSM), (Equation (2)):
S S M = i = 1 n j = 1 m M g i j = i = 1 n l i , i = 1 n m i , i = 1 n u i ,
whereas a comparison matrix of criteria must always consist of a square matrix, in our context, n = m.
4.
Calculating the inversion of SSM (ISSM), (Equation (3)):
I S S M = i = 1 n j = 1 m M g i j 1 = 1 i = 1 n u i , 1 i = 1 n m i , 1 i = 1 n l i ,
5.
Calculating the fuzzy scores of each alternative (Si = SM ISSM), (Equation (4)):
S i = j = 1 m M g i j i = 1 n j = 1 m M g i j 1 ,
The term Si is known as the fuzzy synthetic extend.
6.
Calculating the superiority (the degree of possibility) of each alternative, (Equation (5)):
For the ordinate of point d, the following equation is obtained if M1 = (l1, m1, u1) and M2 = (l2, m2, u2).
V M 2 M 1 = h g s M 1 M 2 = μ M 2 d = 1 if   m 2 m 1 0 if   l 1 u 2 l 1 u 2 m 2 u 2 ( m 1 l 1 ) otherwise
Therefore, if M2 ≥ M1 and m2 ≥ m1, the superiority value of fuzzy number M2 will be equal to one. Additionally, if the lower limit of M1 is greater (or equal) than the upper limit of M2, then the superiority value of fuzzy M2 will be zero. Otherwise, the superiority of M2 should be calculated using the third term of (Equation (5)).
As a result, this calculation will yield the fuzzy score. The following formula expresses the likelihood that a convex fuzzy number will be bigger than K convex fuzzy numbers M j , (j = 1, 2, 3, …, k):
V M k M 1 , M 2 , M k 1 , M R , , M n = V M k M 1 ) a n d M k M 2 a n d a n d ( M k M n = min V M k M j = d C j     , j K
Consider that
d(Ci) = min V(SiSk),
for k = 1, 2, …, n; ki. Then, the weight vector is given by
W′ = (d′(A1), d′(A2), …, d′(An))T,
where Ai (i = 1, 2, …, n) represents n items, and T denotes transposition. The normalized weight vectors are obtained through normalization:
W = (d(A1), d(A2), …, d(An))T,
where W is a non-fuzzy number.
However, non-fuzzy superiority scores must be given. This requires first obtaining the minimum of each row in the stated matrix of (Equation (6)). Consequently, to reach the score matrix, the scores are normalized.
7.
Calculating the superiority of criteria over each other (following the same procedure as alternatives (steps 2 to 6)). Then again, a decision matrix should be formed for the pairwise comparison of criteria.
8.
Obtaining the scores for all alternatives. To achieve this, the decision matrix should be normalized, dividing each row by the sum of the rows in that column. The matrix is then multiplied by the corresponding weights. At the end, the obtained points should be normalized to obtain the final points. For more information about the FAHP and its implementation, this study suggests [67,68].
Finally, all the algorithms are coded in MATLAB® to facilitate the calculations.

4. Results and Discussions

4.1. Framework and Drivers

This study creates a sustainable framework with the hierarchy model to evaluate the sustainability of RE (Figure 4).
This evaluation is guided by five drivers and thirteen criteria. The collected indicators represent environmental (C4), economic (C3, C5, C9), social (C1, C2, C6), institutional (C7), and energy (C8, C10, C11, C12, C13) drivers. Table 4 represents the selected indicators with their values through the databases. These indicators and their relationship with SD and RE are extracted through the available literature. However, there exists a limitation when selecting all the possible indicators. For example, in the case of environmental indicators, there are a bunch of indicators that can be employed to evaluate the sustainability of RE (e.g., CO2 emissions [69,70,71,72,73,74,75], land use [76,77,78], NOX emissions [11,56,72], etc.). Furthermore, when it comes to institutional indicators, which have recently gained attention from experts and engineers, their coverage in the literature on sustainable development SD and RE remains limited. For instance, indicators such as compliance with international obligations [32], legal regulation of activities [47,79,80], and government support [32,47,58] have received relatively scarce available data.
However, certain databases lack uniform information or data, such as inconsistencies in the availability of data, variations in the years covered, or incomplete datasets. Addressing these gaps becomes imperative to enhance the robustness and efficacy of these platforms. Therefore, this study adheres to the five criteria outlined in Section 3.2.3 to acquire a comprehensive and suitable set of indicators.

4.2. Expert Judgement and Indicators

A panel of seven experts was invited to assess the weighting of indicators, compare indicators against each other, and evaluate indicators in relation to the alternatives (countries). To enhance the presentation, this study employs the simple arithmetic mean to aggregate the weights obtained from the experts.
As shown in Figure 5, the energy driver category (including the share of renewable energy, general energy production per population, energy intensity, and energy consumption per capita) obtains the highest scores, respectively. However, the dependency on fossil fuels, which is an energy driver, receives a lower score. GHG emissions, representing an environmental driver, are deemed to be of secondary importance compared to the energy driver category. The group of economic indicators (GDP, economic growth, and inflation rate) captures significant attention as the third most crucial driver category. Social indicators (HDI, employment rate, and crime rate) and the institutional driver (corruption) are identified as the two least influential drivers.
In the present case study, the energy driver is assigned a higher weight compared to the other drivers. For example, in the 2020 study conducted by Ghenai et al. environmental indicators were ranked as the top priority [91]. However, when comparing the results of this study to that one, slight changes in the ranking of the drivers are observed. These differences can be attributed to factors such as the knowledge of the experts, the period of the study, and the methodology used for selecting the main drivers. It is worth noting that there are various aspects related to the ranking of drivers or indicators that are beyond the scope of this discussion.

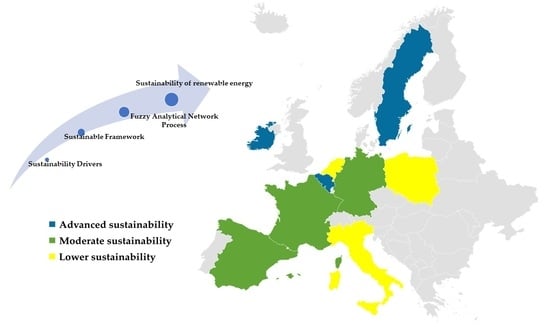
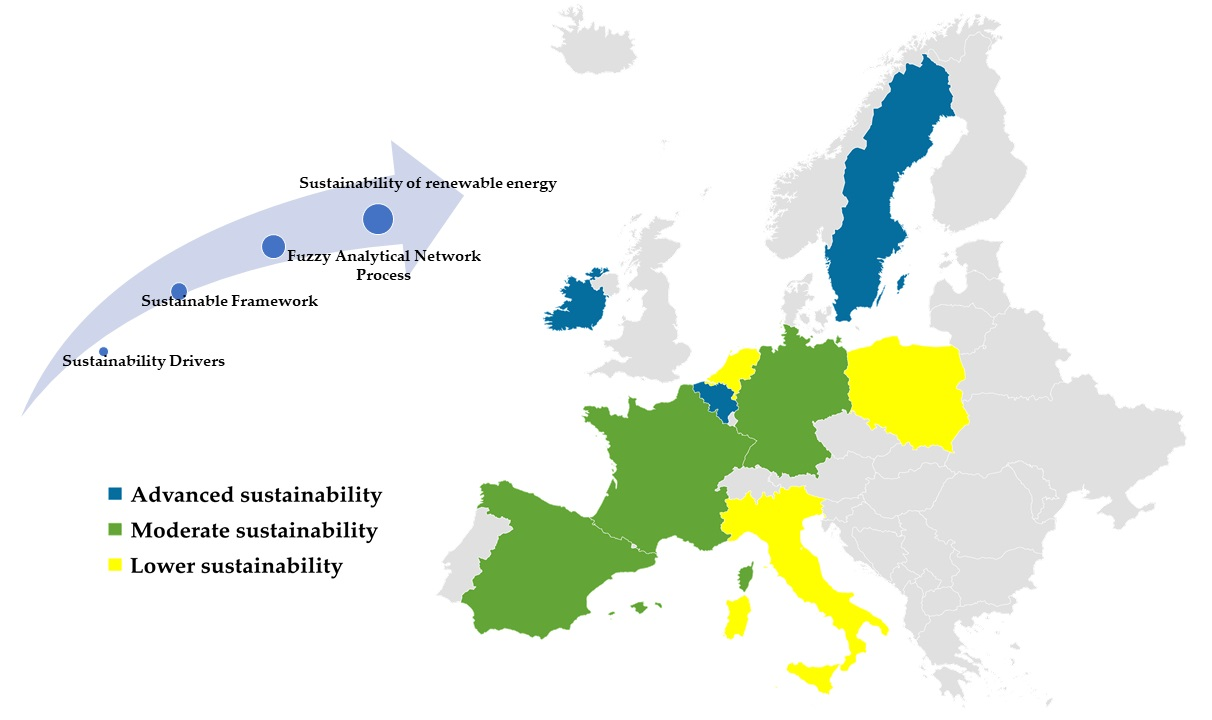
4.3. Assessing the Sustainability of RE in the Top EU Economy Nations

As a result of running the FAHP code in MATLAB®, the rank of sustainable countries regarding the RE is obtained. Sweden, Belgium, Ireland, France, Germany, Spain, the Netherlands, Poland, and Italy scored at higher and lower levels of sustainability, respectively (Table 5).
Finding unsustainable or less sustainable components is one of the key goals of an energy system because an integrated system’s sustainability might be hampered by the presence of imbalanced parts. Accordingly, by ranking the top economic countries in the EU, the investigation concludes that the third group (C), which includes the Netherlands, Poland, and Italy, is considered the least stable group in the field of RE, and the countries of groups (A) and (B) can contribute to enhancing sustainability in the group (C) through scientific, practical, political, and experimental cooperation.

4.4. Key Factors Influencing Sustainability of RE

Based on the average absolute values of the weights in each sustainability driver, it is evident that energy and environmental indicators have a significant impact on sustainability, with values of 8.02 and 8, respectively. Additionally, economic factors play a secondary influential role, with a value of 6.3, making them the third most important factor. On the other hand, social indicators have a relatively lower effect on sustainability, with a value of 4.2, followed by institutional indicators with a value of 3.5, which have the least significant impact (Figure 6). In the following section, the influence of various factors on sustainability rankings is discussed.

4.4.1. Group A (Sweden, Belgium, Ireland)

Considering the economic situation of the studied countries, Sweden, Belgium, and Ireland, despite being among the last three in terms of economic ranking, emerge as the most sustainable in terms of RE.
In terms of four criteria, Sweden achieves the top rank in HDI (positive impact), having less GHG emissions (negative impact), dependency on fossil fuels (negative impact), and general production per population (positive impact). Regarding Table 6, when considering the social factors, Sweden receives an average ranking of 4.6 among nine countries. It excels in minimizing environmental aspects, but it ranks last in the institutional factor. Despite being the leading country in terms of reduced reliance on fossil fuels and high energy production, it scores 4.5 out of 9 for all energy-related factors. Moreover, Sweden demonstrates a commendable GDP; however, it obtains a modest score of 4.3 out of 9 for economic factors.
While Belgium leads the way in terms of energy intensity among the countries, it achieves an average ranking of 7 for its energy-related factors. However, when considering other drivers, Belgium’s performance is more modest across other factors. The average rankings indicate 5.6 out of 9 for social factors, 4.6 for economic factors, 5 for institutional factors, and 6 for environmental factors.
As depicted in Table 6, Ireland emerges as the most sustainable country in terms of economic factors. It also stands as a frontrunner in renewable energy sharing. Additionally, Ireland maintains a stable average ranking of 4 for social factors, placing it among the top performers. However, it appears that Ireland should focus on climate action and enhance its plans to achieve a higher level of sustainability, scoring 9 out of 9 in this regard. In terms of energy, Ireland obtains an average score of 5.4, indicating that it is on the right path towards optimizing its approach to energy drivers. Nonetheless, there is potential for further enhancement in its institutional factor, which currently receives a rating of 6.

4.4.2. Group B (France, Germany, Spain)

An interesting observation is that countries with a stronger economic condition are classified within the second group of sustainability when considering RE.
France achieves the fourth position in the average ranking of factors for economy drivers (3.6), energy (4.2), and institutional drivers (4). This highlights France’s notable strides in implementing sustainable programs focused on RE (almost similar achievements across different drivers). However, there is still scope for improvement in social factors (7.3). As Table 6 illustrates, a further recommendation to enhance a sustainability assessment is to progressively increase the share of RE over time.
The data indicate that for Germany to achieve a high level of sustainability in RE, there is a need to improve its energy factors, which currently have an average ranking of 5.6. Additionally, the economy and institutional factors require attention, as they both rank around 7. However, the social and environmental factors are at an acceptable level.
When considering environmental, institutional, and energy factors, Spain demonstrates strength and achievements in the implementation of sustainability programs and policies for RE. However, there is a need for more attention to be given to social factors and the economy factor, which have an average ranking of 6 and 7, respectively, among other countries.

4.4.3. Group C (The Netherlands, Poland, Italy)

In general, the countries fall within the middle range of the top economy, indicating a relatively lower level of sustainability.
Considering the sustainable drivers, the Netherlands needs to focus on improving environmental, institutional, economic, and energy factors. Specifically, reducing dependency on fossil fuels is crucial. On a positive note, the Netherlands has made remarkable progress in social factors and ranks among the top countries in this area.
In the pursuit of sustainable RE, Poland needs to focus on improving its economic factors, particularly addressing the impact of GDP and inflation rate on RE. Additionally, taking steps to adjust programs aimed at reducing GHG emissions is of the utmost importance. While Poland has an average ranking of 4.8 out of 9 for energy factors, there is a specific need to concentrate on enhancing the share of RE (C13). Elevating the HDI level could lead to a better ranking in terms of sustainable social factors. Furthermore, the impact of institutional factors on RE sustainability is notably commendable.
Italy demonstrates commendable institutional and environmental factors. However, there is a big space for improvement in addressing social and energy factors, specifically focusing on the employment rate (C1) and Human Development Index (C2), enhancing energy intensity (C10), general energy production (C12), and GDP.
This discussion focused on examining the influence of indicators on the measurement process. It is observed that when the ranks of drivers have similar values, it indicates that sustainability in those drivers happened at the same time, as seen in the case of France. In addition, the low averages in the rank of drivers make the alternatives more sustainable.

4.4.4. The Effect of Fuzzy Calculation on the Results

It is evident that weights play a significant role in determining ranks. However, fuzzy studies consider other computational factors that impact the final ranking.
By considering the decision matrix, fuzzy pairwise comparisons, and calculations of superiority for both alternatives and criteria, the FAHP methodology provides a structured framework to evaluate and rank alternatives based on multiple criteria. The results are influenced by the experts’ judgments, the assigned fuzzy numbers, and the calculations that aggregate these fuzzy judgments [52,67]. The methodology allows for incorporating expert knowledge and dealing with the uncertainty and imprecision inherent in decision-making processes, leading to more comprehensive and informed rankings of the alternatives.

4.5. General Discussion and Policy Adjustment

It can be observed from looking at some previous studies that some nations have advanced considerably in RE sustainability. Sweden, for instance, is one of the leading nations in RE that has been able to maintain its position (e.g., [47]). However, there are several factors involved in energy sustainability that need to be considered. Following the concept of integration, we can determine its strengths and weaknesses. Looking at (Table 5) and considering the values of the selected indicators, their orientation towards SD, the scores obtained by the study method, as well as the previous research [92,93,94,95,96] in the field of sustainable development in the EU, the key solutions for greater sustainability of the EU member states in RE are as follows:
  • Developing new mechanisms that can accelerate technological advancements and help achieve carbon neutrality by 2050. This includes establishing medium-term goals for every five-year period.
  • Using financial management tools to identify cost-effective and optimal options.
  • Developing guideline frameworks that can balance rules, spending, and interests.
  • Analyzing the collective responsibility of allocating policy and financial duties across various government levels.
  • Conducting research and development to identify the most important social development and research projects that align with the SD goals and Paris Agreement.
  • Establishing criteria and supervision mechanisms that can provide continuous feedback from metrics to policy and identifying a set of indicators to measure progress towards the 2050 target and intermediate milestones.
However, energy security problems are managed exclusively at a nationwide level without considering the interdependence of member states [97,98]. A functioning internal market and more regional and European collaboration, particularly for coordinating network developments and opening markets, are the first steps toward achieving effective energy security [99,100]. Then, taking more cogent external action assures that the fundamentals are followed by candidate countries and potential candidates through the expansion tools.
However, there are still some gaps that need to be addressed to provide a more comprehensive evaluation. Some of these gaps are:
  • Lack of consideration of social and environmental impacts: The FAHP methodology mainly considers economic and energy factors in its evaluation, such as the availability of resources and the cost-effectiveness of RE technologies. However, there is a need to incorporate social and environmental impacts such as air and water pollution, land use, and biodiversity loss in the assessment to provide a more comprehensive evaluation of sustainability.
  • Data limitations: The availability and quality of data for some countries may be limited, which may affect the accuracy of the assessment. Some countries may also lack transparent reporting on their RE policies, investments, and progress, making it difficult to assess their sustainability accurately.
  • Limited scope: The FAHP methodology focuses primarily on RE, and it does not consider other factors that contribute to a country’s sustainability, such as energy efficiency, energy storage, and demand-side management.
  • Policy and regulatory gaps: There are differences in policies and regulations between EU countries that can affect their RE sustainability. For example, some countries have more supportive policies and regulations for RE, while others may have limited incentives and a less favorable policy environment.
  • Economic challenges: While RE is becoming more cost-competitive, there are still economic challenges in deploying RE technologies, such as the high upfront costs of installations, the intermittency of some RES, and the limited availability of financing.
Addressing these gaps will require more comprehensive and multidimensional approaches that consider a broader range of sustainability factors, data sources, and stakeholder perspectives. This will provide a more accurate and reliable assessment of sustainable countries in RE in the EU.

5. Conclusions

This study aimed to examine the sustainability of RE in the countries with the top economies in the EU, namely Germany, France, Italy, Spain, the Netherlands, Poland, Sweden, Belgium, and Ireland. The primary objective was to determine whether the top economy countries are indeed the most sustainable ones in terms of RE. Additionally, the study sought to identify and analyze the key factors influencing the assessment of sustainability. By utilizing the most recent data available, the study aimed to provide up-to-date recommendations for achieving long-term sustainability in the field of RE. The FAHP method was used to be able to talk with less uncertainty about the sustainability of a part of the EU energy system. The main and influential drivers of RE toward SD were selected from the literature review so that the evaluation criteria benefited from environmental, economic, social, energy, and institutional indicators. Then, by creating a sustainable framework and using expert viewpoints in line with a hierarchical model and coding in MATLAB®, the studied countries were evaluated.
The results indicated that energy and environmental drivers have the most significant impact on the sustainability of RE. Following them, economic, social, and institutional drivers contribute to sustainability at the next level of importance, respectively. Sweden, Belgium, Ireland, France, Germany, Spain, the Netherlands, Poland, and Italy are the most stable countries, respectively. One of the key findings of this study demonstrated that the top economy countries are not necessarily the most sustainable countries regarding renewables. According to the values of the selected indicators and their linkage with SD, effective solutions in the form of a more sustainable RE system were investigated.
For advanced sustainable countries such as Sweden, Belgium, and Ireland, this study identified the strengths of these nations in terms of their reduced reliance on fossil fuels. They also performed well in terms of economic factors (especially Ireland) and social factors (especially Sweden). Furthermore, when considering the weaknesses of these countries, it is notable that Sweden ranks last in terms of the institutional factor. Although Belgium excels in energy intensity, its performance in other areas is relatively modest. Ireland, on the other hand, could prioritize climate action and strengthen its plans to achieve higher sustainability. Additionally, the following recommendations are made:
  • Sweden could prioritize the strengthening of institutional factors and its overall economic drivers’ score.
  • Belgium could concentrate on enhancing performance in non-energy-related aspects, including social, economic, and institutional factors.
  • As for Ireland, further enhancement of climate action plans and continued optimization of its approach to energy drivers are crucial. Lastly, improving the institutional factor to achieve a higher rating is suggested.
In terms of medium sustainable countries (France, Germany, Spain), they exhibit several strengths in their sustainable programs. France demonstrates commendable performance in energy, economic, and institutional factors. Germany and Spain excel in environmental and energy factors. However, weaknesses exist that require attention. For example, France could focus on enhancing social factors, while Germany and Spain need to address their respective weaknesses in the economic and institutional factors. To improve the situation, the following suggestions are proposed:
  • France: place emphasis on gradually increasing the share of RE over time and address areas in need of improvement within the social factors’ category.
  • Germany: enhance energy factors, improve the economic factors, and strengthen institutional aspects while maintaining acceptable levels in social and environmental factors.
  • Spain: give more attention to social and economic factors, with the aim of achieving a better situation amidst other countries.
Regarding the lower-level sustainable countries (the Netherlands, Poland, Italy), they possess notable strengths and weaknesses in various areas. The Netherlands has made remarkable progress in social factors and ranks highly in this aspect. Poland demonstrates a commendable performance in institutional factors, while Italy performs well in both institutional and environmental factors. However, there are weaknesses that require attention. For example, the Netherlands could prioritize improvement in environmental, institutional, economic, and energy factors. Poland needs to address economic factors and the impact of GDP and inflation rate on RE. Italy could focus on social and energy factors, including employment rate, HDI, energy intensity, general energy production, and GDP. To facilitate improvement, the following suggestions are put forth:
  • The Netherlands: it would be better to concentrate on reducing the dependency on fossil fuels; improving environmental, institutional, economic, and energy factors; and maintaining the progress in social factors.
  • Poland: it could address the impact of GDP and the inflation rate on RE, enhance the share of RES, and focus on improving economic factors.
  • Italy: it could work on improving social factors and energy factors (especially energy intensity and general energy production) and addressing employment rate and HDI.
In conclusion, the selected countries can improve their level of sustainability in RE by focusing on the specific areas of weakness mentioned above, such as strengthening institutional frameworks, increasing the share of RE, reducing dependency on fossil fuels, addressing social and economic factors, and enhancing environmental performance. Each country can develop tailored strategies and policies to overcome their specific challenges and move towards a more sustainable energy future.
The study investigated key strategies for the sustainability of renewables in the top EU countries, including the creation of technological pathways, financial planning, policy frameworks, subsidiarity analysis, research and innovation, monitoring, and supervision. Therefore, other EU member states can strengthen and improve their policies by considering the strengths and weaknesses of other economically influential members.
This study also suggests that platforms and databases should strive for unity and a common direction to facilitate the sustainability assessment of RE in an effective manner. Unfortunately, all the required data are not currently available. In this regard, the incorporation of localized indicators can play a crucial role in the comprehensive assessment of the energy system of the Union, leading to more meaningful and integrated evaluations.

Author Contributions

Conceptualization, S.F.A. and P.M.B.B.; Methodology, S.F.A., D.E.A., and P.M.B.B.; Software, S.F.A. and D.E.A.; Validation, S.F.A. and D.E.A.; Formal Analysis, S.F.A.; Investigation, S.F.A. and P.M.B.B.; Resources, S.F.A.; Data Curation, S.F.A.; Writing—Original Draft, S.F.A.; Writing—Review and Editing, S.F.A. and P.M.B.B.; Visualization, S.F.A.; Supervision, P.M.B.B.; Project Administration, P.M.B.B. All authors have read and agreed to the published version of the manuscript.

Funding

This research received no external funding.

Institutional Review Board Statement

Not applicable.

Informed Consent Statement

Not applicable.

Data Availability Statement

Not applicable.

Conflicts of Interest

The authors declare no conflict of interest.

Abbreviations

AHPAnalytical Hierarchy Process
BPBritish Petroleum
CO2Carbon Dioxide
EUEuropean Union
FAHPFuzzy Analytical Hierarchy Process
GDPGross Domestic Product
GHGGreenhouse Gas
HDIHuman Development Index
IEAInternational Energy Agency
KPIsKey Performance Indicators
MATLAB®Matrix Laboratory
MCDMMulti-Criteria Decision-Making
OECDOrganization for Economic Co-operation and Development
RERenewable Energy
RESRenewable Energy Sources
SDSustainable Development
SDGsSustainable Development Goals
TBLTriple Bottom Line

References

  1. Dincer, I. Renewable energy and sustainable development: A crucial review. Renew. Sustain. Energy Rev. 2000, 4, 157–175. [Google Scholar] [CrossRef]
  2. Vakulchuk, R.; Overland, I.; Scholten, D. Renewable energy and geopolitics: A review. Renew. Sustain. Energy Rev. 2020, 122, 109547. [Google Scholar] [CrossRef]
  3. Matsumoto, K.; Doumpos, M.; Andriosopoulos, K. Historical energy security performance in EU countries. Renew. Sustain. Energy Rev. 2018, 82, 1737–1748. [Google Scholar] [CrossRef]
  4. Taylor, P.G.; Abdalla, K.; Quadrelli, R.; Vera, I. Better energy indicators for sustainable development. Nat. Energy 2017, 2, 17117. [Google Scholar] [CrossRef]
  5. Swain, R.B.; Karimu, A. Renewable electricity and sustainable development goals in the EU. World Dev. 2020, 125, 104693. [Google Scholar] [CrossRef]
  6. Simsek, Y.; Santika, W.G.; Anisuzzaman, M.; Urmee, T.; Bahri, P.A.; Escobar, R. An analysis of additional energy requirement to meet the sustainable development goals. J. Clean. Prod. 2020, 272, 122646. [Google Scholar] [CrossRef]
  7. Santika, W.G.; Anisuzzaman, M.; Bahri, P.A.; Shafiullah, G.M.; Rupf, G.V.; Urmee, T. From goals to joules: A quantitative approach of interlinkages between energy and the Sustainable Development Goals. Energy Res. Soc. Sci. 2019, 50, 201–214. [Google Scholar] [CrossRef]
  8. Saidi, K.; Omri, A. The impact of renewable energy on carbon emissions and economic growth in 15 major renewable energy-consuming countries. Environ. Res. 2020, 186, 109567. [Google Scholar] [CrossRef]
  9. Fathima, A.H.; Palanisamy, K. Optimization in microgrids with hybrid energy systems—A review. Renew. Sustain. Energy Rev. 2015, 45, 431–446. [Google Scholar] [CrossRef]
  10. Ringkjøb, H.K.; Haugan, P.M.; Solbrekke, I.M. A review of modelling tools for energy and electricity systems with large shares of variable renewables. Renew. Sustain. Energy Rev. 2018, 96, 440–459. [Google Scholar] [CrossRef]
  11. Cuesta, M.A.; Castillo-Calzadilla, T.; Borges, C.E. A critical analysis on hybrid renewable energy modeling tools: An emerging opportunity to include social indicators to optimise systems in small communities. Renew. Sustain. Energy Rev. 2020, 122, 109691. [Google Scholar] [CrossRef]
  12. Su, W.; Ye, Y.; Zhang, C.; Baležentis, T.; Štreimikienė, D. Sustainable energy development in the major power-generating countries of the European Union: The Pinch Analysis. J. Clean. Prod. 2020, 256, 120696. [Google Scholar] [CrossRef]
  13. Ntanos, S.; Skordoulis, M.; Kyriakopoulos, G.; Arabatzis, G.; Chalikias, M.; Galatsidas, S.; Batzios, A.; Katsarou, A. Renewable energy and economic growth: Evidence from European countries. Sustainability 2018, 10, 2626. [Google Scholar] [CrossRef] [Green Version]
  14. Marinaş, M.C.; Dinu, M.; Socol, A.G.; Socol, C. Renewable energy consumption and economic growth. Causality relationship in Central and Eastern European countries. PLoS ONE 2018, 13, e0202951. [Google Scholar] [CrossRef] [Green Version]
  15. Rafindadi, A.A.; Ozturk, I. Impacts of renewable energy consumption on the German economic growth: Evidence from combined cointegration test. Renew. Sustain. Energy Rev. 2017, 75, 1130–1141. [Google Scholar] [CrossRef]
  16. Zafar, M.W.; Shahbaz, M.; Hou, F.; Sinha, A. From nonrenewable to renewable energy and its impact on economic growth: The role of research & development expenditures in Asia-Pacific Economic Cooperation countries. J. Clean. Prod. 2019, 212, 1166–1178. [Google Scholar] [CrossRef]
  17. Shahbaz, M.; Raghutla, C.; Chittedi, K.R.; Jiao, Z.; Vo, X.V. The effect of renewable energy consumption on economic growth: Evidence from the renewable energy country attractive index. Energy 2020, 207, 118162. [Google Scholar] [CrossRef]
  18. Ben Mbarek, M.; Saidi, K.; Amamri, M. The relationship between pollutant emissions, renewable energy, nuclear energy and GDP: Empirical evidence from 18 developed and developing countries. Int. J. Sustain. Energy 2018, 37, 597–615. [Google Scholar] [CrossRef]
  19. Bhattacharya, M.; Awaworyi Churchill, S.; Paramati, S.R. The dynamic impact of renewable energy and institutions on economic output and CO2 emissions across regions. Renew. Energy 2017, 111, 157–167. [Google Scholar] [CrossRef]
  20. Candra, O.; Chammam, A.; Alvarez, J.R.N.; Muda, I.; Aybar, H.Ş. The Impact of Renewable Energy Sources on the Sustainable Development of the Economy and Greenhouse Gas Emissions. Sustainability 2023, 15, 2104. [Google Scholar] [CrossRef]
  21. Hou, H.; Lu, W.; Liu, B.; Hassanein, Z.; Mahmood, H.; Khalid, S. Exploring the Role of Fossil Fuels and Renewable Energy in Determining Environmental Sustainability: Evidence from OECD Countries. Sustainability 2023, 15, 2048. [Google Scholar] [CrossRef]
  22. Wang, Q.; Zhan, L. Assessing the sustainability of renewable energy: An empirical analysis of selected 18 European countries. Sci. Total Environ. 2019, 692, 529–545. [Google Scholar] [CrossRef]
  23. Davidson, N.; Maksimova, E.; Mariev, O. How does renewable energy consumption affect economic growth? Evidence from the European Union countries. SHS Web Conf. 2021, 129, 09005. [Google Scholar] [CrossRef]
  24. Abbasi, K.; Jiao, Z.; Shahbaz, M.; Khan, A. Asymmetric impact of renewable and non-renewable energy on economic growth in Pakistan: New evidence from a nonlinear analysis. Energy Explor. Exploit. 2020, 38, 1946–1967. [Google Scholar] [CrossRef]
  25. European Parliament and of the Council. Council Directive 2008/1/EC of the European Parliament and of the Council of European Commission of 15 January 2008 Concerning Integrated Pollution Prevention and Control. Available online: http://data.europa.eu/eli/dir/2008/1/oj (accessed on 28 November 2022).
  26. European Parliament and of the Council. Directive 2012/19/EU of the European Parliament and of the Council of 4 July 2012 on Waste Electrical and Electronic Equipment (WEEE) (Recast) Text with EEA Relevance. Available online: http://data.europa.eu/eli/dir/2012/19/oj (accessed on 28 November 2022).
  27. Elkington, J. Towards the Sustainable Corporation: Win-Win-Win Business Strategies for Sustainable Development. Calif. Manag. Rev. 1994, 36, 90–100. [Google Scholar] [CrossRef]
  28. Elkington, J. Partnerships fromcannibals with forks: The triple bottom line of 21st-century business. Environ. Qual. Manag. 1998, 8, 37–51. [Google Scholar] [CrossRef]
  29. Kirchherr, J.; Reike, D.; Hekkert, M. Conceptualizing the circular economy: An analysis of 114 definitions. Resour. Conserv. Recycl. 2017, 127, 221–232. [Google Scholar] [CrossRef]
  30. Iddrisu, I.; Bhattacharyya, S.C. Sustainable Energy Development Index: A multi-dimensional indicator for measuring sustainable energy development. Renew. Sustain. Energy Rev. 2015, 50, 513–530. [Google Scholar] [CrossRef] [Green Version]
  31. Kahraman, C.; Kaya, I.; Cebi, S. A comparative analysis for multiattribute selection among renewable energy alternatives using fuzzy axiomatic design and fuzzy analytic hierarchy process. Energy 2009, 34, 1603–1616. [Google Scholar] [CrossRef]
  32. Štreimikiene, D.; Šliogeriene, J.; Turskis, Z. Multi-criteria analysis of electricity generation technologies in Lithuania. Renew. Energy 2016, 85, 148–156. [Google Scholar] [CrossRef]
  33. Al Garni, H.; Kassem, A.; Awasthi, A.; Komljenovic, D.; Al-Haddad, K. A multicriteria decision making approach for evaluating renewable power generation sources in Saudi Arabia. Sustain. Energy Technol. Assess. 2016, 16, 137–150. [Google Scholar] [CrossRef]
  34. Velenturf, A.P.M.; Purnell, P. Principles for a sustainable circular economy. Sustain. Prod. Consum. 2021, 27, 1437–1457. [Google Scholar] [CrossRef]
  35. Bali Swain, R.; Ranganathan, S. Modeling interlinkages between sustainable development goals using network analysis. World Dev. 2021, 138, 105136. [Google Scholar] [CrossRef]
  36. Liu, G. Development of a general sustainability indicator for renewable energy systems: A review. Renew. Sustain. Energy Rev. 2014, 31, 611–621. [Google Scholar] [CrossRef]
  37. Bouyssou, D. Building Criteria: A Prerequisite for MCDA. In Readings in Multiple Criteria Decision Aid; Bana e Costa, C.A., Ed.; Springer: Berlin/Heidelberg, German, 1990; pp. 58–80. [Google Scholar] [CrossRef]
  38. Hák, T.; Janoušková, S.; Moldan, B. Sustainable Development Goals: A need for relevant indicators. Ecol. Indic. 2016, 60, 565–573. [Google Scholar] [CrossRef]
  39. Pintér, L.; Hardi, P.; Bartelmus, P. Sustainable Development Indicators: Proposals for the Way Forward; International Institute for Sustainable Development: New York, NY, USA, 2005; pp. 1–35. Available online: https://sostenibilidadurbana.files.wordpress.com/2008/12/measure_isd_way_forward_un-dsd.pdf (accessed on 20 November 2022).
  40. Krellenberg, K.; Kopfmüller, J.; Arton, J. How Sustainable Is Santiago de Chile? Current Performance, Future Trends, Potential Measures. Leipzig: Helmholtz-Centre for Environmental Research—UFZ. October 2010. Available online: https://www.dlr.de/dlr/Portaldata/1/Resources/documents/2011_1/Synthesis_Report_Megacities_english.pdf (accessed on 20 November 2022).
  41. Rickels, W.; Dovern, J.; Hoffmann, J.; Quaas, M.F.; Schmidt, J.O.; Visbeck, M. Indicators for monitoring sustainable development goals: An application to oceanic development in the European Union. Earths Future 2016, 4, 252–267. [Google Scholar] [CrossRef] [Green Version]
  42. Alfsen, K.H.; Greaker, M. From natural resources and environmental accounting to construction of indicators for sustainable development. Ecol. Econ. 2007, 61, 600–610. [Google Scholar] [CrossRef] [Green Version]
  43. Schultz, J.; Brand, F.; Kopfmüller, J.; Ott, K. Building a ‘theory of sustainable development’: Two salient conceptions within the German discourse. Int. J. Environ. Sustain. Dev. 2008, 7, 465–482. [Google Scholar] [CrossRef]
  44. Dawoud, S.M.; Lin, X.; Okba, M.I. Hybrid renewable microgrid optimization techniques: A review. Renew. Sustain. Energy Rev. 2018, 82, 2039–2052. [Google Scholar] [CrossRef]
  45. Tezer, T.; Yaman, R.; Yaman, G. Evaluation of approaches used for optimization of stand-alone hybrid renewable energy systems. Renew. Sustain. Energy Rev. 2017, 73, 840–853. [Google Scholar] [CrossRef]
  46. Bekhrad, K.; Aslani, A.; Mazzuca-Sobczuk, T. Energy security in Andalusia: The role of renewable energy sources. Case Stud. Chem. Environ. Eng. 2020, 1, 100001. [Google Scholar] [CrossRef]
  47. Cîrstea, S.D.; Moldovan-Teselios, C.; Cîrstea, A.; Turcu, A.C.; Darab, C.P. Evaluating renewable energy sustainability by composite index. Sustainability 2018, 10, 811. [Google Scholar] [CrossRef] [Green Version]
  48. International Energy Agency. International Energy Agency (IEA) World Energy Outlook 2022. Available online: https://www.iea.org/reports/world-energy-outlook-2022 (accessed on 20 November 2022).
  49. Saaty, T.L. The Analytic Hierarchy Process: Planning, Priority Setting, Resource Allocation, 1st ed.; McGraw-Hill International Book Co.: New York, NY, USA, 1980; pp. 271–278. ISBN 100070543712. [Google Scholar]
  50. Doukas, H.; Psarras, J. A linguistic decision support model towards the promotion of renewable energy. Energy Sources B Econ. Plan. Policy 2009, 4, 166–178. [Google Scholar] [CrossRef]
  51. Grilli, G.; De Meo, I.; Garegnani, G.; Paletto, A. A multi-criteria framework to assess the sustainability of renewable energy development in the Alps. J. Environ. Plan. Manag. 2017, 60, 1276–1295. [Google Scholar] [CrossRef]
  52. Saaty, T.L. The Analytic Hierarchy Process: Decision Making in Complex Environments. In Quantitative Assessment in Arms Control, 1st ed.; Springer: Boston, MA, USA, 1984; pp. 285–308. ISBN 978-1-4613-2805-6. [Google Scholar] [CrossRef]
  53. Ahmad, S.; Tahar, R.M. Selection of renewable energy sources for sustainable development of electricity generation system using analytic hierarchy process: A case of Malaysia. Renew. Energy 2014, 63, 458–466. [Google Scholar] [CrossRef]
  54. Mastrocinque, E.; Ramírez, F.J.; Honrubia-Escribano, A.; Pham, D.T. An AHP-based multi-criteria model for sustainable supply chain development in the renewable energy sector. Expert Syst. Appl. 2020, 150, 113321. [Google Scholar] [CrossRef]
  55. Haddad, B.; Liazid, A.; Ferreira, P. A multi-criteria approach to rank renewables for the Algerian electricity system. Renew. Energy 2017, 107, 462–472. [Google Scholar] [CrossRef]
  56. Shaaban, M.; Scheffran, J.; Böhner, J.; Elsobki, M. Sustainability Assessment of Electricity Generation Technologies in Egypt Using Multi-Criteria Decision Analysis. Renew. Energy 2017, 107, 462–472. [Google Scholar] [CrossRef] [Green Version]
  57. Atilgan, B.; Azapagic, A. An integrated life cycle sustainability assessment of electricity generation in Turkey. Energy Policy 2016, 93, 168–186. [Google Scholar] [CrossRef]
  58. Lee, C.W.; Zhong, J. Construction of a responsible investment composite index for renewable energy industry. Renew. Sustain. Energy Rev. 2015, 51, 288–303. [Google Scholar] [CrossRef]
  59. Dhital, R.P.; Pyakurel, P.; Bajracharya, T.R.; Shrestha, R. Framework for sustainability assessment of renewable energy projects in nepal. Int. J. Anal. Hierarchy Process 2014, 6, 76–92. [Google Scholar] [CrossRef]
  60. Dombi, M.; Kuti, I.; Balogh, P. Sustainability assessment of renewable power and heat generation technologies. Energy Policy 2014, 67, 264–271. [Google Scholar] [CrossRef]
  61. Demirtas, O. Evaluating the Best Renewable Energy Technology for Sustainable Energy Planning. Int. J. Energy Econ. Policy 2013, 3, 23–33. [Google Scholar]
  62. Dimić, V.; Milošević, M.; Milošević, D.; Stević, D. Adjustable model of renewable energy projects for sustainable development: A case study of the Nišava District in Serbia. Sustainability 2018, 10, 755. [Google Scholar] [CrossRef] [Green Version]
  63. Ligus, M. Evaluation of Economic, Social and Environmental Effects of Low-Emission Energy Technologies Development in Poland: A Multi-Criteria Analysis with Application of a Fuzzy Analytic Hierarchy Process (FAHP). Energies 2017, 10, 1550. [Google Scholar] [CrossRef] [Green Version]
  64. Ertay, T.; Kahraman, C.; Kaya, I. Evaluation of renewable energy alternatives using MACBETH and fuzzy AHP multicriteria methods: The case of Turkey. Technol. Econ. Dev. Econ. 2013, 19, 38–62. [Google Scholar] [CrossRef] [Green Version]
  65. Heo, E.; Kim, J.; Boo, K.J. Analysis of the assessment factors for renewable energy dissemination program evaluation using fuzzy AHP. Renew. Sustain. Energy Rev. 2010, 14, 2214–2220. [Google Scholar] [CrossRef]
  66. Shen, Y.C.; Lin, G.T.R.; Li, K.P.; Yuan, B.J.C. An assessment of exploiting renewable energy sources with concerns of policy and technology. Energy Policy 2010, 38, 4604–4616. [Google Scholar] [CrossRef]
  67. Chang, D.-Y. Applications of the extent analysis method on fuzzy AHP. Eur. J. Oper. Res. 1996, 95, 649–655. [Google Scholar] [CrossRef]
  68. Emrouznejad, A.; Ho, W. Fuzzy Analytic Hierarchy Process; CRC Press: Boca Raton, FL, USA, 2017; pp. 3–407. ISBN 9781498732468. [Google Scholar] [CrossRef]
  69. Kourkoumpas, D.S.; Benekos, G.; Nikolopoulos, N.; Karellas, S.; Grammelis, P.; Kakaras, E. A review of key environmental and energy performance indicators for the case of renewable energy systems when integrated with storage solutions. Appl. Energy 2018, 231, 380–398. [Google Scholar] [CrossRef]
  70. Onat, N.; Bayar, H. The sustainability indicators of power production systems. Renew. Sustain. Energy Rev. 2010, 14, 3108–3115. [Google Scholar] [CrossRef]
  71. Shaaban, M.; Scheffran, J. Selection of sustainable development indicators for the assessment of electricity production in Egypt. Sustain. Energy Technol. Assess. 2017, 22, 65–73. [Google Scholar] [CrossRef]
  72. Boran, F.E. A new approach for evaluation of renewable energy resources: A case of Turkey. Energy Sources B Econ. Plan. Policy 2018, 13, 196–204. [Google Scholar] [CrossRef]
  73. Ifaei, P.; Karbassi, A.; Lee, S.; Yoo, C.K. A renewable energies-assisted sustainable development plan for Iran using techno-econo-socio-environmental multivariate analysis and big data. Energy Convers Manag. 2017, 153, 257–277. [Google Scholar] [CrossRef]
  74. Strantzali, E.; Aravossis, K. Decision making in renewable energy investments: A review. Renew. Sustain. Energy Rev. 2016, 55, 885–898. [Google Scholar] [CrossRef]
  75. Diemuodeke, E.O.; Hamilton, S.; Addo, A. Multi-criteria assessment of hybrid renewable energy systems for Nigeria’s coastline communities. Energy Sustain. Soc. 2016, 6, 26. [Google Scholar] [CrossRef] [Green Version]
  76. Şengül, Ü.; Eren, M.; Eslamian Shiraz, S.; Gezder, V.; Sengül, A.B. Fuzzy TOPSIS method for ranking renewable energy supply systems in Turkey. Renew. Energy 2015, 75, 617–625. [Google Scholar] [CrossRef]
  77. Mourmouris, J.C.; Potolias, C. A multi-criteria methodology for energy planning and developing renewable energy sources at a regional level: A case study Thassos, Greece. Energy Policy 2013, 52, 522–530. [Google Scholar] [CrossRef]
  78. Troldborg, M.; Heslop, S.; Hough, R.L. Assessing the sustainability of renewable energy technologies using multi-criteria analysis: Suitability of approach for national-scale assessments and associated uncertainties. Renew. Sustain. Energy Rev. 2014, 39, 1173–1184. [Google Scholar] [CrossRef]
  79. Zhao, Z.Y.; Chen, Y.L. Critical factors affecting the development of renewable energy power generation: Evidence from China. J. Clean. Prod. 2018, 184, 466–480. [Google Scholar] [CrossRef]
  80. Wang, Q.; Yang, X. Investigating the sustainability of renewable energy—An empirical analysis of European Union countries using a hybrid of projection pursuit fuzzy clustering model and accelerated genetic algorithm based on real coding. J. Clean. Prod. 2020, 268, 121940. [Google Scholar] [CrossRef]
  81. Armeanu, D.Ş.; Vintilǎ, G.; Gherghina, Ş.C. Does renewable energy drive sustainable economic growth? Multivariate panel data evidence for EU-28 countries. Energies 2017, 10, 381. [Google Scholar] [CrossRef] [Green Version]
  82. Böhringer, C.; Cuntz, A.; Harhoff, D.; Asane-Otoo, E. The impact of the German feed-in tariff scheme on innovation: Evidence based on patent filings in renewable energy technologies. Energy Econ. 2017, 67, 545–553. [Google Scholar] [CrossRef]
  83. Stougie, L.; Giustozzi, N.; van der Kooi, H.; Stoppato, A. Environmental, economic and exergetic sustainability assessment of power generation from fossil and renewable energy sources. Int. J. Energy Res. 2018, 42, 2916–2926. [Google Scholar] [CrossRef] [Green Version]
  84. Hanne, L.R.; Ingunn, S.M.; Tor, H.B. Energy Indicators for Electricity Production: Comparing Technologies and the Nature of the Indicators Energy Payback Ratio (EPR), Net Energy Ratio (NER) and Cumulative Energy Demand (CED). Oestfoldforskning. 2012. Available online: https://www.osti.gov/etdeweb/biblio/22000101 (accessed on 22 November 2022).
  85. Yu, S.; Zheng, Y.; Li, L. A comprehensive evaluation of the development and utilization of China’s regional renewable energy. Energy Policy 2019, 127, 73–86. [Google Scholar] [CrossRef]
  86. Duarte, R.; García-Riazuelo, Á.; Sáez, L.A.; Sarasa, C. Analysing citizens’ perceptions of renewable energies in rural areas: A case study on wind farms in Spain. Energy Rep. 2022, 8, 12822–12831. [Google Scholar] [CrossRef]
  87. Zhao, H.; Guo, S. External benefit evaluation of renewable energy power in China for sustainability. Sustainability 2015, 7, 4783–4805. [Google Scholar] [CrossRef] [Green Version]
  88. International Energy Agency (IEA). Energy Efficiency Investment, 2015–2021. Available online: https://www.iea.org/data-and-statistics/charts/energy-efficiency-investment-2015-2021 (accessed on 22 November 2022).
  89. Gyamfi, B.A.; Kwakwa, P.A.; Adebayo, T.S. Energy intensity among European Union countries: The role of renewable energy, income and trade. Int. J. Energy Sect. Manag. 2023, 17, 801–819. [Google Scholar] [CrossRef]
  90. Pratama, Y.W.; Purwanto, W.W.; Tezuka, T.; McLellan, B.C.; Hartono, D.; Hidayatno, A.; Daud, Y. Multi-objective optimization of a multiregional electricity system in an archipelagic state: The role of renewable energy in energy system sustainability. Renew. Sustain. Energy Rev. 2017, 77, 423–439. [Google Scholar] [CrossRef]
  91. Ghenai, C.; Albawab, M.; Bettayeb, M. Sustainability indicators for renewable energy systems using multi-criteria decision-making model and extended SWARA/ARAS hybrid method. Renew. Energy 2020, 146, 580–597. [Google Scholar] [CrossRef]
  92. Dominković, D.F.; Bačeković, I.; Pedersen, A.S.; Krajačić, G. The future of transportation in sustainable energy systems: Opportunities and barriers in a clean energy transition. Renew. Sustain. Energy Rev. 2018, 82, 1823–1838. [Google Scholar] [CrossRef]
  93. SDSN; IEEP. The 2019 Europe Sustainable Development Report. Sustainable Development Solutions Network and Institute for European Environmental Policy; Pica Publishing: Paris, France; Brussels, Belgium, 2019. [Google Scholar]
  94. Kylili, A.; Thabit, Q.; Nassour, A.; Fokaides, P.A. Adoption of a holistic framework for innovative sustainable renewable energy development: A case study. In Energy Sources, Part A: Recovery, Utilization, and Environmental Effects; Taylor and Francis: Abingdon, UK, 2021; pp. 1–21. [Google Scholar] [CrossRef]
  95. Huck, W.; Maaß, J.; Sood, S.; Benmaghnia, T.; Heß, S.M. Framework and content of energy transition in Southeast Asia with ASEAN and the EU. J. World Energy Law Bus. 2022, 15, 396–408. [Google Scholar] [CrossRef]
  96. Nouri, A.; Khadem, S.; Mutule, A.; Papadimitriou, C.; Stanev, R.; Cabiati, M.; Keane, A.; Carroll, P. Identification of Gaps and Barriers in Regulations, Standards, and Network Codes to Energy Citizen Participation in the Energy Transition. Energies 2022, 15, 856. [Google Scholar] [CrossRef]
  97. Mata Pérez, M.d.l.E.; Scholten, D.; Stegen, K.S. The multi-speed energy transition in Europe: Opportunities and challenges for EU energy security. Energy Strategy Rev. 2019, 26, 100415. [Google Scholar] [CrossRef]
  98. Wise, D.N.; Stoilov, D. Energy Integration in the European Union—Traditional Approaches and Future Research Avenues. In Proceedings of the 13th Electrical Engineering Faculty Conference (BulEF), Varna, Bulgaria, 8–11 September 2021. [Google Scholar] [CrossRef]
  99. Rajavuori, M.; Huhta, K. Investment screening: Implications for the energy sector and energy security. Energy Policy 2020, 144, 111646. [Google Scholar] [CrossRef]
  100. Jałowiec, T.; Wojtaszek, H.; Miciuła, I. Green Energy Management through the Implementation of RES in the EU. Analysis of the Opinions of Poland and Germany. Energies 2021, 14, 8097. [Google Scholar] [CrossRef]
Figure 1. Methodology of study.
Sustainability 15 10084 g001
Figure 2. Viewpoints of SD regarding to its drivers.
Sustainability 15 10084 g002
Figure 3. Fuzzy membership function and associated numbers. The intersection between M1 and M2.
Sustainability 15 10084 g003
Figure 4. Sustainable hierarchy model to evaluate alternative countries in RE.
Sustainability 15 10084 g004
Figure 5. Non-fuzzy expert viewpoints on indicator weights (consider 0 is low and 10 is high level).
Sustainability 15 10084 g005
Figure 6. Determinants impacting sustainability of RE.
Sustainability 15 10084 g006
Table 1. The literature of RE sustainability assessment using AHP and FAHP.
MethodologyDriversScope of SustainabilityRef.
AHPEnvironment, Economic, SocialAssessing Sustainability of RE[54]
AHPEnvironment, Economic, Social, TechnicalRE Technology and Systems Assessment[56]
AHPEnvironment, Economic, Social, TechnicalRE Sources[55]
AHPEnvironment, Economic, SocialAssessing RE Power Generation[57]
AHPEnvironment, Economic, Social, TechnicalAssessing RE Power Generation[33]
AHPEnvironment, Economic, Social, InstitutionalRE Investment[58]
AHPEnvironment, Economic, Social, TechnicalRE Sources[53]
AHPEnvironment, Economic, Social, TechnicalAssessing Sustainability of RE[59]
AHPEnvironment, Economic, SocialRE Technology and Systems Assessment[60]
AHPEnvironment, Economic, Social, TechnicalRE Technology and Energy Planning[61]
FAHPEnvironment, Technical, OrganizationalRE Projects[62]
FAHPEnvironment, Economic, SocialRE Technology and Systems Assessment[63]
FAHPEnvironment, Economic, Social, TechnicalRE Technology and Systems Assessment[64]
FAHPEnvironment, Economic, Social, Technical, InstitutionalRE Projects[65]
FAHPEnergy, Environment, EconomicRE Projects[66]
FAHPEnvironment, Economic, Social, TechnicalRE Technology and Energy Planning[31]
Table 2. The relevant triangular fuzzy numbers and linguistic expressions.
Saaty ScaleThe Verbal Expression of the Comparative Situation of i with Respect to jFuzzy Triangular Scale
1Preferred equally(1, 1, 1)
2In between(1, 2, 3)
3Preferred moderately(2, 3, 4)
4In between(3, 4, 5)
5Preferred strongly(4, 5, 6)
6In between(5, 6, 7)
7Very strongly preferred(6, 7, 8)
8In between(7, 8, 9)
9Extremely preferred(9, 9, 9)
Table 3. Pairwise comparison (decision matrix) between alternatives (Aij) and criteria (Cj). j = 1–9 (the number of selected alternatives introduced in the last section).
For Criteria jth
(Cj)
Alternatives
A1,1A2,2Ai,j
A1,11.001.001.001.002.335.00l1,jm1,ju1,j
A2,20.200.731.001.001.001.00l2,jm2,ju2,j
..........
..........
..........
Ai,jlj,1mj,1uj,1lj,2mj,2ui,21.001.001.00
Table 4. Indicators, their orientation towards SD, and their units.
Indicator/(Criteria)GermanyFranceItalySpainNetherlandsPolandSwedenBelgiumIrelandDirectionUnitRefs.
Employment rate (C1)0.1110.0970.0860.0740.1170.1020.0990.0950.105+%[31,58,63,73,81,82]
HDI (C2)0.1020.0980.0970.0980.1020.0950.1020.1010.102+%[11]
GDP (C3)0.3550.3250.2670.2350.4190.1380.4480.3600.705+Euro per capita/100,000[47]
GHG emission (C4)9.566.016.625.8010.2910.334.809.5612.90Ton per capita[66,78,83,84]
Economy growth rate (C5)2.606.806.705.504.906.805.107.6013.60+%[47,85]
Crime rate (C6)35.7951.9944.8533.3227.1630.5048.0044.5845.51Ratio[86]
Corruption (C7)807156618256857374%[58]
Dependency on fossil fuels (C8)31,64719,91623,87322,76948,68830,11117,52548,10428,473Terawatt-hours[11,87]
Inflation rate (C9)3.22.11.93.02.85.22.73.22.4Ratio[47,58]
Energy intensity (C10)2.763.292.542.643.053.423.803.871.32+Kilograms of oil equivalent[48,88,89]
Energy consumption per capita (C11)152.00144.00107.20117.40198.20117.20218.90235.80125.00Gigajoules per capita[11,74,77]
General energy production/population (C12)48.3773.9624.5330.8564.9159.75136.4849.1228.92+Terajoule per population[11,74,77]
Share of RE (C13)0.0540.0130.0480.0660.0350.0120.0300.0400.074+Ratio[85,90]
Table 5. Countries’ rank and scores and the level of sustainability.
RankCountryScoreGroupLevel of Sustainability
1Sweden0.24493Aadvanced
2Belgium0.15568Aadvanced
3Ireland0.11353Aadvanced
4France0.088433Bmoderate
5Germany0.08781Bmoderate
6Spain0.087076Bmoderate
7Netherlands0.076209Clower
8Poland0.059668Clower
9Italy0.053094Clower
Table 6. Ranking countries regarding drivers’ criteria.
Drivers
SocialEnvironmentalInstitutional
CountryC1CountryC2CountryC6CountryC4CountryC7
Netherlands1Sweden1Netherlands1Sweden1Italy1
Germany 2Ireland2Poland2Spain2Poland2
Ireland3Germany 3Spain3France 3Spain3
Poland4Netherlands4Germany 4Italy4France 4
Sweden5Belgium5Belgium5Germany 5Belgium5
France 6Spain6Italy6Belgium6Ireland6
Belgium7France 7Ireland7Netherlands7Germany 7
Italy8Italy8Sweden8Poland8Netherlands8
Spain9Poland9France 9Ireland9Sweden9
Energy
CountryC8CountryC10CountryC11CountryC12CountryC13
Sweden1Belgium1Italy1Sweden1Ireland1
France 2Sweden2Poland2France 2Spain2
Spain3Poland3Spain3Netherlands3Germany 3
Italy4France 4Ireland4Poland4Italy4
Ireland5Netherlands5France 5Belgium5Belgium5
Poland6Germany 6Germany 6Germany 6Netherlands6
Germany 7Spain7Netherlands7Spain7Sweden7
Belgium8Italy8Sweden8Ireland8France 8
Netherlands9Ireland9Belgium9Italy9Poland9
Economic
CountryC3CountryC5CountryC9
Ireland1Ireland1Italy1
Sweden2Belgium2France 2
Netherlands3France 3Ireland3
Belgium4Poland4Sweden4
Germany 5Italy5Netherlands5
France 6Spain6Spain6
Italy7Sweden7Germany 7
Spain8Netherlands8Belgium8
Poland9Germany 9Poland9
Disclaimer/Publisher’s Note: The statements, opinions and data contained in all publications are solely those of the individual author(s) and contributor(s) and not of MDPI and/or the editor(s). MDPI and/or the editor(s) disclaim responsibility for any injury to people or property resulting from any ideas, methods, instructions or products referred to in the content.

