Abstract
Litter has become a social problem. To prevent litter, we consider urban planning, the efficient placement of garbage bins, and interventions with litterers. In order to carry out these actions, we need to comprehensively grasp the types and locations of litter in advance. However, with the existing methods, collecting the types and locations of litter is very costly and has low privacy. In this research, we have proposed the conceptual design to estimate the types and locations of litter using only the sensor data from a smartwatch worn by the user. This system can record the types and locations of litter only when a user raps on the litter and picks it up. Also, we have constructed a sound recognition model to estimate the types of litter by using sound sensor data, and we have carried out experiments. We have confirmed that the model built with other people’s data enabled to estimate the F-measure of 80.2% in a noisy environment through the experiment with 12 participants.
1. Introduction
Litter has become a social problem. According to Maria et al. [1], 6 trillion cigarettes are consumed annually worldwide, and 4.5 trillion of them become litter. Also, Teuten et al. [2] showed that litter became a potential threat to the terrestrial environment, such as killing wildlife. Japan has a similar problem, in which wild deer have died after eating litter. Some people volunteer as litter pickers in Nara Park, but we have not reached a fundamental solution. To solve this problem, we consider urban planning, the efficient placement of litter bins, and interventions with litterers. For this purpose, we need to comprehensively grasp the types and locations of litter.
However, related research has shown some problems such as coverage and labor cost to comprehensively identify the types and locations of litter. Therefore, our research objective is to collect the types and locations of litter with high coverage, low labor cost, low operational cost, and privacy security. To achieve our objective, we focus on people who pick up litter regularly. Specifically, we have proposed that if litter pickers who wear smartwatches just rap on the litter, they record the types and locations of the litter. Processing within the smartwatch allows the system to operate in non-networked environments and protects privacy as this system does not upload sound data to the cloud. If a lot of litter pickers use this system, we can collect comprehensive litter data and prevent litter in advance. This system is effective not only in Nara Park but also in any area where people are picking up litter.
In this project, we proposed a conceptual design for estimating the types and locations of litter using only sensor data from a smartwatch. The system can collect the types and locations of litter when a user picks up litter by only rapping on the litter and recording the sound data. Also, we constructed a sound recognition model, named ACOustic-based litter Garbage REcognition (ACOGARE), to estimate the types of litter by using acoustic sensor data (Figure 1).
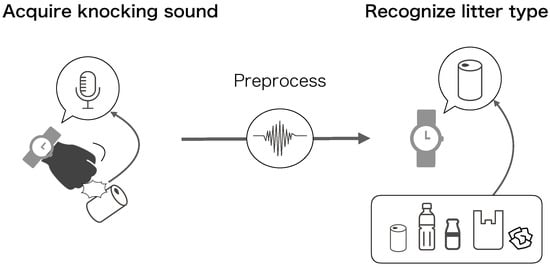
Figure 1.
Overview of ACOGARE.
We carried out experiments to evaluate the accuracy of the model under different conditions. We collected sound data from 12 people. Further, we constructed the model by changing the person who collected the litter, the machine learning method, and varied the sound environment from quiet to noisy. We confirmed that the model built with the other 11 subjects resulted in an F-measure of 80.2% with high accuracy in a noisy environment. The contributions are as follows:
- We proposed a conceptual design for estimating the types and locations of litter.
- We developed a new sound recognition model, ACOGARE, that estimated the types of litter by only rapping on it by hand.
- We confirmed the proposed model achieved an F-measure of 80.2% through leave-one-person-out cross-validation in a noisy environment.
2. Related Research
There are many related studies. Here, we organize the relevant research using several items needed for the task of classifying litter in Table 1. The first is what the method classifies (target), the second is what the hardware of the method is (device), and the third is what the method uses as input data (data source). The fourth is picking up litter by using the method (pick up). The fifth is the extent to which the distribution of litter can be discerned (coverage). The sixth is the cost of recording the distribution of litter (labor). The seventh is the operational cost of the method (operation). Finally, the eighth is whether the method entails any privacy issues (privacy).

Table 1.
Summary of related work on litter detection and our approach.
2.1. Manually Recording Types and Locations of Litter
Some studies [3,4] collected data using litter directly picked up by litter investigators and classified the litter manually. The coverage is high because the litter pickers collect litter on a fine scale to obtain its distribution. The labor cost is high because the investigators write each litter location on a map by hand. The operational cost is high because of the need to pay litter investigators. Privacy is not an issue because no electronic devices are used. Hayase et al. [5] used fixed cameras to collect video data and classify litter manually. Thus, this method cannot pick up the litter. The coverage is low and the operational and labor costs are high because many fixed cameras need to be prepared and litter investigators need to be compensated for classifying litter from video data. The privacy is low because video data are acquired. Pirika [6] is a social networking application for volunteer litter pickers. Litter pickers can upload photos of litter using their smartphones. This application classifies litter manually. This method can pick up litter. The coverage is high because litter pickers pick up litter comprehensively. The labor cost is high because the litter pickers need to be paid for taking a picture of each piece of litter with a smartphone and uploading it to the server. The operational cost is high because Pirika employees have to classify the uploaded image data manually. The privacy is low because image data are acquired.
2.2. Automatic Recording of Types and Locations of Litter
SpotGarbage [7] is a novel smartphone app aimed at engaging citizens to report litter. This app detects and coarsely segments garbage regions in a user-clicked geo-tagged image. The app utilizes the proposed deep architecture of fully convolutional networks for detecting garbage in images. The coverage is high because litter pickers pick up litter comprehensively. The labor cost is high because the litter pickers need to be paid for taking a picture of each piece of litter with a smartphone and uploading it to the server. The operational cost is low because SpotGarbage classifies the image data automatically. The privacy is low because image data are acquired. Other studies [8,9,10,11,12,13,14,15,16,17,18,19,20,21,22,23,24] used a fixed camera to collect videos and classify litter images by machine learning. Thus, this method cannot pick up litter. The coverage is low and the operational cost is high because many fixed cameras need to be prepared and litter investigators need to be compensated. The data processing labor cost is low because these methods classify litter automatically. The privacy is low because video data are acquired. Mikami et al. [25] used fixed cameras on litter trucks to collect videos and classify litter bags by machine learning. Thus, this method cannot pick up litter. The coverage is somewhat high and the operational cost is somewhat low because comprehensive data are collected simply by attaching fixed cameras to existing litter trucks. However, it is not possible to collect data on hidden litter (e.g., in bushes). The labor cost is low because these systems classify litter automatically. The privacy is low because video data are acquired. Some studies [26,27,28,29,30] collected video from cameras mounted on robots and classified litter by machine learning. This method can pick up litter. The coverage is high because the robot picks litter up to classify it. The labor cost is low because these systems classify litter automatically. The operational cost is high because it is expensive to prepare many robots. The privacy is low because video data are acquired. Takanome [31] collected video data from smartphone cameras of litter investigators who uploaded video, from which the litter was classified by machine learning. Thus, this method cannot pick up litter. The coverage is somewhat high and the labor cost is low because comprehensive litter data are collected by simply walking along a road and taking pictures with smartphones. However, it is not possible to collect data on hidden litter. The operational cost is high because many litter investigators need to be employed. The privacy is low because video data are acquired.
2.3. Research Requirements
The research requirements for the task of determining the distribution of litter are as follows:
- High coverage: We need to obtain the types and locations of litter throughout the world.
- Low labor cost: We aim to avoid needing additional human resources to record the types and locations of litter.
- Low finance cost: This system needs to have low operational costs to improve sustainability.
- Privacy security: The privacy of the data acquired by this system needs to be protected in a practical way.
3. Conceptual Design
3.1. System Concept
For data collection, we focus on smartwatches, which are worn by many people in daily life, as an approach to achieve the purpose of our study. If we are able to record the types and locations of litter with a simple motion while wearing a smartwatch, we are able to obtain comprehensive litter data without requiring much effort from users.
We set an overarching goal. We propose a system for estimating the types and locations of litter using only audio sensor data from a smartwatch. The concept of the proposed system is shown below (Figure 2). The system can record the types and locations of litter using only the sound made when a user picks up litter. Specifically, the system recognizes the pre-action of picking up litter by machine learning. The input data of machine learning are acceleration and angular velocity from an IMU sensor in a smartwatch (Phase 1). If the system recognizes that motion, the system activates the smartwatch microphone. A user “raps” on the litter before picking it up. Then, the system activates, collects the sound generated by this action, and estimates the type of litter by sound recognition (Phase 2). There are several studies on sound recognition [32,33]; therefore, we adopted this method. The system can record the locations of the litter by using the location information from GPS in a smartwatch (Phase 3) (to obtain the locations in Phase 3, we will use CLLManager [34] of the apple library). Then, by transmitting the types and locations of the litter to a cloud server (Phase 4) and plotting the type of litter on a map based on the location information (Phase 5), we can determine the distribution of litter. Using this system, litter pickers can comprehensively record the types and locations of litter by simply picking up the litter with little effort. As a result, we can prevent litter by installing litter bins and signs at the locations where people litter.
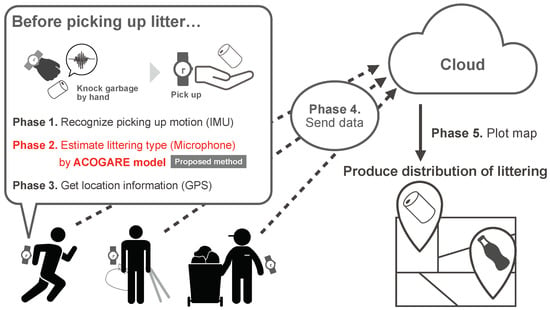
Figure 2.
Conceptual design.
3.2. Strength of System
As we discussed previously [6], the coverage is high because litter pickers pick up litter comprehensively. Also, the labor cost of this system is lower than that in [3,6] because the user only raps on the litter before they pick it up. The operational cost of the proposed system is low because, to use this system, litter pickers only need to wear a smartwatch and install an application. As we remarked in Section 1, the proposed system operates in non-networked environments and does not upload sound data to the cloud. Specifically, the proposed system can classify litter by edge computing from audio streaming data, and the acquired audio data can be deleted. By uploading only the recognized results to the cloud, the privacy of the proposed system is safer than the existing methods [6,7,8,9,10,11,12,13,14,15,16,17,18,19,20,21,22,23,24,25,26,27,28,29,30,31].
In this paper, we focus on Phase 2. Specifically, we describe below the construction procedure for the sound recognition model ACOGARE and its feature selection method.
4. Proposed Method
We provide the details of ACOGARE in this section. Figure 3 shows the architecture of ACOGARE. First, the system extracts the sound at the time when a user raps on the litter and preprocesses the sound data (Step 1). Next, the system extracts features from the sound data (Step 2). The features are described in Section 4.2. Finally, the system builds a litter recognition model using the extracted features (Step 3). To select the types of estimating litter, checking the survey of “The Beverage Industry Environment Beautification Association”, cigarettes, paper, and plastic were the top three littering categories in the ranking of the amount of litter [35]. But, when a user raps on cigarettes, ACOGARE does not recognize cigarettes because of them making no sound. Therefore, in this study, we exclude cigarettes as the types of estimating litter. In addition to paper and plastic, we select cans, glass bottles, and PET bottles, which are common beverage containers, as the types of estimating litter.
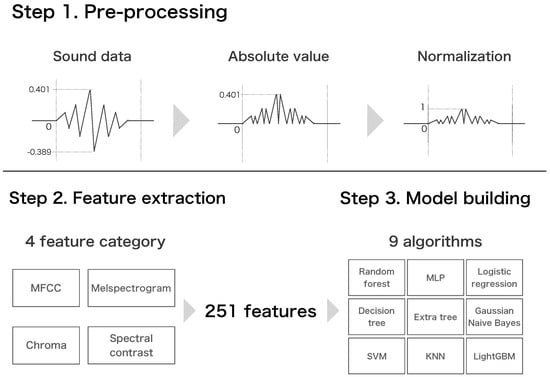
Figure 3.
Architecture of ACOGARE.
4.1. Preprocessing
ACOGARE preprocesses the sound data as follows:
- Step 1-1:
- Cut waveforms for sound data.
- Step 1-2:
- Convert the separated waveform data into absolute values.
- Step 1-3:
- Perform normalization to eliminate differences in amplitude between users.
Because ACOGARE does not need the interval where the sound of rapping on litter is not generated to improve recognition accuracy, ACOGARE cut the interval (Step 1-1). Also, because the strength and the way of rapping vary greatly for litter pickers, we have to take this into account. Figure 4 shows a comparison of the amplitudes of different users rapping on a can. From Figure 4, we can see that the amplitude of the rapping is very different for each user. If ACOGARE estimates the types of litter without any preprocessing, the recognition accuracy will decrease. Therefore, ACOGARE takes the absolute value of the cut sound data and normalizes it to unify the maximum value of the amplitude and to improve recognition accuracy (Step 1-2, Step 1-3).
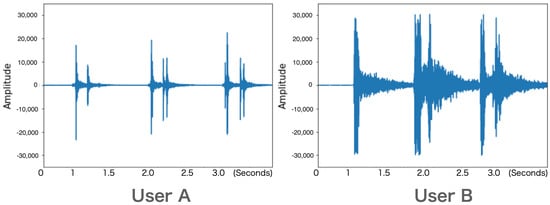
Figure 4.
Comparison of amplitudes for different users.
ACOGARE performs these steps using sound libraries such as Rosakit [36] and librosa [37] that can preprocess and extract features from sound data.
4.2. Feature Extraction
Table 2 shows the list of features that ACOGARE extracts from the sound data. These features are commonly used in sound recognition [38,39] and can be extracted by using sound libraries as mentioned in Section 4.1.

Table 2.
List of feature values.
The mel-frequency cepstral coefficient (MFCC) is a feature that is obtained by performing a fast Fourier transform (FFT) on sound data, and then an inverse discrete cosine is applied to transform the output through a mel filter bank. Chroma is a feature that is a superposition of all the components of the same scale in different octaves, reduced to the 12 components of the chromatic scale within an octave. A melspectrogram is a spectrogram created after the FFT and the frequency is converted to the mel scale. The spectral contrast is a feature that is obtained by applying an FFT, passing the result through an octave filter bank, processing to detect and extract the peak, and finally transforming using the Karhunen–Levé method [40].
4.3. Model Building
We chose nine machine learning methods for two reasons (Figure 3). The first reason is that they are commonly used methods [41,42]. Second, ACOGARE has to adopt a method that has both high accuracy and lightweight to be processed on the smartwatch. As deep learning algorithms do not meet the requirement of lightweight, this paper does not use deep learning algorithms to build a model for litter type recognition. We describe how we searched for the most accurate method among these nine methods in Section 5.
Random forest is an ensemble learning method that generates a large number of decision trees and aggregates the results of each to make predictions. The multi-layer perceptron (MLP) is one of the simplest deep learning methods, in which the input, hidden, and output layers are fully coupled. It is a regression model for classification problems. The decision tree method combines classification and regression trees to analyze data with a tree diagram. The extra tree method is basically the same algorithm as the random forest, but it is characterized by the random selection of features when dividing the nodes of the tree. Naive Bayes is a fast classification algorithm that uses Bayes’ theorem and is suitable for high-dimensional datasets. In particular, Gaussian Naive Bayes is a classifier for continuous data. KNN computes the distance between the data from the explanatory variables and estimates the class by majority vote from k classes that are close to the data to be classified. SVM is a method that incorporates margin maximization to achieve a regression model with a high generalization performance even with small amounts of data. LightGBM is a gradient boosting framework based on the decision tree algorithm. It is characterized by its high inference speed.
ACOGARE estimates the type of litter using machine learning libraries such as Core ML [43] and scikit-learn [44] which can estimate the type from sound data.
5. Evaluation
5.1. Experimental Objective
To design our system to record the types and locations of litter when a user raps on it, we gave high priority to the accuracy of estimating the type of litter from the rapping sound. If the estimation of the litter type is wrong, the user has to change the labeling setting manually, which is time-consuming and increases the difficulty of satisfying the purpose of our research. An effective method would be to build a separate model for each user, but this would be very costly. If a model built using a fixed amount of training data is highly accurate for estimating the type of sound made by other people rapping on litter, then it is not necessary to build a separate model for each user. As another approach to improve the accuracy of the model, the selection of machine learning methods is important. Some machine learning methods are better at classification than others, depending on the characteristics of the data, so it is necessary to select the most appropriate method. In addition, when considering the operation of the system, it is essential that the estimation accuracy of the model is high even in a noisy environment. When a person raps on litter and picks it up, there is a high possibility that the system will also detect various other environmental sounds, and it is necessary to build a model that can deal with these sounds.
In this experiment, we tested the degree of difference between two methods for estimating the type of litter. One method uses an estimator trained only from the sound data of each user. The second method uses an estimator trained only from the sound data of other people. Similarly, we tested which machine learning method had the highest accuracy. We also tested whether the estimation accuracy of the model was sufficient in a noisy environment.
5.2. Dataset
5.2.1. Dataset for a Quiet Environment
We refer to the sound data for each item collected by the subject as a sample. The sound caused when the subject rapped on the litter was measured using the microphone built into the smartwatch. The smartwatch used in this experiment was the Apple Watch Series 5. The sampling rate for data collection was set to 44,100 Hz. The experimenter prepared 10 pieces of each of the 5 types of litter (Figure 5). The subject collected the samples with a dedicated data collection application. A total of 12 university students, specifically 11 males and 1 female, participated in the experiment. The experimenter built an estimation model from the collected sound data in a quiet environment. The following procedure was used to collect the data: 250 samples per person, for 3000 samples in total.
- Process 1:
- To approximate the scene in which this system is used, the subject first put on a work glove. To facilitate the collection of sound data in this experiment, each subject wore a smartwatch on the wrist of his or her dominant hand and rapped on the litter.
- Process 2:
- The experimenter set the subject’s name and the type of litter in the data collection application (Figure 6).
- Process 3:
- The subject pressed the “start” button of the data collection application (Figure 6) and rapped on the litter three times.
- Process 4:
- The subject repeated Step 3 five times for each piece of litter (Figure 7).
- Process 5:
- When the experimenter had rapped on all 10 pieces of one type of litter, they returned to Step 2. Then, the experimenter set the type of litter to another type and the subject repeated Step 3 and Step 4 in the same way. When the subject had picked up all litter types, they pressed the “send [to] server” button to send the data to the server, and the experiment was over.
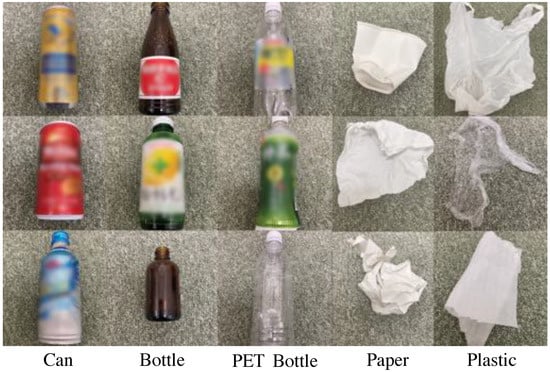
Figure 5.
Examples of each litter type.
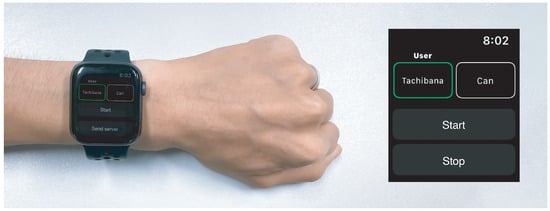
Figure 6.
Data collection application screen.
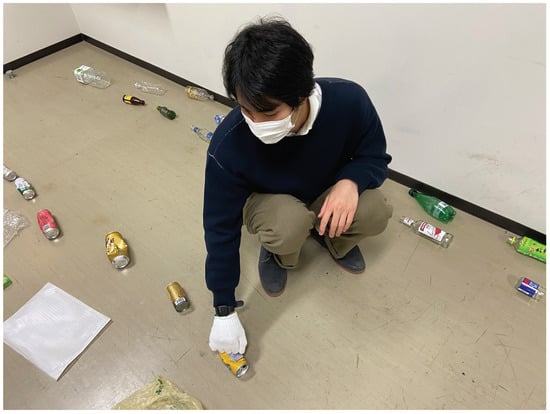
Figure 7.
Example of experimental scene.
5.2.2. Dataset for a Noisy Environment
To determine whether the accuracy of the model is sufficient for a noisy environment, the collected 3000 samples were combined with environmental sounds to evaluate the model. We downloaded and used 100 free environmental sound data samples from a website [45]. Using specialized software, we randomly selected 5 of the 100 environmental sound samples and created a synthesized sound for each of the 5 environmental sounds with 1 sample. By performing the above operations on all the samples, a total of 15,000 samples were created.
5.3. Method of Evaluation
In this section, we describe the evaluation methods using the dataset constructed in Section 5.2. The first is the in-subject (InSub) method, which builds and evaluates a model from data for only one subject. The second is the leave-one-subject-out (LOSO) method, which uses a model built with data from the 11 other users to validate the accuracy. The accuracy of the model was calculated for these two methods by adding the condition of the presence of environmental noise. We use accuracy, precision, recall, and F-measure as the evaluation metrics. Accuracy is the percentage of data that the system correctly estimates out of all estimates of the type of litter from the litter sound data. Precision is the proportion of the data that is actually litter of that type, in comparison with all litter estimated as being that type from the litter sound. Recall is the proportion of the data that is correctly estimated from the actual litter sound. The F-measure is the harmonic mean of precision and recall. The four evaluation methods are described below.
5.3.1. InSub Method (w/o Noise)
We preprocessed 250 supervised samples per subject by normalizing them to a maximum value of 1 and a minimum value of 0 (Step 2). This eliminated the difference in amplitude between each person when rapping on the litter. The feature values (251 dimensions) were calculated from the preprocessed sound data (Step 3). The extracted features were used to construct a model (Step 4) that was evaluated using the 10-segment cross-validation method. The machine learning was validated using nine machine learning methods (Section 4.3). Specifically, the 250 supervised samples were divided into 10 parts comprising 225 training samples and 25 estimation samples. Then, the accuracy, precision, recall, and F-measure were calculated.
5.3.2. LOSO Method (w/o Noise)
This task was to merge all 2750 samples other than those for one subject and estimate the type of litter from 250 samples for the subject that was left out. The rest of the process is the same as that for the InSub method (w/o noise).
5.3.3. InSub Method (w/ Noise)
The model was built using the dataset created in Section 5.2.2. Specifically, the 1250 samples were divided into 10 parts comprising 1125 training samples and 125 estimation samples, and the F-measure values were calculated by using machine learning methods. The rest of the process is the same as that for the InSub method (w/o noise).
5.3.4. LOSO Method (w/ Noise)
The model was built using the dataset created in Section 5.2.2. Specifically, we merged all 13,750 non-subject samples and performed the task of estimating the litter type from the subject’s 1250 samples. The rest of the process is the same as that for the InSub method (w/o noise).
As testing methods, to compare the accuracy of the machine learning methods, we used a one-way analysis of variance and Tukey’s multiple comparison test. We used a t-test for a comparison of a quiet environment and a noisy environment. We also used a t-test for a comparison between the data of others and the user.
5.4. Results
The experimental results are shown in Table 3 and Table 4. In the tables, the F-measures of random forest, MLP, and LightGBM are higher than the other machine learning models in all methods, except logistic regression is higher than MLP in InSub (w/ noise). Therefore, we have chosen these three for comparison. We conducted a one-way analysis of variance among the InSub (w/o noise) methods and found a significant trend at the 10% level. Tukey’s multiple comparison test was performed on the results, and no difference was found between the methods. Tukey’s multiple comparison test indicated a significant difference at the 1% level between LightGBM and MLP, and random forest and MLP. A one-way analysis of variance between the LOSO (w/o noise) methods showed a significant trend at the 10% level. Tukey’s multiple comparison test showed a significant trend at the 10% level between the LightGBM and MLP methods. The results of Tukey’s multiple comparison test showed that there was a significant difference at the 5% level between the LightGBM and MLP methods. The results of Tukey’s multiple comparison test showed a significant difference at the 5% level between LightGBM and MLP and a significant trend at the 10% level between random forest and MLP. From the results in Table 3 and Table 4, and the test, it can be concluded that LightGBM is the most accurate model. Similarly, the F-measure of the random forest method is also high. This indicates that the ensemble learning method using decision trees can classify the type of litter from the sound of litter with high accuracy.

Table 3.
Evaluation Result for InSub Method.

Table 4.
Evaluation Results for LOSO Method.
For a comparison between the InSub method and the LOSO method and between a quiet environment and a noisy environment, LightGBM was adopted as the machine learning method because it was the most accurate method based on the test results. First, we focused on the results for the F-measure of the different methods. We performed a t-test on the results for the InSub and LOSO methods and found that the InSub (w/o noise) method significantly outperformed the LOSO (w/o noise) method at the 5% level. The InSub (w/ noise) method also significantly outperformed the LOSO (w/ noise) method at the 1% level. Second, we focused on the results for the F-measure of the different environments. We performed a t-test on the results for the InSub and LOSO methods and found that the InSub (w/ noise) method significantly outperformed the InSub (w/o noise) method at the 1% level. The LOSO (w/o noise) method also significantly outperformed the LOSO (w/ noise) method at the 1% level. The summary of the experiment is as follows:
- The F-measure of LightGBM is the highest out of the other machine learning methods.
- The InSub method outperformed the LOSO method.
- In the LOSO method, the models built in a quiet environment outperformed the models built in a noisy environment.
6. Discussion
6.1. Possibility of Classification Model
Table 3 shows that the InSub method has higher model accuracy than does the LOSO method, regardless of a quiet or noisy environment. The difference in accuracy between the two methods is expected, because the sound of rapping on litter varies depending on each subject. However, the F-measure for the LOSO method (w/o noise) is 88.5%, and that for the LOSO method (w/ noise) is 80.2%, which is satisfactory for somewhat reliable classification. Therefore, there is no need to build a separate model for each user.
Also, to improve the F-measure, we consider the tendency of each subject in the LOSO method (w/ noise). The first tendency is a pattern like that of subject A, as shown in Figure 8, which enables us to estimate the litter type from its rapping sound with high accuracy. The second trend is misrecognition of plastic as paper, which results in lower overall accuracy, as shown in Figure 9. For cans, bottles, and PET bottles, the accuracy of the model is high because the materials are uniform and make consistently similar sounds. In contrast, the model for paper uses different materials, such as paper cups and tissue, and for plastic, candy bags and plastic bags. However, we believe that this problem can be solved by collecting data from a large number of plastic and paper materials to build a model.
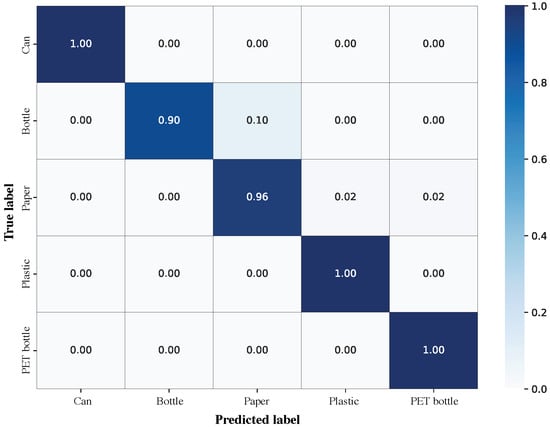
Figure 8.
Confusion matrix for subject A (LOSO, w/ noise).
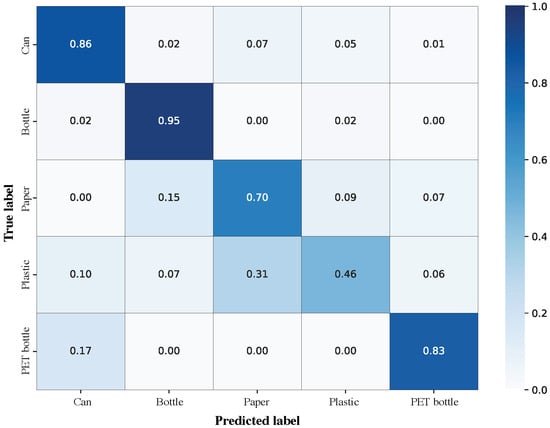
Figure 9.
Confusion matrix for subject B (LOSO, w/ noise).
6.2. Practical Scenario
Practical scenarios are shown in Table 5. We describe practical scenarios based on the results of the proposed method. The user raps on the litter three times before picking it up. The proposed method classifies the type of litter on smartwatches by the sound data obtained at that time. Therefore, the proposed method enables us to consider privacy. From the experimental results, the proposed method makes misjudgments about one out of five times, but in that case, the user is able to modify the misjudgment manually. The proposed system can easily obtain the locations of litter by using the GPS installed in smartwatches. Therefore, users can collect and upload the types and locations of litter at a low cost, although the user sometimes needs to modify the misjudgment results. By many users using this system, it is possible to realize a participatory sensing system [46] that collects a wide range of litter information at a low cost.

Table 5.
Practical scenarios.
This scenario is more useful than other methods. In the [3,4] method, litter pickers manually pick up litter and record it on the map. This method is high coverage because the litter pickers pick up litter comprehensively. Also, there is safety of privacy with this method because litter pickers pick up litter and record the type and location of litter manually. But, it takes time and effort to manually enter the types and locations of litter each time. In the [6,7] method, litter pickers take a picture of litter with a smartphone and pick it up. This method analyzes the captured image data and records the type and location of the litter. This method is high coverage because litter pickers pick up litter comprehensively. But, litter pickers have to take out their smartphone every time to take a picture, so it takes time and effort. In the [5,8,9,10,11,12,13,14,15,16,17,18,19,20,21,22,23,24,25] method, people who want to know the distribution of litter install a fixed camera and take a video. This method analyzes the image data and records the types and locations of the litter. This method collects the type of litter with a low labor cost because they only install the fixed camera. But, they are not able to collect the types and the locations of litter from wide locations. In the [26,27,28,29,30] method, people who want to know the distribution of litter operate the robot and analyze the image data obtained from the robot’s eyes. This method analyzes video data and records the types and locations of the litter. This method collects the type of litter with a low labor cost because robots collect the littering data automatically. But, they are only able to obtain the data where the robot moves. In the [31] method, litter pickers take a picture of the road with a smartphone. This method analyzes the image data and records the types and locations of the litter. This method has a little low labor cost because if litter pickers just take a picture of the road with a smartphone, they collect the types and locations of the litter. But, there is a possibility that other people may appear in the image because the user takes a video in a wide range, and there is a risk of infringing on privacy. From the comparison with existing methods, we think that the proposed method is practical.
6.3. Future Work
6.3.1. Consolidation and Visualization of Litter
Finally, we describe the design of the function for aggregating the types and locations of litter and plotting the litter type on a map (Phases 4–5), as described in Section 3. First, we sent the data on the types and locations of litter obtained in Phases 1–3 to a database from a smartwatch. Next, we visualized the aggregated data. An example of the visualized distribution map for litter is shown in Figure 10. The distribution map is obtained from the database and displayed using OpenStreetMap [47]. It can be displayed as a heat map or by type of litter.
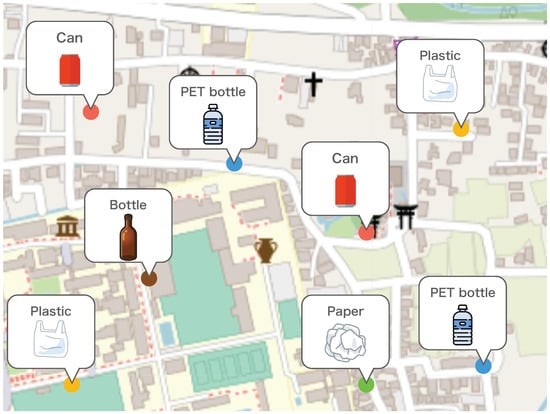
Figure 10.
Example of litter distribution map.
6.3.2. Privacy of System
This system collects sounds for a very short time because the microphone is activated when the system recognizes the action of rapping on litter in Phase 1. Moreover, the system deletes the sound data after estimating the type of litter from the collected sounds, so that the user can use the system with safety greater than a system that uses video data.
6.3.3. Unrecognizable Litter and Misrecognition
As we remarked in Section 4.3, this system does not recognize the type of litter that makes no sound when a user rapped on it, such as cigarettes. To solve this problem, we are considering an approach in which the system can recognize litter that makes no sound by a single tap of the smartwatch screen by the user. In this paper, we conducted the experiment on the premise that the system is enabled to recognize the pre-action of picking up litter. However, if the recognition accuracy is low, we consider adding an action to have the user press a button before picking up litter, such as the data collection method of this experiment (Section 5.2).
6.3.4. Feasibility of Introducing Deep Learning
As we remarked in Section 4.3, this paper did not use deep learning because it is not lightweight. The typical smartwatches are designed with portability and power saving in mind and limited computational resources, such as the CPU and memory. However, many studies use deep learning for human activity recognition [48] and sound recognition [49]. In addition, tools such as Core ML [43] exist that enable deep learning within the edge by optimizing CPU computing resources. Therefore, we consider introducing deep learning when the performance of the CPU and memory in smartwatches improves in the future.
7. Conclusions
In this paper, we proposed a conceptual design to estimate the types and locations of litter using only the sensor data from a smartwatch worn by a litter picker. Also, we proposed a method for building a model to estimate the type of litter. In an experiment and comparisons of different models, we tested the most accurate machine learning method, the accuracy of the models built with personal data and other peoples’ data, and the accuracy of the model in a silent or noisy environment. From the experimental results, we found that the F-measure of LightGBM is the highest in the task of estimating the type of litter from its sound. Also, the InSub method outperformed the LOSO method. In the LOSO method, models built in a quiet environment outperformed models built in a noisy environment. From the experiment, we discussed that the LightGBM model built with other people’s data can estimate an F-measure of 80.2% in a noisy environment, and there is no need to build a separate model for each user. We also discussed that it may be more useful than the existing method in terms of comprehensiveness, labor costs, operation costs, and privacy. From the above, we think that the proposed method is practical.
Author Contributions
Conceptualization, K.T., Y.N. and Y.M.; methodology, K.T., Y.N. and Y.M.; software, K.T.; validation, K.T.; formal analysis, K.T.; investigation, K.T., Y.N., Y.M. and H.S.; resources, Y.N., Y.M., H.S. and K.Y.; data curation, K.T.; writing—original draft preparation, K.T.; writing—review and editing, Y.N., Y.M., H.S. and K.Y.; visualization, K.T.; supervision, Y.N., Y.M., H.S. and K.Y.; project administration, K.T.; funding acquisition, Y.M. All authors have read and agreed to the published version of the manuscript.
Funding
This research was funded by JST PRESTO grant number JPMJPR2039.
Institutional Review Board Statement
The study was conducted according to the guidelines of the Declaration of Helsinki and approved by the Ethical Review Committee of Nara Institute of Science and Technology (2020-I-16).
Informed Consent Statement
Informed consent was waived due to collected data not including private information.
Data Availability Statement
The data presented in this study are available on request from the corresponding author.
Conflicts of Interest
The authors declare no conflict of interest.
References
- Araújo, M.; Costa, M. A critical review of the issue of cigarette butt pollution in coastal environments. Environ. Res. 2019, 172, 137–149. [Google Scholar] [CrossRef] [PubMed]
- Teuten, E.; Saquing, J.; Knappe, D.; Barlaz, M.; Jonsson, S.; Björn, A.; Rowland, S.; Thompson, R.; Galloway, T.; Yamashita, R.; et al. Transport and release of chemicals from plastic to the environment and to wildlife. Philos. Trans. R. Soc. Lond. Ser. B Biol. Sci. 2009, 364, 2027–2045. [Google Scholar] [CrossRef]
- Inoue, Y.; Toda, H. Drifted Litters of Lake Suwa and Upper Reaches of the Tenryu River. Environ. Sci. 2003, 16, 167–178. [Google Scholar] [CrossRef]
- Takahashi, Y.; Ishizaka, K.; Kochizawa, M. Distribution characteristic of potential evaluating prompt degree of littering cigarette. AIJ J. Technol. Des. 2009, 15, 257–260. [Google Scholar] [CrossRef]
- Hayase, K.; Suzuki, K. Fundamental Study about Setting Up an Experimental Field, Analysis of Scattering Wastes and Behavior of People, and their Relations for Prevention of Littering in Public Space. J. Jpn. Soc. Waste Manag. Expert. 1998, 9, 274–280. [Google Scholar] [CrossRef]
- Pirika, Inc. Pirika|Anti-Litter Social Media. Available online: https://en.sns.pirika.org/ (accessed on 9 July 2021).
- Mittal, G.; Yagnik, K.B.; Garg, M.; Krishnan, N.C. SpotGarbage: Smartphone App to Detect Garbage Using Deep Learning. In Proceedings of the 2016 ACM International Joint Conference on Pervasive and Ubiquitous Computing, Heidelberg, Germany, 12–16 September 2016; UbiComp’16. pp. 940–945. [Google Scholar] [CrossRef]
- Huynh, M.; Pham-Hoai, P.T.; Tran, A.K.; Nguyen, T.D. Automated Waste Sorting Using Convolutional Neural Network. In Proceedings of the 2020 7th NAFOSTED Conference on Information and Computer Science (NICS), Ho Chi Minh City, Vietnam, 26–27 November 2020; pp. 102–107. [Google Scholar]
- Ruíz, V.; Sánchez, Á.; Vélez, J.F.; Raducanu, B. Automatic Image-Based Waste Classification. In Proceedings of the International Work-Conference on the Interplay Between Natural and Artificial Computation (IWINAC), Almería, Spain, 3–7 June 2019. [Google Scholar]
- Ahmad, K.; Khan, K.; Al-Fuqaha, A. Intelligent Fusion of Deep Features for Improved Waste Classification. IEEE Access 2020, 8, 96495–96504. [Google Scholar] [CrossRef]
- de Sousa, J.B.; Rebelo, A.; Cardoso, J.S. Automation of Waste Sorting with Deep Learning. In Proceedings of the 2019 XV Workshop de Visão Computacional (WVC), Sao Paulo, Brazil, 9–11 September 2019; pp. 43–48. [Google Scholar]
- Huang, G.; He, J.; Xu, Z.; Huang, G.L. A combination model based on transfer learning for waste classification. Concurr. Comput. Pract. Exp. 2020, 32, e5751. [Google Scholar] [CrossRef]
- Karaca, A.C.; Ertürk, A.; Güllü, M.K.; Elmas, M.; Ertürk, S. Automatic waste sorting using shortwave infrared hyperspectral imaging system. In Proceedings of the 2013 5th Workshop on Hyperspectral Image and Signal Processing: Evolution in Remote Sensing (WHISPERS), Gainesville, FL, USA, 26–28 June 2013; pp. 1–4. [Google Scholar] [CrossRef]
- Yang, Z.; Li, D. WasNet: A Neural Network-Based Garbage Collection Management System. IEEE Access 2020, 8, 103984–103993. [Google Scholar] [CrossRef]
- Zeng, M.; Lu, X.; Xu, W.; Zhou, T.; Liu, Y.B. PublicGarbageNet: A Deep Learning Framework for Public Garbage Classification. In Proceedings of the 2020 39th Chinese Control Conference (CCC), Shenyang, China, 27–29 July 2020; pp. 7200–7205. [Google Scholar]
- Cui, W.; Zhang, W.; Green, J.; Zhang, X.; Yao, X. YOLOv3-darknet with Adaptive Clustering Anchor Box for Garbage Detection in Intelligent Sanitation. In Proceedings of the 2019 3rd International Conference on Electronic Information Technology and Computer Engineering (EITCE), Xiamen, China, 18–20 October 2019; pp. 220–225. [Google Scholar] [CrossRef]
- Carolis, B.D.; Ladogana, F.; Macchiarulo, N. YOLO TrashNet: Garbage Detection in Video Streams. In Proceedings of the 2020 IEEE Conference on Evolving and Adaptive Intelligent Systems (EAIS), Bari, Italy, 27–29 May 2020; pp. 1–7. [Google Scholar] [CrossRef]
- Proença, P.F.; Simões, P. TACO: Trash Annotations in Context for Litter Detection. arXiv 2020, arXiv:2003.06975. [Google Scholar]
- Gyawali, D.; Regmi, A.; Shakya, A.; Gautam, A.; Shrestha, S. Comparative Analysis of Multiple Deep CNN Models for Waste Classification. arXiv 2020, arXiv:2004.02168. [Google Scholar]
- Chu, Y.; Huang, C.; Xie, X.; Tan, B.; Kamal, S.; Xiong, X. Multilayer Hybrid Deep-Learning Method for Waste Classification and Recycling. Comput. Intell. Neurosci. 2018, 2018, 5060857. [Google Scholar] [CrossRef] [PubMed]
- Costa, B.; Bernardes, A.; Pereira, J.; Zampa, V.; Pereira, V.; Matos, G.; Soares, E.; Soares, C.; Silva, A. Artificial Intelligence in Automated Sorting in Trash Recycling. In Proceedings of the Anais do XV Encontro Nacional de Inteligência Artificial e Computacional, Sao Paulo, Brazil, 22–25 October 2018; pp. 198–205. [Google Scholar] [CrossRef]
- Altikat, A.; Gulbe, A.; Altikat, S. Intelligent solid waste classification using deep convolutional neural networks. Int. J. Environ. Sci. Technol. 2022, 19, 1285–1292. [Google Scholar] [CrossRef]
- Adedeji, O.; Wang, Z. Intelligent Waste Classification System Using Deep Learning Convolutional Neural Network. Procedia Manuf. 2019, 35, 607–612. [Google Scholar] [CrossRef]
- Awe, O.; Mengistu, R. Final Report: Smart Trash Net: Waste Localization and Classification. arXiv 2017. [Google Scholar]
- Mikami, K.; Chen, Y.; Nakazawa, J. Using Deep Learning to Count Garbage Bags. In Proceedings of the 16th ACM Conference on Embedded Networked Sensor Systems, Shenzhen, China, 4–7 November 2018; SenSys ’18. pp. 329–330. [Google Scholar] [CrossRef]
- Hong, J.; Fulton, M.; Sattar, J. TrashCan: A Semantically-Segmented Dataset towards Visual Detection of Marine Debris. arXiv 2020, arXiv:2007.08097. [Google Scholar]
- Fulton, M.; Hong, J.; Islam, M.J.; Sattar, J. Robotic Detection of Marine Litter Using Deep Visual Detection Models. In Proceedings of the 2019 International Conference on Robotics and Automation (ICRA), Montreal, QC, Canada, 20–24 May 2019; pp. 5752–5758. [Google Scholar]
- Kraft, M.; Piechocki, M.; Ptak, B.; Walas, K. Autonomous, Onboard Vision-Based Trash and Litter Detection in Low Altitude Aerial Images Collected by an Unmanned Aerial Vehicle. Remote Sens. 2021, 13, 965. [Google Scholar] [CrossRef]
- Verma, V.; Gupta, D.; Gupta, S.; Uppal, M.; Anand, D.; Ortega-Mansilla, A.; Alharithi, F.S.; Almotiri, J.; Goyal, N. A Deep Learning-Based Intelligent Garbage Detection System Using an Unmanned Aerial Vehicle. Symmetry 2022, 14, 960. [Google Scholar] [CrossRef]
- Harada, R.; Oyama, T.; Fujimoto, K.; Shimizu, T.; Ozawa, M.; Samuel, A.J.; Sakai, M. Development of an ai-based illegal dumping trash detection system. Artif. Intell. Data Sci. 2022, 3, 1–9. [Google Scholar] [CrossRef]
- Pirika, Inc. Pirika Research. Available online: https://en.research.pirika.org/ (accessed on 9 July 2021).
- Laput, G.; Xiao, R.; Harrison, C. ViBand: High-Fidelity Bio-Acoustic Sensing Using Commodity Smartwatch Accelerometers. In Proceedings of the 29th Annual Symposium on User Interface Software and Technology, Tokyo, Japan, 16–19 October 2016; UIST ’16. pp. 321–333. [Google Scholar] [CrossRef]
- Jain, D.; Ngo, H.; Patel, P.; Goodman, S.; Findlater, L.; Froehlich, J. SoundWatch: Exploring Smartwatch-Based Deep Learning Approaches to Support Sound Awareness for Deaf and Hard of Hearing Users. In Proceedings of the 22nd International ACM SIGACCESS Conference on Computers and Accessibility, Virtual Event, 26–28 October 2020. ASSETS ’20. [Google Scholar] [CrossRef]
- Apple. CLLocationManager|Apple Developer Documentation. Available online: https://developer.apple.com/documentation/corelocation/cllocationmanager (accessed on 8 May 2022).
- The Beverage Industry Environment Beautification Association (BIEBA). Scattering Survey (FY2016)|Japan Environmental Beautification Association for Food Containers. 2016. Available online: https://www.kankyobika.or.jp/recycle/research/3R-2016 (accessed on 9 July 2021).
- Dhrebeniuk. Rosakit. Available online: https://github.com/dhrebeniuk/RosaKit (accessed on 1 June 2023).
- Librosa. Librosa 0.10.0 Documentation. Available online: https://librosa.org/doc/latest/index.html (accessed on 1 June 2023).
- Gong, T.; Cho, H.; Lee, B.; Lee, S.J. Knocker: Vibroacoustic-Based Object Recognition with Smartphones. Proc. ACM Interact. Mob. Wearable Ubiquitous Technol. 2019, 3, 1–21. [Google Scholar] [CrossRef]
- Zhang, B.; Leitner, J.; Thornton, S. Audio Recognition Using Mel Spectrograms and Convolution Neural Networks; University of California: San Diego, CA, USA, 2019. [Google Scholar]
- Jiang, D.N.; Lu, L.; Zhang, H.; Tao, J.; Cai, L. Music type classification by spectral contrast feature. In Proceedings of the IEEE International Conference on Multimedia and Expo, Lausanne, Switzerland, 26–29 August 2002; Volume 1, pp. 112–116. [Google Scholar]
- Maroco, J.; Silva, D.; Rodrigues, A.; Guerreiro, M.; Santana, I.; de Mendonça, A. Data mining methods in the prediction of Dementia: A real-data comparison of the accuracy, sensitivity and specificity of linear discriminant analysis, logistic regression, neural networks, support vector machines, classification trees and random forests. BMC Res. Notes 2011, 4, 299. [Google Scholar] [CrossRef]
- Sztyler, T.; Stuckenschmidt, H.; Petrich, W. Position-aware activity recognition with wearable devices. Pervasive Mob. Comput. 2017, 38, 281–295. [Google Scholar] [CrossRef]
- Apple. Core ML. Available online: https://developer.apple.com/documentation/coreml (accessed on 30 April 2023).
- Scikit Learn. Scikit-Learn 1.2.2 Documentation. Available online: https://scikit-learn.org/stable/ (accessed on 1 June 2023).
- VSQ Corporation. Free Sound Effects Environment|SPECIAL|VSQ. Available online: https://vsq.co.jp/special/se_environment/ (accessed on 27 April 2021).
- Kawanaka, S.; Matsuda, Y.; Suwa, H.; Fujimoto, M.; Arakawa, Y.; Yasumoto, K. Gamified Participatory Sensing in Tourism: An Experimental Study of the Effects on Tourist Behavior and Satisfaction. Smart Cities 2020, 3, 736–757. [Google Scholar] [CrossRef]
- OSMF. OpenStreetMap. Available online: https://www.openstreetmap.org/copyright/en (accessed on 10 September 2021).
- Helmi, A.M.; Al-qaness, M.A.; Dahou, A.; Abd Elaziz, M. Human activity recognition using marine predators algorithm with deep learning. Future Gener. Comput. Syst. 2023, 142, 340–350. [Google Scholar] [CrossRef]
- Abeßer, J. A Review of Deep Learning Based Methods for Acoustic Scene Classification. Appl. Sci. 2020, 10, 2020. [Google Scholar] [CrossRef]
Disclaimer/Publisher’s Note: The statements, opinions and data contained in all publications are solely those of the individual author(s) and contributor(s) and not of MDPI and/or the editor(s). MDPI and/or the editor(s) disclaim responsibility for any injury to people or property resulting from any ideas, methods, instructions or products referred to in the content. |
© 2023 by the authors. Licensee MDPI, Basel, Switzerland. This article is an open access article distributed under the terms and conditions of the Creative Commons Attribution (CC BY) license (https://creativecommons.org/licenses/by/4.0/).