Article

Designing Iowa Agricultural Landscapes to Improve Environmental Co-Benefits of Bioenergy Production

1
Environmental Sciences Division, Oak Ridge National Laboratory, Oak Ridge, TN 37831, USA
2
Soil, Water and Air Resources Research, Agricultural Research Service, US Department of Agriculture, Ames, IA 50011, USA
3
Antares Group Inc., Harrisonburg, VA 22801, USA
4
Antares Group Inc., Moravia, IA 52571, USA
*
Author to whom correspondence should be addressed.
Retired.
Sustainability 2023, 15(13), 10051; https://doi.org/10.3390/su151310051
Submission received: 18 May 2023 / Revised: 14 June 2023 / Accepted: 19 June 2023 / Published: 25 June 2023

Abstract

:
Cellulosic bioenergy feedstocks are needed to improve carbon (C) management while provisioning biomass for bioproducts and biofuel. The transition to increased cellulosic biomass production can be guided by land management plans designed to improve economic, environmental, and ecological performance. We constructed a sustainability model to compare landscape designs for biofuel production from corn (Zea mays L.) stover and switchgrass (Panicum virgatum L.) in central Iowa, USA. We used the model to compare environmental and socioeconomic outcomes associated with four landscape management strategies, with and without cellulosic biomass markets. We evaluated (1) a fuelshed area containing over 1.2 million ha (3 million acres) of corn and soybean (Glycine max (L.) Merr.) within 80 km (50 miles) of a commercial-scale cellulosic biorefinery in Nevada, Iowa, and (2) the South Fork watershed containing over 72,000 ha (178,000 acres) of these row crops within eight north central Iowa HUC-12 (hydrologic unit code) watersheds. At both landscape scales, we found that it is possible to achieve multiple environmental and socioeconomic benefits concomitantly with cellulosic biomass production by strategically collecting corn stover and converting the 10% of the lowest-profitability row crop land to perennial switchgrass. Potential benefits from landscape design include increased biodiversity, soil and water quality improvements, increased soil carbon sequestration for climate change mitigation, and reduced fertilizer use and cost. Our model results showed that increasing benefits can accrue when complementary conservation practices (e.g., reduced tillage, use of a rye cover crop) are combined and integrated throughout a fuelshed or watershed area. We conclude that ecologically based landscape designs offer valuable insights about costs and benefits of land management alternatives, with relevance for achieving stakeholder goals.

1. Introduction

Increased bioenergy production will be an integral step to mitigating future climate change by displacing fossil fuels over the near term [1]. Prior to heightened concerns about climate change, energy security was a fundamental driver for biofuel development in the US in general, and the midwestern state of Iowa in particular, as shown by the initiatives that arose in response to past cycles of spiking costs for imported petroleum (e.g., 1972, 1978, 2006). In 2006, the Iowa General Assembly passed House File 2754, thereby establishing a goal for Iowa to replace 25% of all petroleum used in the formulation of gasoline in the state with biofuels by 2020 to support local businesses and farmers. For several years, Iowa has been the nation’s top producer of ethanol.
While first-generation ethanol production from corn grain has proven successful, Iowa also has significant supplies of stover (leaves and stalks) from corn (Zea mays L.) that could potentially be used to produce second-generation cellulosic ethanol and other bioproducts. Long-term sustainable production of this cellulosic biofuel will necessitate leaving a portion of corn stover in the fields to protect soils from erosion and nutrient depletion [2,3], with optimal stover removal rates varying by local context [4]. There is also potential for cellulosic ethanol to be produced from periodically harvested perennial grasses planted in strategic locations throughout Iowa to provide ecosystem service benefits [5]. Studies over several decades have shown that switchgrass (Panicum virgatum L.) can stabilize soils and sequester carbon underground with its deep root systems while also improving water quality [6,7,8]. Switchgrass plantings can also improve biodiversity, e.g., by providing breeding and migratory stopover habitats for avian species [9,10].
To explore these opportunities, the US Department of Energy (DOE) funded a collaborative project based in Iowa from August 2016 to September 2021 called “Enabling Sustainable Landscape Design for Continual Improvement of Operating Bioenergy Supply Systems” [11]. This effort brought together private sector partners, researchers from DOE national laboratories, researchers from the US Department of Agriculture (USDA), and researchers and students from several universities to explore opportunities for developing feedstock supplies for commercial-scale cellulosic ethanol production in ways that would promote environmental and socioeconomic co-benefits at landscape scales. Hereafter, we refer to these project collaborators as the Iowa Landscape Design (Iowa LD) team.
One of the goals of the Iowa LD team was to test a framework for assessing landscape-scale sustainability developed by researchers at Oak Ridge National Laboratory. This participatory and iterative approach proposed by Dale et al. [12] involves six steps: (1) define the scope and objectives of the sustainability assessment based on the particular context; (2) identify indicators that can be used to monitor trends or alert pending concerns and select them based on practical utility and relevance; (3) establish baseline and target values for each indicator that can be used to compare alternative scenarios; (4) collect data to assess changes in indicator values over time; (5) analyze indicator trends and potential synergies/tradeoffs among them; and (6) develop good practices that can be shared with other bioenergy projects. We used this systematic indicator-based approach to develop a set of alternative landscape design options and then quantitatively assess the potential for each of these landscape designs to make progress toward a set of sustainability goals previously defined through a series of workshops held with Iowa stakeholders from 2015 to 2017 [13]. After working with the Iowa LD team to discuss and select priority indicators from a starting checklist of 35 indicators in social, environmental, and economic categories, the cross-section of Iowa stakeholders collectively settled upon three project priorities: (1) produce profitable cellulosic feedstock supplies in sufficient quantities for commercial-scale biofuel production; (2) reduce nitrate and phosphorus runoff from nonpoint sources to meet Iowa Nutrient Reduction Strategy goals (https://www.nutrientstrategy.iastate.edu/documents, accessed on 18 June 2023); and (3) improve local pheasant populations for recreational hunting.
In this paper, we test the hypothesis that an agricultural landscape can be designed to achieve multiple stakeholder objectives simultaneously through strategic subfield-scale management decisions. Targets include the production of cellulosic biomass in sufficient quantities for commercial-scale biofuel production without adverse impacts to food production, and with soil and water quality improvements, increased bird habitat, and carbon sequestration for climate change mitigation. We test the possibility of achieving these multiple objectives across two landscape scales: (1) a fuelshed area containing over 1.2 million ha (3 million acres) of corn and soybean (Glycine max (L.) Merr.) within 80 km (50 miles) of a commercial-scale cellulosic biorefinery in Nevada, Iowa, and (2) the South Fork watershed area containing over 72,000 ha (178,000 acres) of these row crops within eight north central Iowa HUC-12 (hydrologic unit code) watersheds. The locations and sizes of these two Iowa landscapes are shown in Figure 1. To test our hypothesis, we first define a base case and three alternative landscape management strategies, with and without cellulosic biomass markets. We then assemble subfield-scale environmental indicator data to represent and quantify the environmental outcomes associated with each scenario. Finally, we construct a model to evaluate the relative sustainability of each scenario at each landscape scale through exploring potential tradeoffs and synergies associated with the environmental indicators and targets.

2. Materials and Methods

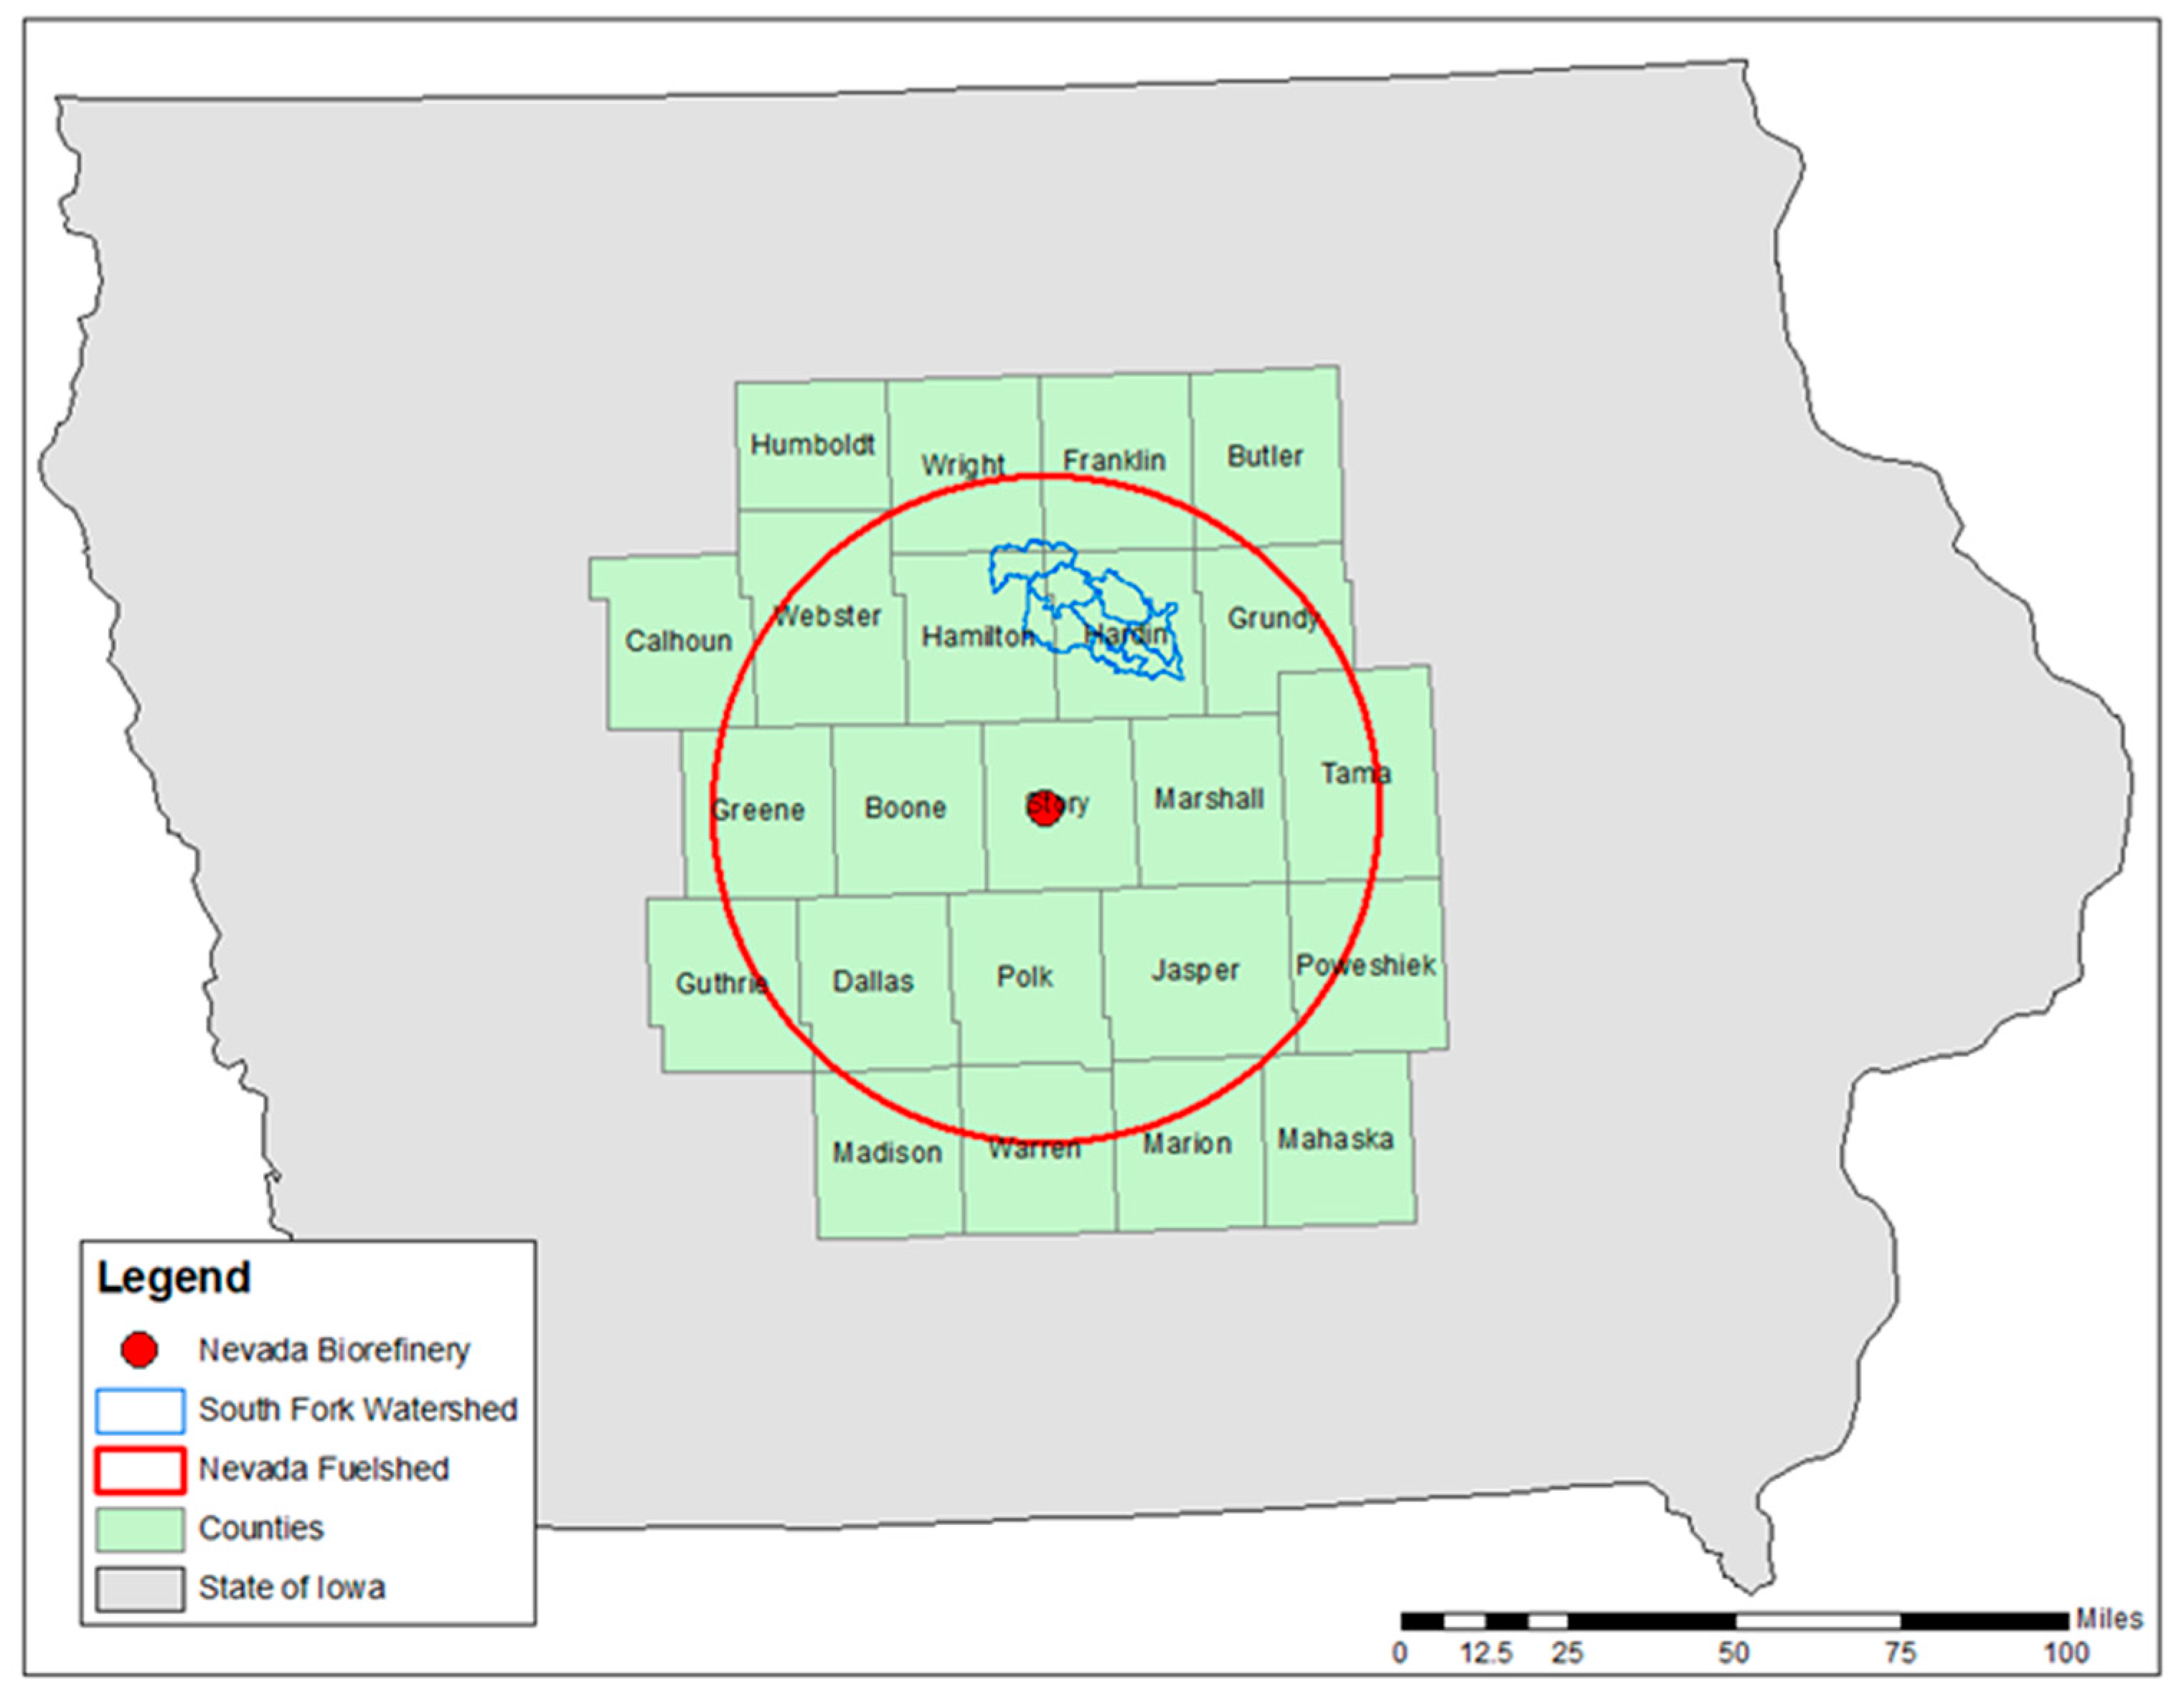
2.1. Agricultural Datasets

EFC Precision Agronomy provided the Iowa LD team with high-resolution geospatial datasets for all of Iowa generated by the Profit Zone ManagerTM (PZM) tool, a tool initiated at Idaho National Laboratory, developed by AgSolver, and now managed by EFC Systems. PZM provides key environmental performance metrics associated with farm management changes at subfield scales. The tool calculates soil loss and organic matter change by combining (1) the USDA NRCS models RUSLE2 for water erosion and WEPS for wind erosion, and (2) the DAYCENT biogeochemistry model for modeling changes in SOC, NO3-N, and CO2 respiration. This integrated modeling framework is deployed on a discretized field grid through PZM at a 10 m spatial resolution, and each grid cell is attributed the multiyear yield and management practices to execute the models. PZM datasets have previously been used to demonstrate that from 5 to 20% of US farmland production units (i.e., individual fields or field segments) are consistently nonprofitable, with low return on investment (ROI) values [14]. PZM has also demonstrated that many of these same acres are often the primary source of unintended environmental concerns including soil erosion, soil carbon loss, and nutrient loss.
The Iowa LD team members were provided with PZM subfield modeling results for 50 alternative cropping scenarios evaluated across the state of Iowa. Collectively, there were environmental results for 48 corn/soybean rotation management scenarios involving combinations of three types of tillage (conventional, reduced, and no-till), use of cover crops (winter rye versus none), corn stover harvest at four different rates (including no residue removal), and two fertilizer application options (fall versus spring). The datasets also included environmental modeling results from two scenarios comparing the effects of replacing acres planted to corn/soybean during 2013 to 2016 with perennial switchgrass (SWG) or Conservation Reserve Program (CRP) grasses. The nomenclature used for the management practices provided in the files is shown in Table 1. A separate PZM file summarized actual ROI data for years 2013 to 2016, with and without CRP rental payments.
We joined the 50 tabular PZM datasets to ArcGIS shapefiles to create “AgSolver” datasets which could be spatially aggregated to provide detailed information about baseline profits and potential environmental effects at county and watershed scales of interest. The AgSolver “clumu” polygons reflect intersections between farm boundaries (defined as common land units (CLUs)), counties, 12-digit HUCs, and SSURGO soil map units. Collectively, this created over 4 million subfield polygons across the state of Iowa, which made visualizing the data with any clarity across 50 different land management scenarios very difficult. Data visualizations rapidly consumed more than 1 terabyte of computer disk storage space, meaning that we needed to carefully define a subset of scenarios to investigate.

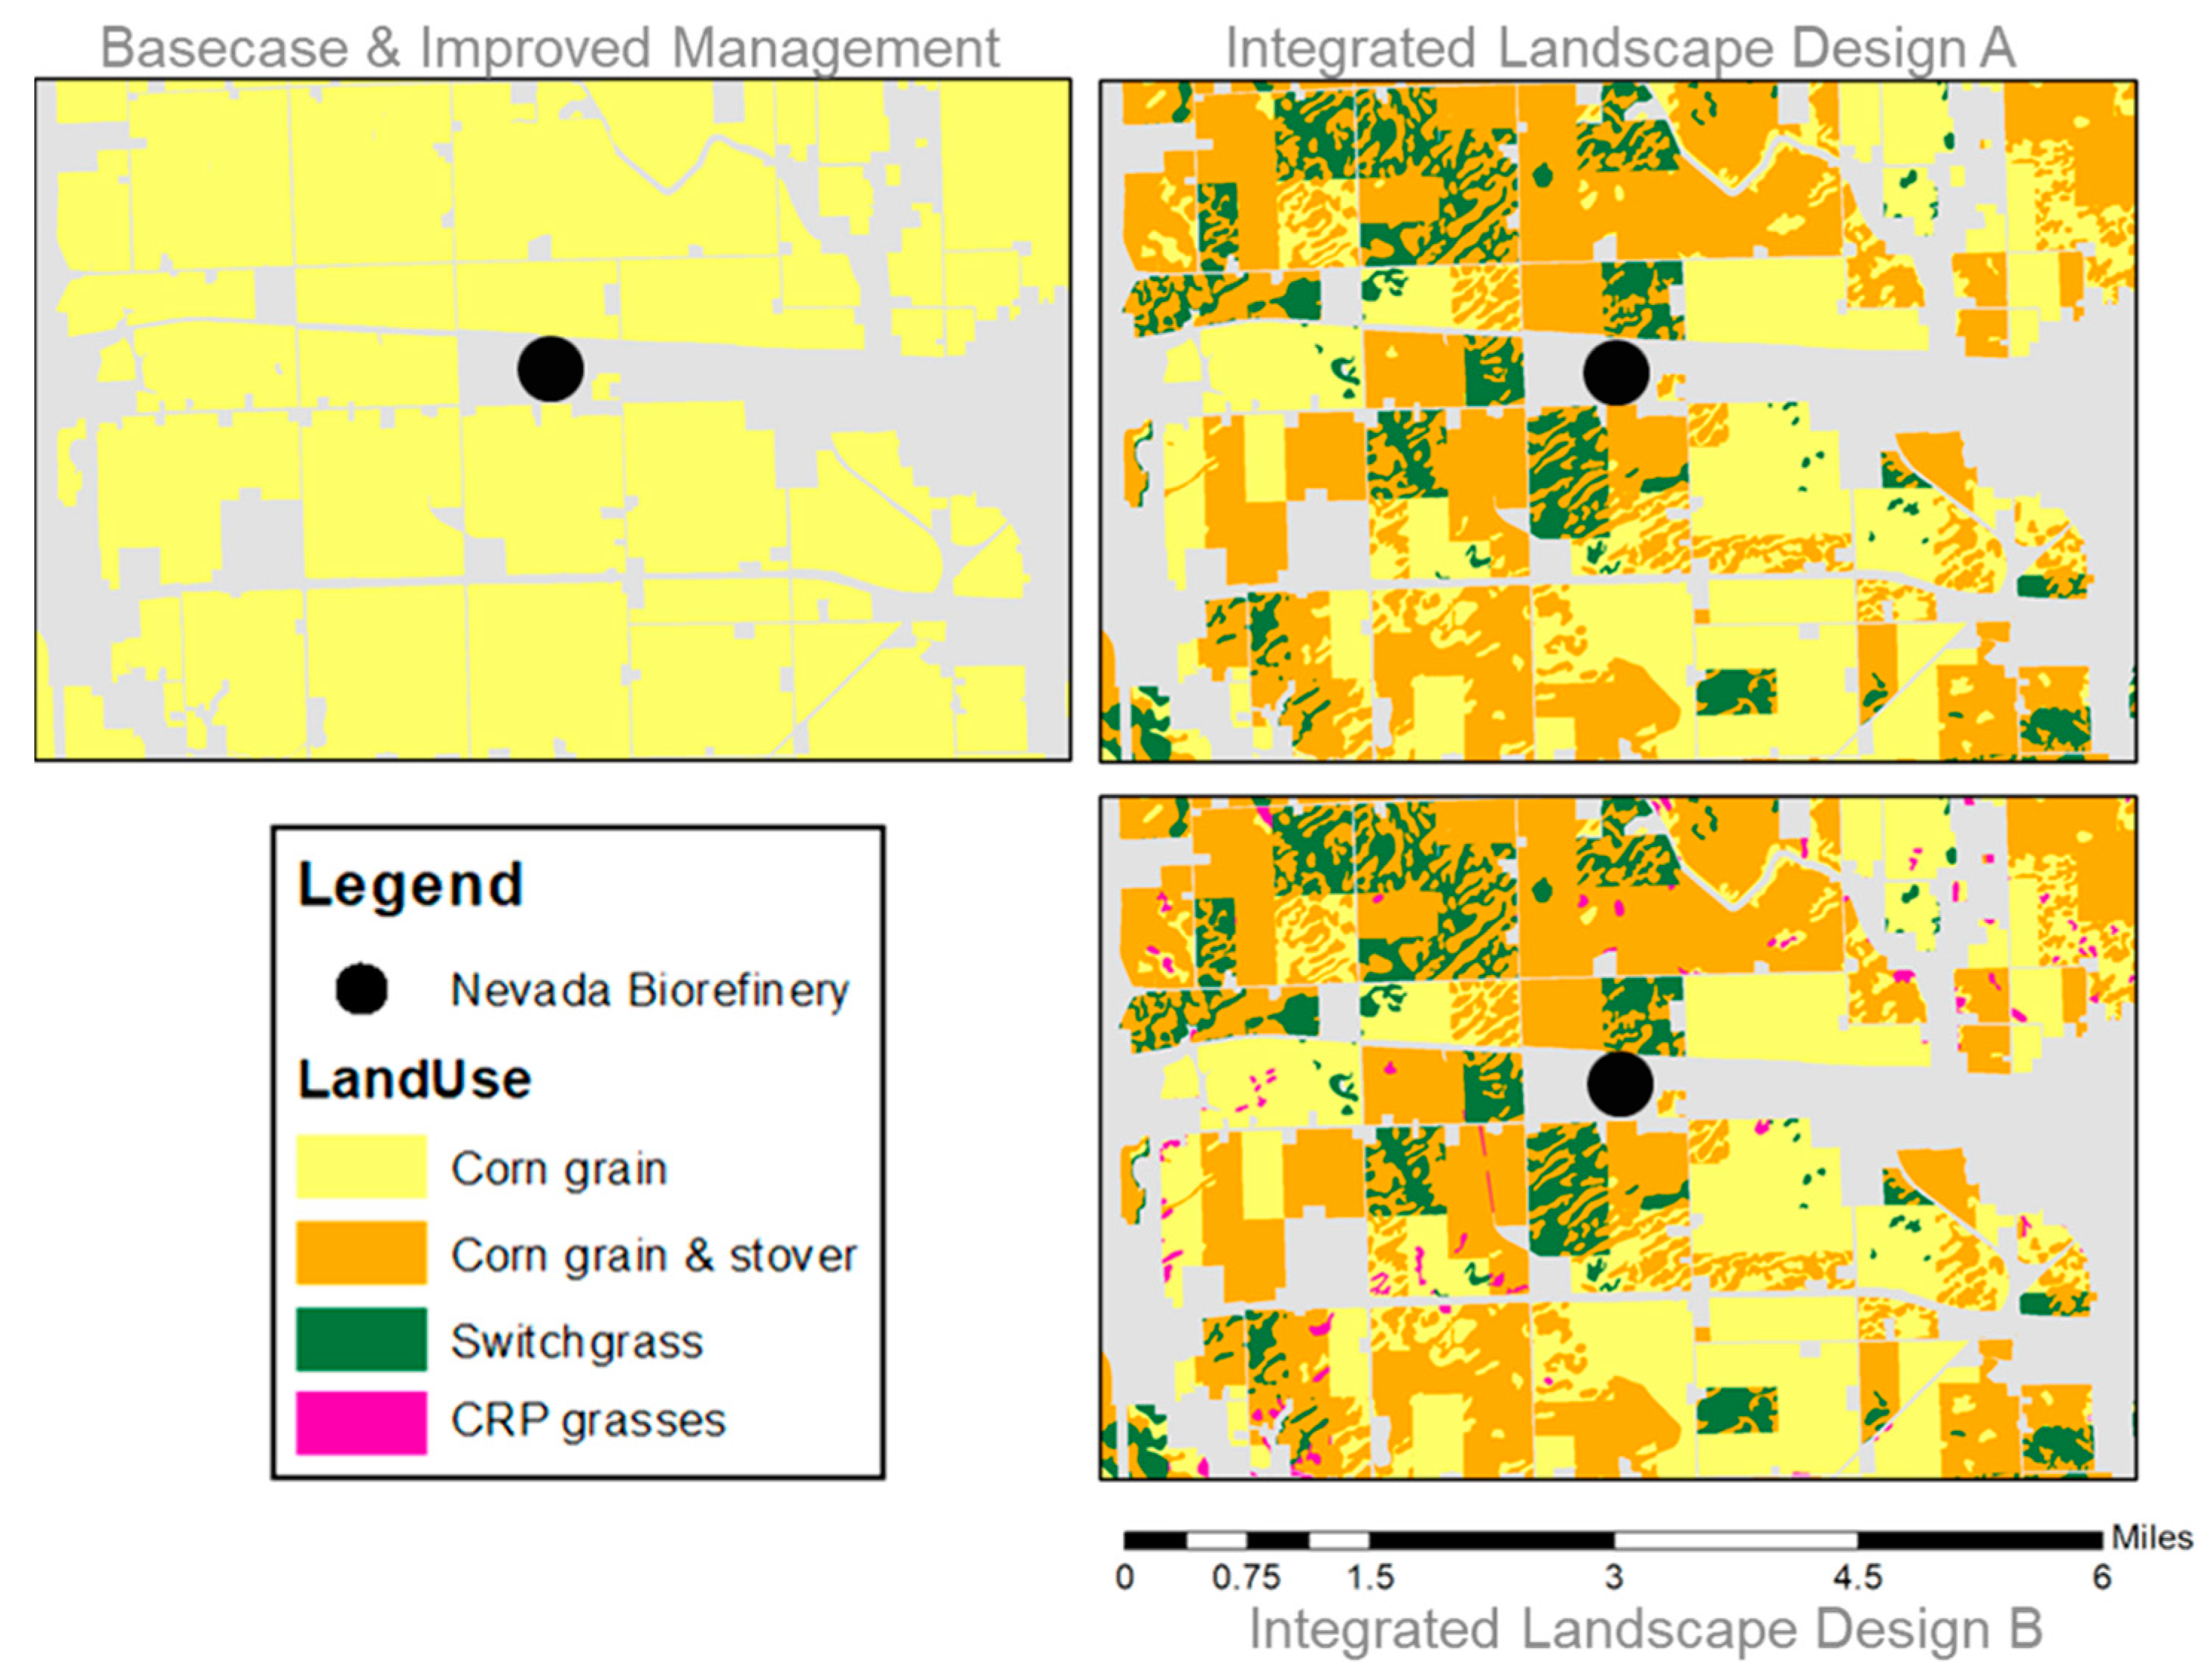
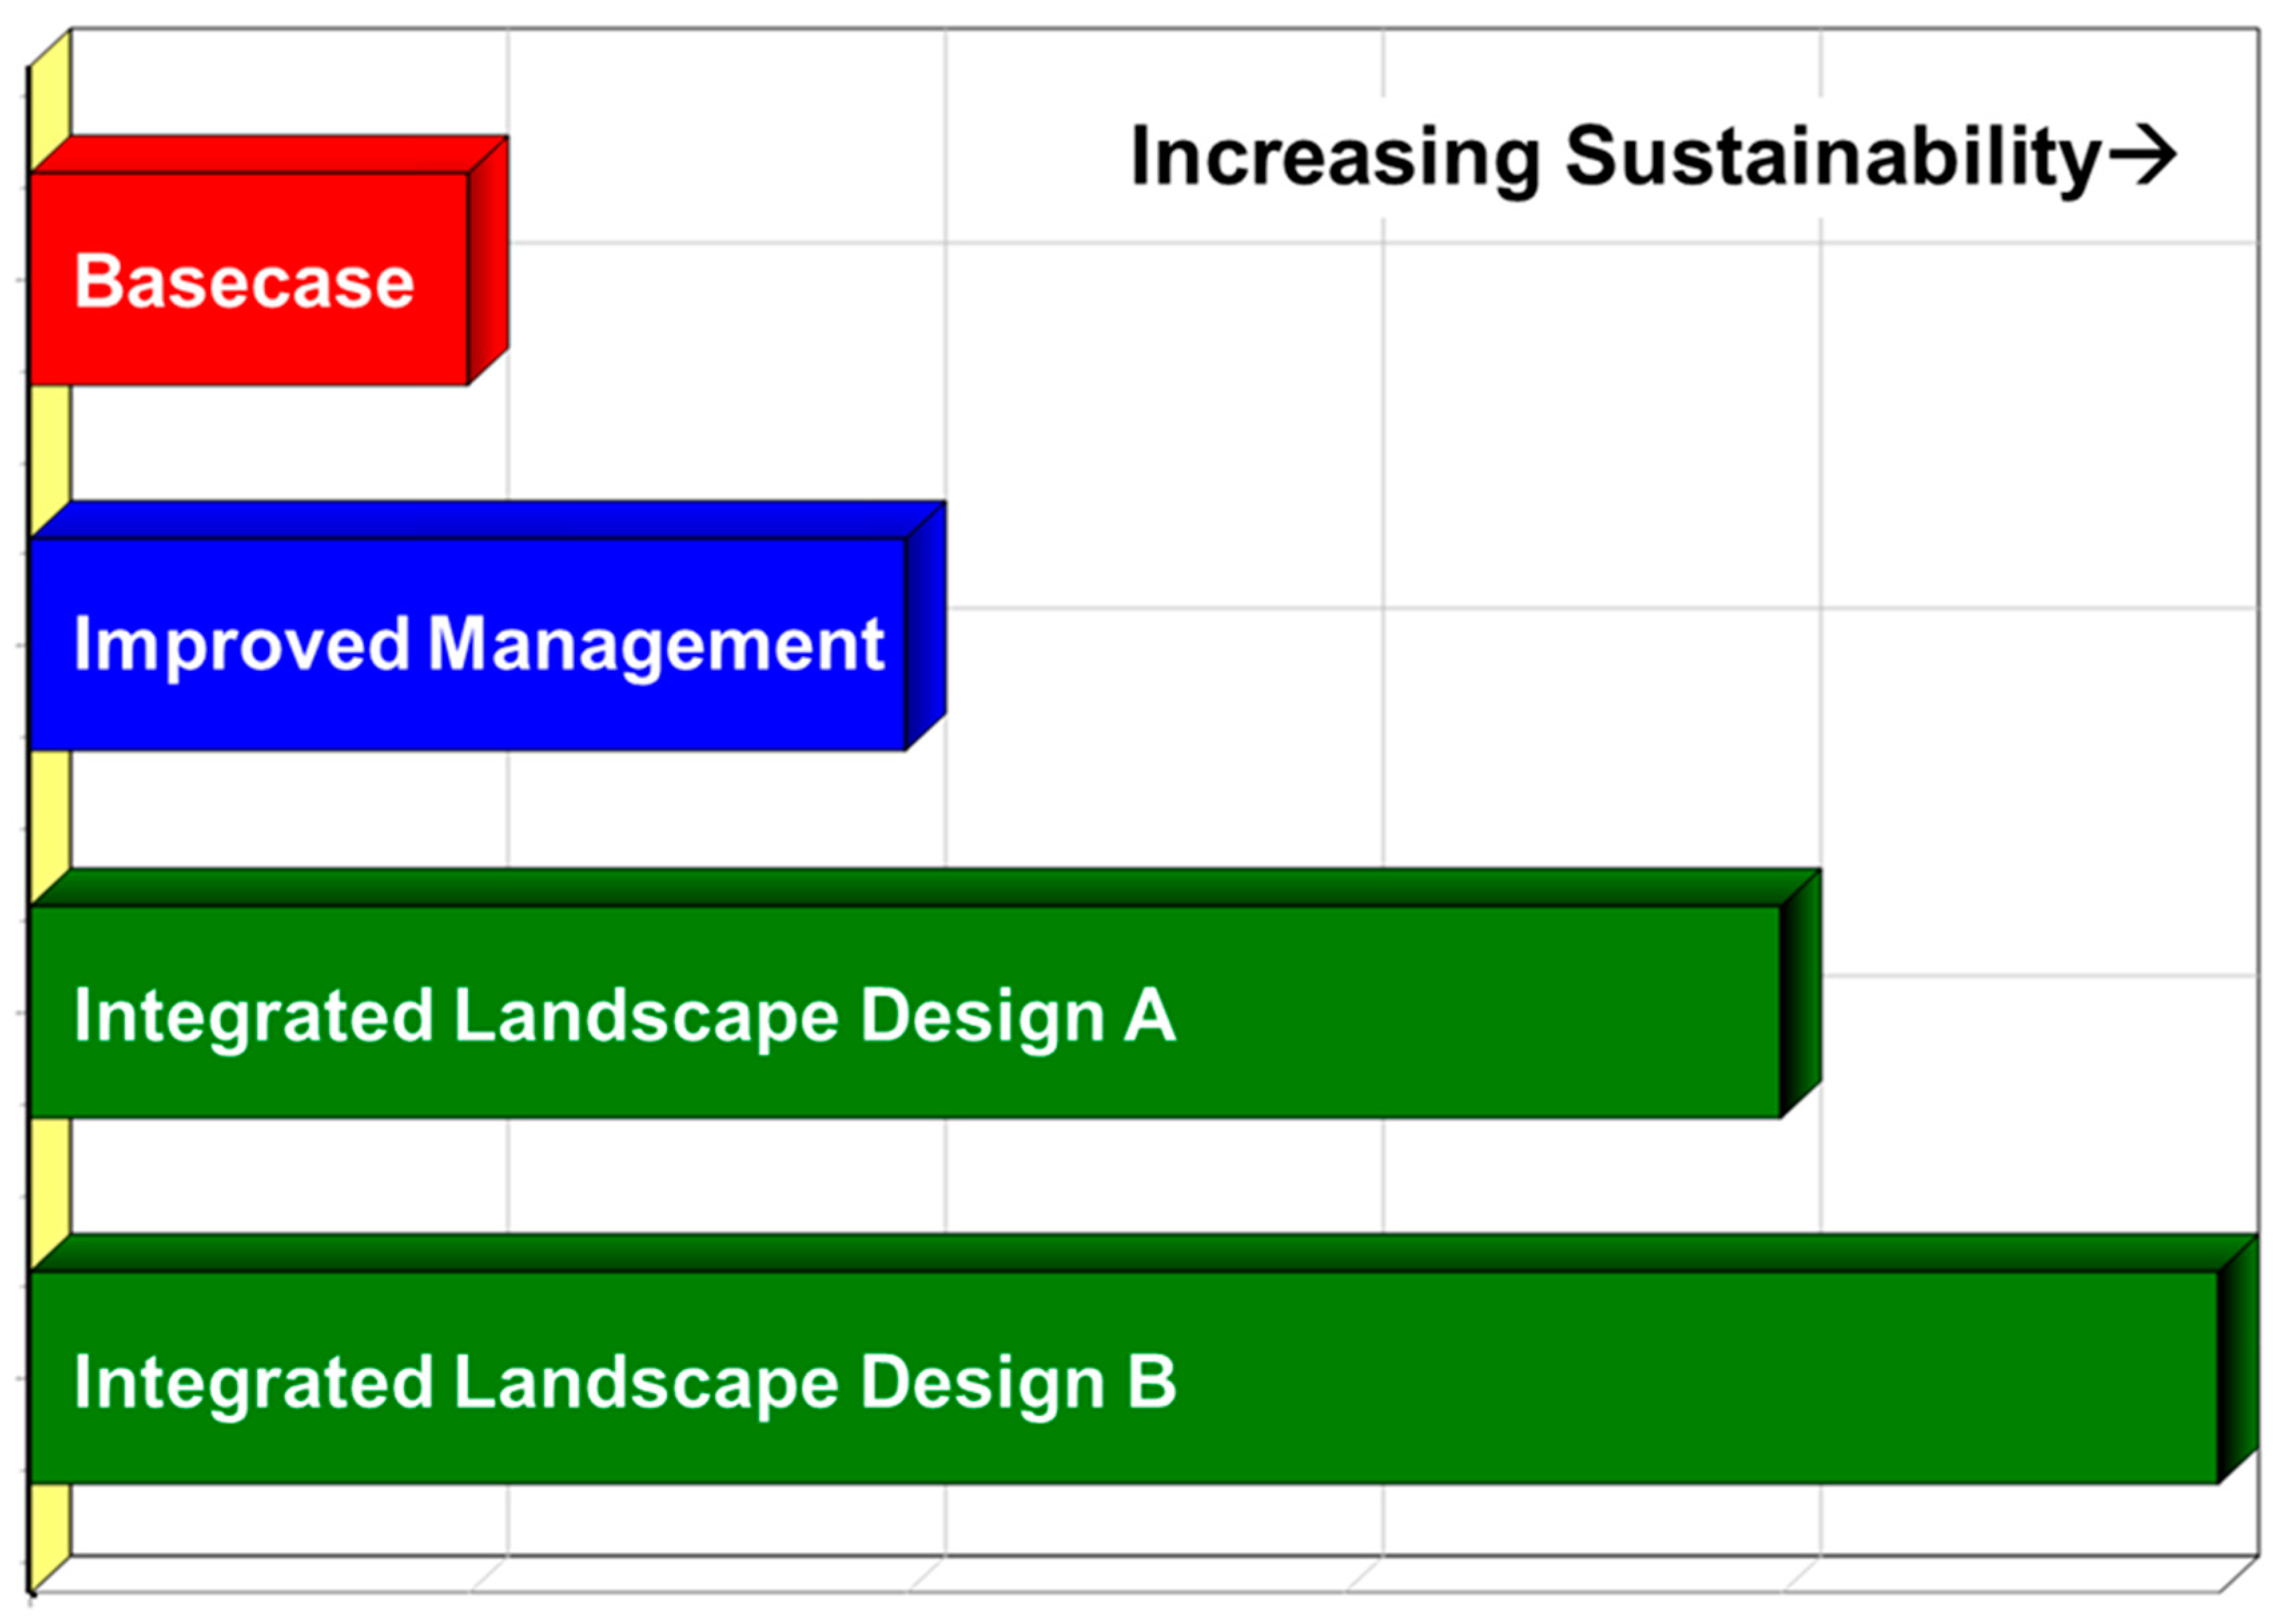
2.2. Landscape Design Definitions

Over the period of one year, Iowa LD team members contributed ideas and feedback to develop a set of four clearly defined alternative land management scenarios to compare using the AgSolver datasets and associated indicator values. It was important to start by defining a project baseline (i.e., business as usual) to represent common practices and conditions for typical Iowa corn and soybean rotations from 2013 to 2016, the years immediately preceding cellulosic biomass production. Defining potential alternative scenarios of cellulosic bioenergy production was particularly challenging because many Iowa LD team members were conducting research that focused on different specific goals and management practices (e.g., variable corn stover removal rates, manure applications, use of cover crops, management of soil organic carbon). Therefore, the Iowa LD team’s decision was to target the 10% of Iowa acres that have shown the lowest ROI values for 2013–2016 (based on PZM datasets) for potential conversion to perennial grasses for bioenergy production and/or conservation purposes.
In January 2020, a subset of the Iowa LD team finally reached consensus regarding four alternative landscape management scenarios to evaluate and compare with regard to potential sustainability outcomes: (1) continuing corn/soybean cropping at historic (i.e., 2013–2016) rates with no new conservation practices or biomass markets (Base Case scenario); (2) corn/soybean cropping at historic rates with some new conservation practices (e.g., reduced till) but no biomass markets (Improved Management scenario); (3) planting bioenergy switchgrass on clusters of unprofitable or low-ROI corn and soybean subfields, coupled with ~30% corn stover harvest from suitable fields, harvest of rye cover crop biomass for additional cellulosic feedstock, and adoption of no-till on the most erosive fields (Integrated Landscape Design A); and (4) planting bioenergy switchgrass on clusters of unprofitable or low-ROI corn and soybean subfields, coupled with ~45% corn stover harvest from suitable fields, harvest of rye cover crop biomass for additional cellulosic feedstock, adoption of no-till on all fields, and perennial Conservation Reserve Program (CRP) plantings on the remainder of low-ROI lands (Integrated Landscape Design B). More explanation about the rationale for each of these scenarios is provided in the following subsections.

2.2.1. Base Case Scenario

This first scenario is meant to illustrate a case with no conservation practices at one end of the spectrum of potential impacts. This scenario represents a cultivated row crop system with no bioenergy production and no landscape design considerations. To some degree, this scenario simulates conditions in the absence of policies to support investments in nutrient and soil conservation practices. This scenario will help illustrate the potential range of effects when compared to other proposed management practices. The scenario is based on the AgSolver simulation for corn/soybean fields under the following management conditions: conventional tillage, no stover removal, no cover crop, and chemical-based fall fertilizer application. This scenario assumes land cover and land management per the USDA Cropland Data Layer (CDL) as used for AgSolver (2013–2016) without replacing maize and soy acreage with perennials. Remaining land cover is assumed to be the historical CDL (2016) to fill gaps for other crops and other land uses beyond the corn–soy fields (urban, wetlands, forest, pasture).

2.2.2. Improved Management Scenario

This second scenario incorporates basic nutrient and soil conservation practices on corn/soy acres but still an absence of bioenergy markets. The Improved Management Case is based on AgSolver results for corn/soybean fields under the following management conditions: reduced tillage, no corn stover removal, no cover crop, and spring fertilizer application with in-season side-dress. As per the Base Case scenario, this and other scenarios fill in any land not specifically simulated with cover per the USDA CDL.

2.2.3. Integrated Landscape Design A

This third scenario combines conservation management practices on corn/soy acres, sustainable corn stover removal for bioenergy production, and integration of clustered perennial grass plantings on low-ROI cropland for biomass production and ecological benefits. A share of the low-ROI acres in current corn–soy rotation will be replaced with (overprinted with) AgSolver perennial switchgrass (SWG) results according to the following steps: (1) start with the Base Case scenario layer of corn/soy fields, (2) identify the 10% of that land area with the lowest ROI values, (3) identify those low-ROI fields that are ≥5 acres in size (to reduce impractical, high-cost small patches), and (4) identify those 5 acre+ low-ROI fields that are clustered to increase efficiency of biomass collection and delivery to the biorefinery (e.g., fields located within 0.1 miles of one another). For simplicity, a single SWG harvest is assumed following frost in late fall each year. Additionally, AgSolver results for 30% corn stover removal, rye cover crop, and no-till will be overprinted on those corn–soy subfields that meet the following criteria: (a) an average yield of ≥160 bu/acre based on the 2013–2016 annual yields contained in the AgSolver files (per Stuart Birrell of Iowa State University; this helps assure that 1.5 tons/acre or more of stover residue is retained on the field), and (b) slope of ≤5% (per Virginia Jin of USDA ARS; to prevent erosion, stover should not be removed when the land has greater than 5% slope).

2.2.4. Integrated Landscape Design B

This fourth scenario is designed to illustrate the highest level of environmental benefits that might be achieved through landscape design and includes switchgrass plantings and new CRP acres to replace low-ROI cropland areas, available biomass markets, and other conservation measures. The fourth scenario adds additional elements of landscape design to the third scenario and illustrates potential biomass volumes if policies permit harvest from a portion of “working conservation lands”. Identical to Scenario 3, switchgrass replaces corn–soy on clustered low-ROI corn/soy subfields. In this case, however, the remaining lowest 10% ROI fields will be overprinted with AgSolver results for CRP. Also identical to Scenario 3, corn–soy acres projected at 160 bu/acre or greater and that are not highly erodible (i.e., with slopes exceeding 5%) will supply stover at a 45% removal rate. A rye cover crop and no-till management will be assumed for all corn–soy acres. Per Scenario 3, a single switchgrass harvest is assumed following frost in late fall each year. Per guidance from pheasant habitat modeling, 50% of CRP acres are located to maximize conservation/wildlife benefits and will not be harvested. The remaining 50% of the CRP acres are harvested annually for biomass.

2.3. Creation of Landscape Design Layers

Geospatial layers for each of the four alternative landscape design scenarios were constructed in ArcGIS software using combinations of 7 of the 50 AgSolver management simulation results (described in Section 2.1) for Iowa corn/soy acres modeled for years 2013–2016. A list of the seven AgSolver datasets used as ingredients in the four landscape design layers is provided in Table 2. Since there ended up being different numbers of subfields modeled by each AgSolver management simulation (most likely due to the WEPS wind erosion model sometimes not reaching a conversion point in a solution and therefore dropping the solution), we chose to use only those subfields with results in all 7 of the AgSolver files. Thus, the analyses for the Nevada fuelshed included only the 465,843 subfields (i.e., 3,601,081 acres) that lie within 50 miles of the biorefinery and have environmental results from all 7 of the AgSolver simulations, with all duplicate shapes removed.
To identify the 10% of acres with the lowest ROI values, the Base Case layer was joined to the subfield economic information for 2013 to 2016, and the “simple_roi_no_rent” values were averaged across all 4 years. Selecting higher ROI values led to more than 10% of the fuelshed acres being identified, and selecting lower ROI values led to fewer than 10% of the fuelshed acres being identified. After some trial and error, an ROI threshold value of <0.4275 was used to designate the 358,961 acres (i.e., ~10% of modeled corn/soy area) across the Nevada fuelshed as “Low ROI”. These “Low ROI” acres were totaled by CLU and identified as good areas for planting switchgrass under Integrated Landscape Designs A and B when they summed to at least 5 acres within a given field. The remaining (non-clustered) low-ROI acres were designated as locations for planting CRP grasses under Integrated Landscape Design B.
To identify land areas suitable for corn stover removal under the Integrated Landscape Design A and B scenarios, shapefile data tables for each corn and corn residue layer were exported as text files and manipulated within Excel to separate out the corn and soybean yields for years 2013–2016. Then, the average corn yield under each 4-year crop rotation was calculated through use of Excel filters. Results were imported back into ArcGIS as new tables and joined to the appropriate layers in order to determine the average corn yield (bu/acre) under each scenario. After removing low-ROI acres designated for switchgrass and/or CRP, remaining subfields with Base Case corn yields ≥165 bu/acre (the economically viable removal threshold for Iowa according to Professor Stu Birrell of ISU) on land with slopes ≤5% were labeled as land areas suitable for corn stover removal.
The environmental attribute layers for the four alternative landscape design scenarios were then assembled for the Nevada fuelshed area (Figure 1) using the GIS layers defined in Table 2. For the Base Case scenario, the Base Case layer was used to represent all corn/soy acres. For the Improved Management scenario, the Nevada_ImpMgmt layer was used to represent all corn/soy acres. For the Integrated Landscape Design A scenario, the Nevada_SWG results were used for switchgrass plantings on clustered low-ROI subfields, the Nevada_30RH results were used for remaining corn/soy subfields identified as having Base Case average corn yields ≥ 165 bu/acre and slopes ≤ 5%, and the Nevada_ImpMgmt results were used for the remaining corn/soy subfields. Collectively, these layers produced a set of results for all subfields in the Nevada fuelshed area. Similarly, for the Integrated Landscape Design B scenario, Nevada_SWG results were used for switchgrass plantings on clustered low-ROI subfields, Nevada_CRP results were used for the remaining (non-clustered) low-ROI subfields, Nevada_45RH results were used for the remaining corn/soy subfields identified as having Base Case average corn yields ≥ 165 bu/acre and slopes ≤5%, and Nevada_RyeCover results were used for all remaining corn/soy subfields.
A corresponding set of the four scenario layers was then developed for the smaller South Fork watershed area by selecting the 19,520 modeled agricultural subfields (totaling 178,465 acres) that lie within its boundary (Figure 1).

2.4. Resulting Land Areas

A visual example of the differing land use distributions under these four alternative landscape design scenarios is shown for land in the immediate vicinity of the Nevada biorefinery in Figure 2. The total area and percentage of land allocated to each biomass type under each scenario are summarized in Table 3 for the Nevada fuelshed area and in Table 4 for the South Fork watershed area.

2.5. Environmental Indicators

The four landscape design layers with their subfield-scale environmental variables assigned through spatially explicit choices of management practices (Section 2.3) were then used to calculate environmental indicator values for each scenario across the Nevada fuelshed (Table 5) and the South Fork watershed (Table 6). The corn yields were calculated as described in Section 2.3 and summed together for the given scenario. The soil conditioning index (SCI) was averaged across the landscape. The tons of sediment eroded by wind and water (or both) were summed across the landscape. The change in soil organic carbon (SOC) (in pounds) was summed across the landscape such that a negative value means an aggregated loss in SOC and a positive value means an aggregated gain in SOC. The nitrous oxide (N2O) flux (in pounds) was summed across the landscape such that smaller values mean less N2O is released to the atmosphere. The methane (CH4) flux was summed such that more negative values mean more methane is lost to the atmosphere. The ammonia (NH3) volatilization values (in pounds) were summed across the landscape such that smaller values mean less fertilizer is lost from the soil into the atmosphere. The nitrate (NO3) leaching values (in pounds) were summed such that smaller values mean less leaching occurs and water quality is not as adversely impacted.

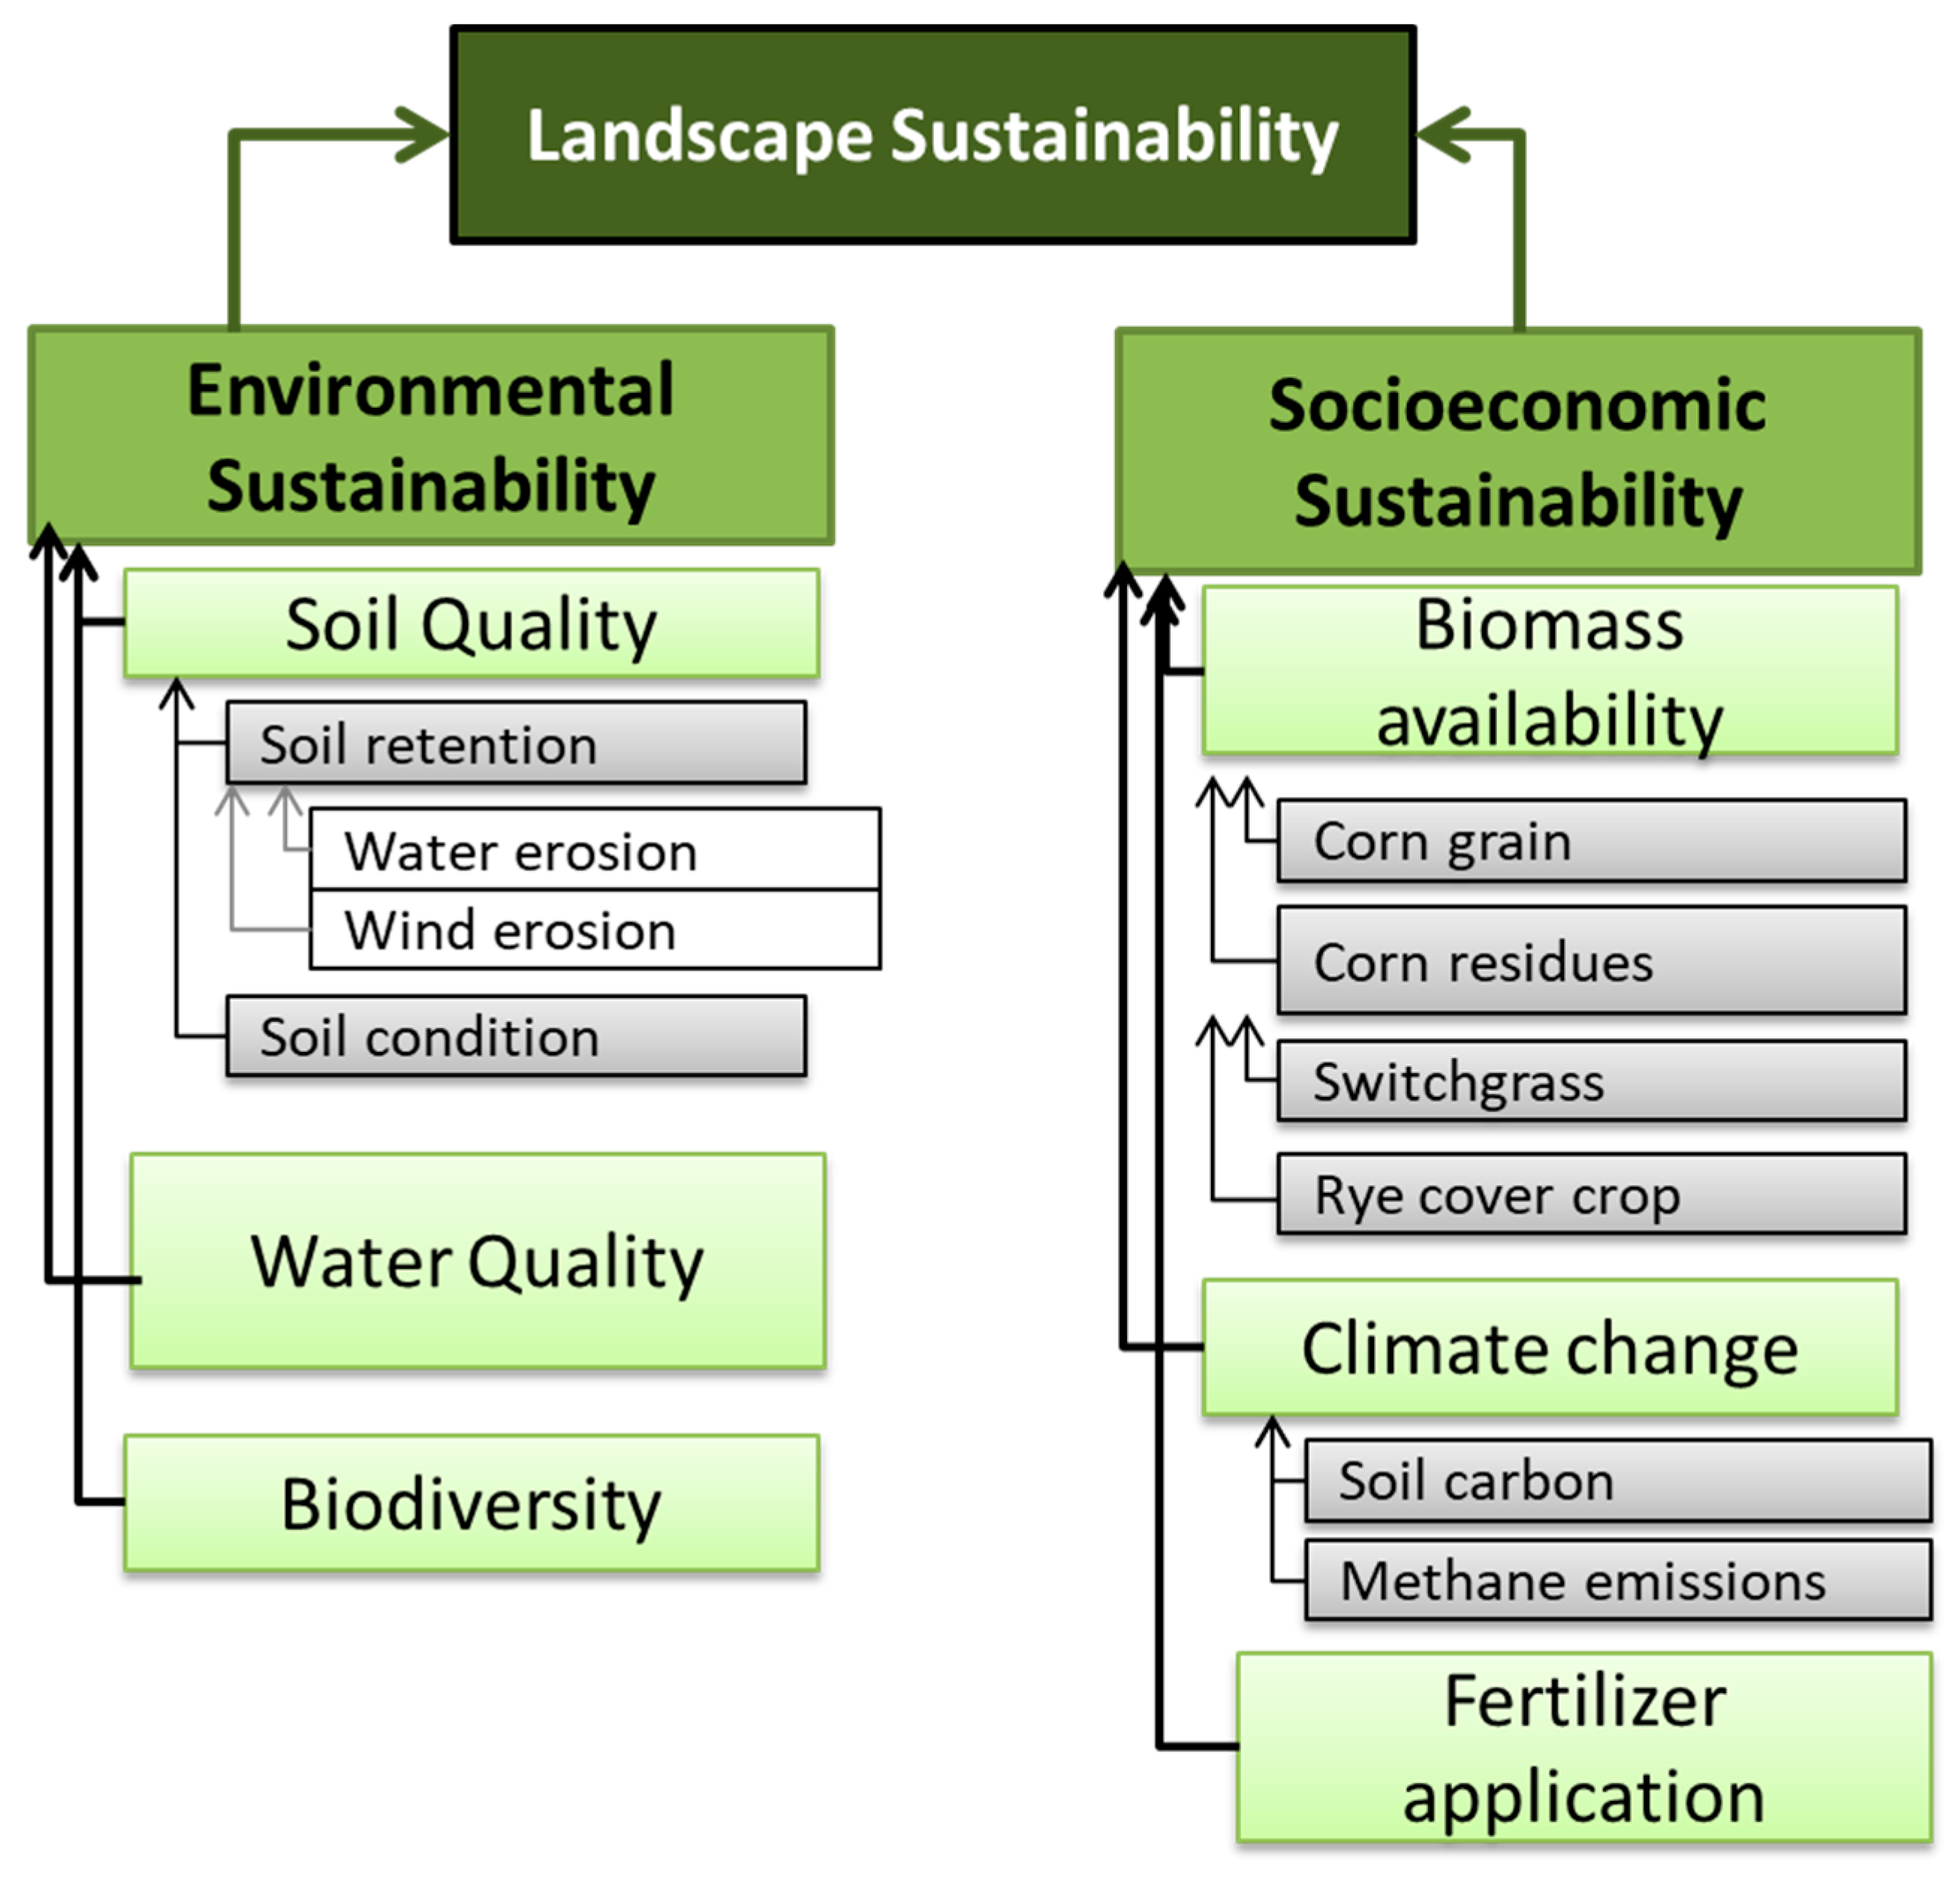
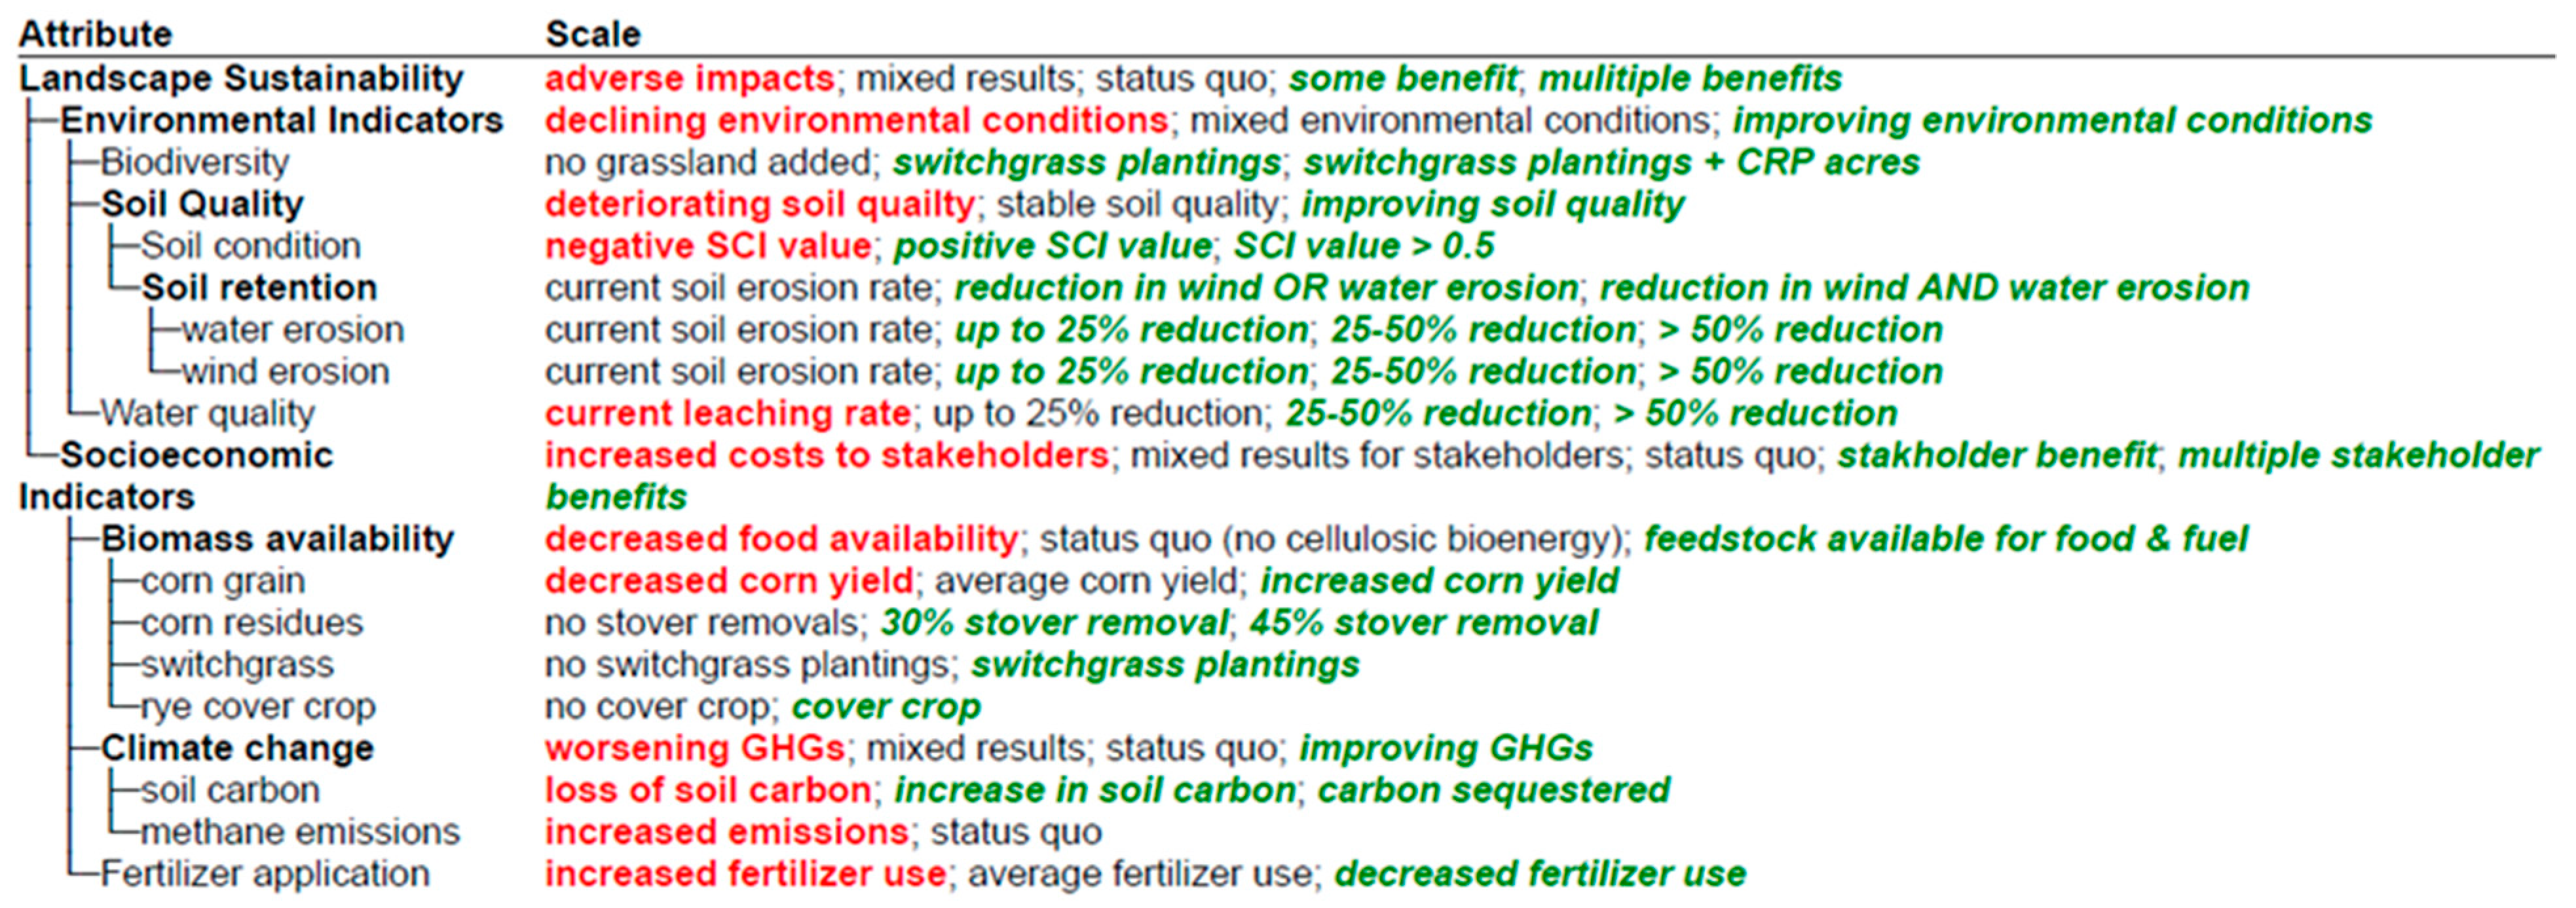
2.6. Sustainability Model Construction
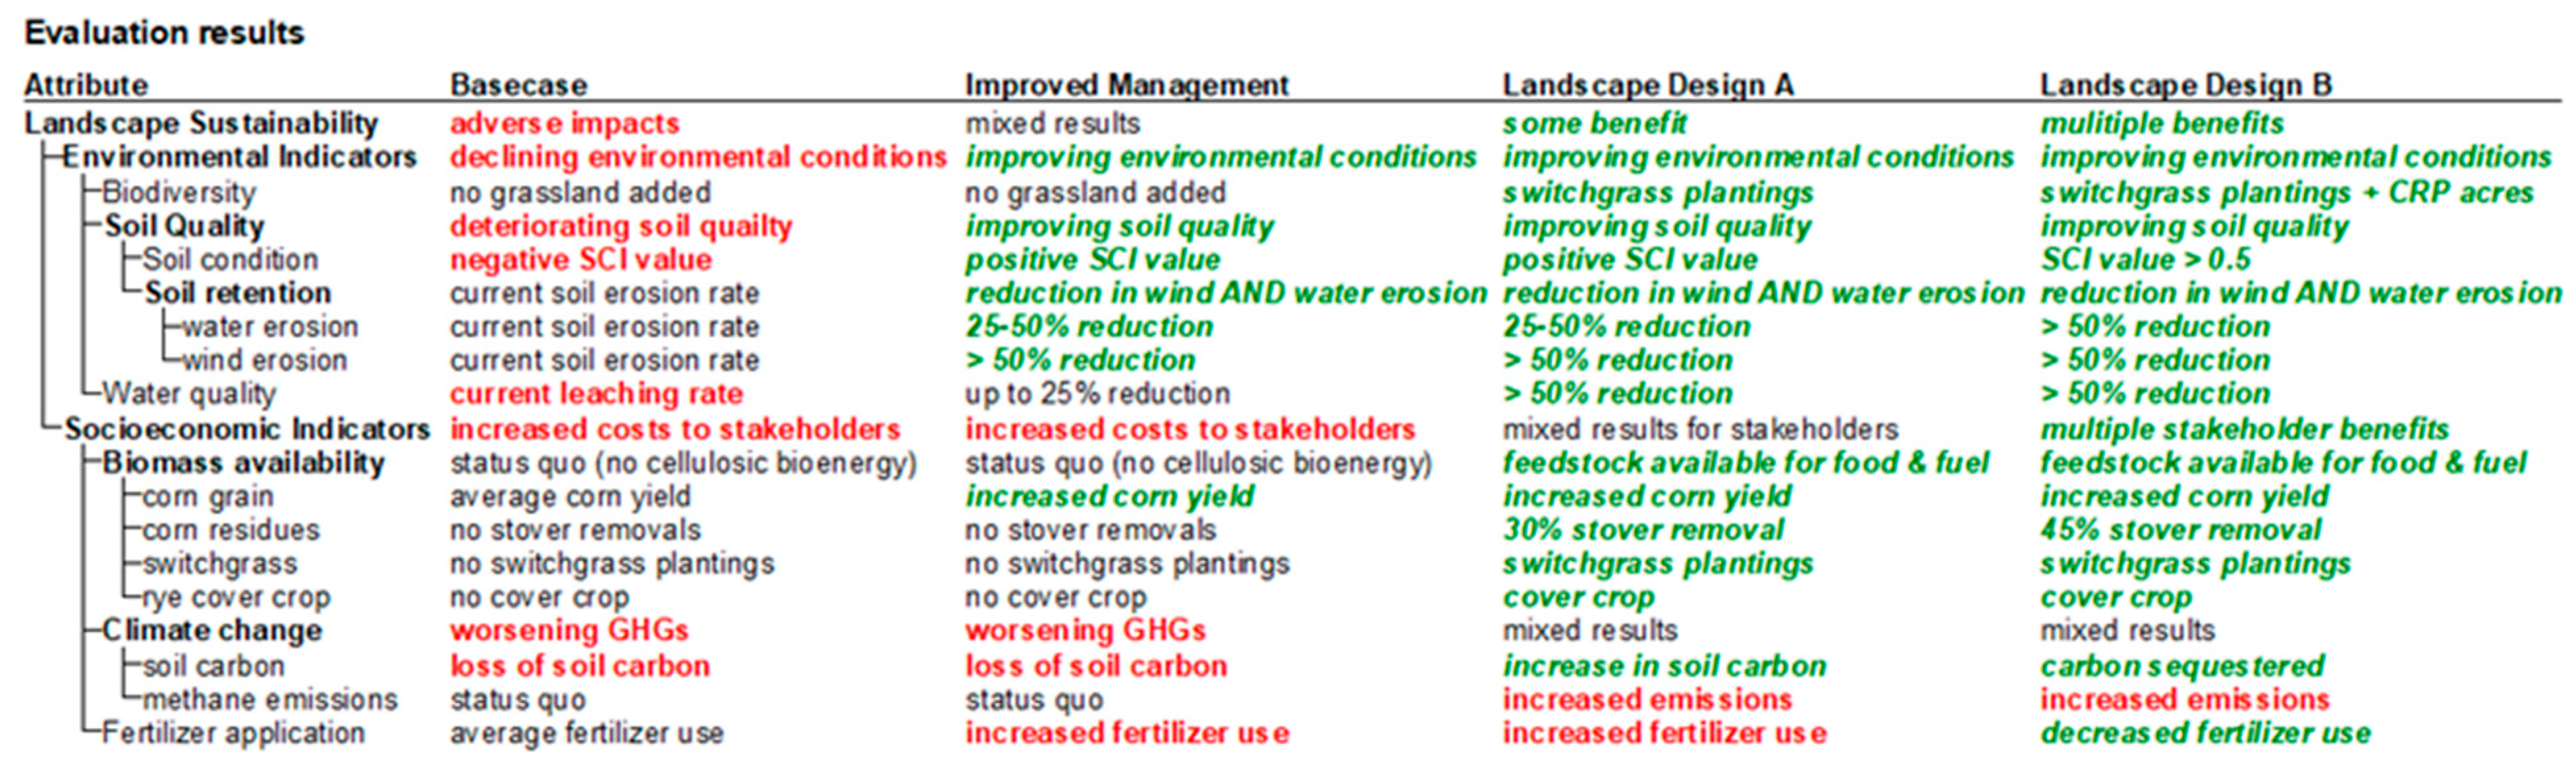
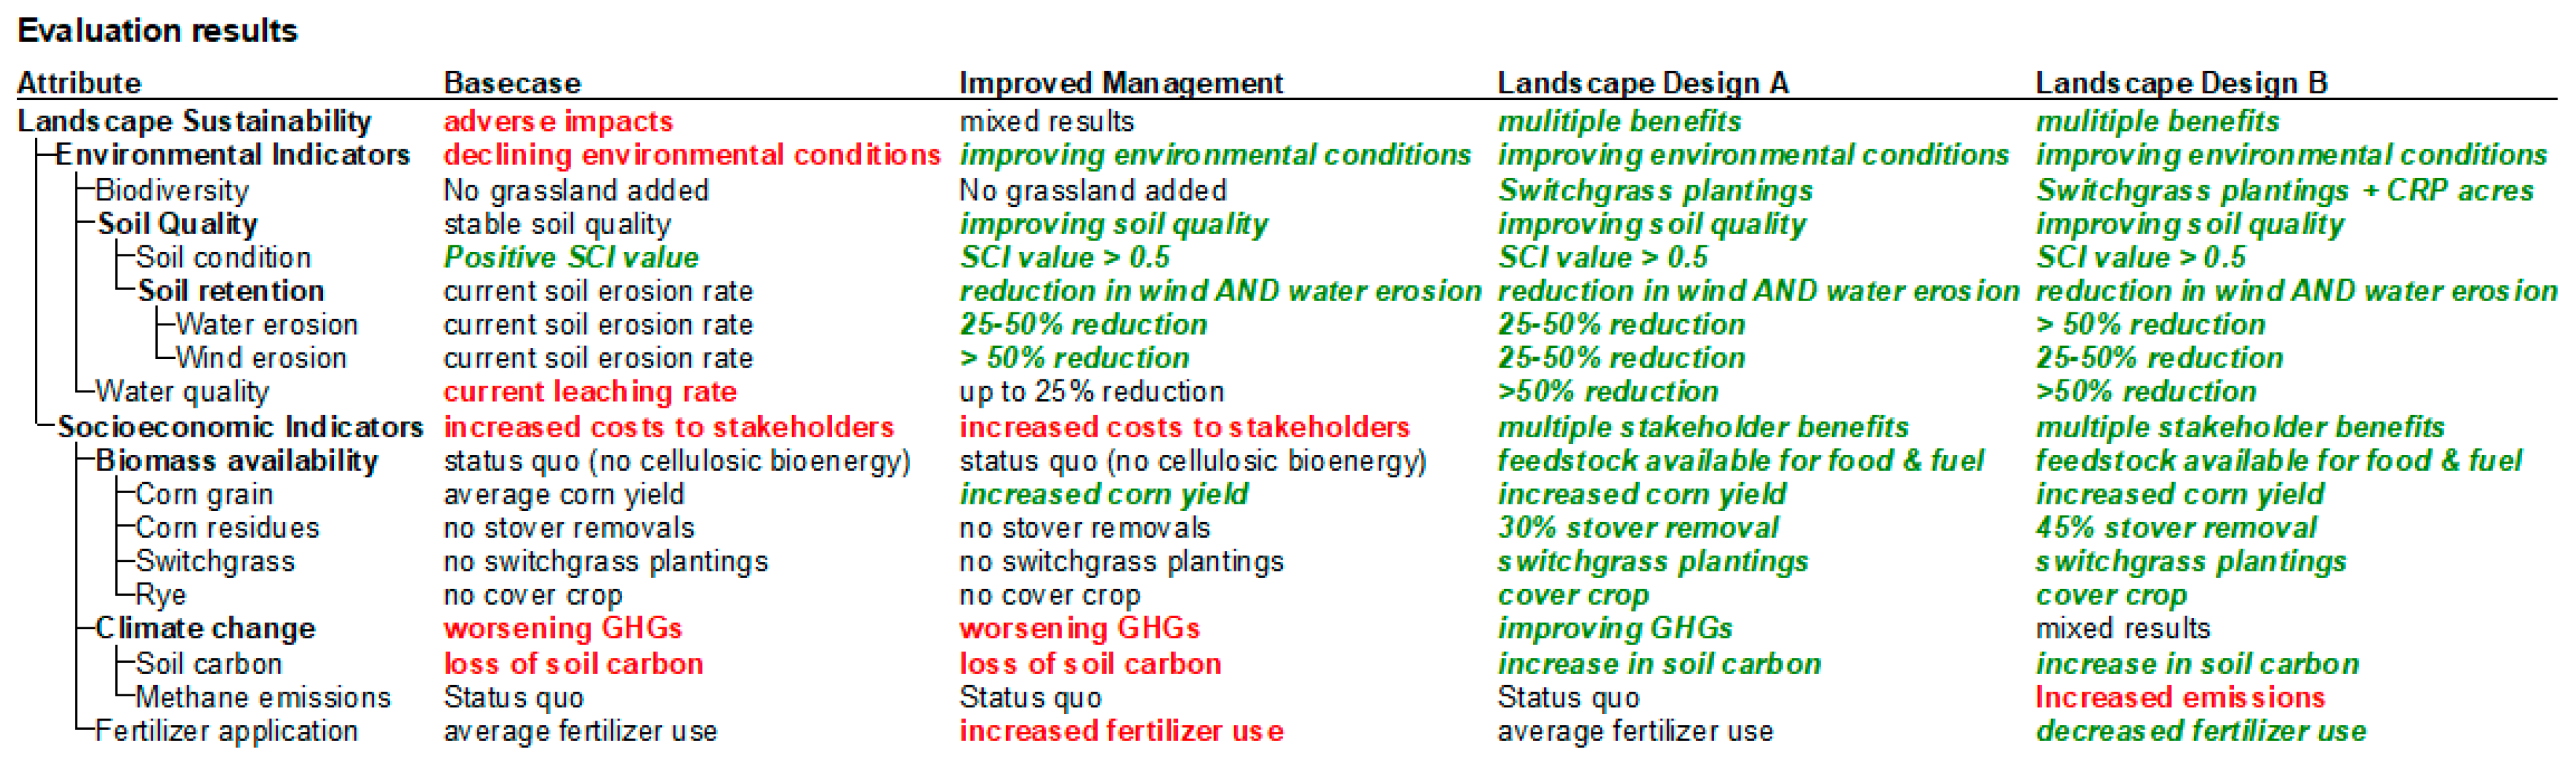
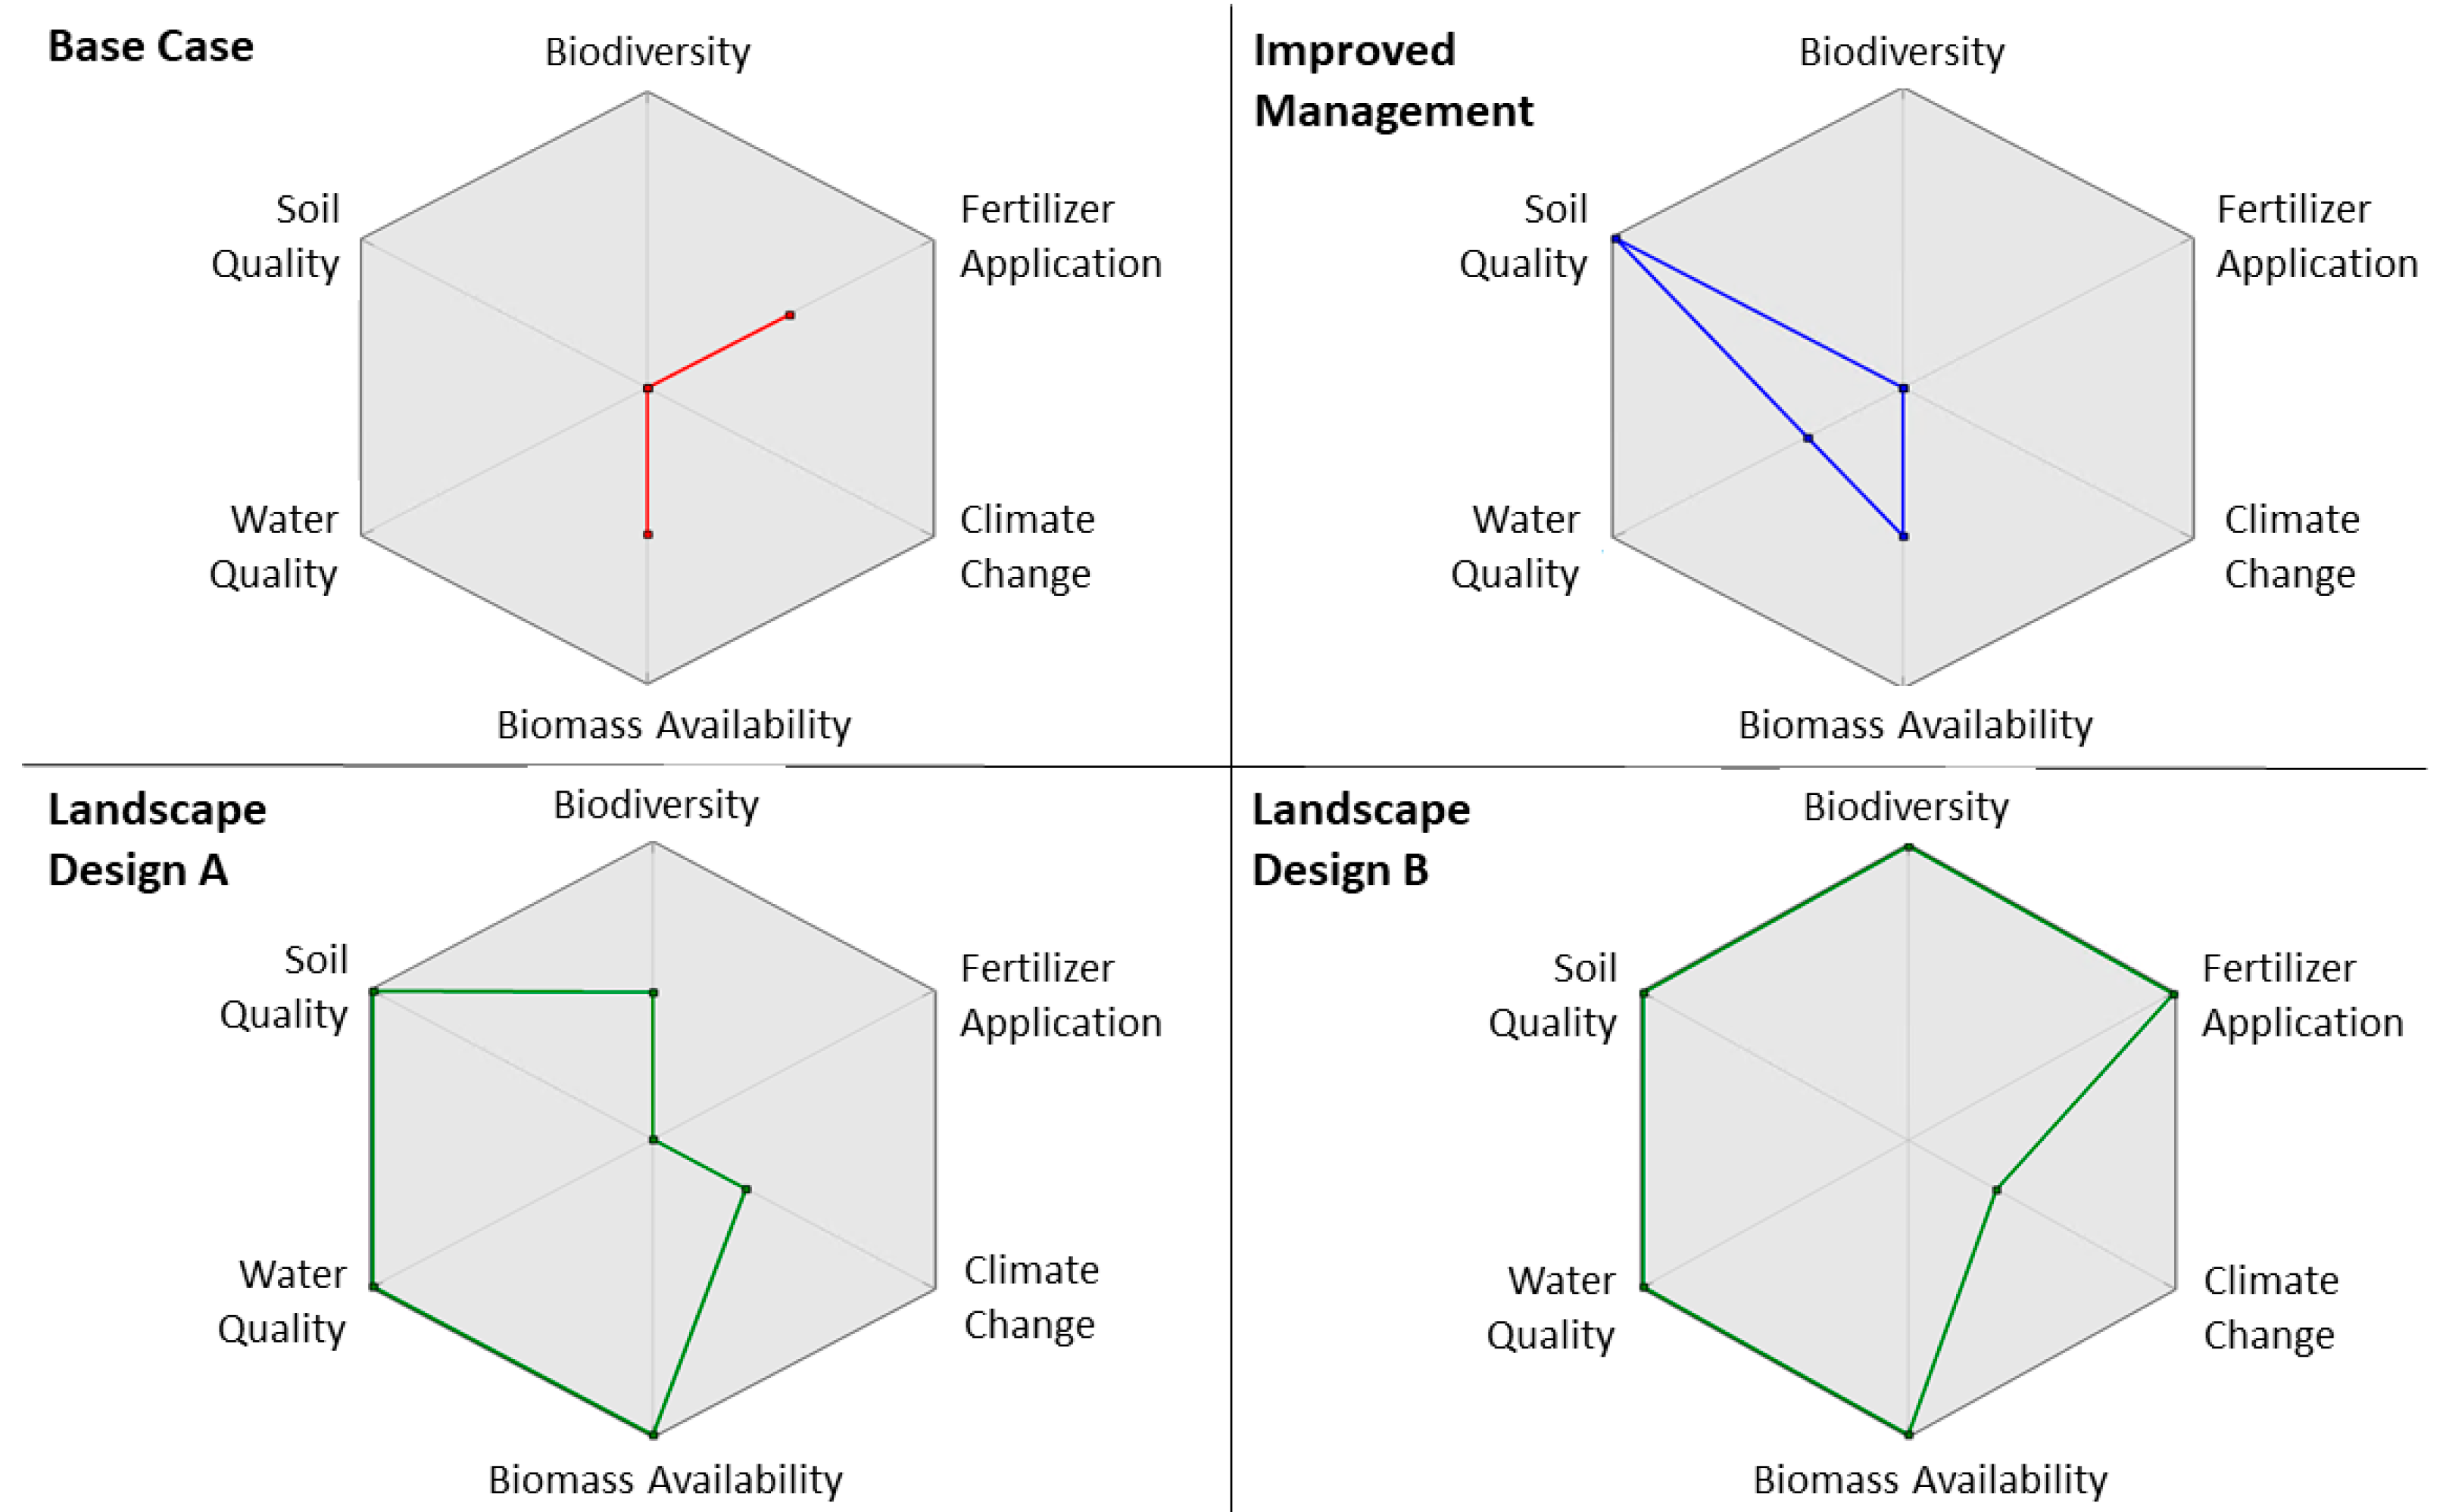
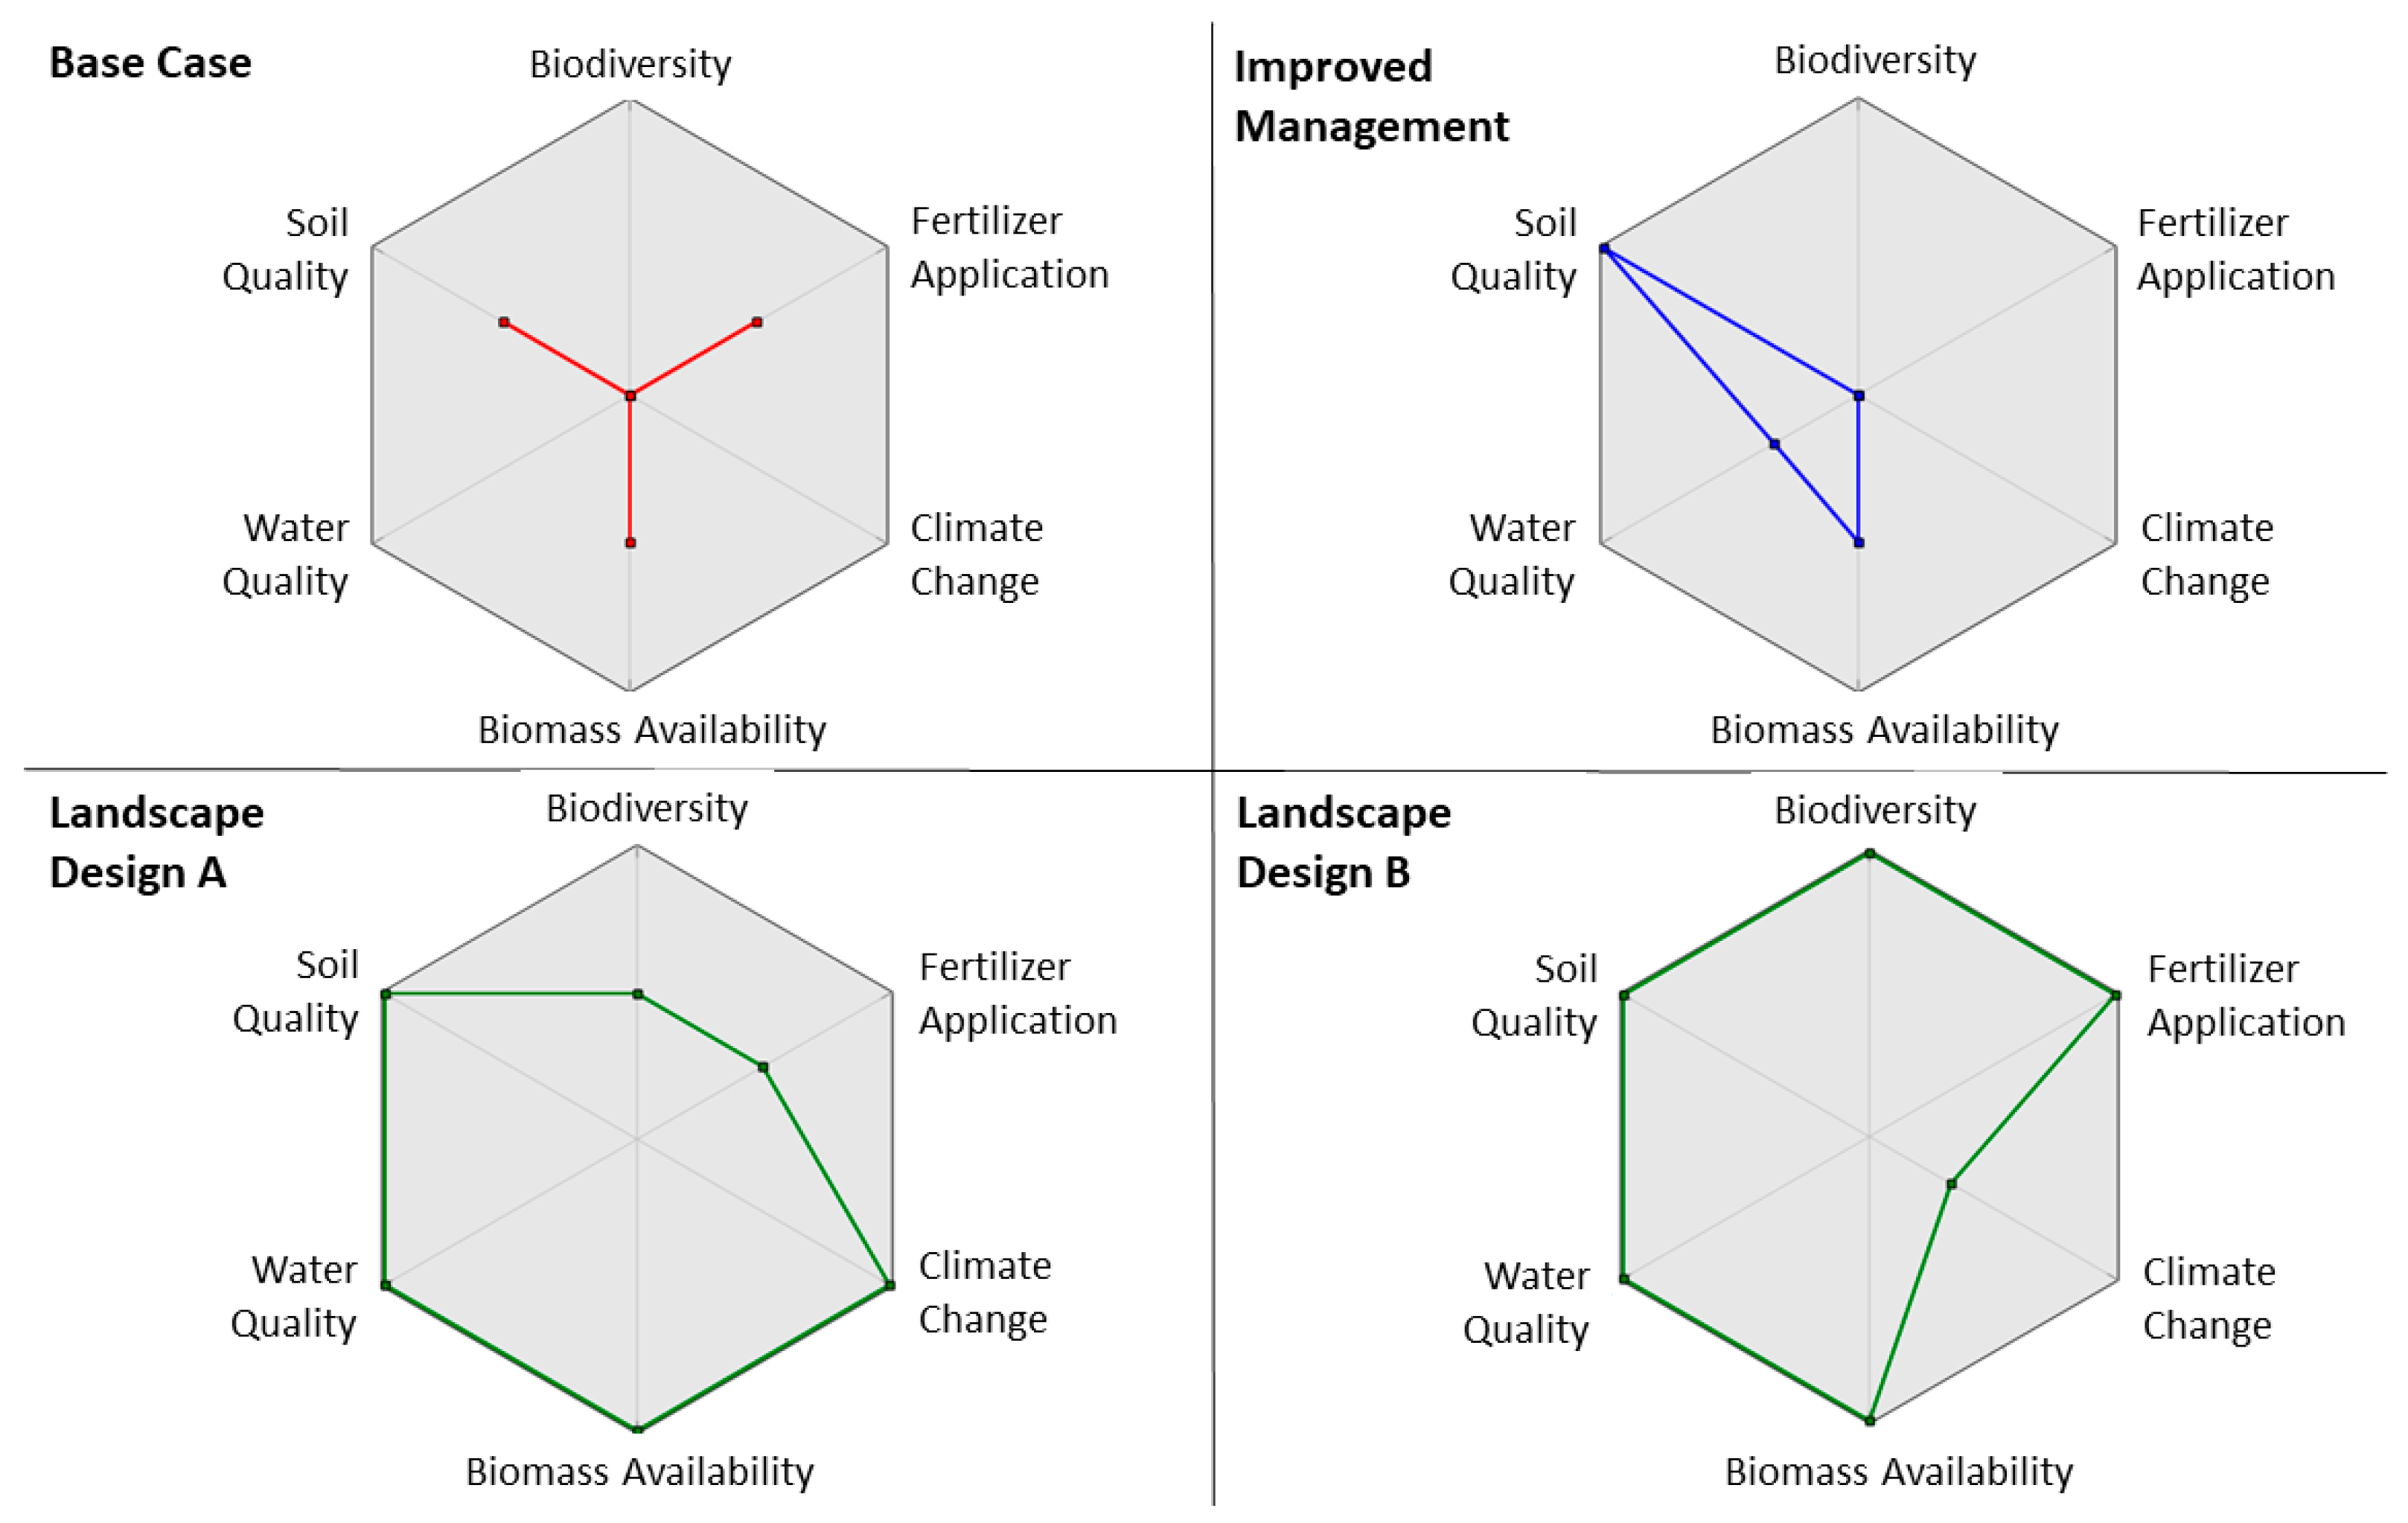
Building from work described in Parish et al. [15], the environmental indicator values were then used to construct a multi-attribute decision support system (MADSS) model for each geographic extent to compare the relative sustainability of the four landscape design alternatives. The MADSS models were built using freely available DEXi 5.04 software downloaded from https://kt.ijs.si/MarkoBohanec/dexi.html (accessed on 15 February 2018). Complete DEXi reports for each model are provided as Supplementary Material. The first step was to build a decision tree that includes each indicator in a hierarchical arrangement with no more than three variables at each hierarchical level (otherwise the MADSS model will become unstable). A simple overview of the MADSS model hierarchy constructed for both spatial extents is shown in Figure 3. Scales and utility functions were then defined for each indicator and each level of aggregation. The range of each quantitative indicator value derived from the GIS analyses was used to define and select the qualitative ratings within each MADSS model for each alternative landscape design scenario.
A list of the scales associated with each attribute is shown in Figure 4. The “biodiversity” attribute was based on additional modeling work by Kreig et al. [10] which demonstrated that adding clusters of switchgrass to Iowa’s landscape through replacement of the lowest-ROI acres improved avian species richness. The “fertilizer application” attribute was based on the assumption that larger amounts of ammonia volatilization from soil to the atmosphere means that more fertilizer will need to be applied to the field, resulting in additional cost to the farmer.
As was performed in Parish et al. [15], sustainability ratings were generally aggregated to the next (higher) level according to the following decision rules (i.e., utility functions): (1) if the indicator ratings were either all positive or mixed positive and intermediate, then the aggregate was assigned a positive value; (2) if the indicator ratings were either all negative or mixed negative and intermediate, then the aggregate was assigned a negative value; (3) if the indicator ratings were mixed positive and negative (and intermediate), then the aggregate was assigned an intermediate value; and (4) if the indicator ratings were all intermediate, then the aggregate was assigned an intermediate value. These utility functions were set up to avoid preferential weighting of any sustainability indicators or categories during aggregation.
The MADSS was cloned and evaluated separately for the fuelshed and watershed scales based on the observed environmental indicator aggregations prepared for each of the four landscape design scenario layers. A full report from each MADSS is provided as supplementary information.

3. Results

The MADSS models were used to evaluate and visualize potential tradeoffs between indicators assessed for each scenario as well as the overall relative sustainability of the four alternative landscape design scenarios at each spatial extent (see Supplementary Material). The evaluation results for the Nevada fuelshed are shown Figure 5, and the evaluation results for the South Fork watershed are shown in Figure 6. The results were identical at the two spatial extents for three of the four scenarios but differed slightly for Integrated Landscape Design A. Whereas methane emissions and fertilizer volumes increased across the Nevada fuelshed under this scenario, methane and fertilizer quantities remained similar to the Base Case conditions across the South Fork watershed. The climate change impacts related to methane emissions and the financial cost and pollution potential of increased nitrogen-based fertilizer use at the Nevada fuelshed extent led to “mixed results” for the socioeconomic indicators, since these adverse impacts counteract the societal benefits of increased soil carbon and increased feedstock availability for food and fuel. This contrasts with the “multiple benefits” results for the socioeconomic indicator aggregation at the South Fork watershed extent under Landscape Design A.
Relative tradeoffs between sustainability indicators assessed for each scenario as well as comparisons of overall sustainability between the four alternative landscape design scenarios can be visualized by looking at the colored lines and the amount of enclosed space depicted in the DEXi hexagon outputs for the Nevada fuelshed (Figure 7) and the South Fork watershed (Figure 8). Environmental indicators of biodiversity (i.e., amount of grassland added to the landscape for bird habitat), soil quality (i.e., positive SCI and/or reduced wind and water erosion), and water quality (i.e., reduced nitrate leaching) are shown opposite socioeconomic indicators related to fertilizer application (i.e., increased costs of chemical application and associated pollution), climate change (i.e., increased methane emissions from agricultural management practices and/or increased sequestration of carbon within soil), and biomass availability (i.e., no significant decrease in corn grain food production along with potential increases in feedstock availability for fuel and other uses). The lowest sustainability values for each indicator are shown at the center of each hexagon, and the highest values are shown at the outer edge. Therefore, the larger the polygon areas drawn over the hexagon, the greater the sustainability of the scenario depicted relative to the alternatives. For example, Figure 7 shows that Integrated Landscape Design B has the largest polygon area and is therefore the most sustainable of the four scenarios. In Figure 7, the polygon areas shown by Landscape Designs A and B are roughly equal, indicating that they are roughly equally sustainable. However, a look at the individual indicators shows that there are some potential tradeoffs between grassland habitat extent and fertilizer inputs to consider when choosing between the two scenarios. The bar chart of overall landscape sustainability shown in Figure 9 highlights the increasing sustainability of Scenarios 1–4 at the Nevada fuelshed extent.

4. Conclusions

Through this analysis, we demonstrated that landscape designs which incorporate perennial grass plantings and corn stover removal for bioenergy production can help Iowa’s stakeholders to achieve their desired goals [13] as below:
  • Increasing cellulosic biomass feedstock availability for commercial biofuel production without significant changes in corn grain food production volumes;
  • Improving soil quality through augmentation of the soil conditioning index and/or reducing wind and water erosion;
  • Improving water quality [8] through reduced nitrate leaching;
  • Increasing bird populations (e.g., quail for recreational hunting) through the addition of grassland acres to the landscape [10].
We also found that landscape designs can provide the following additional benefits:
  • Mitigating climate change through increased sequestration of carbon within the soil;
  • Saving money through avoiding fertilizer losses.
These multiple environmental and social benefits were realized across both landscape scales examined, including the total land area supplying biomass to a cellulosic biorefinery and a watershed area located within that fuelshed (Figure 1). We found that it was possible to achieve these multiple environmental and socioeconomic benefits concomitantly with cellulosic biomass production by targeting the 10% of traditional row crop acres that have historically shown the lowest profitability and converting them to perennial grasses. We also learned that increasing benefits can accrue when complementary conservation practices (e.g., reduced tillage, use of a rye cover crop) are combined and integrated throughout a watershed based on site-specific criteria and goals for landscape design (Figure 9). We therefore conclude that our results support the hypothesis that an agricultural landscape can be designed to achieve multiple stakeholder objectives simultaneously through strategic subfield-scale management decisions.

Supplementary Materials

The following supporting information can be downloaded at https://www.mdpi.com/article/10.3390/su151310051/s1, File S1: DEXi Report_NevadaFuelshed; File S2: DEXi Report_SouthForkWatershed.

Author Contributions

Conceptualization, E.S.P., D.L.K., K.L.K., K.S.C. and W.W.B.; methodology, E.S.P. and K.L.K.; validation, D.L.K., K.L.K., K.S.C. and W.W.B.; formal analysis, E.S.P.; investigation, E.S.P. and K.S.C.; resources, K.S.C. and W.W.B.; data curation, E.S.P.; writing—original draft preparation, E.S.P.; writing—review and editing, D.L.K. and K.L.K.; visualization, E.S.P.; supervision, K.S.C. and D.L.K.; project administration, K.S.C. and W.W.B.; funding acquisition, K.S.C. and W.W.B. All authors have read and agreed to the published version of the manuscript. The views and opinions of the authors expressed herein do not necessarily state or reflect those of the United States Government or any agency thereof. Neither the United States Government nor any agency thereof, nor any of their employees, makes any warranty, expressed or implied, or assumes any legal liability or responsibility for the accuracy, completeness, or usefulness of any information, apparatus, product, or process disclosed, or represents that its use would not infringe privately owned rights.

Funding

This manuscript has been authored by UT-Battelle, LLC under Contract No. DE-AC05-00OR22725 with the US Department of Energy. The United States Government retains and the publisher, by accepting the article for publication, acknowledges that the United States Government retains a non-exclusive, paid-up, irrevocable, world-wide license to publish or reproduce the published form of this manuscript, or allow others to do so, for United States Government purposes. The Department of Energy will provide public access to these results of federally sponsored research in accordance with the DOE Public Access Plan (http://energy.gov/downloads/doe-public-access-plan, accessed on 9 June 2023).

Institutional Review Board Statement

Not applicable.

Informed Consent Statement

Not applicable.

Data Availability Statement

The data presented in this study are available in this article’s tables and Supplementary Material.

Acknowledgments

The authors would like to thank the other Iowa LD team members, especially David Muth and Gabe McNunn for providing the Iowa LD team with the AgSolver datasets and associated metadata for Iowa, Armen Kemanian of the PennState College of Agricultural Sciences for his advice about agricultural reference scenarios, and Stuart Birrell of Iowa State University and Virginia Jin of USDA ARS for their helpful input regarding sustainable corn stover removal guidelines. The authors would also like to thank John Field of ORNL and three anonymous reviewers for their helpful review comments.

Conflicts of Interest

The authors declare no conflict of interest.

References

  1. Shukla, P.R.; Skea, J.; Slade, R.; Al Khourdajie, A.; van Diemen, R.; McCollum, D.; Pathak, M.; Some, S.; Vyas, P.; Fradera, R.; et al. (Eds.) Summary for Policymakers. In Climate Change 2022: Mitigation of Climate Change. Contribution of Working Group III to the Sixth Assessment Report of the Intergovernmental Panel on Climate Change; Cambridge University Press: Cambridge, UK; New York, NY, USA, 2022. [Google Scholar]
  2. Karlen, D.; Varvel, G.; Johnson, J.; Baker, J.; Osborne, S.; Novak, J.; Adler, P.; Roth, G.; Birrell, S. Monitoring Soil Quality to Assess the Sustainability of Harvesting Corn Stover. Agron. J. 2011, 103, 288–295. [Google Scholar] [CrossRef] [Green Version]
  3. Obrycki, J.; Karlen, D.; Cambardella, C.; Kovar, J.; Birrell, S. Corn Stover Harvest, Tillage, and Cover Crop Effects on Soil Health Indicators. Soil Water Manag. Conserv. 2018, 82, 910–918. [Google Scholar] [CrossRef] [Green Version]
  4. Muth, D.J.; Bryden, K.M.; Nelson, R.G. Sustainable agricultural residue removal for bioenergy: A spatially comprehensive US national assessment. Appl. Energy 2013, 102, 403–417. [Google Scholar] [CrossRef] [Green Version]
  5. Brandes, E.; McNunn, G.S.; Schulte, L.A.; Muth, D.J.; VanLoocke, A.; Heaton, E.A. Targeted subfield switchgrass integration could improve the farm economy, water quality, and bioenergy feedstock production. GCB Bioenergy 2018, 10, 199–212. [Google Scholar] [CrossRef] [Green Version]
  6. McLaughlin, S.; Walsh, M. Evaluating environmental consequences of producing herbaceous crops for bioenergy. Biomass Bioenerg. 1998, 14, 317–324. [Google Scholar] [CrossRef] [Green Version]
  7. Tolbert, V.; Todd, D., Jr.; Mann, L.; Jawdy, C.; Mays, D.; Malik, R.; Bandaranayake, W.; Houston, A.; Tyler, D.; Pettry, D. Changes in soil quality and below-ground carbon storage with conversion of traditional agricultural crop lands to bioenergy crop production. Environ. Pollut. 2002, 116, S97–S106. [Google Scholar] [CrossRef] [PubMed]
  8. Ha, M.; Wu, M.; Tomer, M.; Gassman, P.; Isenhart, T.; Arnold, J.; White, M.; Parish, E.; Comer, K.; Belden, B. Biomass production with conservation practices for two Iowa watersheds. J. Am. Water Resour. Assoc. 2020, 220, 1–15. [Google Scholar] [CrossRef]
  9. Robertson, B.A.; Doran, P.J.; Loomis, L.R.; Robertson, J.R.; Schemske, D.W. Perennial biomass feedstocks enhance avian diversity. GCB Bioenerg. 2011, 3, 235–246. [Google Scholar] [CrossRef]
  10. Kreig, J.; Parish, E.; Jager, H. Growing grasses in unprofitable areas of US Midwest croplands could increase species richness. Biol. Conserv. 2021, 261, 109289. [Google Scholar] [CrossRef]
  11. Kevin, C.; Douglas, K. Enabling Sustainable Landscape Design for Continual Improvement of Operating Bioenergy Supply Systems; U.S. Department of Energy: Washington, DC, USA, 2022. [Google Scholar] [CrossRef]
  12. Dale, V.H.; Kline, K.L.; Parish, E.S.; Eichler, S.E. Engaging stakeholders to assess landscape sustainability: Experiences and insights. Landsc. Ecol. 2019, 34, 1199–1218. [Google Scholar] [CrossRef] [Green Version]
  13. Dale, V.H.; Kline, K.L.; Richard, T.L.; Karlen, D.L.; Belden, W.W. Bridging biofuel sustainability indicators and ecosystem services through stakeholder engagement. Biomass Bioenergy 2018, 114, 143–156. [Google Scholar] [CrossRef]
  14. Brandes, E.; McNunn, G.S.; Schulte, L.A.; Bonner, I.J.; Muth, D.J.; Babcock, B.A.; Sharma, B.; Heaton, E.A. Subfield profitability analysis reveals an economic case for cropland diversification. Environ. Res. Lett. 2016, 11, 014009. [Google Scholar] [CrossRef]
  15. Parish, E.; Dale, V.; English, B.; Jackson, S.; Tyler, D. Assessing multimetric aspects of sustainability: Application to a bioenergy crop production system in East Tennessee. Ecosphere 2016, 7, e01206. [Google Scholar] [CrossRef]
Figure 1. Location of the Nevada fuelshed and South Fork watershed landscapes within Iowa.
Sustainability 15 10051 g001
Figure 2. Comparison of agricultural field types within ~3 miles of the Nevada biorefinery under the four different scenarios. All acres are in a corn/soybean rotation under the Base Case and Improved Management scenarios (upper left). Under Integrated Landscape Design A (upper right), switchgrass replaces corn/soy on clustered unprofitable subfields, and under Integrated Landscape Design B (lower right), CRP grasses replace corn/soy on some additional scattered unprofitable subfields. As part of the Integrated Landscape Design scenarios, corn stover is removed from some of the corn/soy acres to be used for bioenergy production.
Sustainability 15 10051 g002
Figure 3. Indicator aggregation for sustainability evaluation of the four landscapes.
Sustainability 15 10051 g003
Figure 4. Scales assigned to each attribute in the model. Red scale values are negative impacts, black scale values are neutral impacts, and green scale values are benefits (e.g., increased ecosystem services).
Sustainability 15 10051 g004
Figure 5. Evaluation results for the four alternative scenarios at the Nevada fuelshed extent. Red font color indicates less desirable indicator values, and green font color indicates more desirable indicator values.
Sustainability 15 10051 g005
Figure 6. Evaluation results for the four alternative scenarios at the South Fork watershed extent. Red font color indicates less desirable indicator values, and green font color indicates more desirable indicator values.
Sustainability 15 10051 g006
Figure 7. Indicator tradeoffs and overall sustainability for each of the four scenarios at the Nevada fuelshed extent.
Sustainability 15 10051 g007
Figure 8. Indicator tradeoffs and overall sustainability for each of the four scenarios at the South Fork watershed extent.
Sustainability 15 10051 g008
Figure 9. Relative sustainability ratings for each of the four scenarios at the Nevada fuelshed extent.
Sustainability 15 10051 g009
Table 1. Nomenclature for the farm management practices modeled with Profit Zone Manager (PZM). Each column shows the variable choices for a given management type.
Crop TypeTillage PracticeCorn Residue RemovalCover CropNitrogen Fertilizer Application
CG = corn grainCT = conventional tillNRH = no residue harvestNCC = no cover cropNF = fall application only
SB = soybeanRT = reduced till30 RH = 30% biomass removalRYE = cereal rye cover cropNPS = spring application, in-season side-dress
SWG = switchgrassNT = no-till45 RH = 45% biomass removal
CRP = Conservation Reserve Program grasses 70 RH = 70% biomass removal
Table 2. AgSolver simulations used in the development of the four landscape design scenarios.
AgSolver Results TableLandscape Design(s)RepresentationName of GIS Layer
CT_NRH_NCC_NFBase CaseAll corn/soy acresBase Case
RT_NRH_NCC_NPSImproved ManagementAll corn/soy acresNevada_ImpMgmt
Integrated Landscape Design ACorn/soy acres remaining after switchgrass plantings and stover removal acres
SWGIntegrated Landscape Designs A and BSwitchgrass grown on clustered low-ROI acresNevada_SWG
NT_30H_RYE_NPSIntegrated Landscape Design ACorn/soy acres with ≥165 bu/acre and ≤5% slope (based on “Base Case” scenario yields) that remain after removing fields converted to switchgrass Nevada_30RH
CRPIntegrated Landscape Design BNon-clustered low-ROI land allocated to CRPNevada_CRP
NT_45RH_RYE_NPSIntegrated Landscape Design BCorn/soy acres with ≥165 bu/acre and ≤5% slope (based on “Base Case” scenario yields) that remain after removing fields converted to switchgrass and CRPNevada_45RH
NT_NRH_RYE_NPSIntegrated Landscape Design BRemaining corn/soy acres after acres have been allocated to switchgrass, CRP, and stover removalNevada_RyeCover
Table 3. Comparison of Nevada fuelshed area allocated to each biomass type under the four landscape designs.
ScenarioCorn GrainCorn Grain and Stover SwitchgrassCRP Grasses
Base Case3,601,086 acres (100%)000
Improved Management3,601,086 acres (100%)000
Landscape Design A1,550,411 acres (43%)1,742,844 (48%)307,830 (9%)0
Landscape Design B1,501,760 (42%)1,740,363 (48%)307,830 (9%)51,132 (1%)
Table 4. Comparison of South Fork watershed area allocated to each biomass type under the four landscape designs.
ScenarioCorn GrainCorn Grain and Stover SwitchgrassCRP Grasses
Base Case178,465 acres (100%)000
Improved Management178,465 acres (100%)000
Landscape Design A48,970 acres (27%)109,645 acres (61%)19,850 acres (11%)0
Landscape Design B47,340 acres (27%)109,466 acres (61%)19,850 acres (11%)1809 acres (1%)
Table 5. Nevada fuelshed indicator values (annual) for each scenario.
ScenarioAverage Corn Yield (bu/acre)Total Corn Yield (bu)Average Soil Conditioning IndexSediment Eroded by Water (tons)Sediment Eroded by Wind (tons)Total Erosion (tons)
Base Case162.17610,723,480−0.07972713,413,6331,560,07614,973,709
Improved Management175.90661,178,9940.4084519,158,52442,3269,200,850
Landscape Design A180.56617,682,1620.4870497,016,228303,8417,320,069
Landscape Design B185.96608,698,4050.617274,902,072319,0025,221,075
ScenarioChange in Soil Organic Carbon (lb)Nitrous Oxide Flux (lb)Methane Flux (lb)Ammonia Volatilization (lb)Nitrate Leaching (lb)
Base Case−487,389,7488,366,809−30,292,82346,379,351152,510,951
Improved Management−331,278,7807,678,930−30,008,67467,046,407130,606,696
Landscape Design A388,571,2816,234,930−31,051,40653,336,23266,102,829
Landscape Design B1,026,602,3324,886,636−32,178,01140,879,50527,351,983
Table 6. South Fork watershed indicator values (annual) for each scenario.
ScenarioAverage Corn Yield (bu/acre)Total Corn Yield (bu)Average Soil Conditioning IndexSediment Eroded by Water (tons)Sediment Eroded by Wind (tons)Total Erosion (tons)
Base Case168.9431,110,4730.231635330,03410,389340,423
Improved Management175.8632,344,7110.634255232,333260232,592
Landscape Design A179.9529,258,7280.658559191,0235931196,954
Landscape Design B182.7528,868,1850.672918156,8766051162,927
ScenarioChange in Soil Organic Carbon (lb)Nitrous Oxide Flux (lb)Methane Flux (lb)Ammonia Volatilization (lb)Nitrate Leaching (lb)
Base Case−25,927,629368,484−1,615,1623,214,1138,926,373
Improved Management−18,099,528363,367−1,604,3294,419,5647,545,639
Landscape Design A20,837,385286,543−1,655,8313,353,6703,354,335
Landscape Design B34,883,526254,646−1,685,0542,968,9602,119,284
Disclaimer/Publisher’s Note: The statements, opinions and data contained in all publications are solely those of the individual author(s) and contributor(s) and not of MDPI and/or the editor(s). MDPI and/or the editor(s) disclaim responsibility for any injury to people or property resulting from any ideas, methods, instructions or products referred to in the content.

