Article

Evaluation of PM Chemical Composition in Thessaloniki, Greece Based on Air Quality Simulations

by
Dimitrios Theodoros Tsiaousidis
1,*,
Natalia Liora
1,
Serafim Kontos
1,
Anastasia Poupkou
2,
Dimitris Akritidis
3,4 and
Dimitrios Melas
1
1
Laboratory of Atmospheric Physics, Department of Physics, Aristotle University of Thessaloniki, 54124 Thessaloniki, Greece
2
Research Centre for Atmospheric Physics and Climatology, Academy of Athens, Solonos 84, 10680 Athens, Greece
3
Department of Meteorology and Climatology, School of Geology, Aristotle University of Thessaloniki, 54124 Thessaloniki, Greece
4
Atmospheric Chemistry Department, Max Planck Institute for Chemistry, 55128 Mainz, Germany
*
Author to whom correspondence should be addressed.
Sustainability 2023, 15(13), 10034; https://doi.org/10.3390/su151310034
Submission received: 9 May 2023 / Revised: 19 June 2023 / Accepted: 22 June 2023 / Published: 25 June 2023
(This article belongs to the Section Air, Climate Change and Sustainability)

Abstract

:
The average PM10 daily levels over the urban area of Thessaloniki, Greece, usually exceed the air quality limits and therefore the improved PM chemical composition and air quality modeling results that will facilitate the design of the most appropriate mitigation measures (e.g., limitations in wood combustion for heating purposes) are essential. The air quality modeling system WRF-CAMx was applied over a 2 × 2 km2 horizontal resolution grid covering the greater area of Thessaloniki for the year 2015, when Greece was still confronting the consequences of the financial crisis. The output hourly surface concentrations of twelve PM species at three sites of different environmental type characterization in the city of Thessaloniki were temporally and spatially analyzed. Carbonaceous aerosols (organic and elemental) are the major contributor to total PM10 levels during winter representing a 35–40% share. During summer, mineral aerosols (excluding dust) distribute by up to 48% to total PM10 levels, being the major contributor attributed to road traffic. PM species, during winter, increase in the morning and in the afternoon mainly due to road transport and residential heating, respectively, in addition with the unfavorable meteorological conditions. An underestimation of the primary organic carbon aerosol levels during winter is identified. The application of the modeling system using a different speciation profile for the fine particles emissions from residential heating based on observational data instead of the CAMS emissions profile revealed an improvement in the simulated OC/EC values for which a 50% increase was identified compared to the base run.

1. Introduction

Air quality is usually poor in urban environments, where the residential density is increased and the emissions of pollutants are concentrated in a relatively small area [1,2]. Exposure to particulate matter (PM) may lead to cardiovascular diseases [3,4], asthma attacks [5,6] and bronchitis [6,7], with the smaller particles penetrating deep into the respiratory system, inducing oxidative stress and respiratory diseases [8].
PM10 is emitted from both anthropogenic and natural sources [9], however, in urban environments, the former emissions are significantly augmented [10,11]. Road traffic and residential heating are among the most important anthropogenic sources in terms of PM10 emissions in Greek urban centers during winter [12,13,14]. The impact of the financial crisis in Greece (i.e., from about 2009 until 2018) was among others the use of cheaper fuels for residential heating [15], such as wood and pellets resulting in increased PM10 levels [16,17]. Additionally, it has been reported that Greek urban centers are severely affected by locally emitted anthropogenic dust aerosol from resuspension due to road traffic [18], however, dust transport from the adjacent Sahara desert is also an important contributor to dust aerosol [19,20] leading to even increased PM10 levels in urban areas and therefore to increased mortality [21,22,23].
The current study focuses on Thessaloniki, which is the second largest city in Greece, with over 1 million inhabitants in its metropolitan area. The urban area of Thessaloniki is characterized by heavy traffic [24], affecting air quality levels, with the average PM10 daily levels usually exceeding the air quality limits [25,26]. It should be noted that the European Court of Justice has condemned Greece for systematically exceeding the mean daily limit value of PM10 in Thessaloniki. In 2019, exceedances above the limit value were recorded on 88 days [25]. In addition, it has been reported that the 67% of the Air Quality Index (AQI) is determined by PM10 and PM2.5 in the city center of Thessaloniki [27].
Although literature on air quality modeling has increased rapidly in the past few years, the current study has a high degree of novelty while it is based on a well justified methodology. More specifically, this study focuses on the investigation of the particle pollution problem in the urban area of Thessaloniki in addition with the identification of the major emissions sources. Until now, the vast majority of research studies related to the problem focuses on the analysis of ground-based measurement data of particulate matter during short period campaigns [13,28] and their chemical composition, however the spatial and temporal coverage if relatively poor. On the other hand, there exists limited research for the chemical characterization of aerosols over the city using air quality modeling systems. Air quality models can provide air quality concentration data on a local and regional scale while they can be used for forecasting air pollution episodes. Thus, their validity is essential in order to provide information to local authorities and stakeholders either to inform the public of air pollution episodes or to design effective mitigation plans to improve air quality and protect human health. Thus, the present study aims to investigate the chemical characterization of aerosols in the city of Thessaloniki on a detailed temporal and spatial basis, through the analysis of the simulated PM10 concentration data derived from the application of an air quality modeling system over three nested domains covering Europe, Africa and Asia and focusing on the city of Thessaloniki with high spatial resolution. The air quality modeling system used in the current work has been previously used and validated in many previous air quality studies for Thessaloniki [12,29,30,31,32,33,34]. However, the chemical speciation of aerosols has not been investigated and evaluated before, and therefore the identification of any modeling uncertainty through the evaluation of the modeling system is also performed.
The main goal of the study is the improved PM chemical characterization and modeling results that will facilitate the design of the most appropriate mitigation measures for source-specific emissions to enhance the air quality in urban areas. In addition, a new application of the modeling system aiming to improve the air quality simulated data of carbonaceous (organic and elemental) aerosols derived by residential heating emissions is performed and analysed. The methodological approach of the study, including the modeling application, study area, the chemical speciation of simulated aerosols and the evaluation method is presented in Section 2. The results of the study on a seasonal and hourly basis are analyzed and discussed in Section 3 providing also important knowledge about the impact of the different emission sources on PM10 levels. Moreover, a comparison with previous studies is also provided. In Section 4, a discussion is made for the uncertainties of the modeling system identified while the results of a new application of the modeling system based on the speciation of carbonaceous aerosols from residential heating are also presented and discussed. The major outcomes of the study are summarized in Section 5.

2. Materials and Methods

2.1. Modeling Application

This study builds on the previous research of Liora et al. (2022) [12] where the set-up of the air quality modeling system WRF-CAMx was presented and therefore all the details about the set-up of the model and emissions inventories used has been already presented. In particular, the air quality modeling system consisted of the meteorological model Weather Research and Forecasting Model (WRF) [35], the Comprehensive Air Quality Model with extensions (CAMx) [36] and the Natural Emissions Model (NEMO) [29] has been applied over three nested domains covering Europe (18 × 18 km2), Eastern Mediterranean (6 × 6 km2) and the greater area of Thessaloniki (2 × 2 km2) (Figure 1) for the year 2015. CAMx is a photochemical model using the Eulerian approach being able to simulate the changes of pollutant concentrations in the atmosphere using a set of mathematical equations characterizing the chemical and physical processes in the atmosphere. It adopts the three-dimensional Eulerian grid modeling mainly because of its ability to better and more fully characterize physical processes in the atmosphere and predict the species concentrations throughout the entire model domain.
The set-up of the modeling system, modeling domains and emissions inventory have been described in Liora et al. (2022) [12] where the modeling system had been applied and evaluated for the cold period of 2015. However, in the present study an application and evaluation of the WRF-CAMx modeling system for the whole year of 2015 is performed.
PM emissions from windblown dust and sea salt, and volatile organic compounds from vegetation have been calculated with NEMO [29,33]. The anthropogenic emissions from energy, industry, heating, fuel transformation, solvent use, road transport, non-road transport, waste and agriculture were estimated either through a bottom-up methodology based on regional or national activity data or using the annual database of CAMS-REGv2.2.1 [37] for the year 2015 as it has already been described in the study of Liora et al. 2022 [12]. It should be mentioned that heating emissions are classified into “biomass heating” (from wood/pellets) and “other heating” (from oil/natural gas). Anthropogenic dust emissions due to road traffic have been also included in the simulations based on potential emission data taken by The Netherlands Organization (TNO) [38].
The analysis of the surface output concentration data of PM species is performed over three grid cells of 2 × 2 km2 where the following three monitoring sites of the Municipal Air Quality Network of Thessaloniki are located: Eptapyrgio, Dimarxeio, Martiou (Figure 1). For this reason, hereafter, the examined three grid cells will be referred with the names of the corresponding monitoring sites. The aforementioned grid cells were selected as representative for capturing the pattern of PM levels in the spatial extent of the metropolitan area of Thessaloniki. In addition, a validation of the current application of the modeling system for the aforementioned monitoring sites has been performed for the year 2015 and presented in Section 3.
Finally, it should be mentioned that the WRF model has been evaluated over the area of Greece for the cold period of 2015 as described in Liora et al. (2022) [12] where the performance of the model was found to be overall satisfactory. In addition, in the current study, simulated air temperature and relative humidity derived from WRF for the year 2015 over the grid of Thessaloniki (2 × 2 km2) has been compared with ground-based measurements derived from the monitoring network of the Municipality of Thessaloniki. In the supplementary material, in Tables S2 and S3, the statistical metrics for the mean daily air temperature and relative humidity over the monitoring sites of Eptapyrgio, Dimarxeio and Martiou are presented where an overall satisfactory performance is identified.

2.2. Chemical Speciation

The chemical speciation of anthropogenic emissions data which were introduced in CAMx model was initially made based on chemical split factors provided with the CAMS-REGv2.2.1. database, where PM are classified into the following chemical species: elemental carbon (EC), organic carbon (OC), sodium (Na), sulfates (SO4) and other minerals [12,37].
PM emissions from natural and anthropogenic sources are introduced to the model in coarse (PMc) and fine (PMfine) mode. PMfine and PMc and emissions are classified into 10 and 2 species respectively as shown in Table 1.
Primary organic aerosol (POA) and primary elemental carbon (PEC) species are referred exclusively to fine aerosol. Emissions of coarse sulfate and primary elemental carbon aerosol are considered as coarse other primary (CPRM) aerosol in CAMx. Dust aerosols with both natural and anthropogenic origin are grouped as fine crustal (FCRS) and coarse crustal (CCRS) depending on their size.
Nitrogenous aerosol (i.e., particulate nitrate (PNO3) and particulate ammonium (PNH4)) are produced exclusively secondarily. Sulfate aerosol (PSO4) is mainly produced secondarily. Fine other primary (FPRM) aerosol group consists mainly of fine mineral aerosols (excluding dust) and seasalt. In addition, it should be mentioned that PNO3, PNH4 and PSO4 include the fine portion of particulate nitrate, ammonium, and sulfate respectively.
Secondary Organic Aerosols (SOA) include anthropogenic and biogenic SOA which have been grouped into a single SOA category, in the current study.
The fine sodium (Na) aerosols also include a portion (30%) of fine seasalt aerosols, while the fine chloride (PCl) aerosols represent 55% of fine seasalt aerosol. The approximately remaining 15% of fine seasalt aerosol is splitted between PSO4 (7.68%) and FPRM (6.67%) species.
Finally, it should be mentioned that anthropogenic emissions of minerals and other elements (e.g., Al, Si, S, K, V) are not included separately in the validated existing emissions databases (either in the European emissions database of CAMS-REG or the national emissions inventories). In the current study, emissions and concentrations of these elements are categorized into FPRM and CPRM. The chemical speciation factors of these elements are not existed in the CAMS-REG split factors provided by the The Netherlands Organization (TNO) since all these elements are included in the “other minerals” category.

2.3. Evaluation

In the present study, a spatial and temporal (seasonal and hourly basis) analysis of the mean surface concentration of PM species is made in comparison with PM ground-based measurement data from previous studies. For the evaluation of the modeling system, statistical measures between simulated and observed concentrations have been estimated. In addition, due to the fact that measurements of PM chemical species were not available, a quantitative evaluation has been made through the comparison of PM species levels with the literature.
In addition, in the present study, an investigation of the POA, PEC and SOA levels is performed by comparing the ratio of the simulated organic and elemental carbon with those reported in literature [13,39]. However, CAMx output concentrations of POA concern the total organic mass and therefore a conversion to organic carbon was performed by inserting the constant conversion factor c as shown in Equation (1). This factor lies between 1.3 and 1.6, dependently on the study [13,14,40]. In the current study the value of 1.3 was used.
O C E C = P O A + S O A c P E C
This ratio is used as indicator for the presence of secondary organic aerosols [13,41] and for the determination of the most important sources of air pollution [42,43].

3. Results

This section presents the spatial and temporal (i.e., on seasonal and hourly basis) analysis of the chemical species of the simulated PM10 concentration data of CAMx over the studied locations in Thessaloniki. The analysis is made also in comparison with ground based measured aerosol data derived from previous studies.

3.1. Seasonal Variation

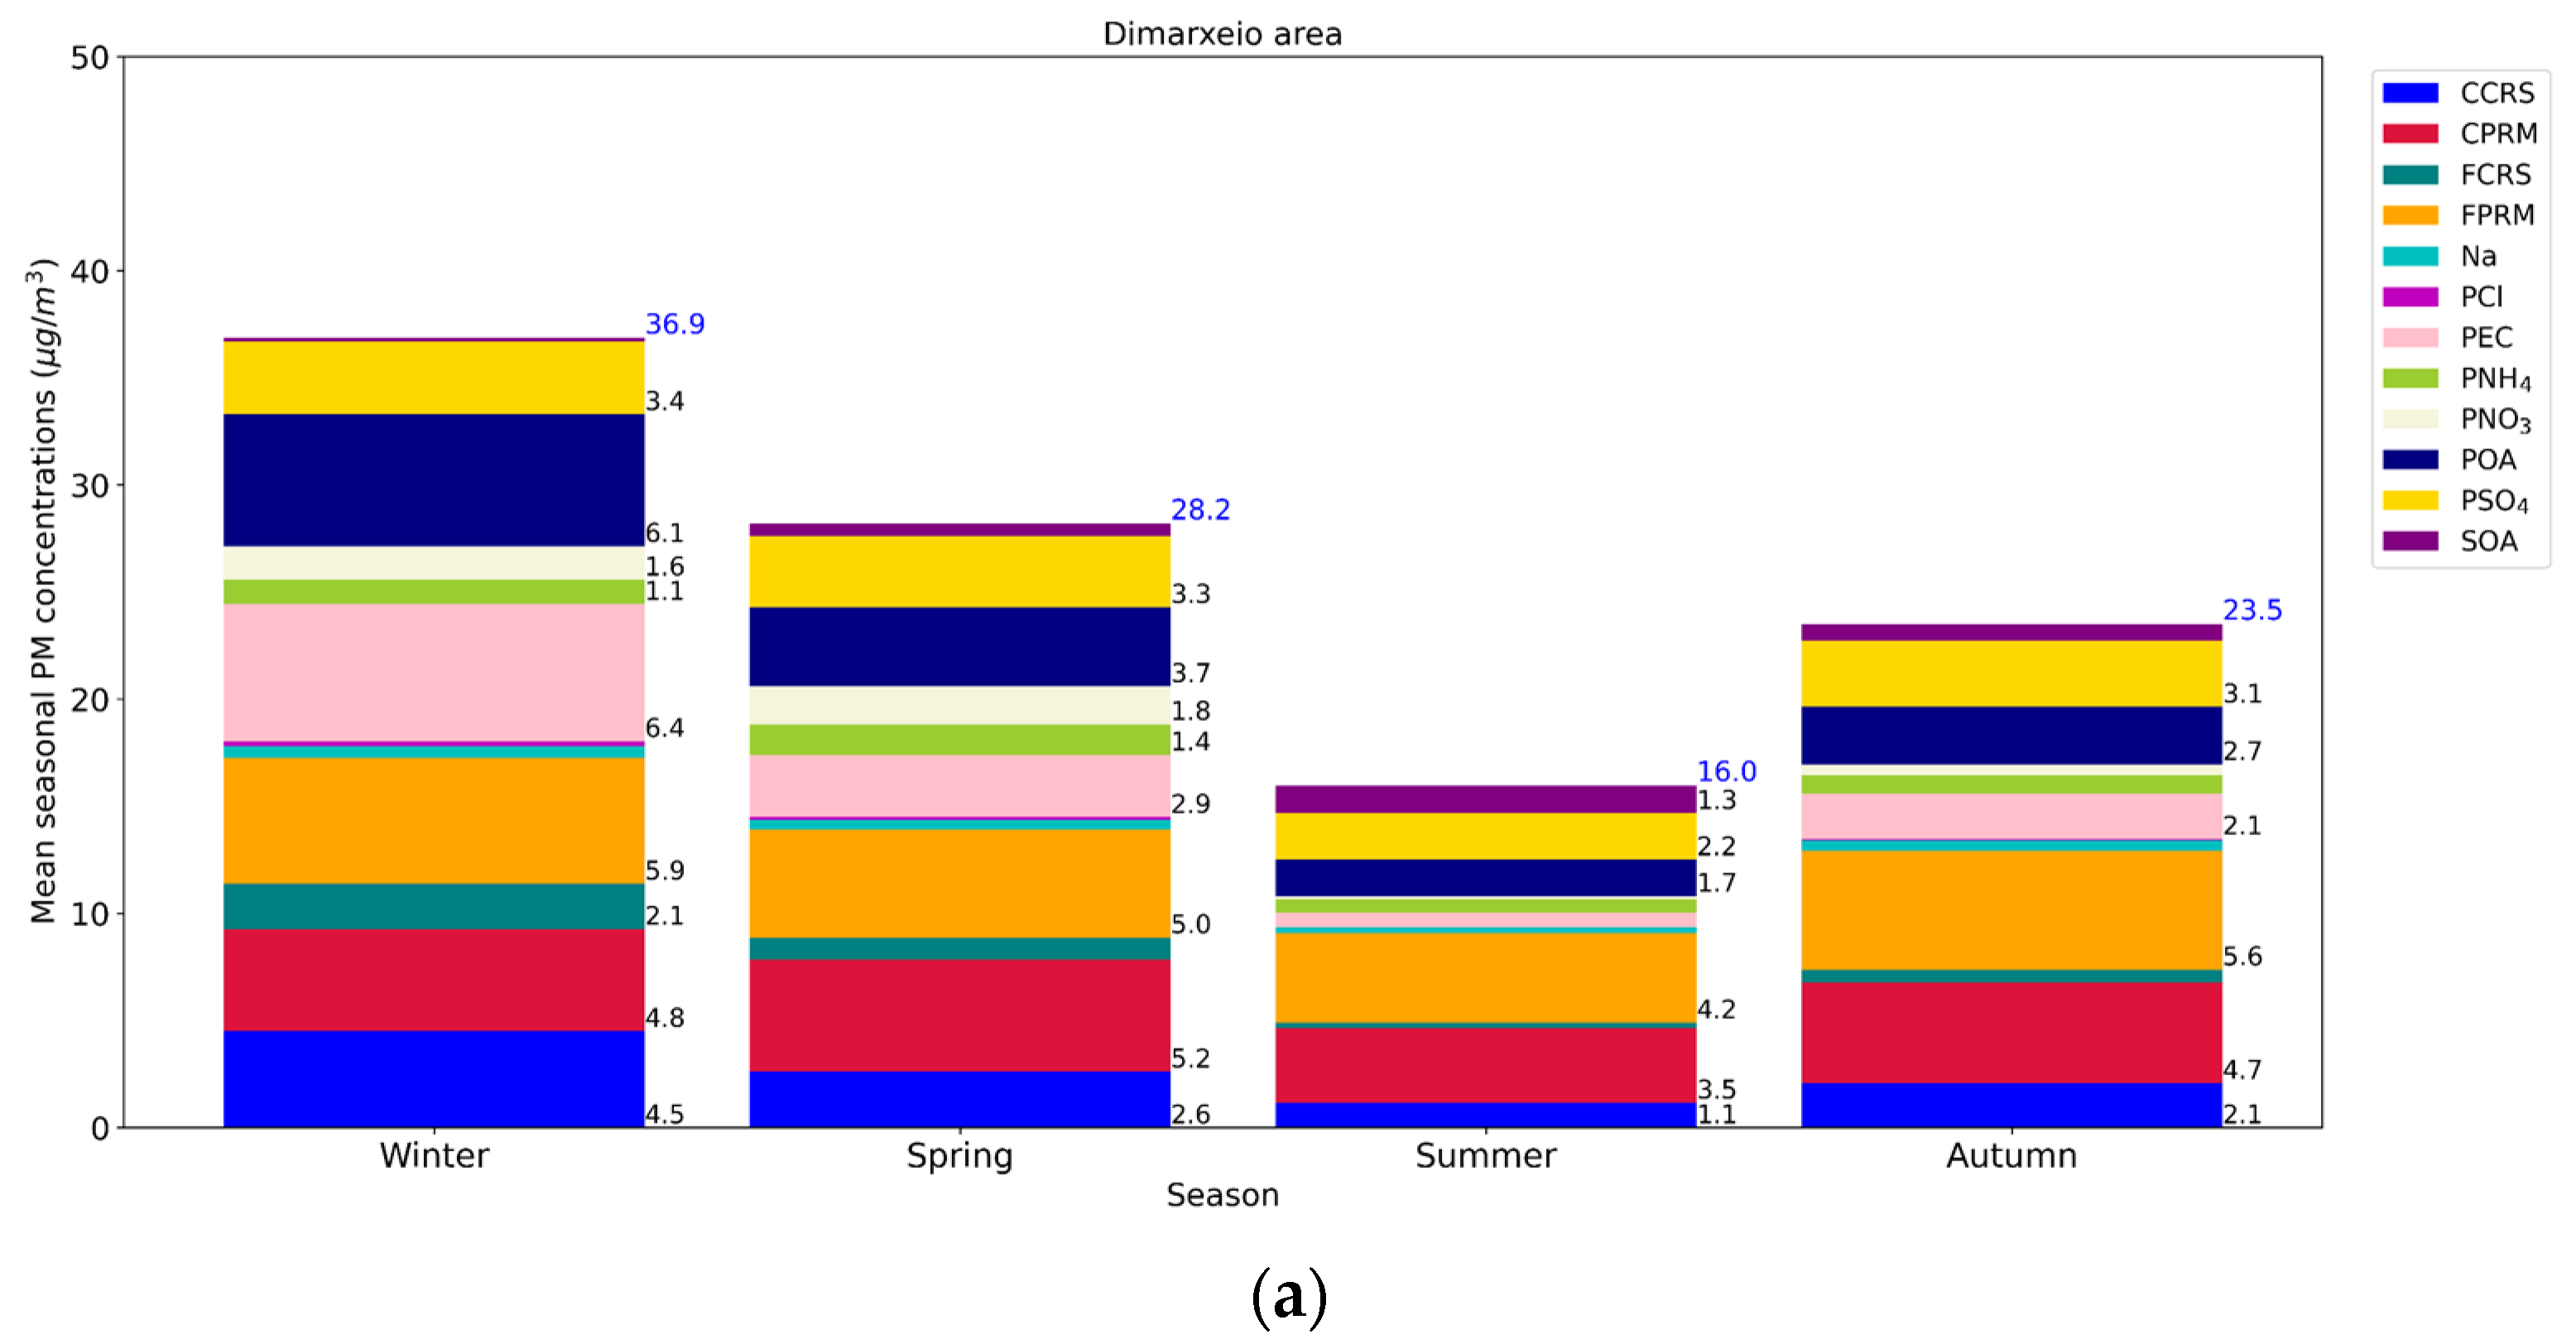
In this subsection, the seasonal variation of PM species is presented. It is found that PM10 concentrations are the highest during winter over all the studied grid cells followed by spring, autumn and summer ones, when PM10 levels are by 30–43% lower (Figure 2). Previous studies have identified that PM10 levels are maximum during winter in Thessaloniki area [25,44,45]. Regarding to the spatial distribution of the PM load, the highest PM10 levels have been identified in Dimarxeio area, followed by Martiou, and Eptapyrgio, where mean PM10 concentration levels during winter were 34.5 μg/m3, and 30.1 μg/m3, respectively (Figure 2).
The comparison of the simulated PM10 levels with the observed ones in Dimarxeio, Martiou and Eptapyrgio monitoring sites for the year 2015 revealed a satisfactory modeling performance during winter while an underestimation of PM10 levels is shown during the summer period (Figure S1 and Table S1, in the Supplement). Possible uncertainties in the spatial distribution of road transport emissions in addition to the fact that the spatial analysis of 2 × 2 km2 cannot capture adequately the real air quality status over the traffic sites may be responsible for the underestimation of PM10 levels during summer when road transport is the major contributor. Moreover, a portion of the grid cells of Dimarxeio and Martiou are covered by sea leading to lower density of emissions over the corresponding grid cells.
In the following, a detailed analysis is made for each PM species based on the results illustrated in Figure 2.

3.1.1. Coarse and Fine Crustal Aerosols

CCRS and FCRS levels are configured by the local emissions from anthropogenic dust resuspension due to road traffic and by the dust transport from desert areas which plays an important role to the frequency and intensity of PM10 exceedances [46]. Dust aerosol is generally larger in size due to the fact that their emissions are caused by mechanical processes such as wind or erosion [47]. Thus, FCRS concentration levels are less than half of the CCRS ones, while both species’ concentrations are greatly elevated in winter in comparison with the other seasons, as it is presented in Figure 2.
According to CAMx results, the major contributor to CCRS and FCRS levels, during winter and spring, is the dust transport from Sahara Desert in agreement with previous studies as it has been shown that dust transport events usually occur during winter and spring in the region of Greece [48,49,50]. This can be revealed from Figure 3 where the daily CCRS concentrations present several peaks (up to 28 μg/m3) during winter and spring, while during summer the daily variation of CCRS levels is almost stable (lower than 1.5 μg/m3) attributed to PM10 dust emissions from resuspension due to road traffic which take their maximum values during summer (Figure S5, in the supplement).
CCRS and FCRS represent a 17.9–22.6%, 12.9–16.6%, 8.8–11.8%, 11.4–15.2% share to total PM10 levels during winter, spring, summer and autumn, respectively, over the grid cells. The corresponding distribution on an annual basis is estimated at 13.7–17.7%. According to Diapouli et al. [51], mineral dust contributed by 8–15% to total PM10 levels in an urban background and a traffic site in the city of Thessaloniki during 2011–2012.
Other studies reveal higher seasonal values of dust particles than the present study [18,52], however they take into account also coarse particles emitted from the non-exhaust road transport [18,53], being in contrast with the approach followed in CAMx model where mineral aerosols from non-exhaust emissions due to road traffic are classified into CPRM and FPRM species. More precisely, according to previous studies, over 6 μg/m3 of coarse particles concentrations were attributed to road dust resuspension in an urban traffic site in Thessaloniki during a cold period, while in the present study the CCRS values are around 4.3–4.7 μg/m3 during winter, including also the dust transport from desert areas [18]. Thus, an underestimation of PM emissions due to road dust resuspension is probably found in the current study. However, it should be taken into account that the spatial analysis of 2 × 2 km2 of the study grid cells is not considered representative for traffic areas.

3.1.2. Coarse and Fine Other Primary Aerosols

CPRM and FPRM concentrations are maximized during winter (with 4.8 μg/m3 and 5.9 μg/m3, respectively) comprising the 12.9% and 16%, respectively, of total PM10 concentrations in Dimarxeio area. During summer, their values are lower compared to other seasons, however, they are the most important contributor to PM10 levels representing a 21.9% and 26.2% share, respectively, due to the low contribution of carbonaceous aerosols (i.e., POA, PEC) in the warm season, when residential heating emissions are absent. A similar pattern is presented for Martiou and Eptapyrgio but the corresponding mean concentrations are lower than the ones in Dimarxeio (Figure 2).

3.1.3. Carbonaceous Aerosols

According to Figure 2, PEC and POA present an intense maximum during winter representing a 17.3% and 16.7%, respectively, to total PM10 levels in Dimarxeio region, while the corresponding percentages in summer are lower due to the absence of residential heating emissions. SOA concentration levels are maximized in summer (about 9% of total PM10) attributed to physicochemical atmospheric processes and biogenic emissions from vegetation [31]. Simulated POA levels receive their maximum values during the winter months in agreement with the literature, as their production is highly linked to residential heating [13,14,54]. Similarly, simulated PEC levels are increased in winter period being also associated to residential heating emissions [41,55]. Furthermore, the mean concentration of POA and PEC is higher in spring compared to autumn when residential heating emissions are higher due to lower temperatures [12]. The mean concentration of POA and PEC during summer are the lowest.
According to Diapouli et al. [51] the contribution of the sum of PEC, POA and SOA to total PM10 levels ranges from 31% to 40% in Thessaloniki urban area during a cold and warm period of 2011–2012. Salameh et al. [52], reported a 28.5% distribution of POA, PEC and SOA to total PM2.5 levels in an urban site of Thessaloniki for the period 2011–2012. In the current study, the percentage distribution of the sum of the PEC, POA and SOA to PM10 levels for the year 2015 ranges from 28 to 33.5% over the study cells while the corresponding distribution to PM2.5 levels is estimated to be 38 to 44%.
According to Figure 2, during winter, PEC and POA levels are roughly equal, while SOA mean concentrations are negligible. Thus, the estimated O C E C ratio is below 1 in the foresaid period. More particularly, during winter this ratio equals at 0.80, 0.83 and 0.81 in Martiou, Dimarxeio and Eptapyrgio respectively. However, previous studies have reported, for the aforementioned ratio, values higher than 4 during winter season, indicating the biomass burning for heating purposes as a major contributor to POA production [13,14,56]. In addition, previous studies [51,56,57] have presented a substantial spatial disparity in the OC/EC ratio during the cold period in Thessaloniki, with OC/EC receiving larger vales in urban background sites in comparison to urban traffic ones. For instance, in urban background sites values larger than 8 are reported, while in urban traffic sites the respective value is close to 2.5 [51,56].
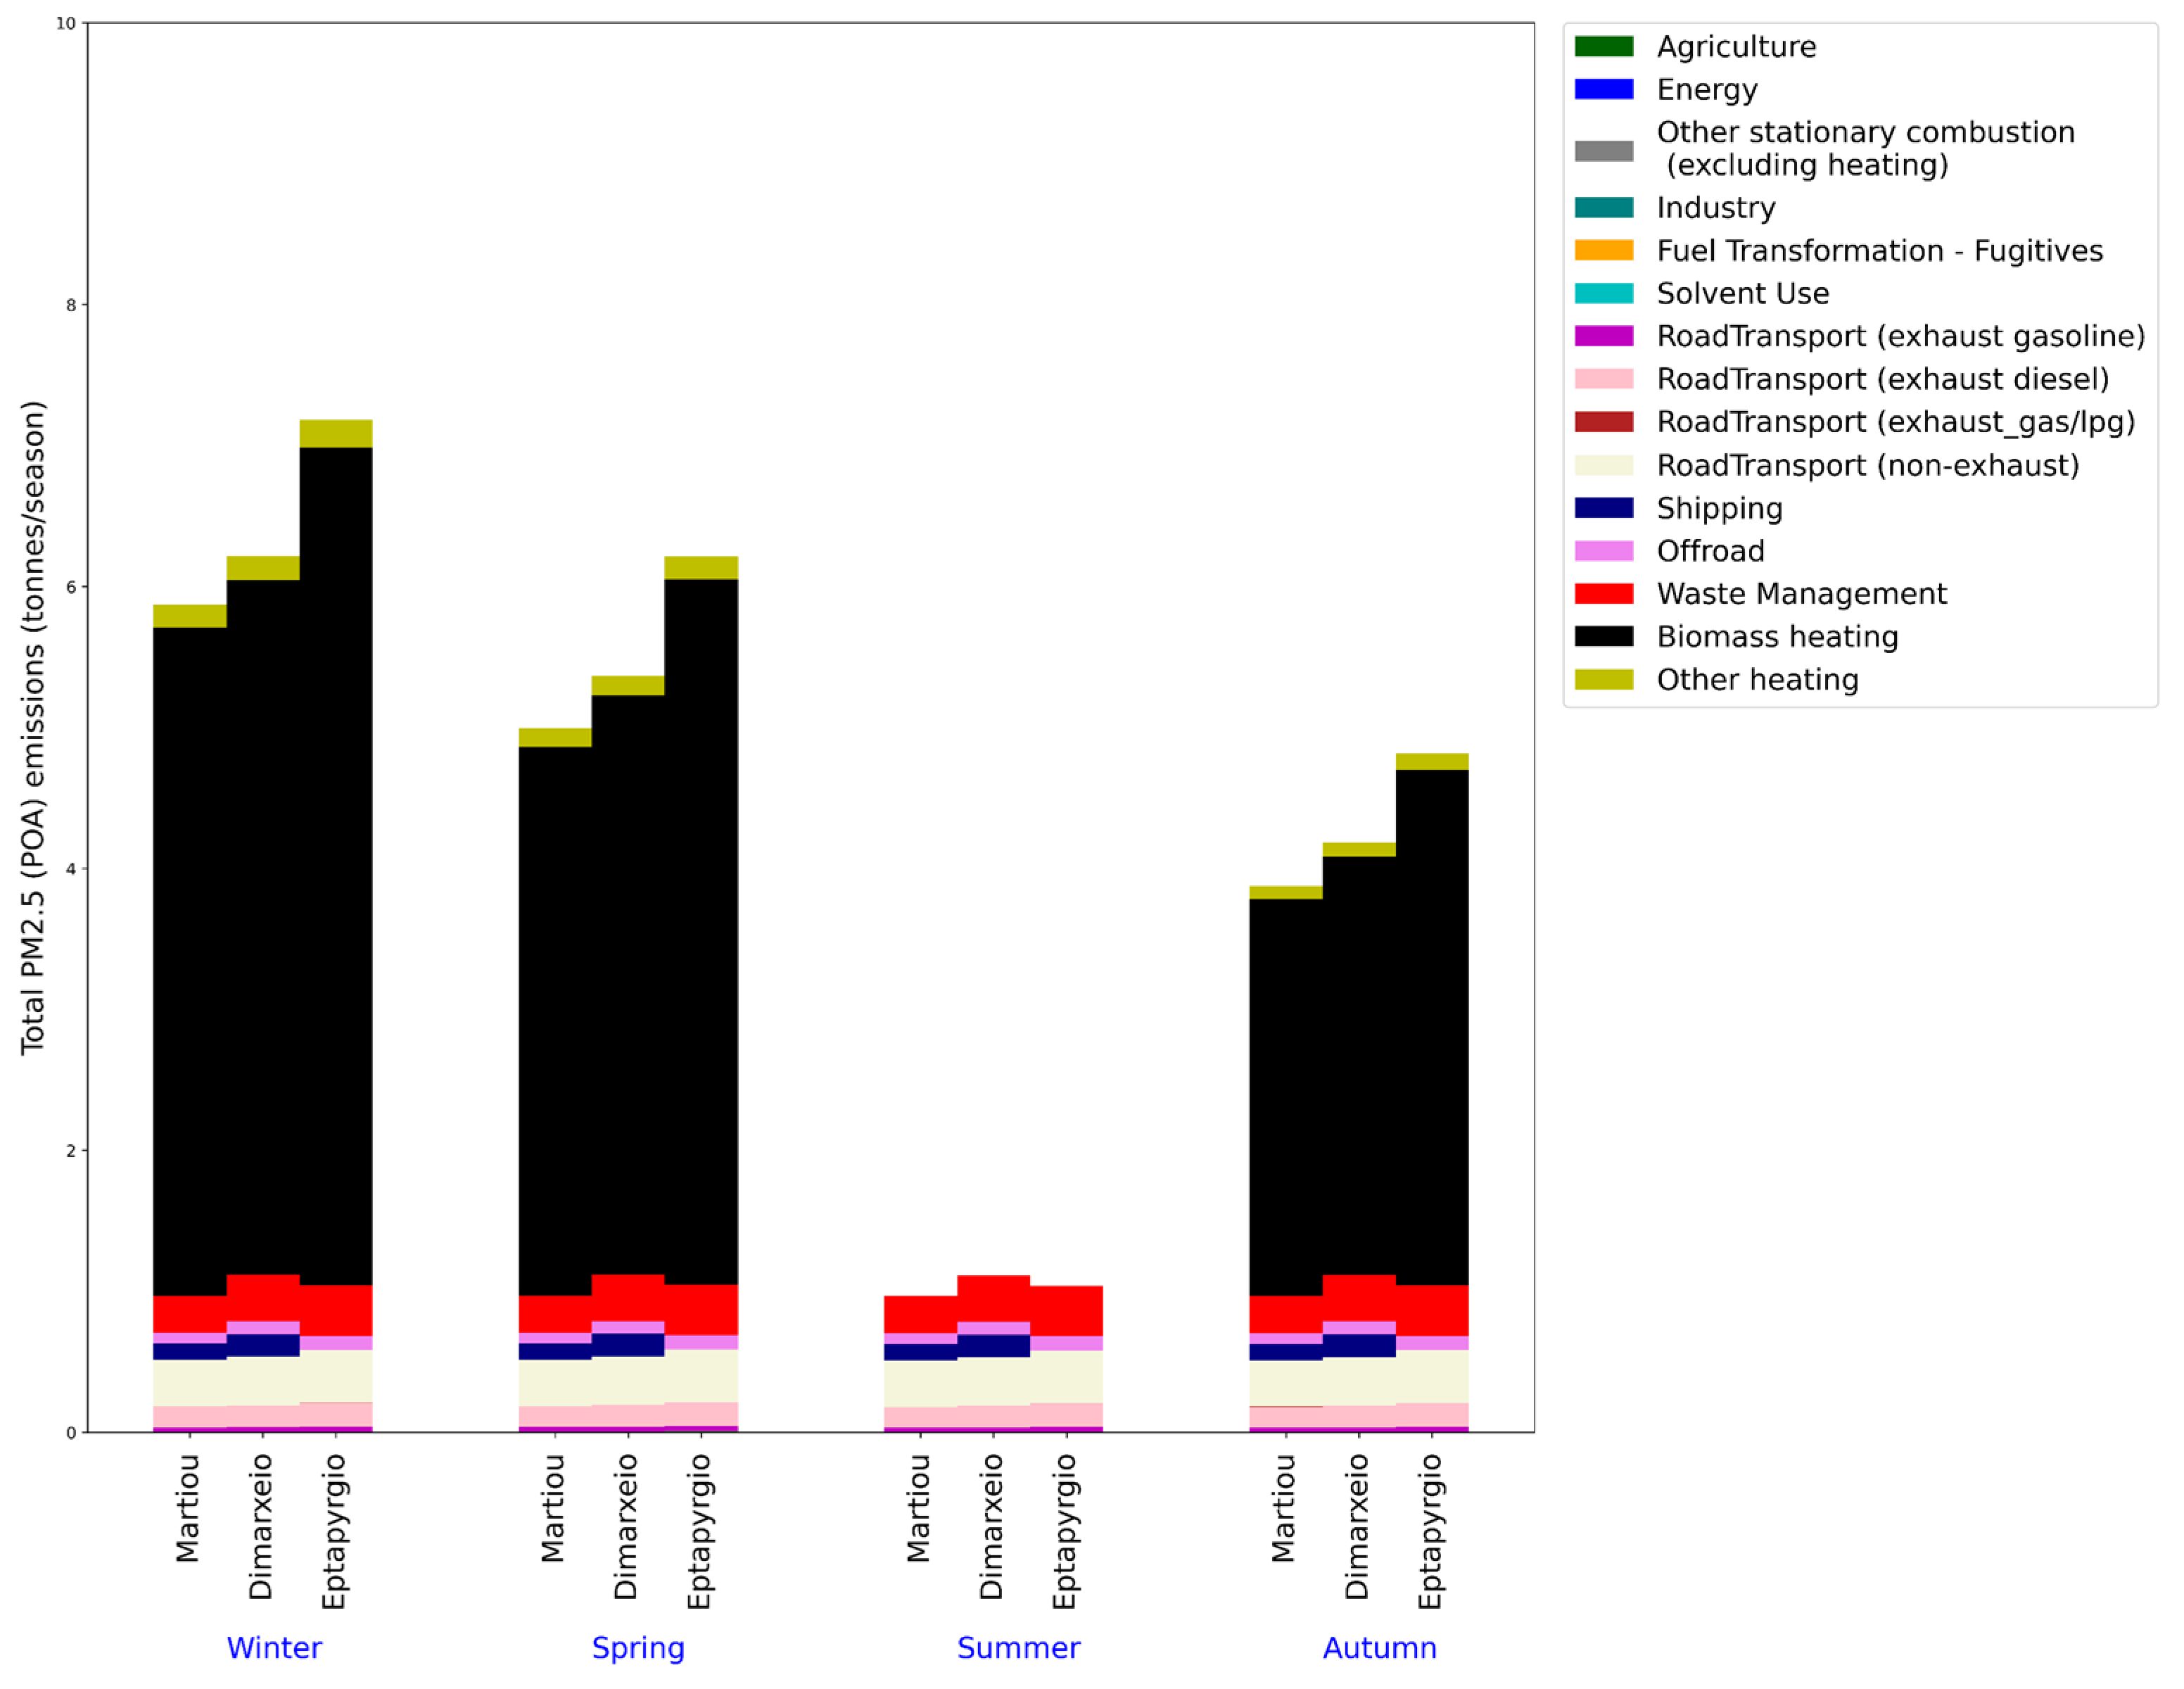
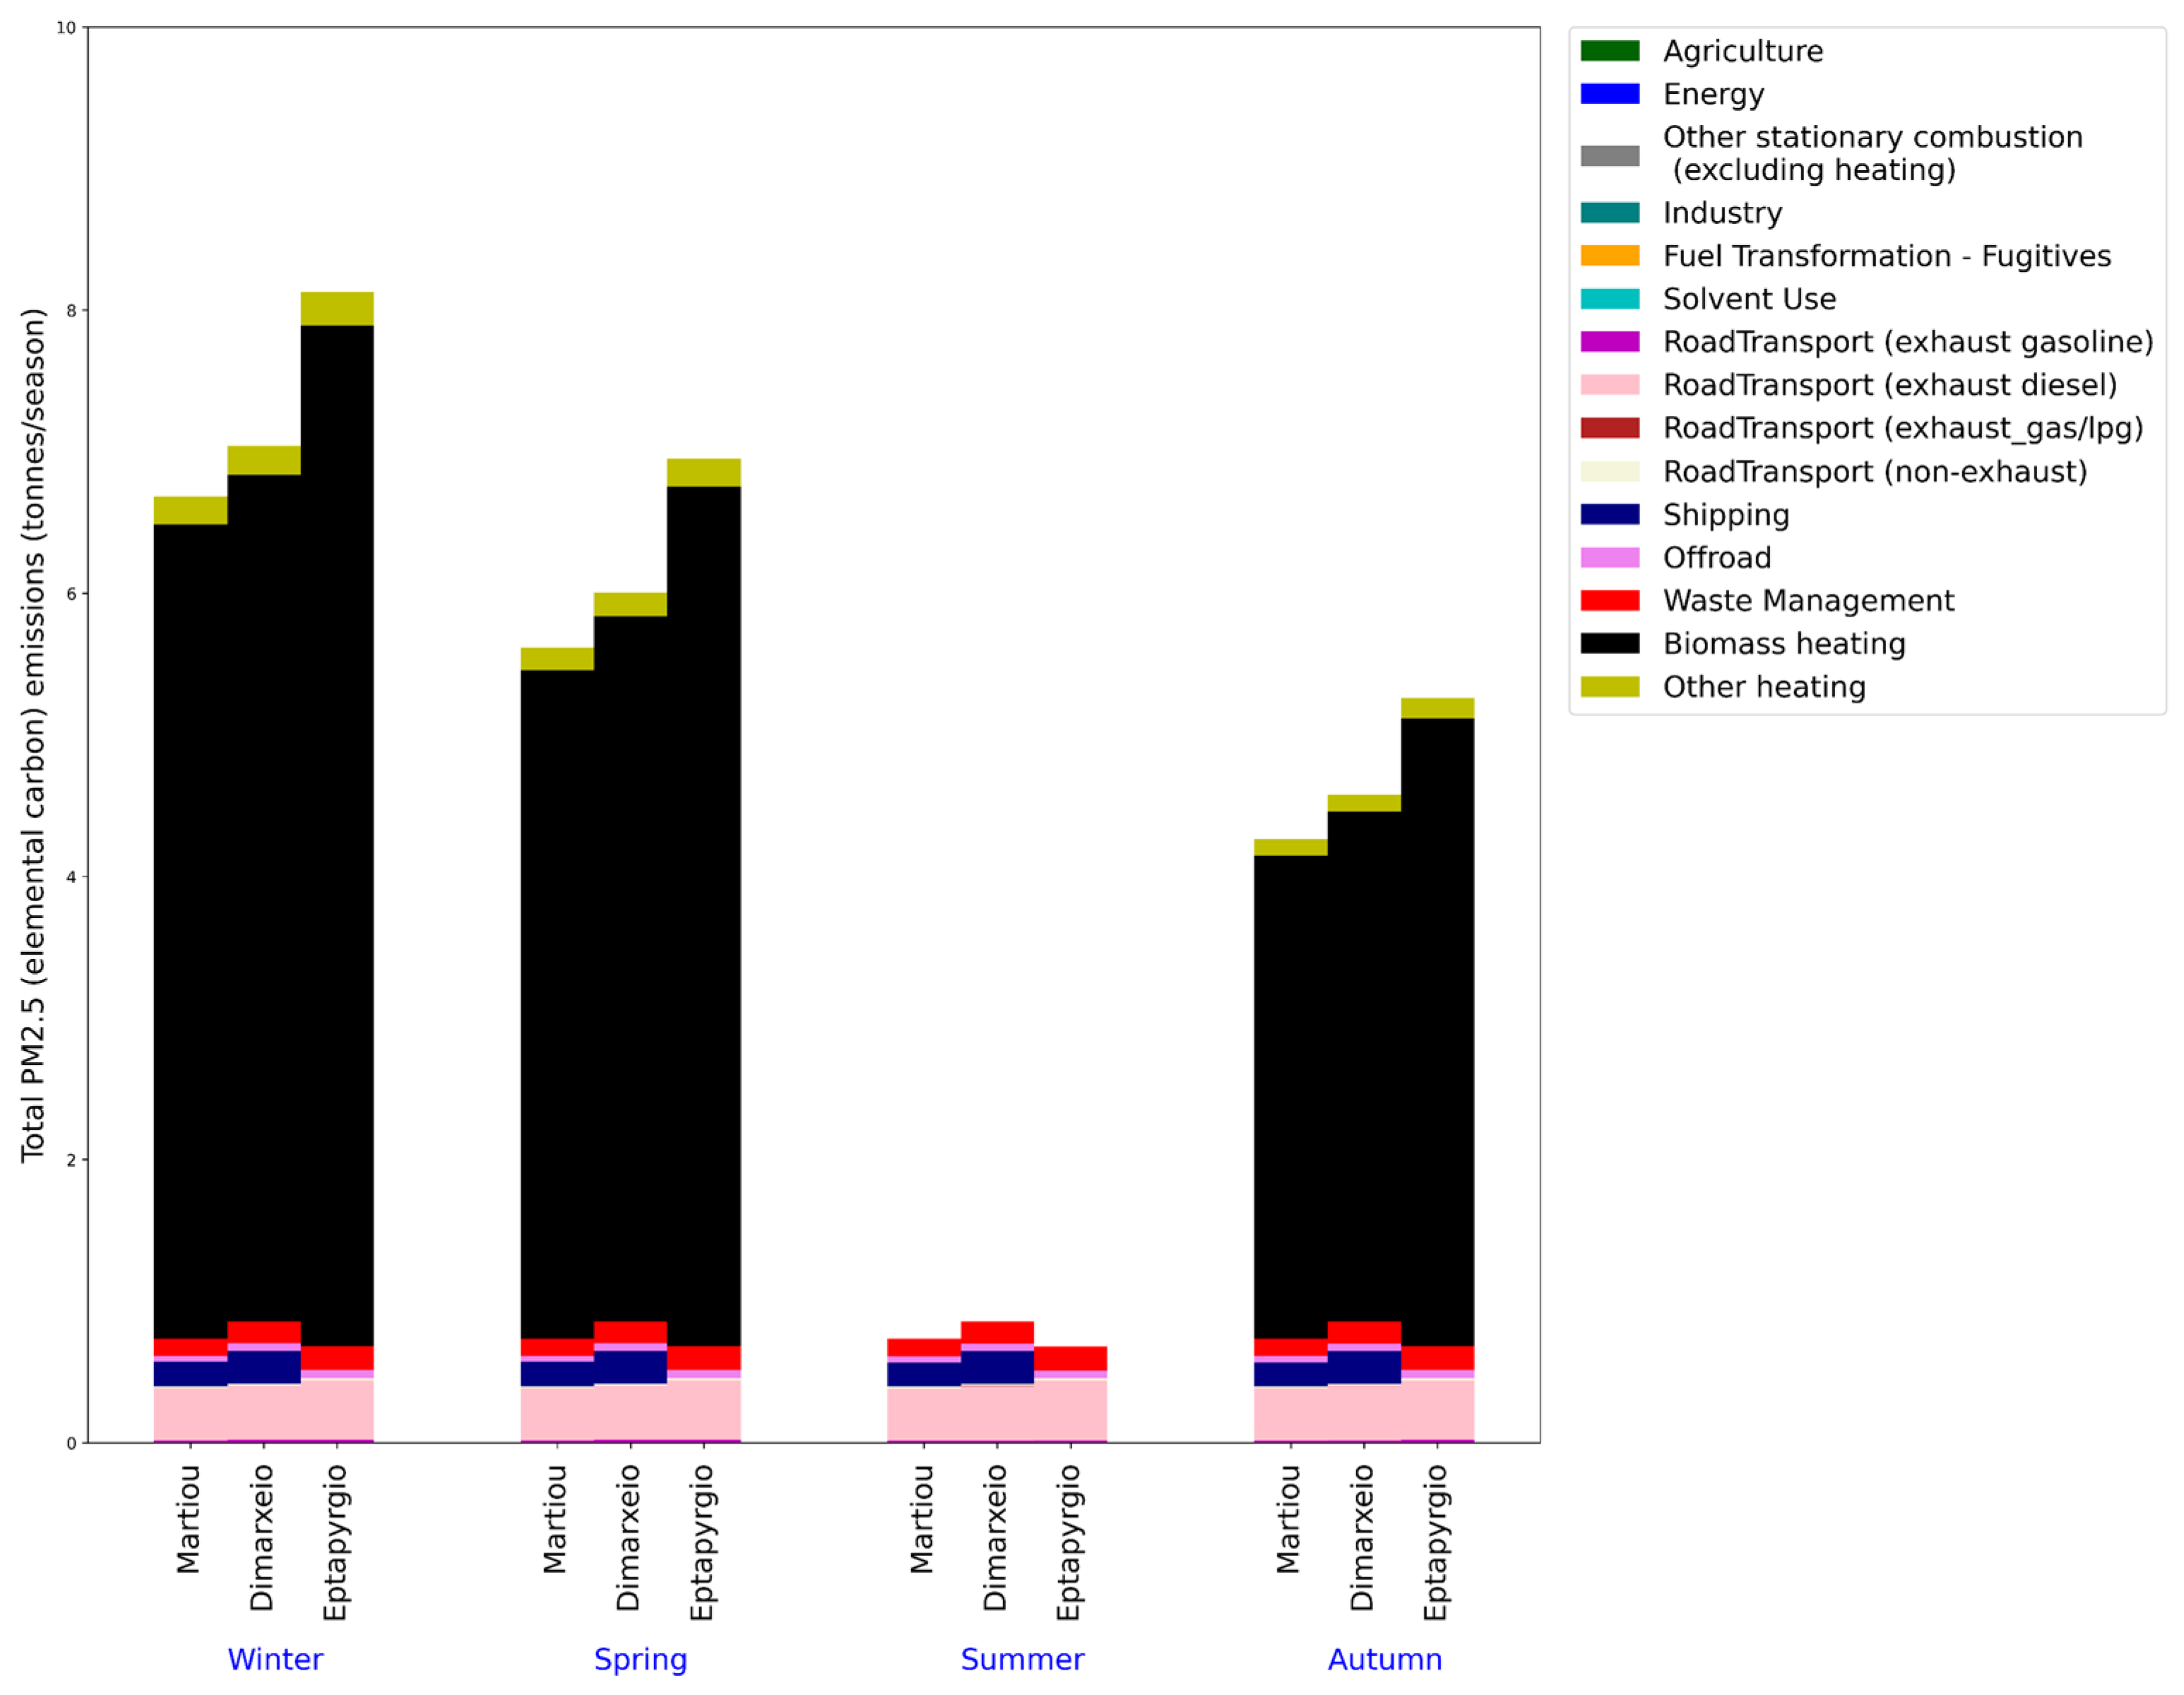
Figure 4 and Figure 5 illustrate the seasonal variation of POA and PEC PM2.5 emissions during the winter of 2015. It is obvious that residential heating, mainly biomass burning, is by far the greatest contributor to POA and PEC emissions during the cold period. In addition, PEC emissions are higher than POA ones due to the split factors used to chemically speciate the residential heating emissions as proposed in the CAMS-REGv2 emission database where common chemical split factors exist for the residential heating oil/natural gas and biomass burning emissions (Table 2). The chemical split factors used in the current study for residential heating, especially for biomass burning, do not accurately represent the chemical distribution of PM given the low simulated O C E C ratio during the cold period of the year. For this reason, a sensitivity analysis is performed and described in detail in Section 4 by modifying the PM split factors used for residential heating due to biomass burning.
Regarding the summer period, the aforementioned simulated ratio lies between 3.6 and 3.9 being in agreement with other researchers who propose values between 3.3 and 4 [14,39,52]. Worth mentioning that the increase of temperature enhances the production of SOA, as these aerosols are also formed when low-volatility oxidation products of volatile organic compounds (VOCs) deposit onto existing particles or form new particles [58].

3.1.4. Sulfate, Ammonium and Nitrate Aerosols

Mean PSO4 levels are approximately 3.4 μg/m3 and 2.2 μg/m3 in winter and summer, respectively over the study grid cells, representing a 9–11.2% and 13.7–18.5% share, respectively. The higher distribution of PSO4 during summer is in agreement with previous studies [14,52,59]. For the city of Thessaloniki, other studies have shown that fine sulfate aerosols do not present considerable seasonal variation while their mean concentrations levels range between 4 and 4.5 μg/m3, comparable with the simulated ones of the current study [14,52,59]. On an annual basis, PNO3 represent a 5.2–6.2% share, over the grid cells, to total PM2.5 levels similarly to previous studies where a 6.3% contribution has been estimated [14,52]. The simulated mean PNO3 concentrations values reach up to 1.6 μg/m3 during winter forming the 5.7–6.7% of PM2.5 for winter, being in satisfactory agreement with the results of Salameh et al. [52], as the represented percentage is equal to 6% during winter. Lastly, the corresponding values for PNH4 equal approximately to 1.1 μg/m3 and 0.6 μg/m3 over the grid cells during winter and summer representing a portion of PM2.5 equal to 4.1–5% and 5.4–7.1% for winter and summer, respectively. On an annual basis, PNH4 contribute by up to 6.6% to total PM2.5 levels over the grid cells while Tolis et al. [14] have estimated a comparable distribution (by around 10%), respectively.

3.2. Hourly Variation

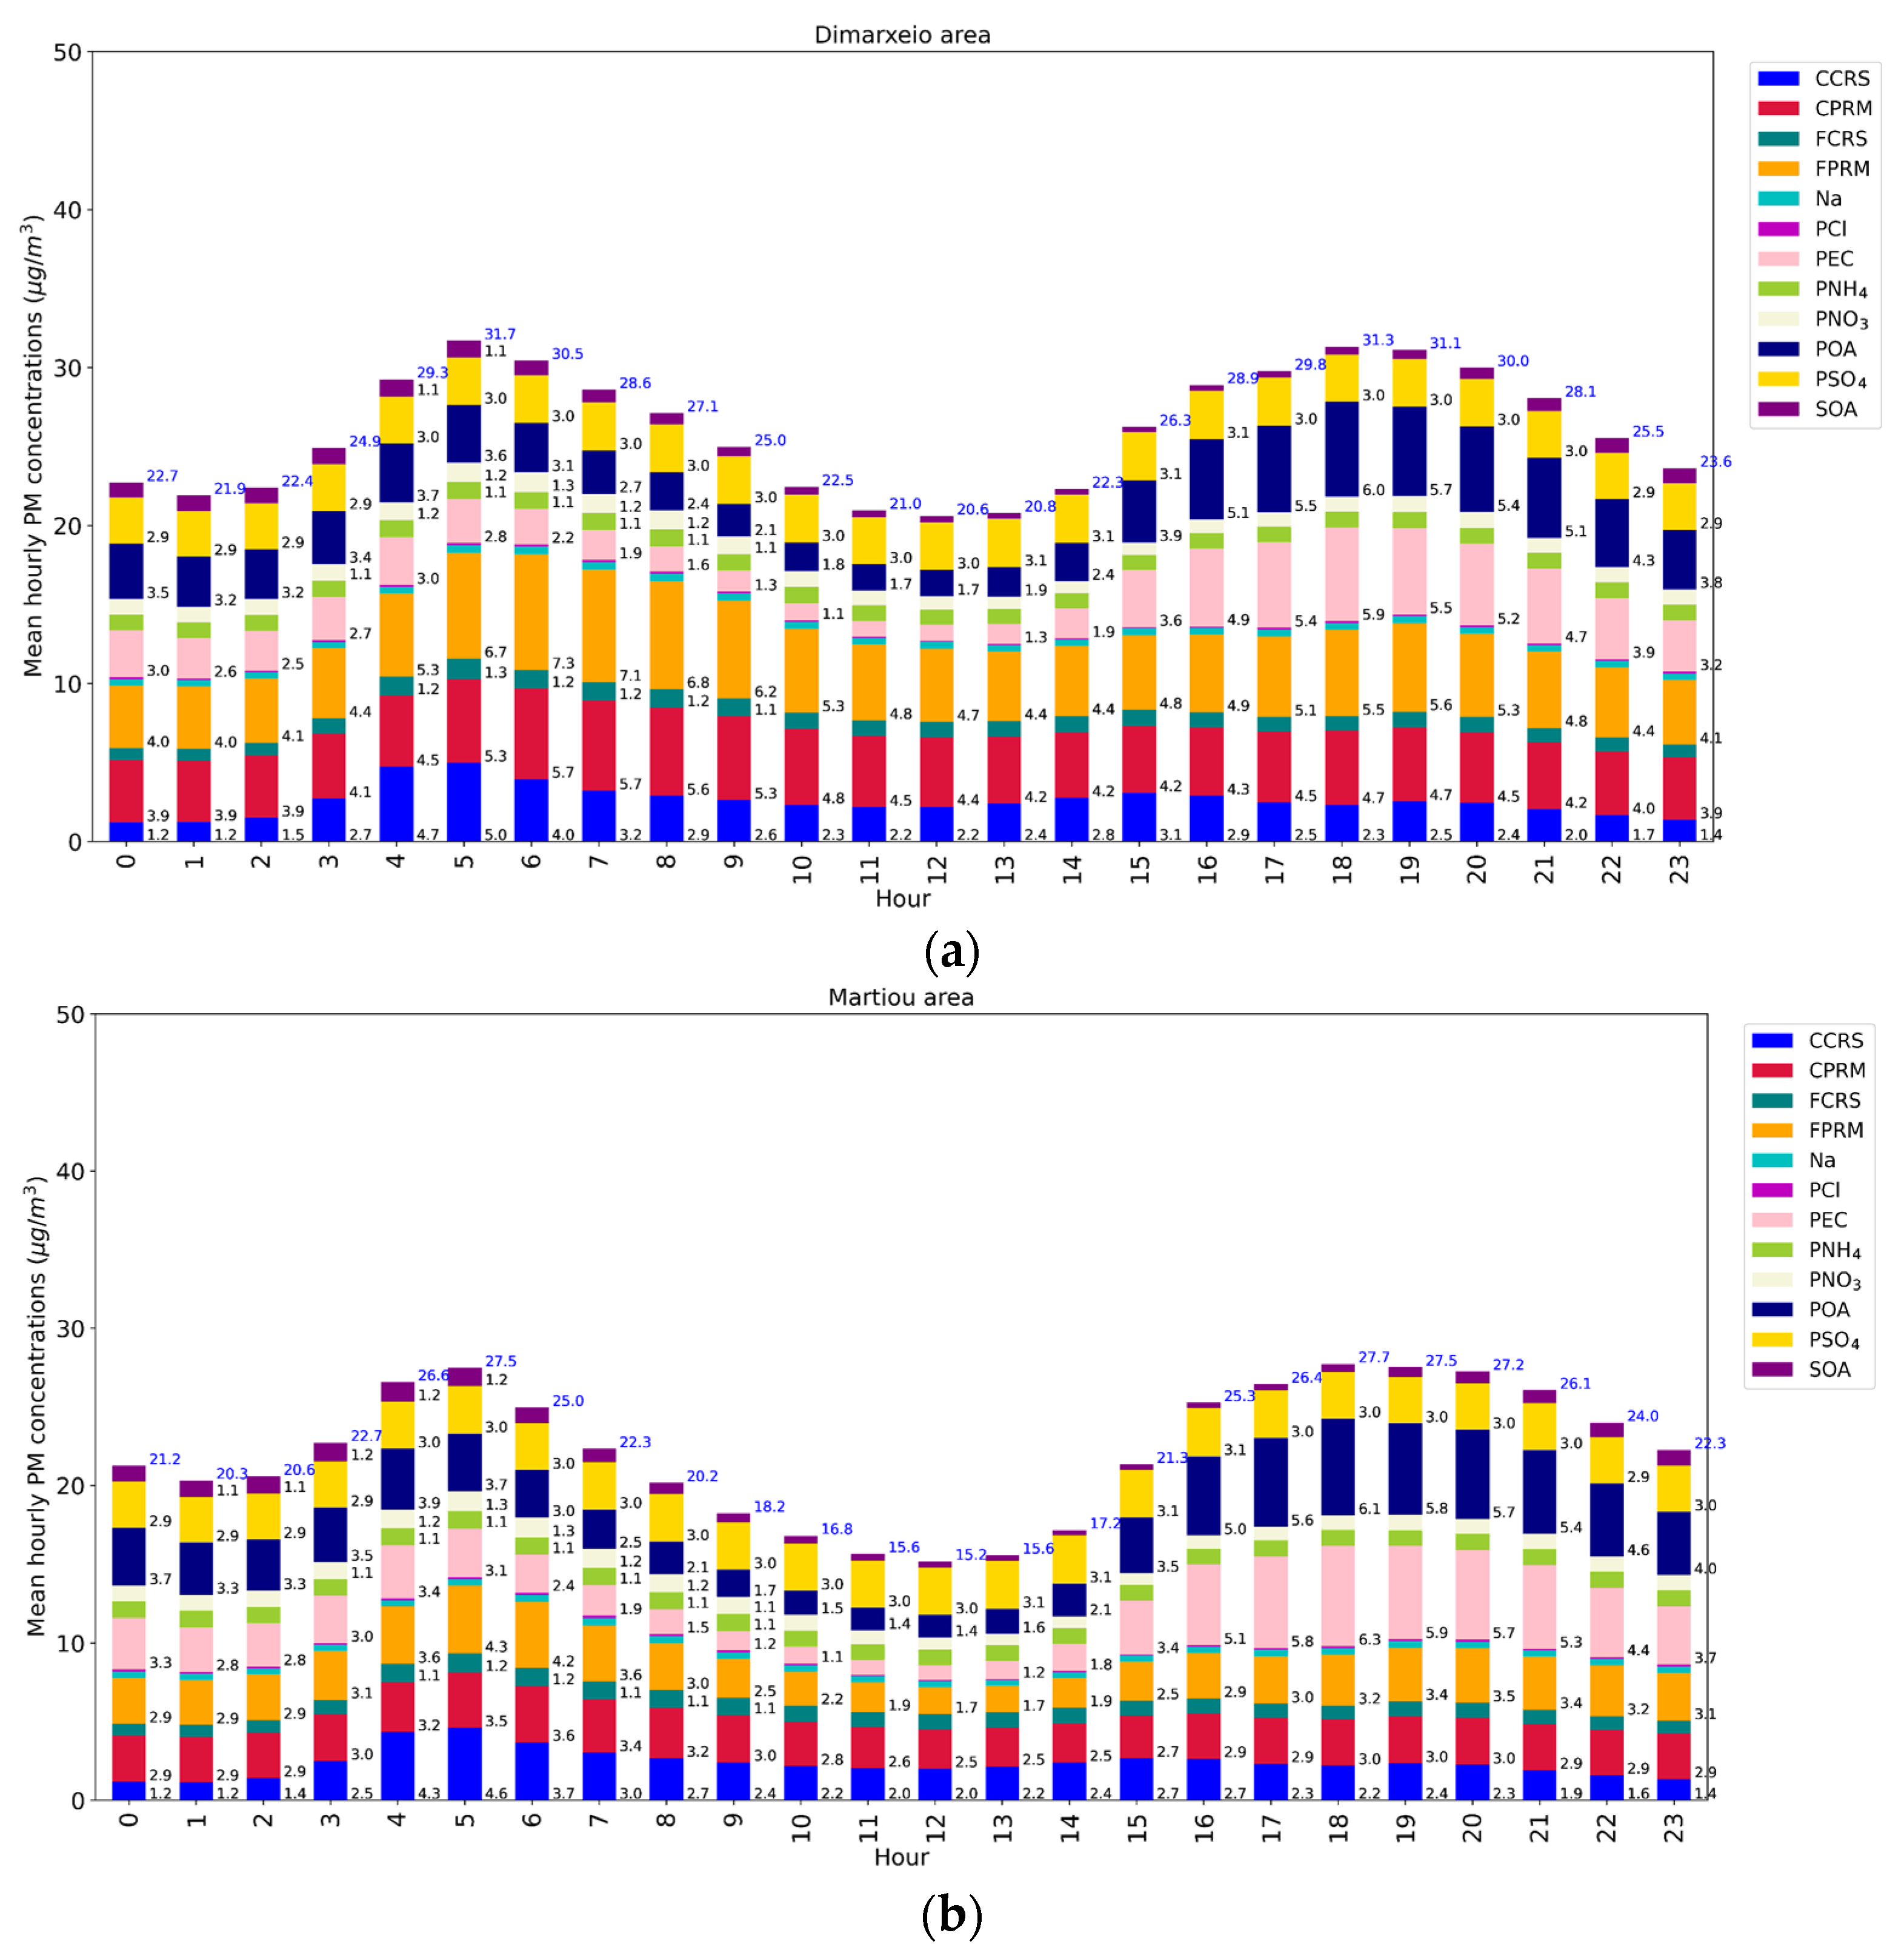
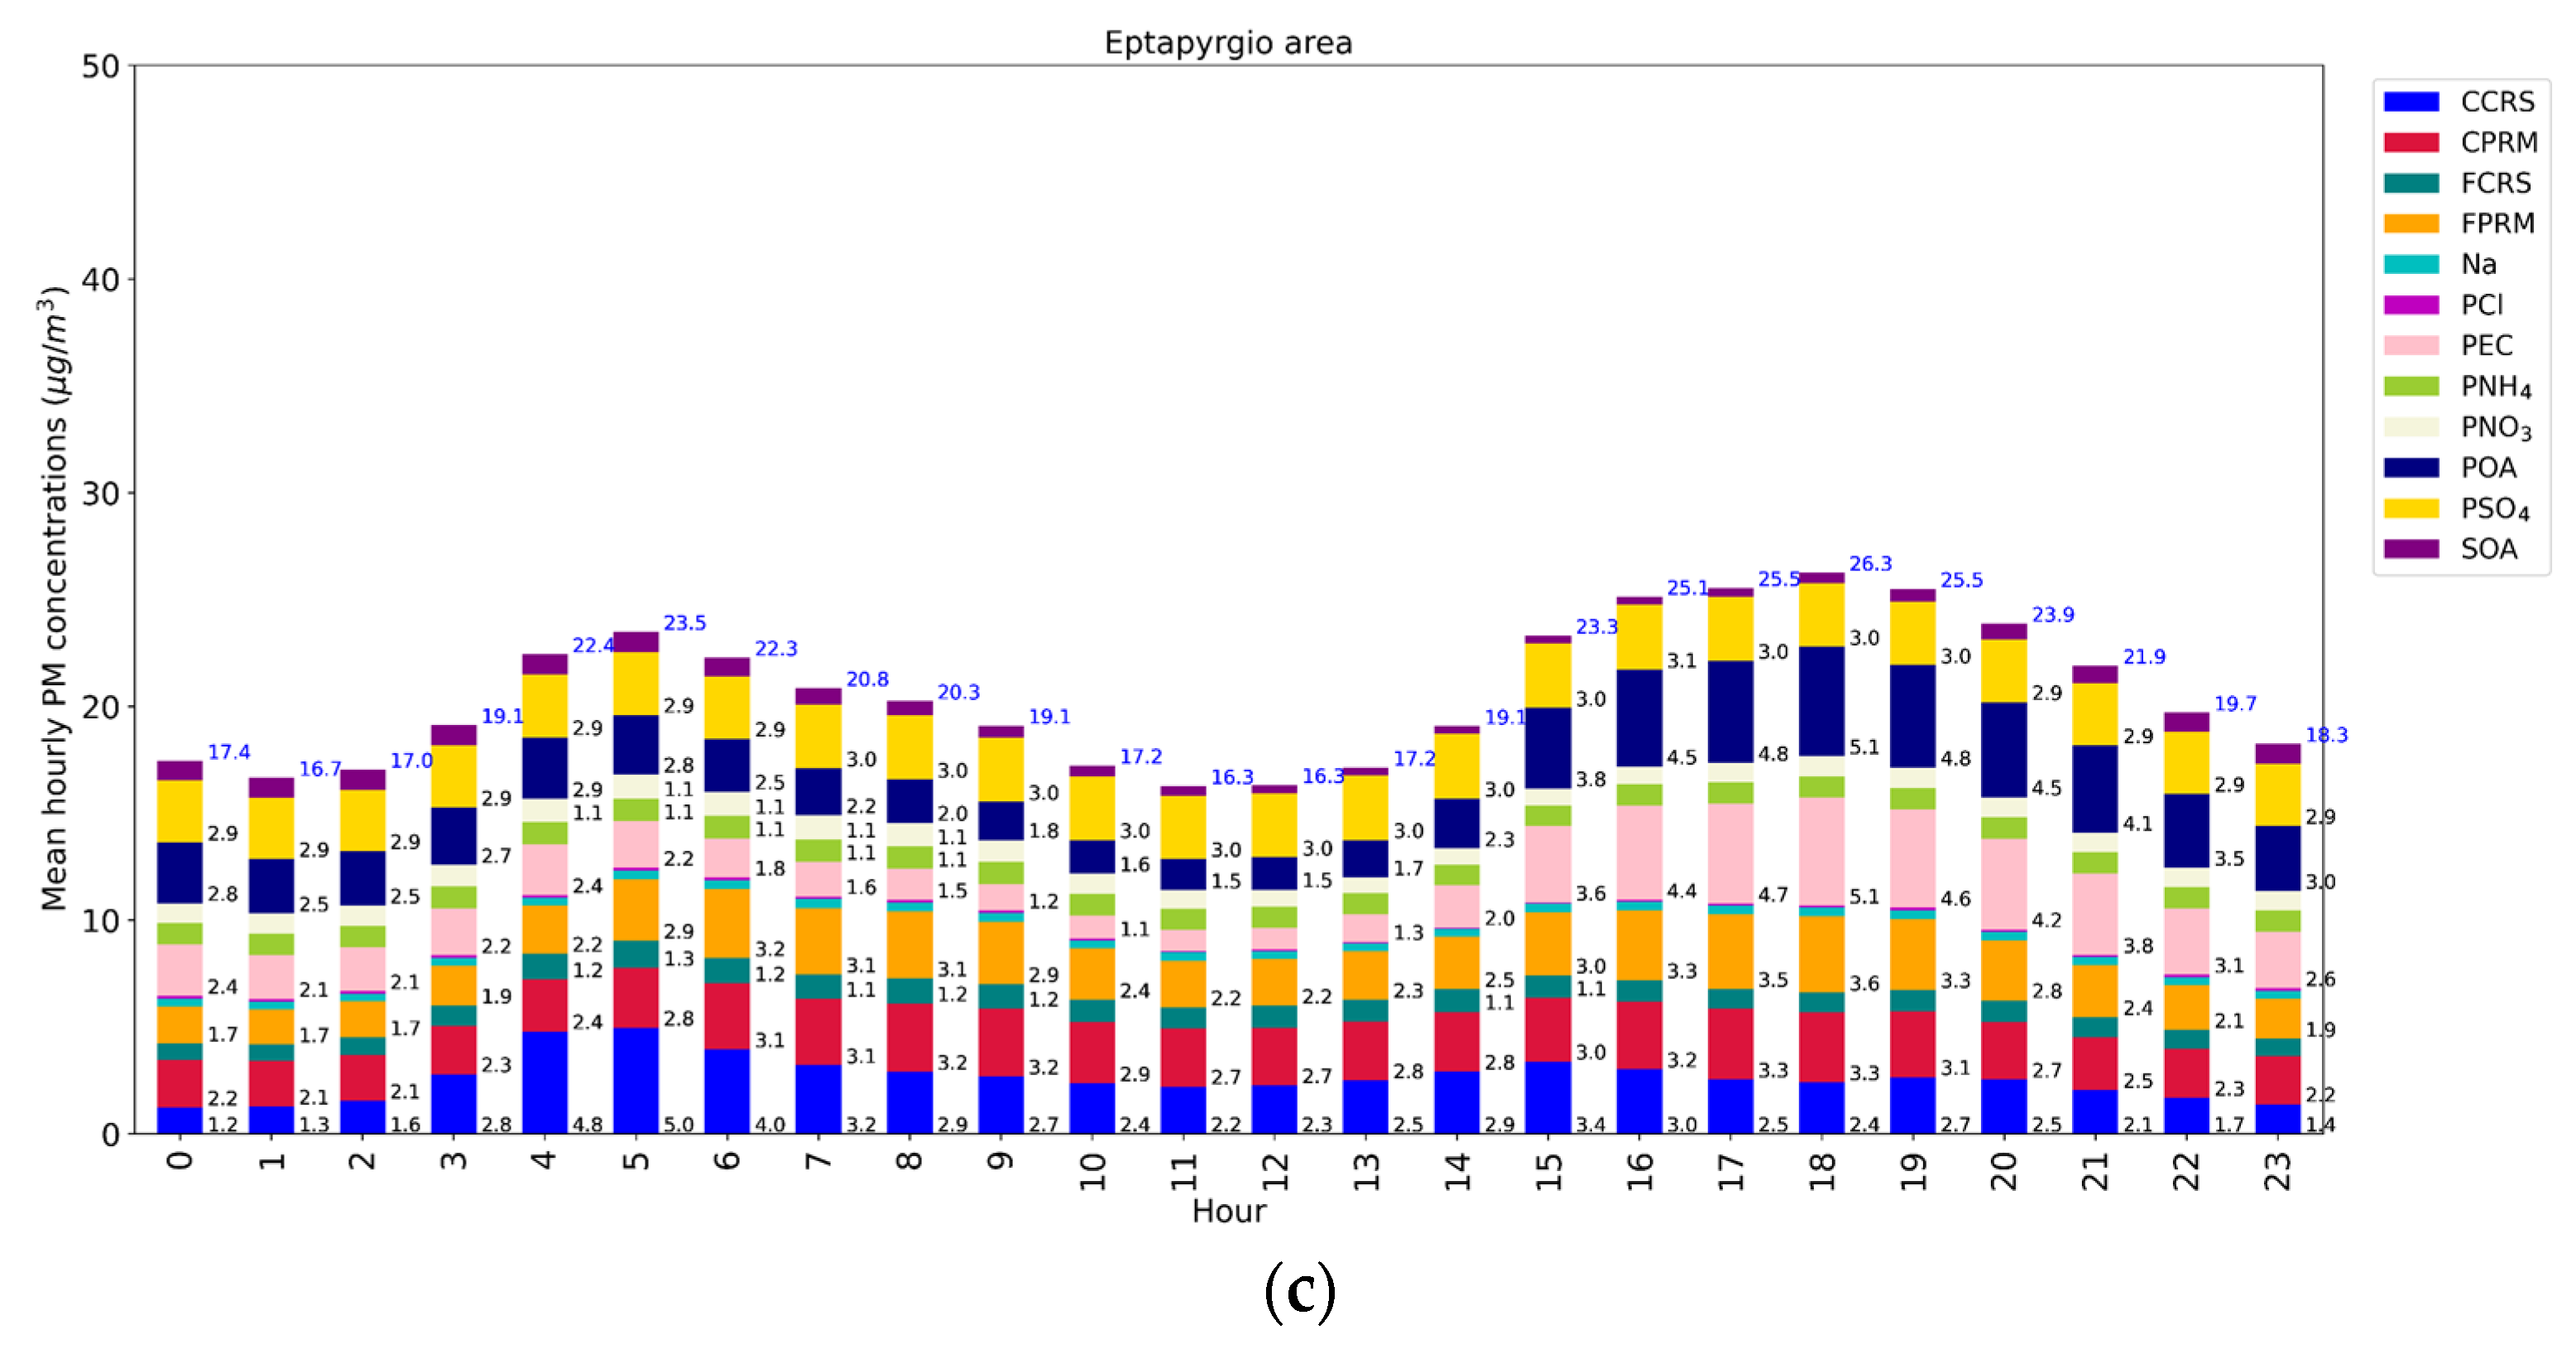
On an average for the whole year of 2015, mean hourly PM10 levels range from around 20 μg/m3 to 32 μg/m3, in Dimarxeio area, presenting their maximum values in the morning (04:00–07:00 UTC) and in the evening (17:00–20:00 UTC) (Figure 6). This is mainly attributed to road traffic and residential heating emissions, being in agreement with the measurement data for which two peaks are identified in the morning and in the evening with a slight shift of 1–2 h (Figure S2, in the supplement). Additionally, the meteorological conditions occur do not favor the dispersion of pollutants. A similar pattern is shown for the other studied grid cells where lower mean hourly PM10 levels are observed reaching up to 27.5 μg/m3 in Martiou (in the morning and in the evening) and 26.3 μg/m3 in Eptapyrgio in the evening (Figure 6b,c).
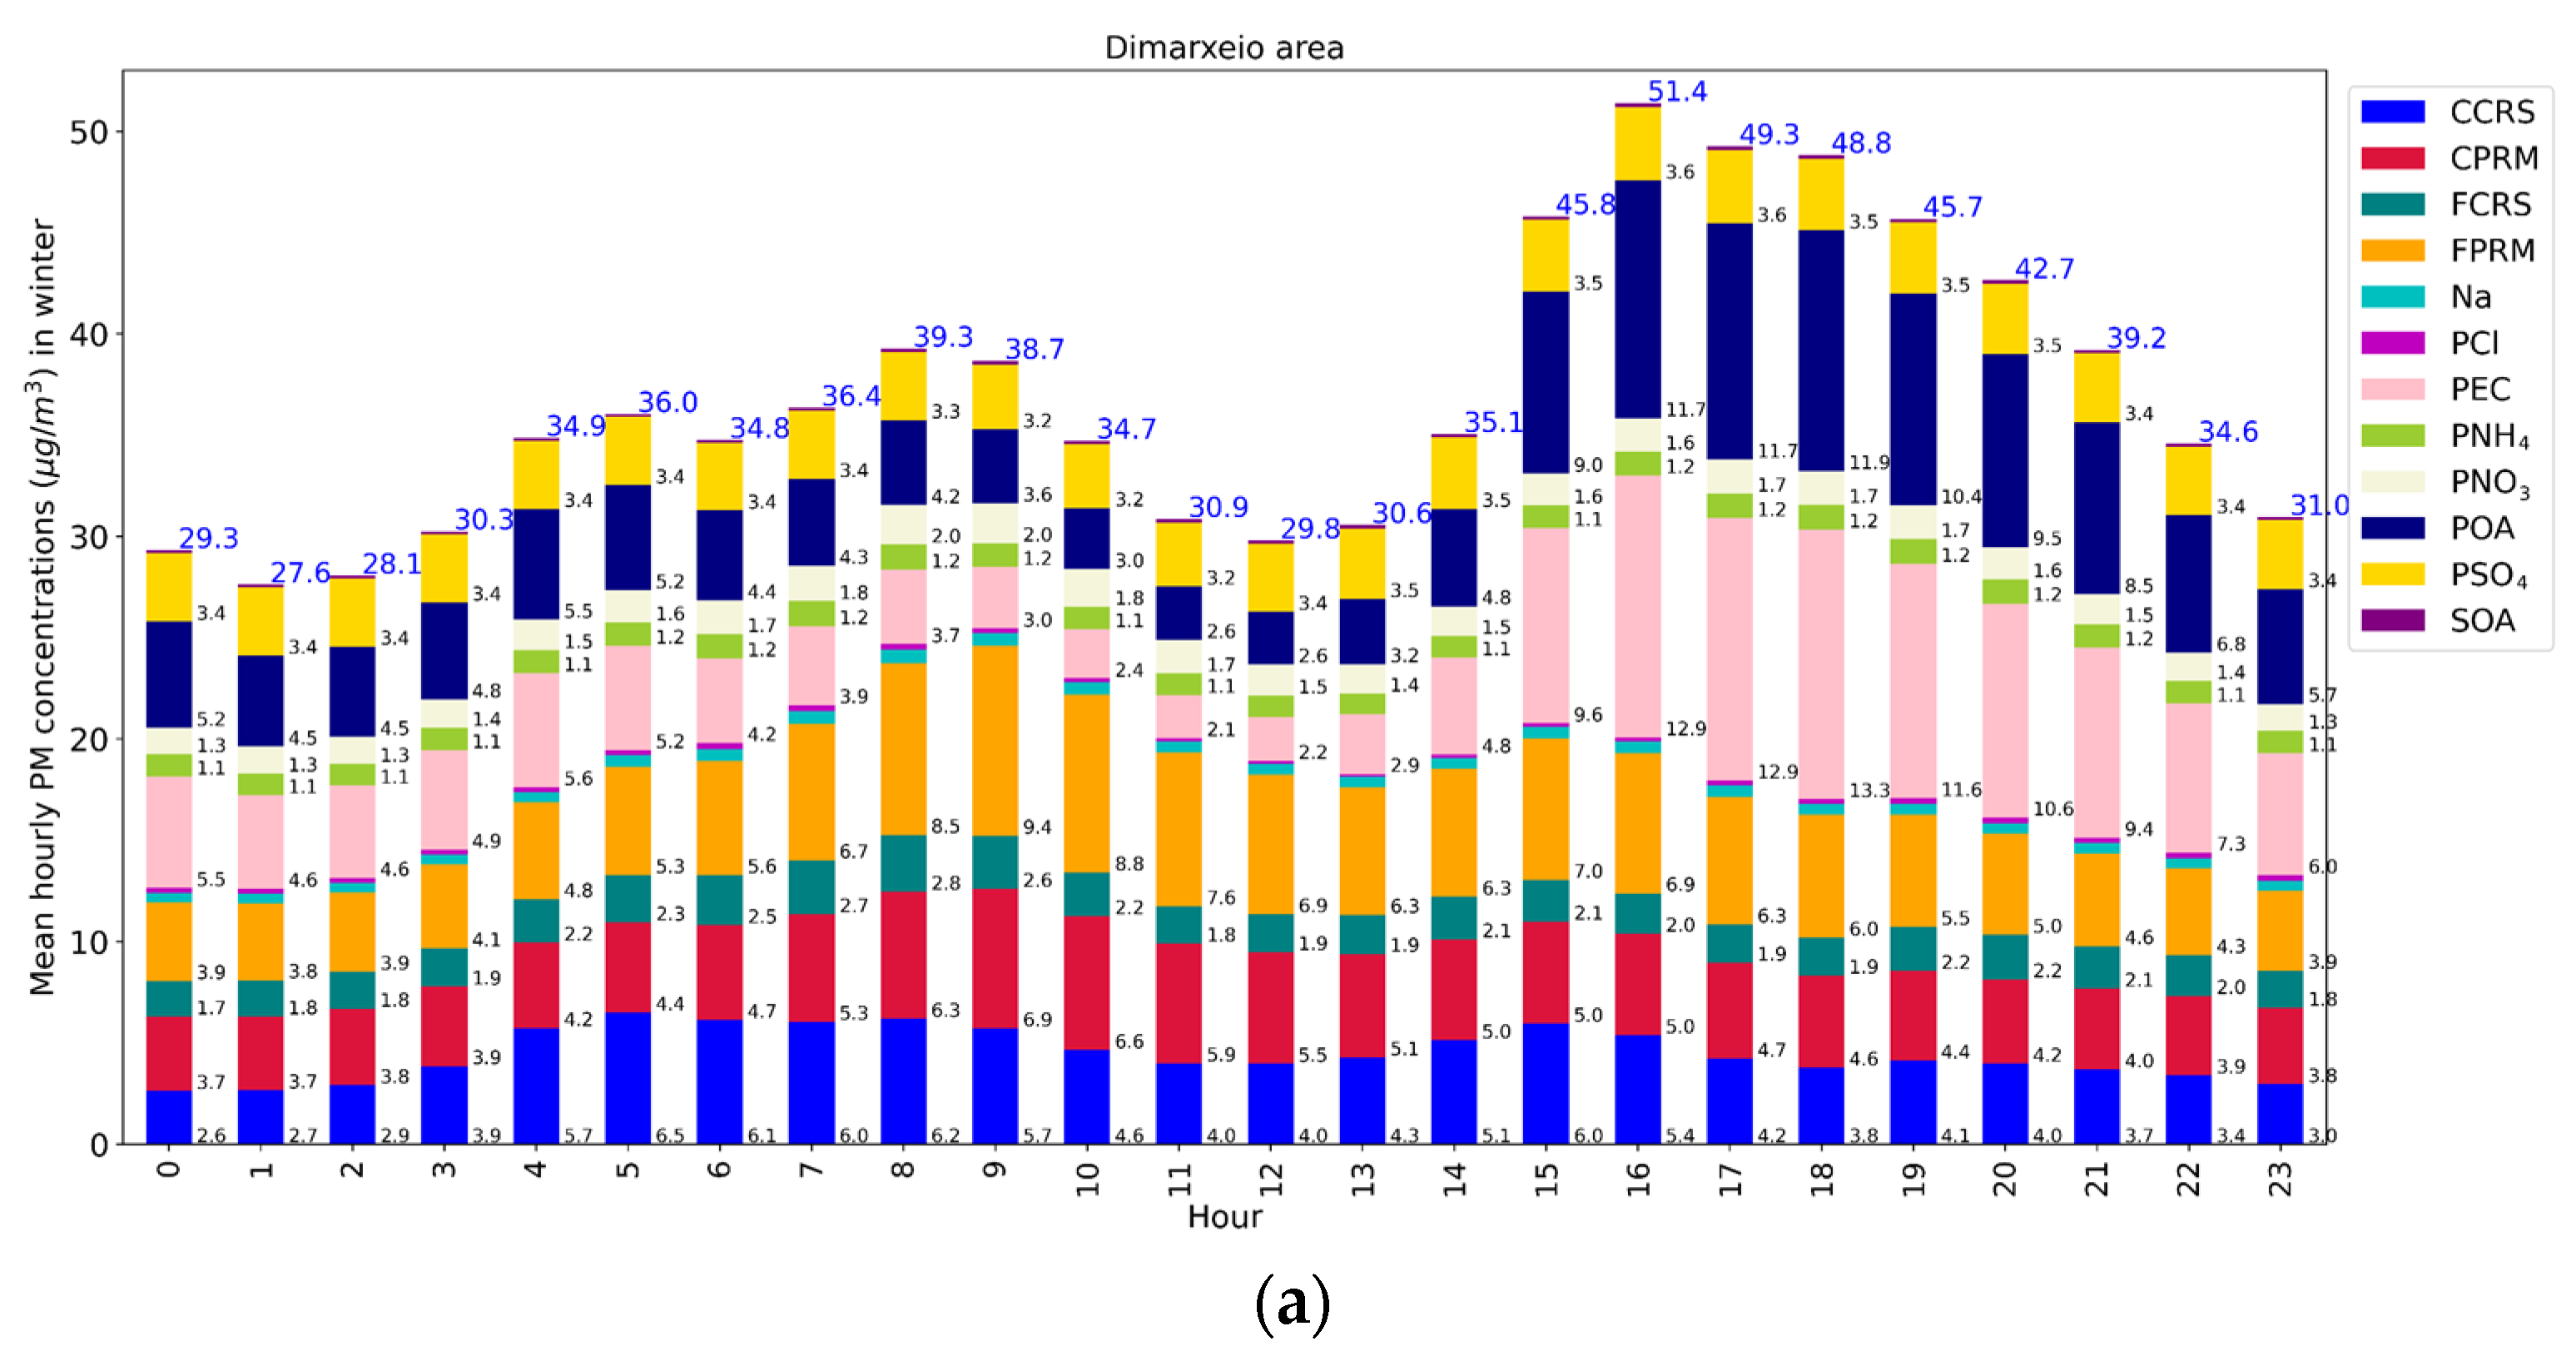
According to Figure 7a, in Dimarxeio area, during winter, POA and PEC levels take their maximum value in the evening (18:00 UTC), representing a share to total PM10 levels, attributed mostly to biomass burning for heating purposes being in agreement with previous studies [13,60].
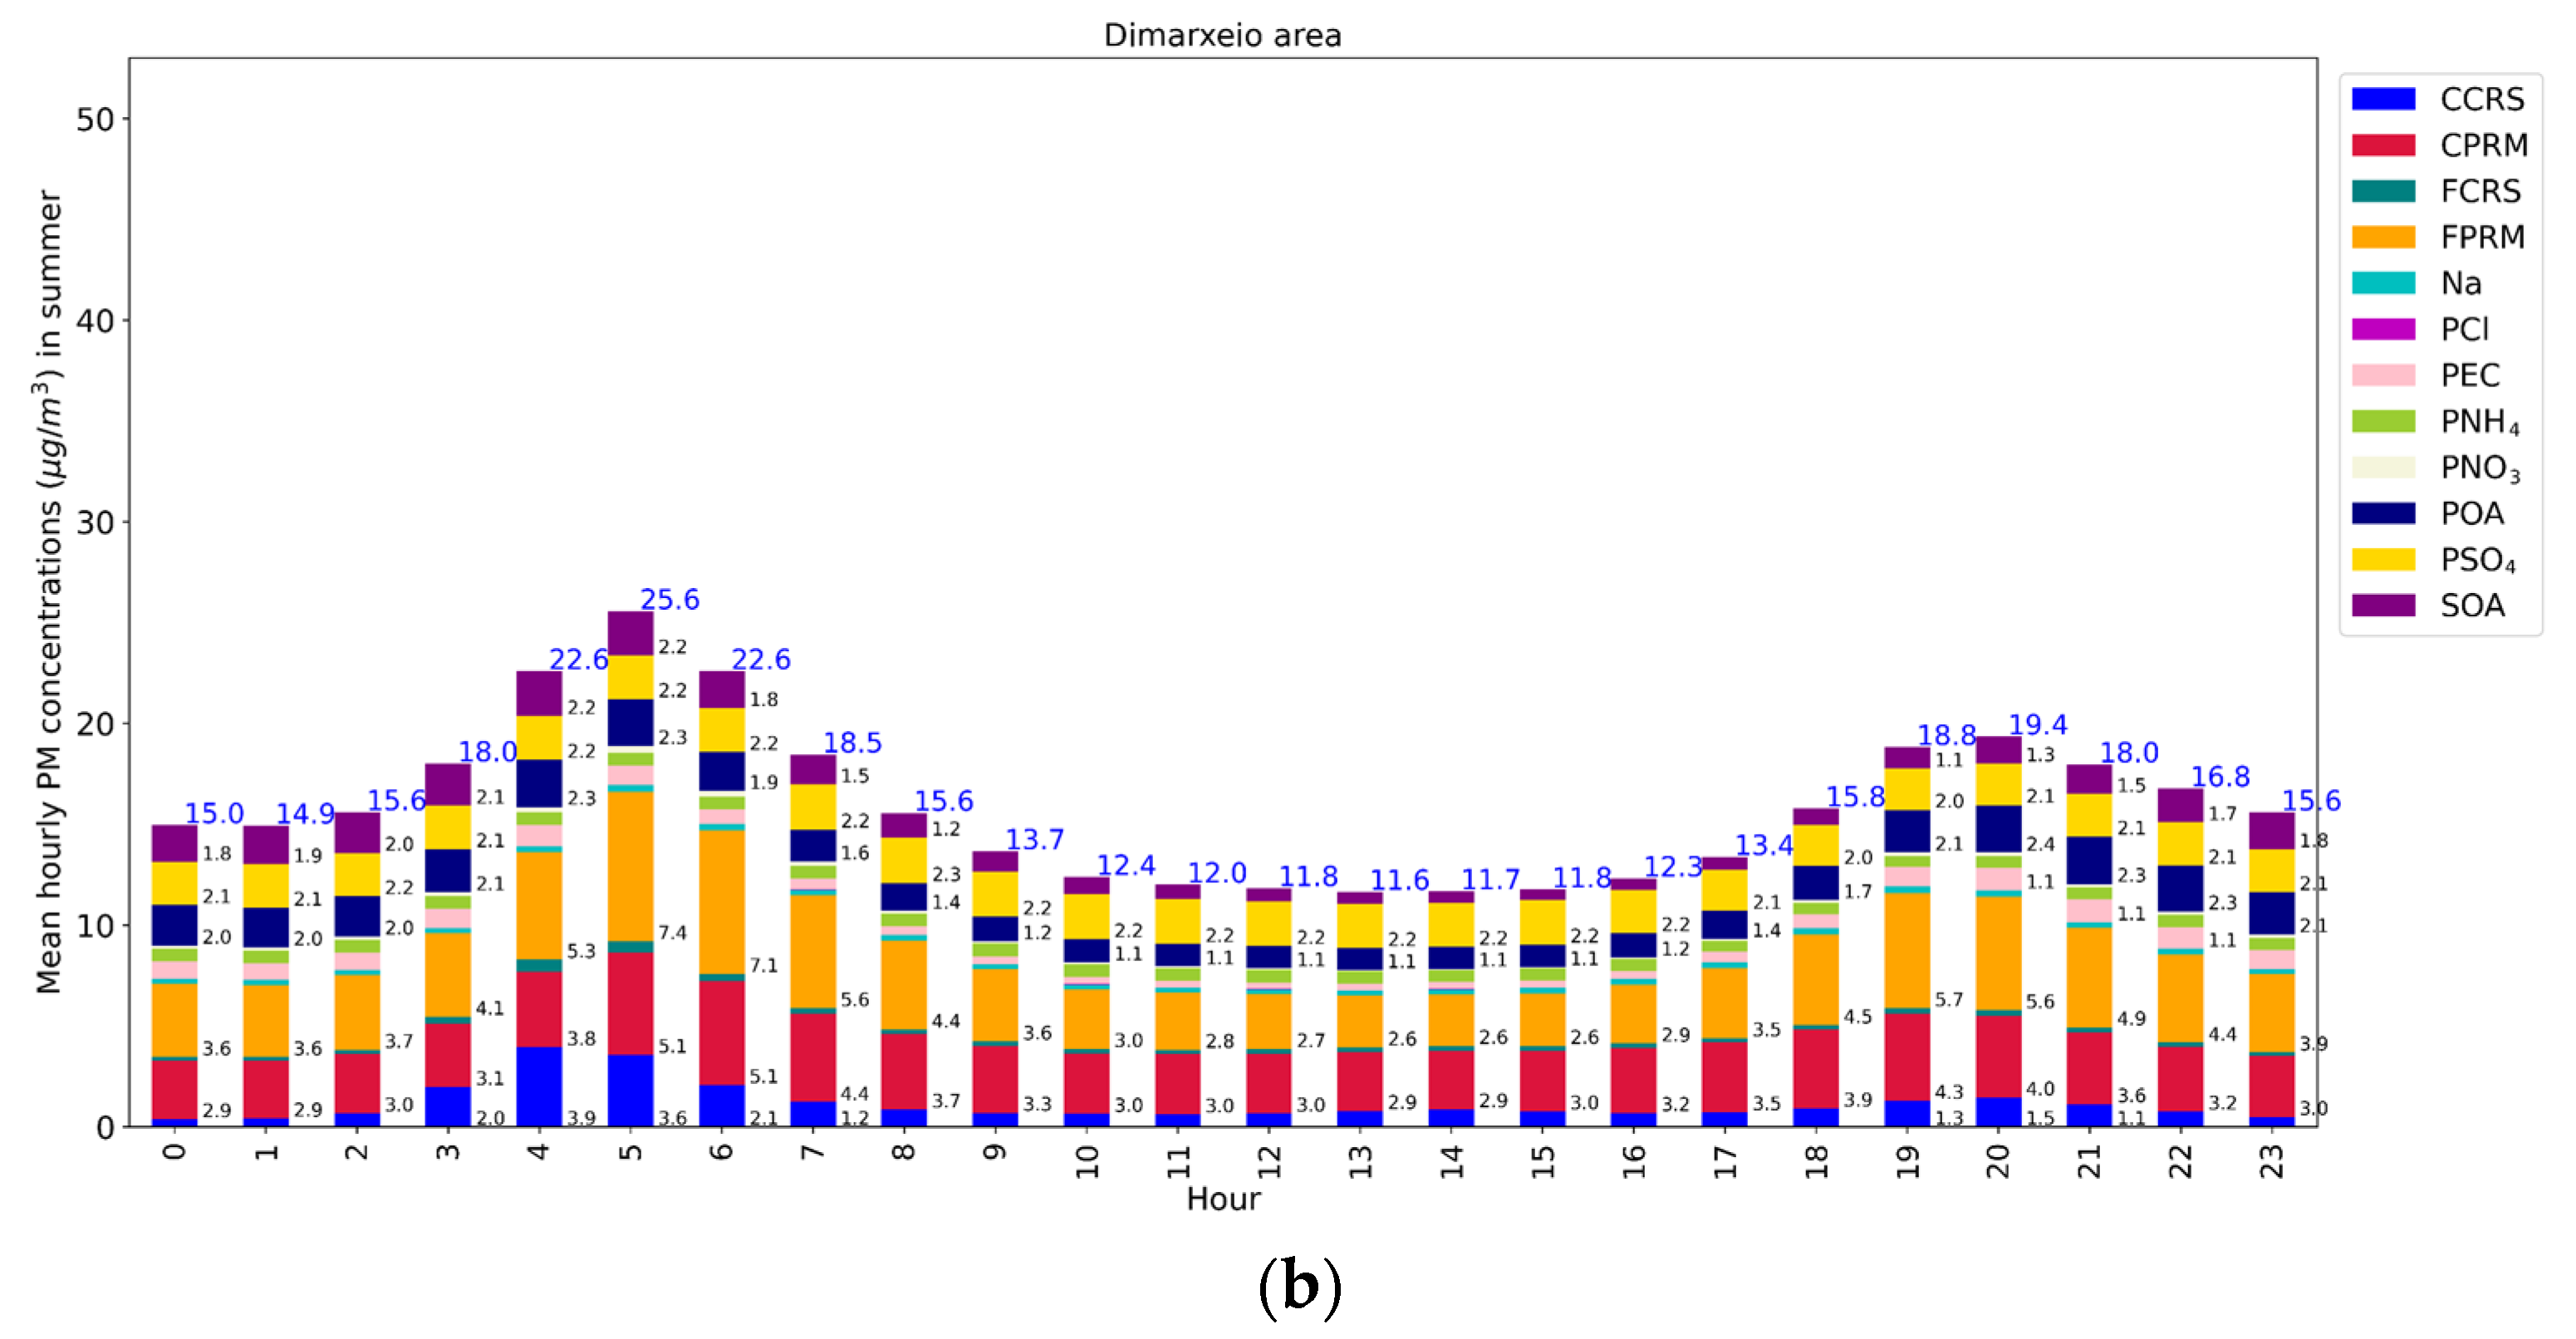
During summer, FPRM and CPRM levels are maximized in the morning (9:00 UTC), being the major contributor to PM10 levels, due to road transport emissions (Figure 7b). A similar pattern is found also in Martiou and Eptapyrgio (Figures S3 and S4, in the supplement).

4. Discussion

In the current section, a deeper investigation is conducted regarding to the carbonaceous aerosol species; POA, PEC and SOA. More particularly, due to the arisen discrepancies in the corresponding simulated PM levels, a sensitivity analysis has been made through the application of the air quality modeling system for the cold period (October, November, December, January, February, March, April) of 2015 using a different speciation profile for the heating emissions from biomass burning. In the new simulation of the air quality modeling system (named, hereinafter, as “sensitivity scenario”), the PM speciation profile used was taken from the study of Athanasopoulou et al. 2017 [15]. In particular, according to Athanasopoulou et al. 2017 [15], the chemical profile was estimated based on long-term measurements during the period 2013–2015 in the Athens urban agglomeration, similar to the case of Thessaloniki taking into account the changes in the use of fuels for heating from conventional fuels to biomass due to the financial crisis. The speciation profiles of the base case (presented in Section 3) and of the sensitivity scenario are presented in Table 2, where it can be seen that in the sensitivity scenario the majority of biomass heating emissions are attributed to POA (by 80%).
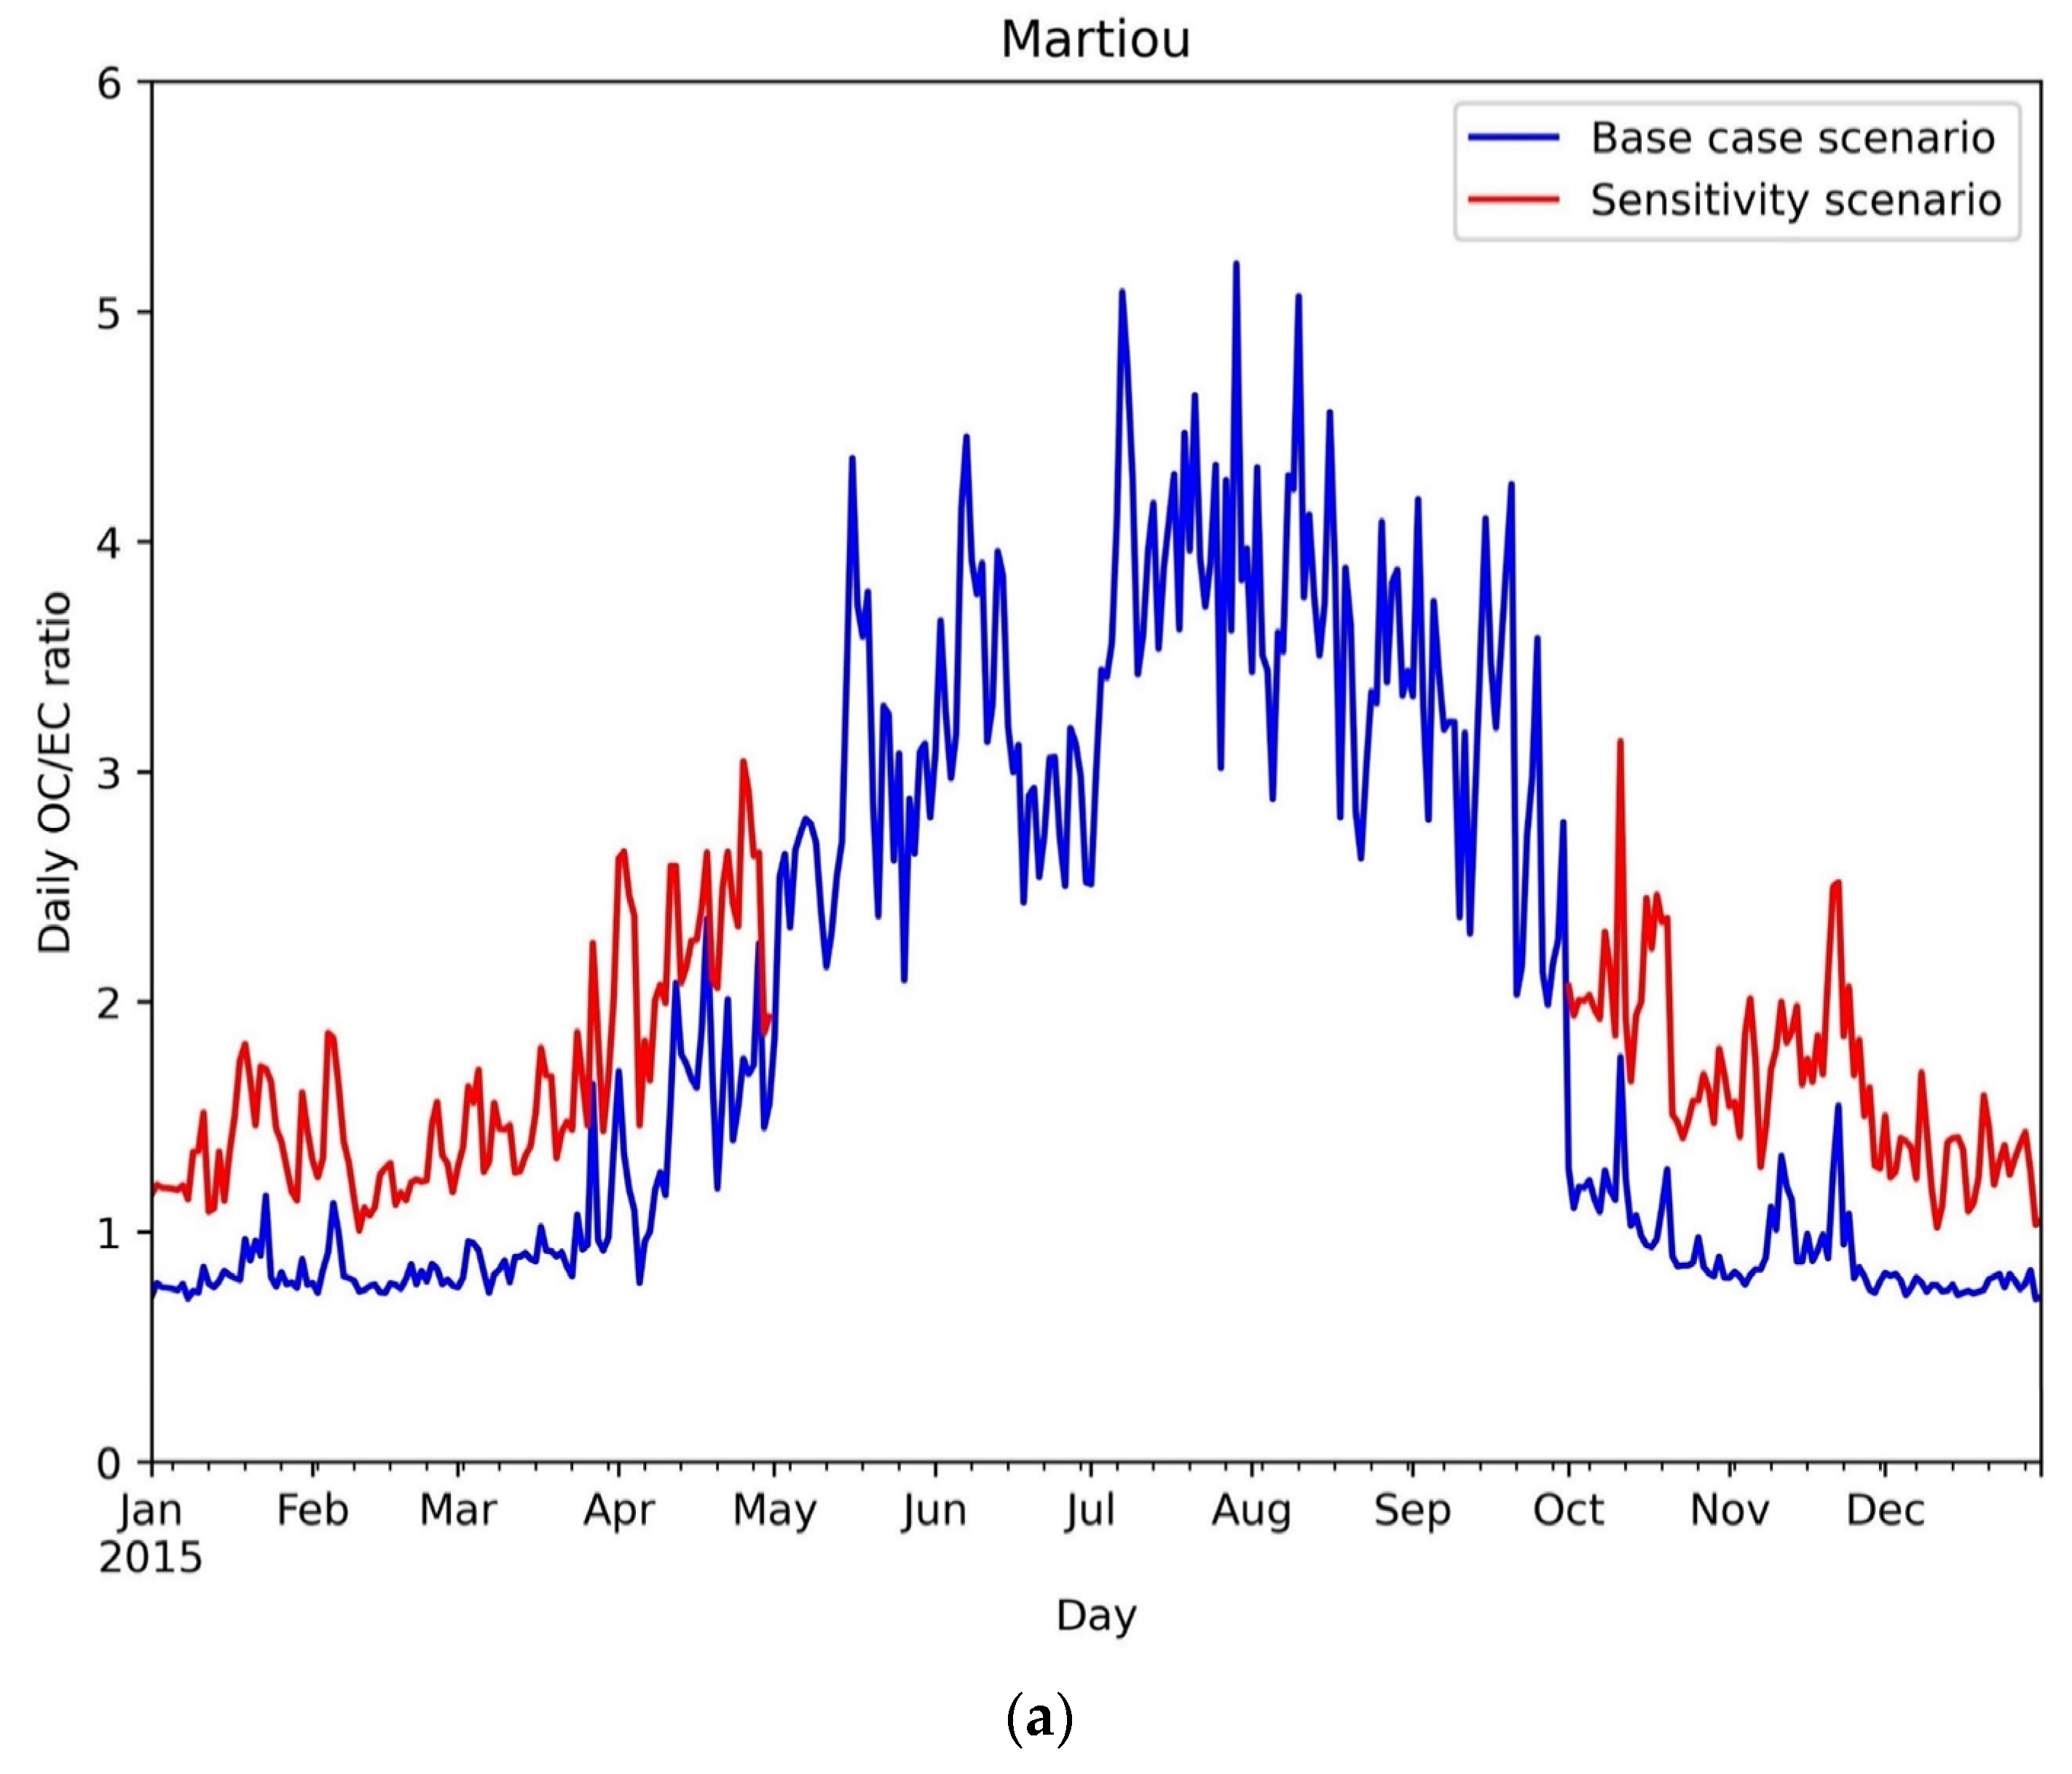
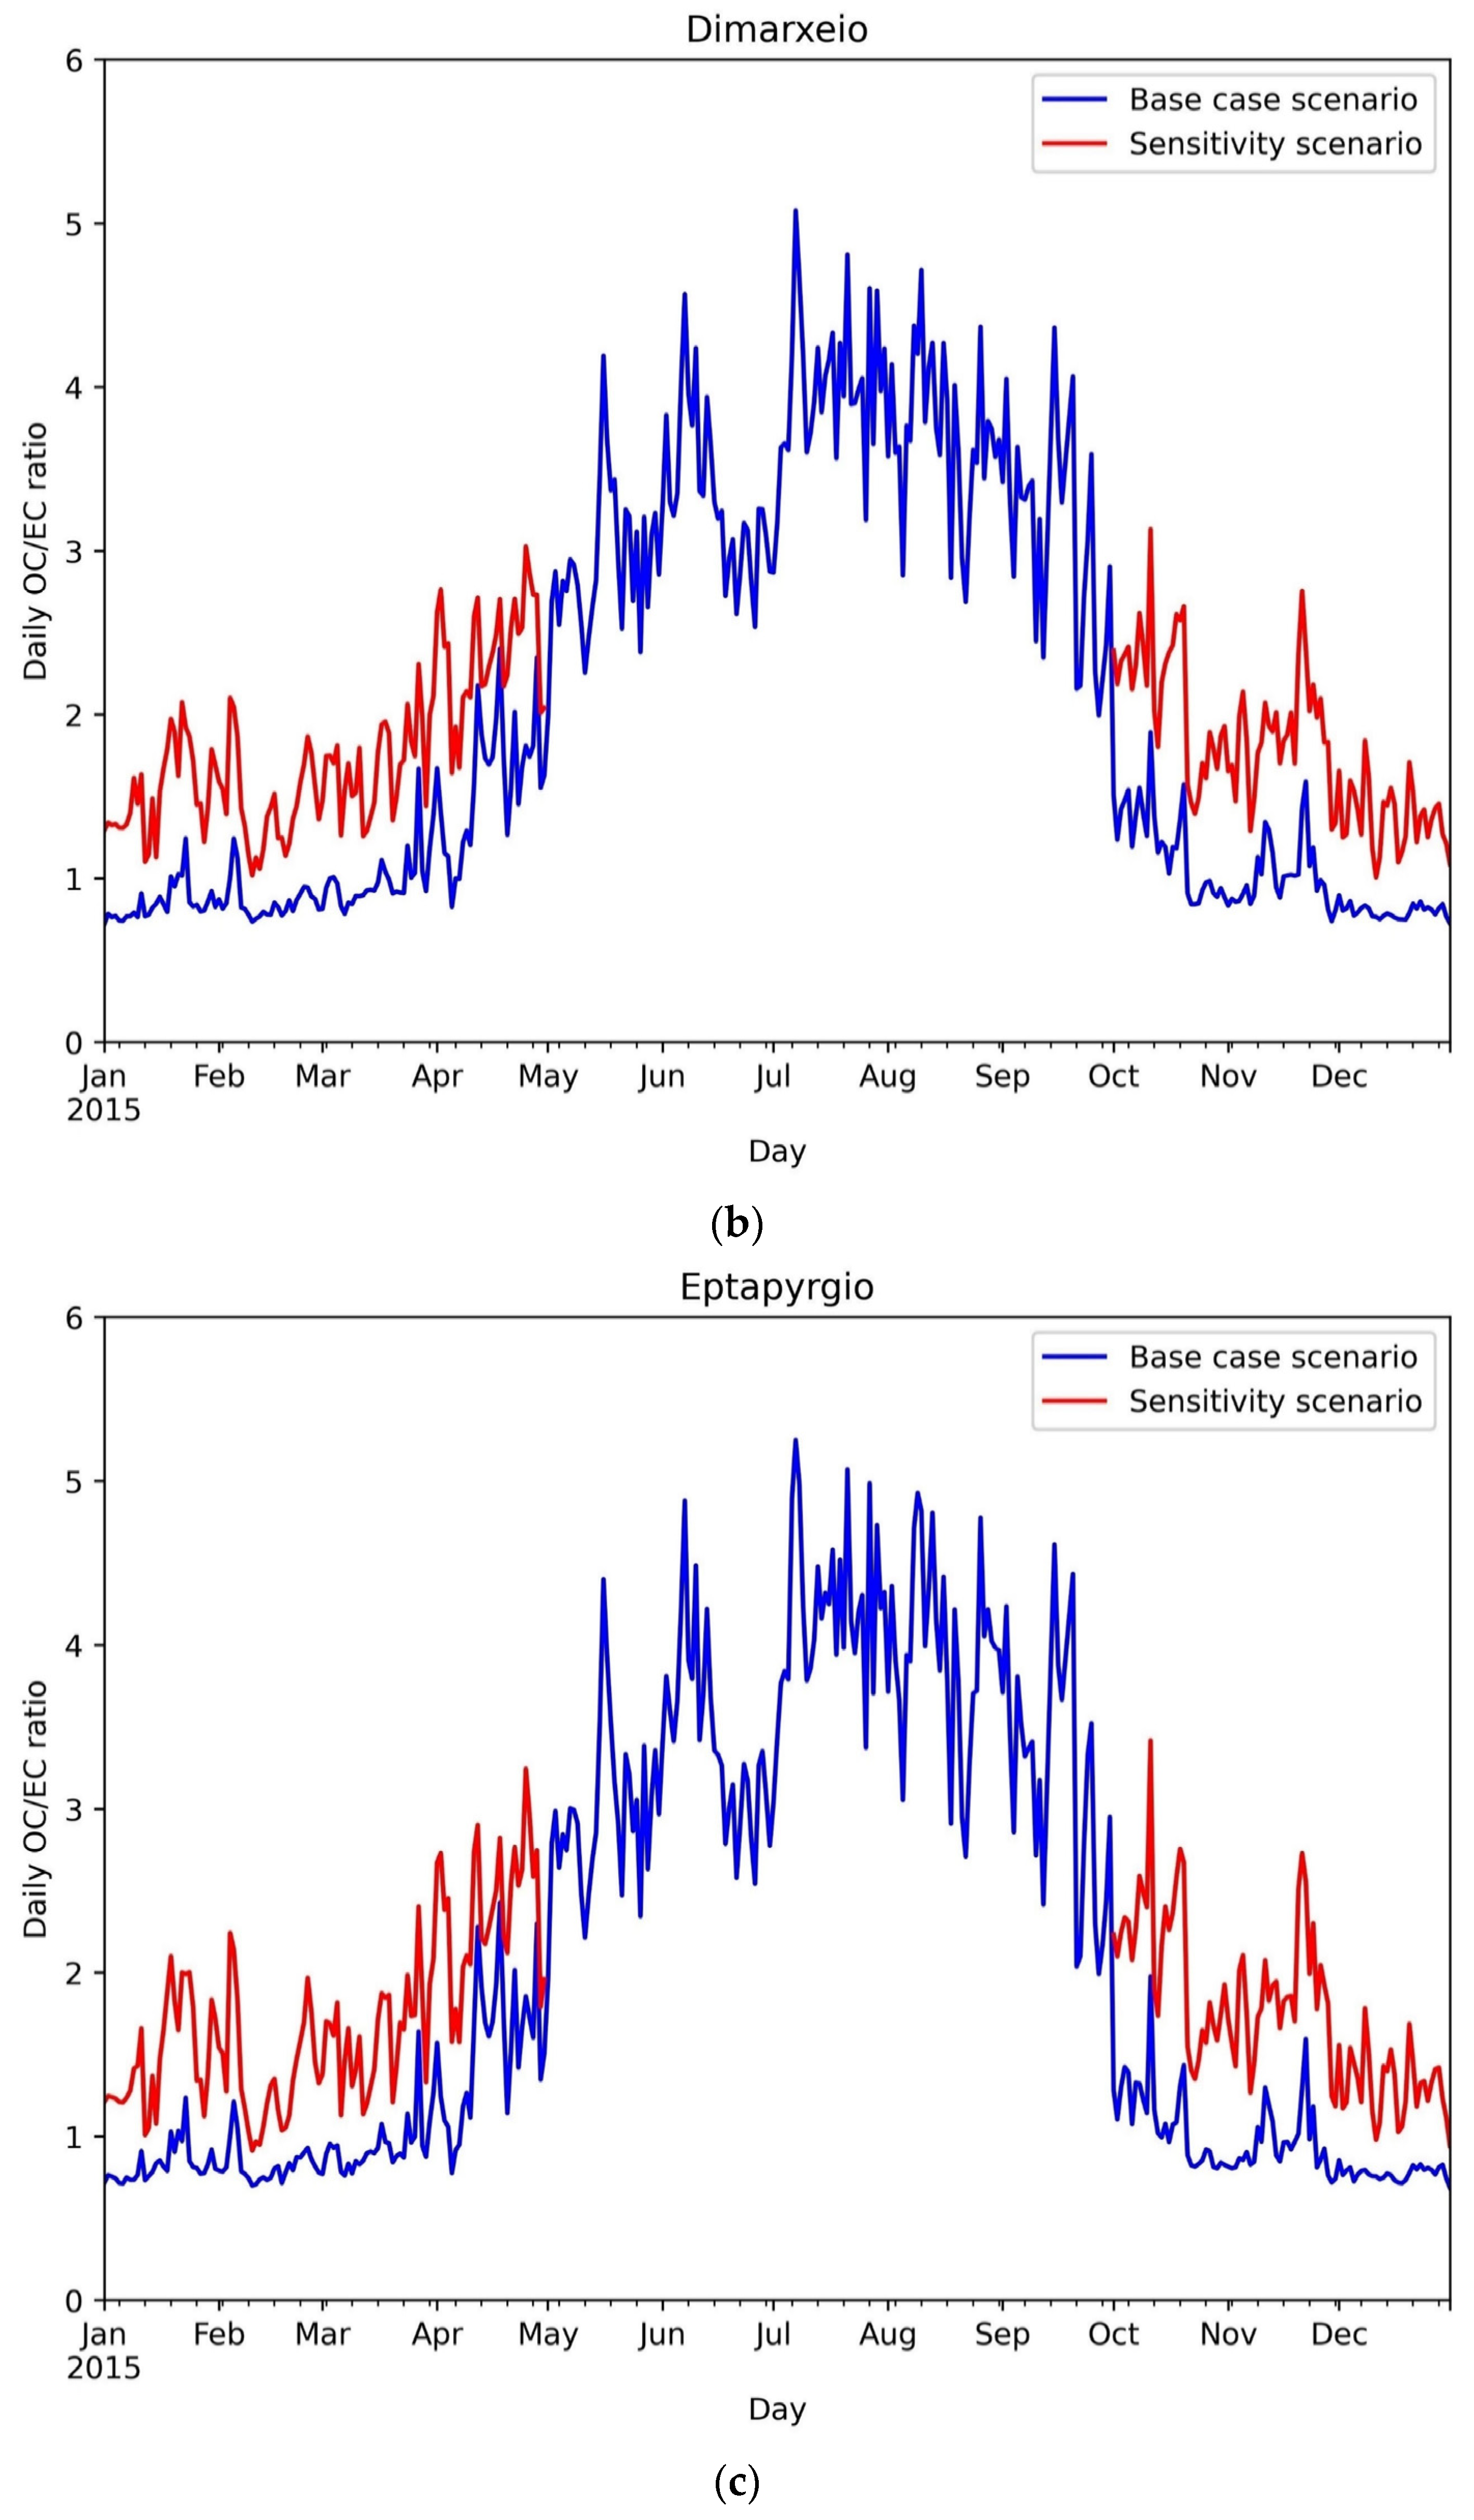
Figure 8 depicts the simulated daily OC/EC ratio for the year 2015 for the base case and sensitivity scenario. It should be mentioned that for the warm period of the year (i.e., May to September) OC/EC rations are presented only for the base case scenario since heating emissions are absent. Figure 8 shows that the daily OC/EC ratio ranges from 0.91 to 3.42 and from 0.68 to 2.42 for the sensitivity scenario and base case, respectively, over the study grid cells during the cold period of the year. For the wintertime, the mean value of OC/EC ratio is about 1.5 for the sensitivity scenario indicating a significant increase of about 50% with respect to the base run. On the other hand, OC/EC ratios during the warm period of the year reach up to 5.25 due to the increased levels of SOA attributed to the production of Biogenic Volatile Organic Compounds (BVCOCs) from vegetation.
However, according to the literature, higher values of the ratio have been measured during winter depending on the position of the site (i.e., urban background or traffic) as it has been already mentioned in Section 3. Although, it should be mentioned that the aforementioned studies refer to measurement data during the period 2011–2013 [14,52], when the impact of the financial crisis was more intense and therefore the biomass burning for heating purposes compared to the following next years. In addition, the underestimation of the simulated OC/EC ratio is probably attributed to the fact that there are additional chemical mechanisms influencing the formation of organic aerosol. It is referred that our knowledge regarding to SOA is limited [42] and many models are incapable to capture the variability of SOA [61,62] while SOA simulated levels are often underestimated [63,64,65]. An underestimation in wintertime SOA levels is also shown in the current study since other researchers have measured in situ higher SOA concentration values for Thessaloniki area [13,14,56]. The important contribution of secondary organic carbon (SOC) to the total OC in the city of Thessaloniki has been identified in a previous monitoring campaign in which the mean contribution of SOC to total OC was measured of more than 40% in the PM10 and the PM2.5 fractions, having been higher in the cold than in the warm period of the year [56]. These results also reveal that there are other factors than enhanced summertime photochemical activity that have a major influence on secondary OC concentrations as condensation of semi volatile organic compounds (SVOCs) or adsorption onto existing solid particles and stationary combustion.
A possible justification of the underestimation of the OC/EC ratio levels during winter is the non-inclusion of the intermediate volatile organic compounds (IVOCs) and the SVOCs [63,66,67] in the air quality simulations of the present study which contribute to SOA production. IVOCs and SVOCs are emitted also by biomass burning and usually are missing from emission inventories. In addition, it should be highlighted that in the current CAMx simulations the CAMx-SOAP [68] chemical scheme has been used for which it has been shown that underestimates SOA levels compared to the VBS scheme [69]. Finally, heterogeneous processes, as the fast aqueous-phase oxidation of directly emitted POA at high relative humidity to produce SOA [70] are not accounted for in the modeling system and have to be better elucidated.

5. Conclusions

The main goal of this study is the better understanding and prediction of the chemical composition of PM10 levels in Thessaloniki, Greece in combination with the main emissions sources of PM10 species. An analysis has been made in a spatial and a temporal basis and the results have been compared with other relevant studies. The comparison of carbonaceous aerosols levels through the OC/EC ratio with previous studies based on measurement data revealed an underestimation of the OC simulated values during winter. For this reason, a sensitivity analysis has been performed by using a different speciation profile for the fine particles emitted from biomass burning heating in the application of WRF-CAMx.
The simulated results (based also on the sensitivity scenario) are generally in better agreement with previous studies based on measurement data revealing the reliability of the modeling system. However, additional research is required for the further improvement of the air quality simulations. Future work may include the following:
  • A sensitivity analysis related to the different schemes for organic gas-aerosol partitioning and oxidation (e.g., SOAP versus VBS schemes used in CAMx model) and an improved emission inventory accounting also for SVOCs and IVOCs emissions, that have biomass burning as an important emission source, and lead to the production of SOA.
  • The estimation of the emissions of minerals and other elements (e.g., Al, Si, S, K, V) and the simulation of their concentrations.
  • The implementation of the Particulate Source Apportionment Technology (PSAT)) tool within CAMx for a more accurate identification of the major emissions sources contributing to PM levels.

Supplementary Materials

The following supporting information can be downloaded at: https://www.mdpi.com/article/10.3390/su151310034/s1, Table S1: Statistical metrics for PM10 mean daily concentrations (µg/m3) for each monitoring site over Thessaloniki, Greece (2 × 2 km2) for the year 2015; Table S2: Statistical metrics for mean hourly temperature for each monitoring site over Thessaloniki, Greece (2 × 2 km2) for the year 2015; Table S3: Statistical metrics for mean hourly humidity for each monitoring site over Thessaloniki, Greece (2 × 2 km2) for the year 2015; Figure S1: Mean daily PM10 concentrations of measurement and simulated data at (a) Martiou, (b) Dimarxeio and (c) Eptapyrgio stations for the year 2015; Figure S2: Mean hourly PM10 concentrations at Martiou, Dimarxeio and Eptapyrgio stations for the year 2015 based on measurement data (Time in UTC); Figure S3: Hourly variation of mean simulated PM species concentrations (in μg/m3) during winter over the grid cell of Martiou (a),and Eptapyrgio (b) (Time in UTC); Figure S4: Hourly variation of mean simulated PM species concentrations (in μg/m3) during summer over the grid cell of Martiou (a), and Eptapyrgio (b) (Time in UTC); Figure S5: Seasonal variation of PM coarse road dust resuspension emissions.

Author Contributions

Conceptualization, D.T.T., N.L., A.P. and D.M.; methodology, D.T.T., N.L., S.K.; validation, D.T.T., N.L. and D.A.; data curation, N.L. and S.K.; writing—original draft preparation, D.T.T. and N.L.; writing—review and editing, D.T.T., N.L. and A.P.; supervision, D.M. All authors have read and agreed to the published version of the manuscript.

Funding

This research received no external funding.

Institutional Review Board Statement

Not applicable.

Informed Consent Statement

Not applicable.

Data Availability Statement

Not applicable.

Acknowledgments

The authors acknowledge support by the LIFE Programme of the European Union in the framework of the project LIFE21-GIE-EL-LIFE-SIRIUS/101074365. The authors would like to acknowledge the support provided by the Scientific Computing Center at the Aristotle University of Thessaloniki throughout the progress of this research work.

Conflicts of Interest

The authors declare no conflict of interest.

References

  1. Moussiopoulos, N.; Vlachokostas, C.; Tsilingiridis, G.; Douros, I.; Hourdakis, E.; Naneris, C.; Sidiropoulos, C. Air quality status in Greater Thessaloniki Area and the emission reductions needed for attaining the EU air quality legislation. Sci. Total Environ. 2009, 407, 1268–1285. [Google Scholar] [CrossRef] [PubMed]
  2. Markakis, K.; Poupkou, A.; Melas, D.; Tzoumaka, P.; Petrakakis, M. A Computational Approach Based on GIS Technology for the Development of an Anthropogenic Emission Inventory of Gaseous Pollutants in Greece. Water Air Soil Pollut. 2010, 207, 157–180. [Google Scholar] [CrossRef]
  3. Dimitriou, K.; Stavroulas, I.; Grivas, G.; Chatzidiakos, C.; Kosmopoulos, G.; Kazantzidis, A.; Kourtidis, K.; Karagioras, A.; Hatzianastassiou, N.; Pandis, S.; et al. Intra- and inter-city variability of PM2.5 concentrations in Greece as determined with a low-cost sensor network. Atmos. Environ. 2023, 301, 119713. [Google Scholar] [CrossRef]
  4. Parliari, D.; Giannaros, C.; Papadogiannaki, S.; Melas, D. Short-Term Effects of Air Pollution on Mortality in the Urban Area of Thessaloniki, Greece. Sustainability 2023, 15, 5305. [Google Scholar] [CrossRef]
  5. Psistaki, K.; Achilleos, S.; Middleton, N.; Paschalidou, A. Exploring the impact of particulate matter on mortality in coastal Mediterranean environments. Sci. Total Environ. 2023, 865, 161147. [Google Scholar] [CrossRef] [PubMed]
  6. Smoke and Smog Health Effects of PM10. Available online: Https://Www.Marlborough.Govt.Nz/Environment/Air-Quality/Smoke-and-Smog/Health-Effects-of-Pm10 (accessed on 10 November 2022).
  7. Dunnivant, F.M.; Anders, E. A Basic Introduction to Pollutant Fate and Transport, an Integrated Approach with Chemistry, Modeling, Risk Assessment, and Environmental Legislation; John Wiley & Sons, Inc.: Hoboken, NJ, USA, 2006; ISBN -13. [Google Scholar]
  8. Shiraiwa, M.; Ueda, K.; Pozzer, A.; Lammel, G.; Kampf, C.J.; Fushimi, A.; Enami, S.; Arangio, A.M.; Fröhlich-Nowoisky, J.; Fujitani, Y.; et al. Aerosol Health Effects from Molecular to Global Scales. Environ. Sci. Technol. 2017, 51, 13545–13567. [Google Scholar] [CrossRef]
  9. Pateraki, S.; Assimakopoulos, V.; Maggos, T.; Fameli, K.; Kotroni, V.; Vasilakos, C. Particulate matter pollution over a Mediterranean urban area. Sci. Total Environ. 2013, 463–464, 508–524. [Google Scholar] [CrossRef]
  10. Singh, J.; Payra, S.; Mishra, M.K.; Verma, S. An analysis of particulate pollution using urban aerosol pollution island intensity over Delhi, India. Environ. Monit. Assess. 2022, 194, 874. [Google Scholar] [CrossRef]
  11. Amato, F.; Cassee, F.R.; van der Gon, H.A.D.; Gehrig, R.; Gustafsson, M.; Hafner, W.; Harrison, R.M.; Jozwicka, M.; Kelly, F.J.; Moreno, T.; et al. Urban air quality: The challenge of traffic non-exhaust emissions. J. Hazard. Mater. 2014, 275, 31–36. [Google Scholar] [CrossRef]
  12. Liora, N.; Kontos, S.; Parliari, D.; Akritidis, D.; Poupkou, A.; Papanastasiou, D.K.; Melas, D. “On-Line” Heating Emissions Based on WRF Meteorology—Application and Evaluation of a Modeling System over Greece. Atmosphere 2022, 13, 568. [Google Scholar] [CrossRef]
  13. Saffari, A.; Daher, N.; Samara, C.; Voutsa, D.; Kouras, A.; Manoli, E.; Karagkiozidou, O.; Vlachokostas, C.; Moussiopoulos, N.; Shafer, M.M.; et al. Increased Biomass Burning Due to the Economic Crisis in Greece and Its Adverse Impact on Wintertime Air Quality in Thessaloniki. Environ. Sci. Technol. 2013, 47, 13313–13320. [Google Scholar] [CrossRef]
  14. Tolis, E.I.; Saraga, D.E.; Lytra, M.K.; Papathanasiou, A.C.; Bougaidis, P.N.; Prekas-Patronakis, O.E.; Ioannidis, I.I.; Bartzis, J.G. Concentration and chemical composition of PM2.5 for a one-year period at Thessaloniki, Greece: A comparison between city and port area. Atmos. Environ. 2015, 113, 197–207. [Google Scholar] [CrossRef]
  15. Athanasopoulou, E.; Speyer, O.; Brunner, D.; Vogel, H.; Vogel, B.; Mihalopoulos, N.; Gerasopoulos, E. Changes in domestic heating fuel use in Greece: Effects on atmospheric chemistry and radiation. Atmos. Meas. Tech. 2017, 17, 10597–10618. [Google Scholar] [CrossRef] [Green Version]
  16. Florou, K.K.; Pikridas, M.; Pandis, S.N. Wintertime Air Pollution and the Greek Financial Crisis. In Proceedings of the EGU General Assembly Conference Abstracts, Vienna, Austria, 7–12 April 2013; p. 7091. [Google Scholar]
  17. Vouitsis, I.; Amanatidis, S.; Ntziachristos, L.; Kelessis, A.; Petrakakis, M.; Stamos, I.; Mitsakis, E.; Samaras, Z. Daily and seasonal variation of traffic related aerosol pollution in Thessaloniki, Greece, during the financial crisis. Atmos. Environ. 2015, 122, 577–587. [Google Scholar] [CrossRef]
  18. Grigoratos, T.; Samara, C.; Voutsa, D.; Manoli, E.; Kouras, A. Chemical composition and mass closure of ambient coarse particles at traffic and urban-background sites in Thessaloniki, Greece. Environ. Sci. Pollut. Res. 2014, 21, 7708–7722. [Google Scholar] [CrossRef] [PubMed]
  19. Remoundaki, E.; Bourliva, A.; Kokkalis, P.; Mamouri, R.E.; Papayannis, A.; Grigoratos, T.; Samara, C.; Tsezos, M. PM10 Composition during an Intense Saharan Dust Transport Event over Athens (Greece). Sci. Total Environ. 2011, 409, 4361–4372. [Google Scholar] [CrossRef] [PubMed]
  20. Querol, X.; Pey, J.; Pandolfi, M.; Alastuey, A.; Cusack, M.; Perez, N.; Moreno, T.; Viana, M.; Mihalopoulos, N.; Kallos, G.; et al. African Dust Contributions to Mean Ambient PM10 Mass-Levels across the Mediterranean Basin. Atmos. Environ. 2009, 43, 4266–4277. [Google Scholar] [CrossRef]
  21. Filippidis, F.T.; Gerovasili, V.; Millett, C.; Tountas, Y. Medium-term impact of the economic crisis on mortality, health-related behaviours and access to healthcare in Greece. Sci. Rep. 2017, 7, srep46423. [Google Scholar] [CrossRef] [PubMed] [Green Version]
  22. Katsouyanni, K. Health Effects of Air Pollution in Southern Europe: Are There Interacting Factors? Environ. Health Perspect. 1995, 103, 23–27. [Google Scholar] [CrossRef] [PubMed] [Green Version]
  23. Stafoggia, M.; Zauli-Sajani, S.; Pey, J.; Samoli, E.; Alessandrini, E.; Basagaña, X.; Cernigliaro, A.; Chiusolo, M.; DeMaria, M.; Díaz, J.; et al. Desert Dust Outbreaks in Southern Europe: Contribution to Daily PM10 Concentrations and Short-Term Associations with Mortality and Hospital Admissions. Environ. Health Perspect. 2016, 124, 413–419. [Google Scholar] [CrossRef] [Green Version]
  24. Data-Analysis in Environmental and Traffic Data for Thessaloniki Greece. Available online: Https://Ikee.Lib.Auth.Gr/Record/320630/Files/GRI-2020-28133.Pdf (accessed on 15 January 2023).
  25. Progiou, A.; Liora, N.; Sebos, I.; Chatzimichail, C.; Melas, D. Measures and Policies for Reducing PM Exceedances through the Use of Air Quality Modeling: The Case of Thessaloniki, Greece. Sustainability 2023, 15, 930. [Google Scholar] [CrossRef]
  26. Markakis, K.; Poupkou, A.; Melas, D.; Zerefos, C. A GIS based anthropogenic PM10 emission inventory for Greece. Atmos. Pollut. Res. 2010, 1, 71–81. [Google Scholar] [CrossRef] [Green Version]
  27. Psefteli, M.; Kavvadas, D.; Karacosta, P.; Cheristanidis, S.; Dimitriadou, I.; Papamitsou, T. Air Quality Index Study in the Area of Thessaloniki a Valuable Public Health Tool. Arch. Hell. Med. 2022, 39, 838–843. [Google Scholar]
  28. Terzi, E.; Argyropoulos, G.; Bougatioti, A.; Mihalopoulos, N.; Nikolaou, K.; Samara, C. Chemical composition and mass closure of ambient PM10 at urban sites. Atmos. Environ. 2010, 44, 2231–2239. [Google Scholar] [CrossRef]
  29. Liora, N.; Markakis, K.; Poupkou, A.; Giannaros, T.M.; Melas, D. The natural emissions model (NEMO): Description, application and model evaluation. Atmos. Environ. 2015, 122, 493–504. [Google Scholar] [CrossRef]
  30. Drosoglou, T.; Bais, A.F.; Zyrichidou, I.; Kouremeti, N.; Poupkou, A.; Liora, N.; Giannaros, C.; Koukouli, M.E.; Balis, D.; Melas, D. Comparisons of Ground-Based Tropospheric NO2 MAX-DOAS Measurements to Satellite Obser-vations with the Aid of an Air Quality Model over the Thessaloniki Area, Greece. Atmos. Chem. Phys. 2017, 17, 5829–5849. [Google Scholar] [CrossRef] [Green Version]
  31. Liora, N.; Poupkou, A.; Giannaros, T.M.; Kakosimos, K.E.; Stein, O.; Melas, D. Impacts of natural emission sources on particle pollution levels in Europe. Atmos. Environ. 2016, 137, 171–185. [Google Scholar] [CrossRef]
  32. Marecal, V.; Peuch, V.-H.; Andersson, C.; Andersson, S.; Arteta, J.; Beekmann, M.; Benedictow, A.; Bergstrom, R.W.; Bessagnet, B.; Cansado, A.; et al. A regional air quality forecasting system over Europe: The MACC-II daily ensemble production. Geosci. Model Dev. 2015, 8, 2777–2813. [Google Scholar] [CrossRef] [Green Version]
  33. Kontos, S.; Liora, N.; Giannaros, C.; Kakosimos, K.; Poupkou, A.; Melas, D. Modeling natural dust emissions in the central Middle East: Parameterizations and sensitivity. Atmos. Environ. 2018, 190, 294–307. [Google Scholar] [CrossRef]
  34. Kontos, S.; Kakosimos, K.; Liora, N.; Poupkou, A.; Melas, D. Towards a Regional Dust Modeling System in the Central Middle East: Evaluation, Uncertainties and Recommendations. Atmos. Environ. 2021, 246, 118160. [Google Scholar] [CrossRef]
  35. Skamarock, W.C.; Klemp, J.B.; Dudhia, J.; Gill, D.O.; Barker, D.M.; Duda, M.G.; Huang, X.Y.; Wang, W.; Powers, J.G. A Description of the Advanced Research WRF Version 3; U.S. National Center for Atmospheric Research: Boulder, CO, USA, 2008. [Google Scholar]
  36. ENVIRON. User’s Guide CAMx Comprehensive Air Quality Model with Extensions, 6., 5th ed.; Ramboll US Corporation: Novato, CA, USA, 2018. [Google Scholar]
  37. Granier, C.; Darras, S.; van Der Gon, H.D.; Jana, D.; Elguindi, N.; Bo, G.; Michael, G.; Marc, G.; Jalkanen, J.P.; Kuenen, J.; et al. The Copernicus Atmosphere Monitoring Service Global and Regional Emissions (April 2019 Version), Copernicus Atmosphere Monitoring Service (CAMS) Report; Laboratoire d’Aérologie: Toulouse, France, 2019. [Google Scholar]
  38. Schaap, M.; Manders, A.M.M.; Hendriks, E.C.J.; Cnossen, J.M.; Segers, A.J.S.; Denier van Der Gon, H.A.C.; Jozwicka, M. Regional Modelling of Particulate Matter for The Netherlands; Research Program on Particulate Matter; PBL: Bilthoven, The Netherlands, 2009. [Google Scholar]
  39. Tolis, E.I.; Saraga, D.; Filiou, K.F.; Tziavos, N.; Tsiaousis, C.P.; Dinas, A.; Bartzis, J.G. One-year intensive characterization on PM2.5 nearby port area of Thessaloniki, Greece. Environ. Sci. Pollut. Res. 2014, 22, 6812–6826. [Google Scholar] [CrossRef]
  40. Brown, S.G.; Lee, T.; Roberts, P.T.; Collett, J.L., Jr. Variations in the OM/OC ratio of urban organic aerosol next to a major roadway. J. Air Waste Manag. Assoc. 2013, 63, 1422–1433. [Google Scholar] [CrossRef] [PubMed] [Green Version]
  41. Paraskevopoulou, D.; Liakakou, E.; Gerasopoulos, E.; Theodosi, C.; Mihalopoulos, N. Long-Term Characterization of Organic and Elemental Carbon in the PM2.5 Fraction: The Case of Athens, Greece. Atmos. Chem. Phys. 2014, 14, 13313–13325. [Google Scholar] [CrossRef] [Green Version]
  42. Xu, H.; Guinot, B.; Shen, Z.; Ho, K.F.; Niu, X.; Xiao, S.; Huang, R.-J.; Cao, J. Characteristics of Organic and Elemental Carbon in PM2.5 and PM0.25 in Indoor and Outdoor Environments of a Middle School: Secondary Formation of Organic Carbon and Sources Identification. Atmosphere 2015, 6, 361–379. [Google Scholar] [CrossRef] [Green Version]
  43. Kaskaoutis, D.G.; Grivas, G.; Theodosi, C.; Tsagkaraki, M.; Paraskevopoulou, D.; Stavroulas, I.; Liakakou, E.; Gkikas, A.; Hatzianastassiou, N.; Wu, C.; et al. Carbonaceous Aerosols in Contrasting Atmospheric Environments in Greek Cities: Evaluation of the EC-tracer Methods for Secondary Organic Carbon Estimation. Atmosphere 2020, 11, 161. [Google Scholar] [CrossRef] [Green Version]
  44. Katragkou, E.; Kazadzis, S.; Amiridis, V.; Papaioannou, V.; Karathanasis, S.; Melas, D. PM10 regional transport pathways in Thessaloniki, Greece. Atmos. Environ. 2009, 43, 1079–1085. [Google Scholar] [CrossRef]
  45. Dimitriou, K.; Kassomenos, P. A meteorological analysis of PM10 episodes at a high altitude city and a low altitude city in central Greece—The impact of wood burning heating devices. Atmos. Res. 2018, 214, 329–337. [Google Scholar] [CrossRef]
  46. Dimitriou, K.; Kassomenos, P. Estimation of North African dust contribution on PM10 episodes at four continental Greek cities. Ecol. Indic. 2019, 106, 105530. [Google Scholar] [CrossRef]
  47. Seinfeld, J.H.; Pandis, S.N. Atmospheric Chemistry and Physics from Air Pollution to Climate Change; John Wiley & Sons, Inc.: Hoboken, NJ, USA, 2006; ISBN-13: 978-0-471-72018-8. [Google Scholar]
  48. Vasilatou, V.; Manousakas, M.; Gini, M.; Diapouli, E.; Scoullos, M.; Eleftheriadis, K. Long Term Flux of Saharan Dust to the Aegean Sea around the Attica Region, Greece. Front. Mar. Sci. 2017, 4, 42. [Google Scholar] [CrossRef] [Green Version]
  49. Giovanni NASA. Available online: Https://Giovanni.Gsfc.Nasa.Gov/Giovanni/ (accessed on 3 May 2023).
  50. Worldview NASA. Available online: Https://Worldview.Earthdata.Nasa.Gov/ (accessed on 3 May 2023).
  51. Diapouli, E.; Manousakas, M.; Vratolis, S.; Vasilatou, V.; Maggos, T.; Saraga, D.; Grigoratos, T.; Argyropoulos, G.; Voutsa, D.; Samara, C.; et al. Evolution of air pollution source contributions over one decade, derived by PM10 and PM2.5 source apportionment in two metropolitan urban areas in Greece. Atmos. Environ. 2017, 164, 416–430. [Google Scholar] [CrossRef]
  52. Salameh, D.; Detournay, A.; Pey, J.; Pérez, N.; Liguori, F.; Saraga, D.; Bove, M.C.; Brotto, P.; Cassola, F.; Massabò, D.; et al. PM2.5 chemical composition in five European Mediterranean cities: A 1-year study. Atmos. Res. 2015, 155, 102–117. [Google Scholar] [CrossRef]
  53. Scerri, M.M.; Weinbruch, S.; Delmaire, G.; Mercieca, N.; Nolle, M.; Prati, P.; Massabò, D. Exhaust and non-exhaust contributions from road transport to PM10 at a Southern European traffic site. Environ. Pollut. 2023, 316, 120569. [Google Scholar] [CrossRef] [PubMed]
  54. Stavroulas, I.; Bougiatioti, A.; Grivas, G.; Paraskevopoulou, D.; Tsagkaraki, M.; Zarmpas, P.; Liakakou, E.; Gera-sopoulos, E.; Mihalopoulos, N. Sources and Processes That Control the Submicron Organic Aerosol Composi-tion in an Urban Mediterranean Environment (Athens): A High Temporal-Resolution Chemical Composition Measurement Study. Atmos. Chem. Phys. 2019, 19, 901–919. [Google Scholar] [CrossRef] [Green Version]
  55. Liakakou, E.; Stavroulas, I.; Kaskaoutis, D.; Grivas, G.; Paraskevopoulou, D.; Dumka, U.; Tsagkaraki, M.; Bougiatioti, A.; Oikonomou, K.; Sciare, J.; et al. Long-term variability, source apportionment and spectral properties of black carbon at an urban background site in Athens, Greece. Atmos. Environ. 2019, 222, 117137. [Google Scholar] [CrossRef]
  56. Samara, C.; Voutsa, D.; Kouras, A.; Eleftheriadis, K.; Maggos, T.; Saraga, D.; Petrakakis, M. Organic and elemental carbon associated to PM10 and PM2.5 at urban sites of northern Greece. Environ. Sci. Pollut. Res. 2013, 21, 1769–1785. [Google Scholar] [CrossRef]
  57. Saraga, D.; Maggos, T.; Degrendele, C.; Klánová, J.; Horvat, M.; Kocman, D.; Kanduč, T.; Dos Santos, S.G.; Franco, R.; Gómez, P.M.; et al. Multi-city comparative PM2.5 source apportionment for fifteen sites in Europe: The ICARUS project. Sci. Total Environ. 2020, 751, 141855. [Google Scholar] [CrossRef]
  58. Special Issue “Secondary Organic Aerosol (SOA) Formation, Properties and Evolution in the Atmosphere”. Available online: https://www.mdpi.com/journal/atmosphere/special_issues/SOA_Atmosphere (accessed on 10 December 2022).
  59. Voutsa, D.; Samara, C.; Manoli, E.; Lazarou, D.; Tzoumaka, P. Ionic composition of PM2.5 at urban sites of northern Greece: Secondary inorganic aerosol formation. Environ. Sci. Pollut. Res. 2013, 21, 4995–5006. [Google Scholar] [CrossRef]
  60. Nastos, P.T.; Larissi, I.K.; Grigoropoulos, K.N.; Antoniou, A.; Paliatsos, A.G. Indoor and Outdoor Particulate Matter Variability in Athens, Greece. Indoor Built Environ. 2012, 22, 586–592. [Google Scholar] [CrossRef]
  61. Pennington, E.A.; Seltzer, K.M.; Murphy, B.N.; Qin, M.; Seinfeld, J.H.; Pye, H.O.T. Modeling secondary organic aerosol formation from volatile chemical products. Atmos. Meas. Tech. 2021, 21, 18247–18261. [Google Scholar] [CrossRef]
  62. Jiang, J.; Aksoyoglu, S.; El-Haddad, I.; Ciarelli, G.; van der Gon, H.A.C.D.; Canonaco, F.; Gilardoni, S.; Paglione, M.; Minguillón, M.C.; Favez, O.; et al. Sources of organic aerosols in Europe: A modeling study using CAMx with modified volatility basis set scheme. Atmos. Meas. Tech. 2019, 19, 15247–15270. [Google Scholar] [CrossRef] [Green Version]
  63. Meroni, A.; Pirovano, G.; Gilardoni, S.; Lonati, G.; Colombi, C.; Gianelle, V.; Paglione, M.; Poluzzi, V.; Riva, G.; Toppetti, A. Investigating the role of chemical and physical processes on organic aerosol modelling with CAMx in the Po Valley during a winter episode. Atmos. Environ. 2017, 171, 126–142. [Google Scholar] [CrossRef]
  64. Fountoukis, C.; Megaritis, A.G.; Skyllakou, K.; Charalampidis, P.E.; Denier van Der Gon, H.A.C.; Crippa, M.; Prev Ot, A.S.H.; Fachinger, F.; Wiedensohler, A.; Pilinis, C.; et al. Simulating the Formation of Carbonaceous Aerosol in a European Megacity (Paris) during the MEGAPOLI Summer and Winter Campaigns. Atmos. Chem. Phys. 2016, 15, 25547–25582. [Google Scholar] [CrossRef] [Green Version]
  65. Kroll, J.H.; Seinfeld, J.H. Chemistry of secondary organic aerosol: Formation and evolution of low-volatility organics in the atmosphere. Atmos. Environ. 2008, 42, 3593–3624. [Google Scholar] [CrossRef]
  66. Basla, B.; Agresti, V.; Balzarini, A.; Giani, P.; Pirovano, G.; Gilardoni, S.; Paglione, M.; Colombi, C.; Belis, C.A.; Poluzzi, V.; et al. Simulations of Organic Aerosol with CAMx over the Po Valley during the Summer Sea-son. Atmosphere 2022, 13, 1996. Available online: Https://Www.Mdpi.Com/2073-4433/13/12/1996/Pdf (accessed on 24 June 2023). [CrossRef]
  67. Giani, P.; Balzarini, A.; Pirovano, G.; Gilardoni, S.; Paglione, M.; Colombi, C.; Gianelle, V.L.; Belis, C.A.; Poluzzi, V.; Lonati, G. Influence of Semi- and Intermediate-Volatile Organic Com-pounds (S/IVOC) Parameterizations, Volatility Distributions and Aging Schemes on Organic Aerosol Modelling in Winter Conditions. Atmos. Environ. 2019, 213, 11–24. [Google Scholar] [CrossRef] [Green Version]
  68. Strader, R.; Lurmann, F.W.; Pandis, S.N. Evaluation of Secondary Organic Aerosol Formation in Winter. Atmos. Environ. 1999, 33, 4849–4863. [Google Scholar] [CrossRef]
  69. Koo, B.; Knipping, E.; Yarwood, G. 1.5-Dimensional volatility basis set approach for modeling organic aerosol in CAMx and CMAQ. Atmos. Environ. 2014, 95, 158–164. [Google Scholar] [CrossRef]
  70. Wang, J.; Ye, J.; Zhang, Q.; Zhao, J.; Wu, Y.; Li, J.; Liu, D.; Li, W.; Zhang, Y.; Wu, C.; et al. Aqueous production of secondary organic aerosol from fossil-fuel emissions in winter Beijing haze. Proc. Natl. Acad. Sci. USA 2021, 118, e2022179118. [Google Scholar] [CrossRef]
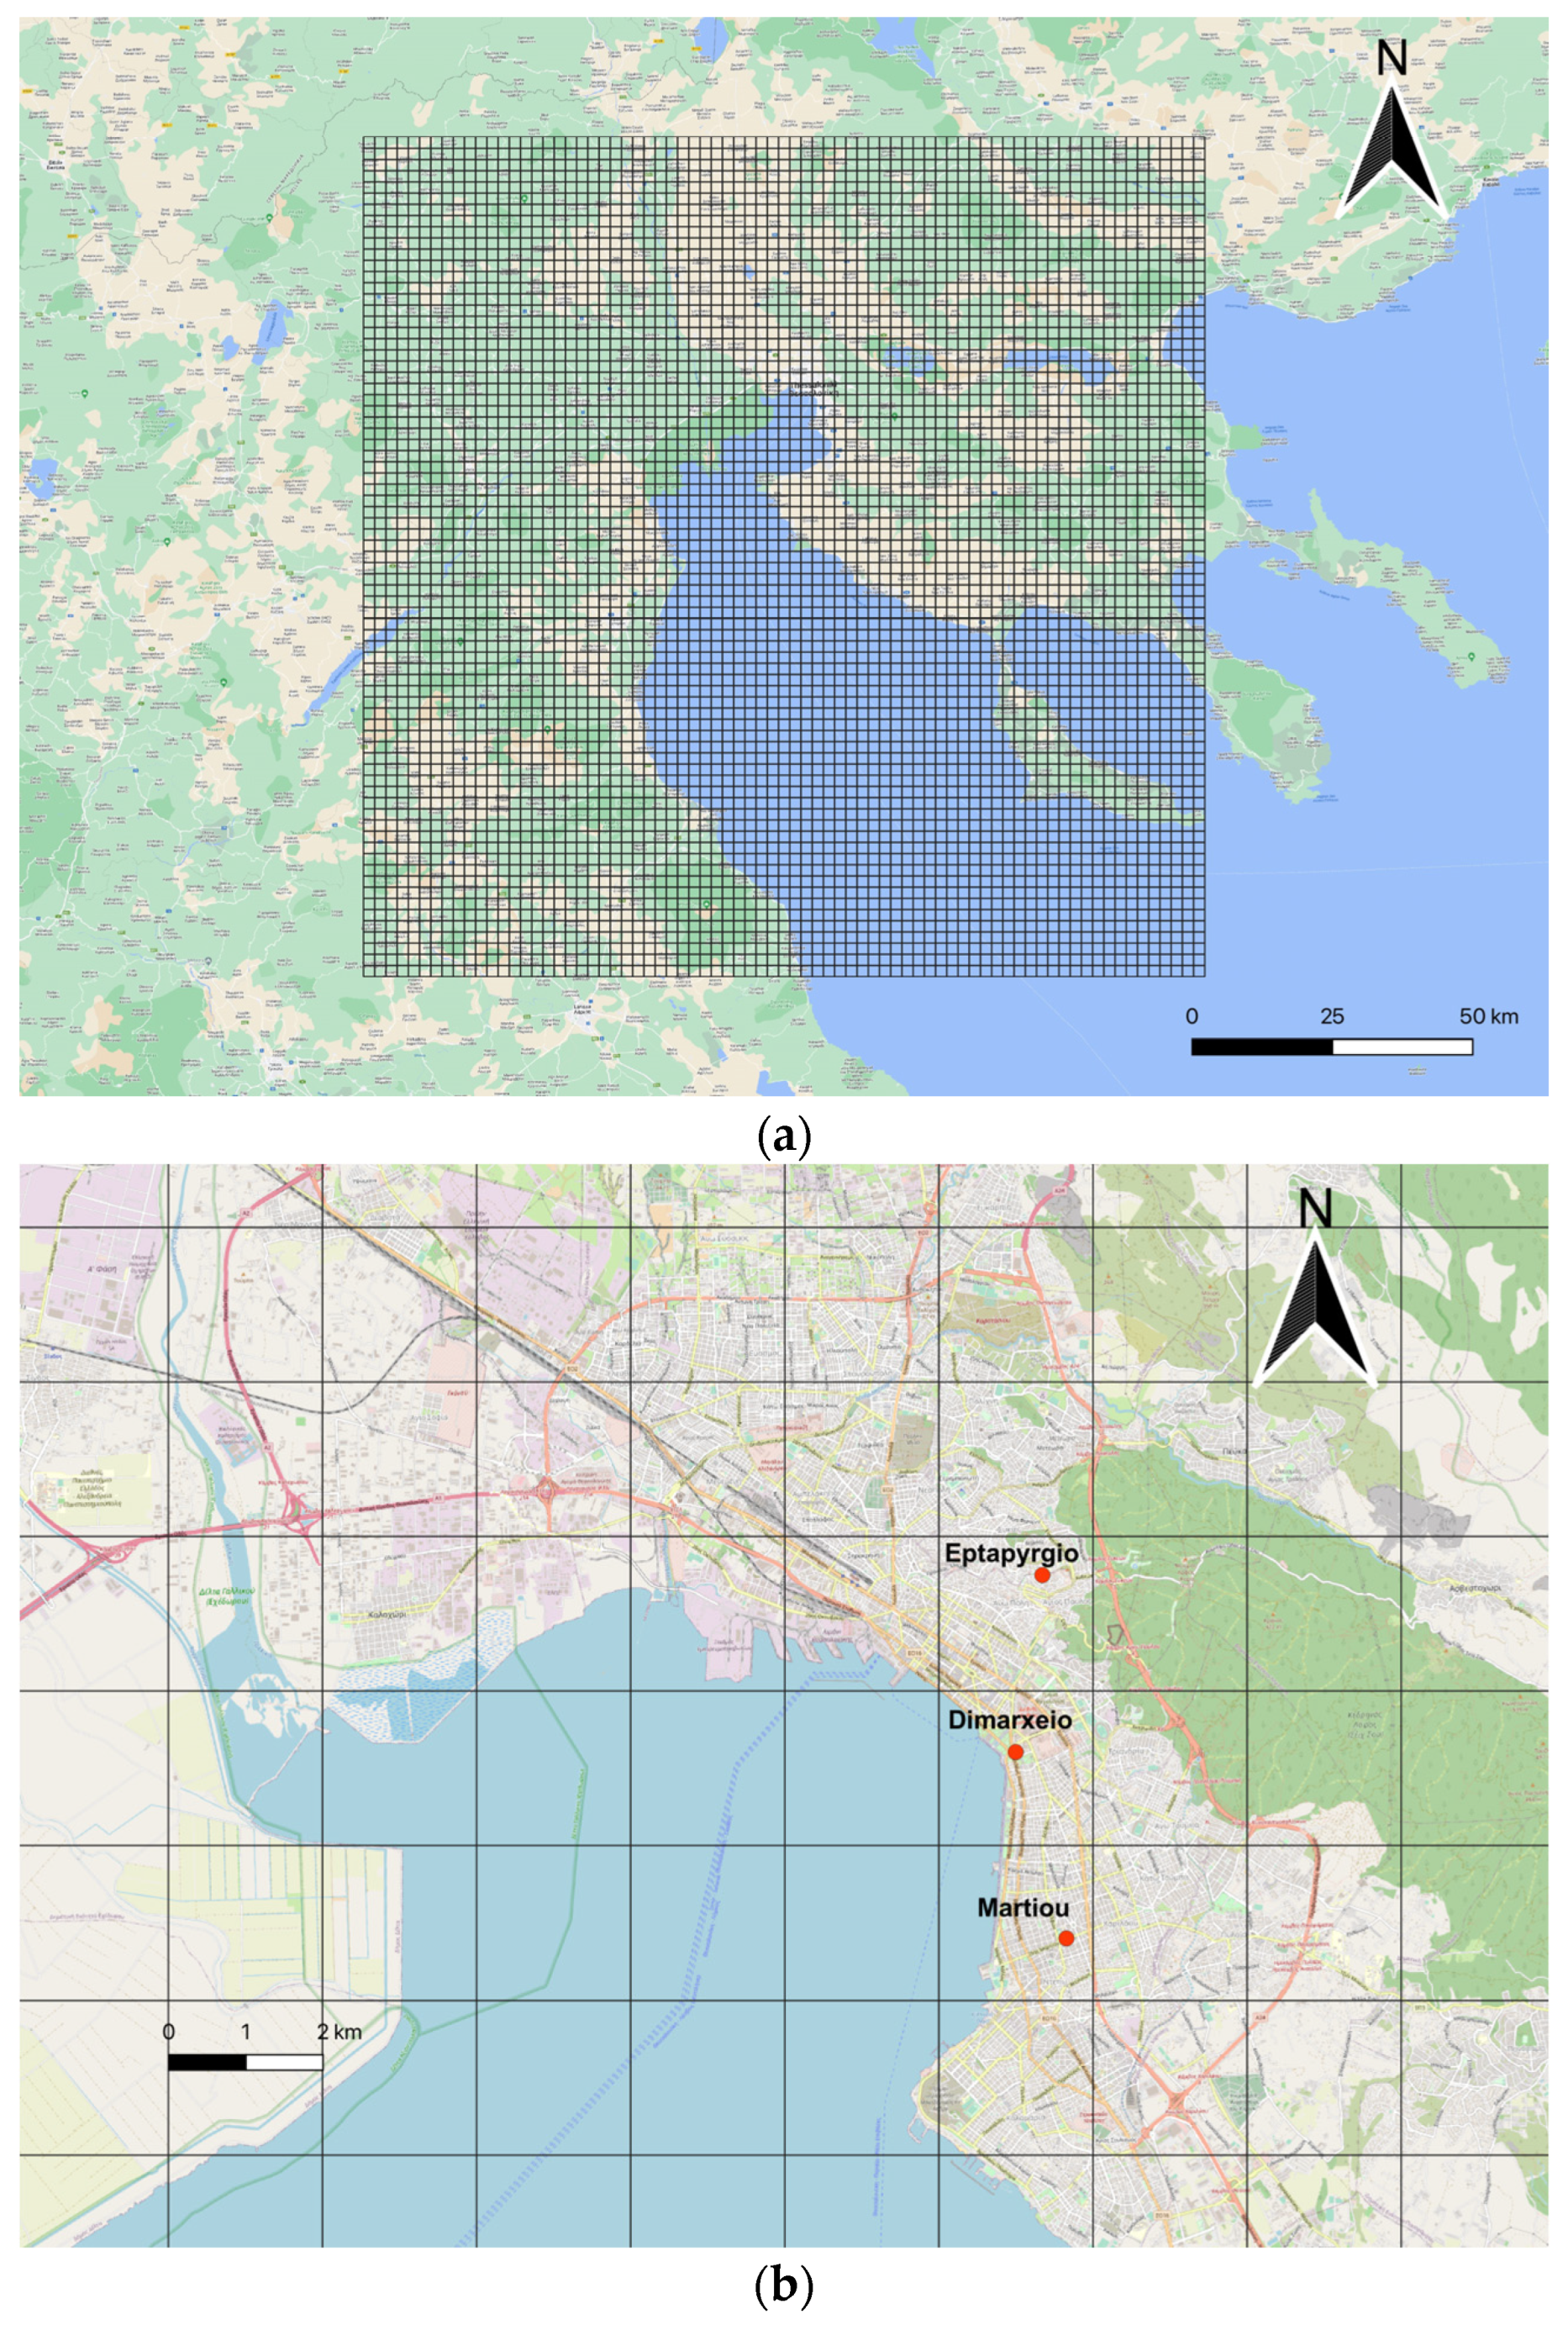
Figure 1. Modeling domain (2 × 2 km2) covering the greater area of Thessaloniki (a) and locations of the Eptapyrgio, Dimarxeio and Martiou monitoring sites in the metropolitan area of Thessaloniki (b).
Sustainability 15 10034 g001
Figure 2. Seasonal variation of mean simulated PM10 species concentrations (in μg/m3) over the grid cells of Dimarxeio (a), Martiou (b) and Eptapyrgio (c).
Sustainability 15 10034 g002aSustainability 15 10034 g002b
Figure 3. Daily values of simulated CCRS species concentrations (in μg/m3) in the grid cell of Dimarxeio.
Sustainability 15 10034 g003
Figure 4. Seasonal variation of PM2.5 (POA) emissions.
Sustainability 15 10034 g004
Figure 5. Seasonal variation of PM2.5 (PEC) emissions.
Sustainability 15 10034 g005
Figure 6. Hourly variation of mean annual simulated PM10 concentrations (in μg/m3) for each species over the grid cell of Dimarxeio (a), Martiou (b) and Eptapyrgio (c) for the year 2015 (Time in UTC).
Sustainability 15 10034 g006aSustainability 15 10034 g006b
Figure 7. Hourly variation of mean simulated PM species concentrations (in μg/m3) during winter (a) and summer (b) over the grid cell of Dimarxeio (Time in UTC).
Sustainability 15 10034 g007aSustainability 15 10034 g007b
Figure 8. Daily variation of mean OC/EC ratio during the cold period (October-April) of 2015 over the grid cells of Martiou (a), Dimarxeio (b), and Eptapyrgio (c) for the base case scenario (blue line) and the sensitivity scenario (red line).
Sustainability 15 10034 g008aSustainability 15 10034 g008b
Table 1. Categorization of aerosols in CAMx model.
Internal LabelName
PSO4Particulate Sulfate
PNO3Particulate Nitrate
PNH4Particulate Ammonium
NaSodium
PClParticulate Chloride
PECPrimary Elemental Carbon
FPRMFine Other Primary ( d 2.5   μ m )
FCRSFine Crustal ( d 2.5   μ m )
POAPrimary Organic Aerosol
SOASecondary Organic aerosol
CPRMCoarse Other Primary (2.5 μm < d 10   μ m )
CCRSCoarse Crustal (2.5 μm < d 10   μ m )
Table 2. PM2.5 speciation profile for the heating emissions due to biomass burning.
Base Case *
(Dimensionless)
Sensitivity Scenario **
(Dimensionless)
POA0.420.8
PEC0.510.1
Other species0.070.1
* CAMS-REGv2, ** Athanasopoulou et al. 2017 [15].
Disclaimer/Publisher’s Note: The statements, opinions and data contained in all publications are solely those of the individual author(s) and contributor(s) and not of MDPI and/or the editor(s). MDPI and/or the editor(s) disclaim responsibility for any injury to people or property resulting from any ideas, methods, instructions or products referred to in the content.