
Spaceborne SAR-Based Detection of Ships in Suez Gulf to Analyze the Maritime Traffic Jam Caused Due to the Blockage of Egypt’s Suez Canal


Abstract
1. Introduction
2. Algorithms and Approaches for Ship Detection
3. Study Area and Data
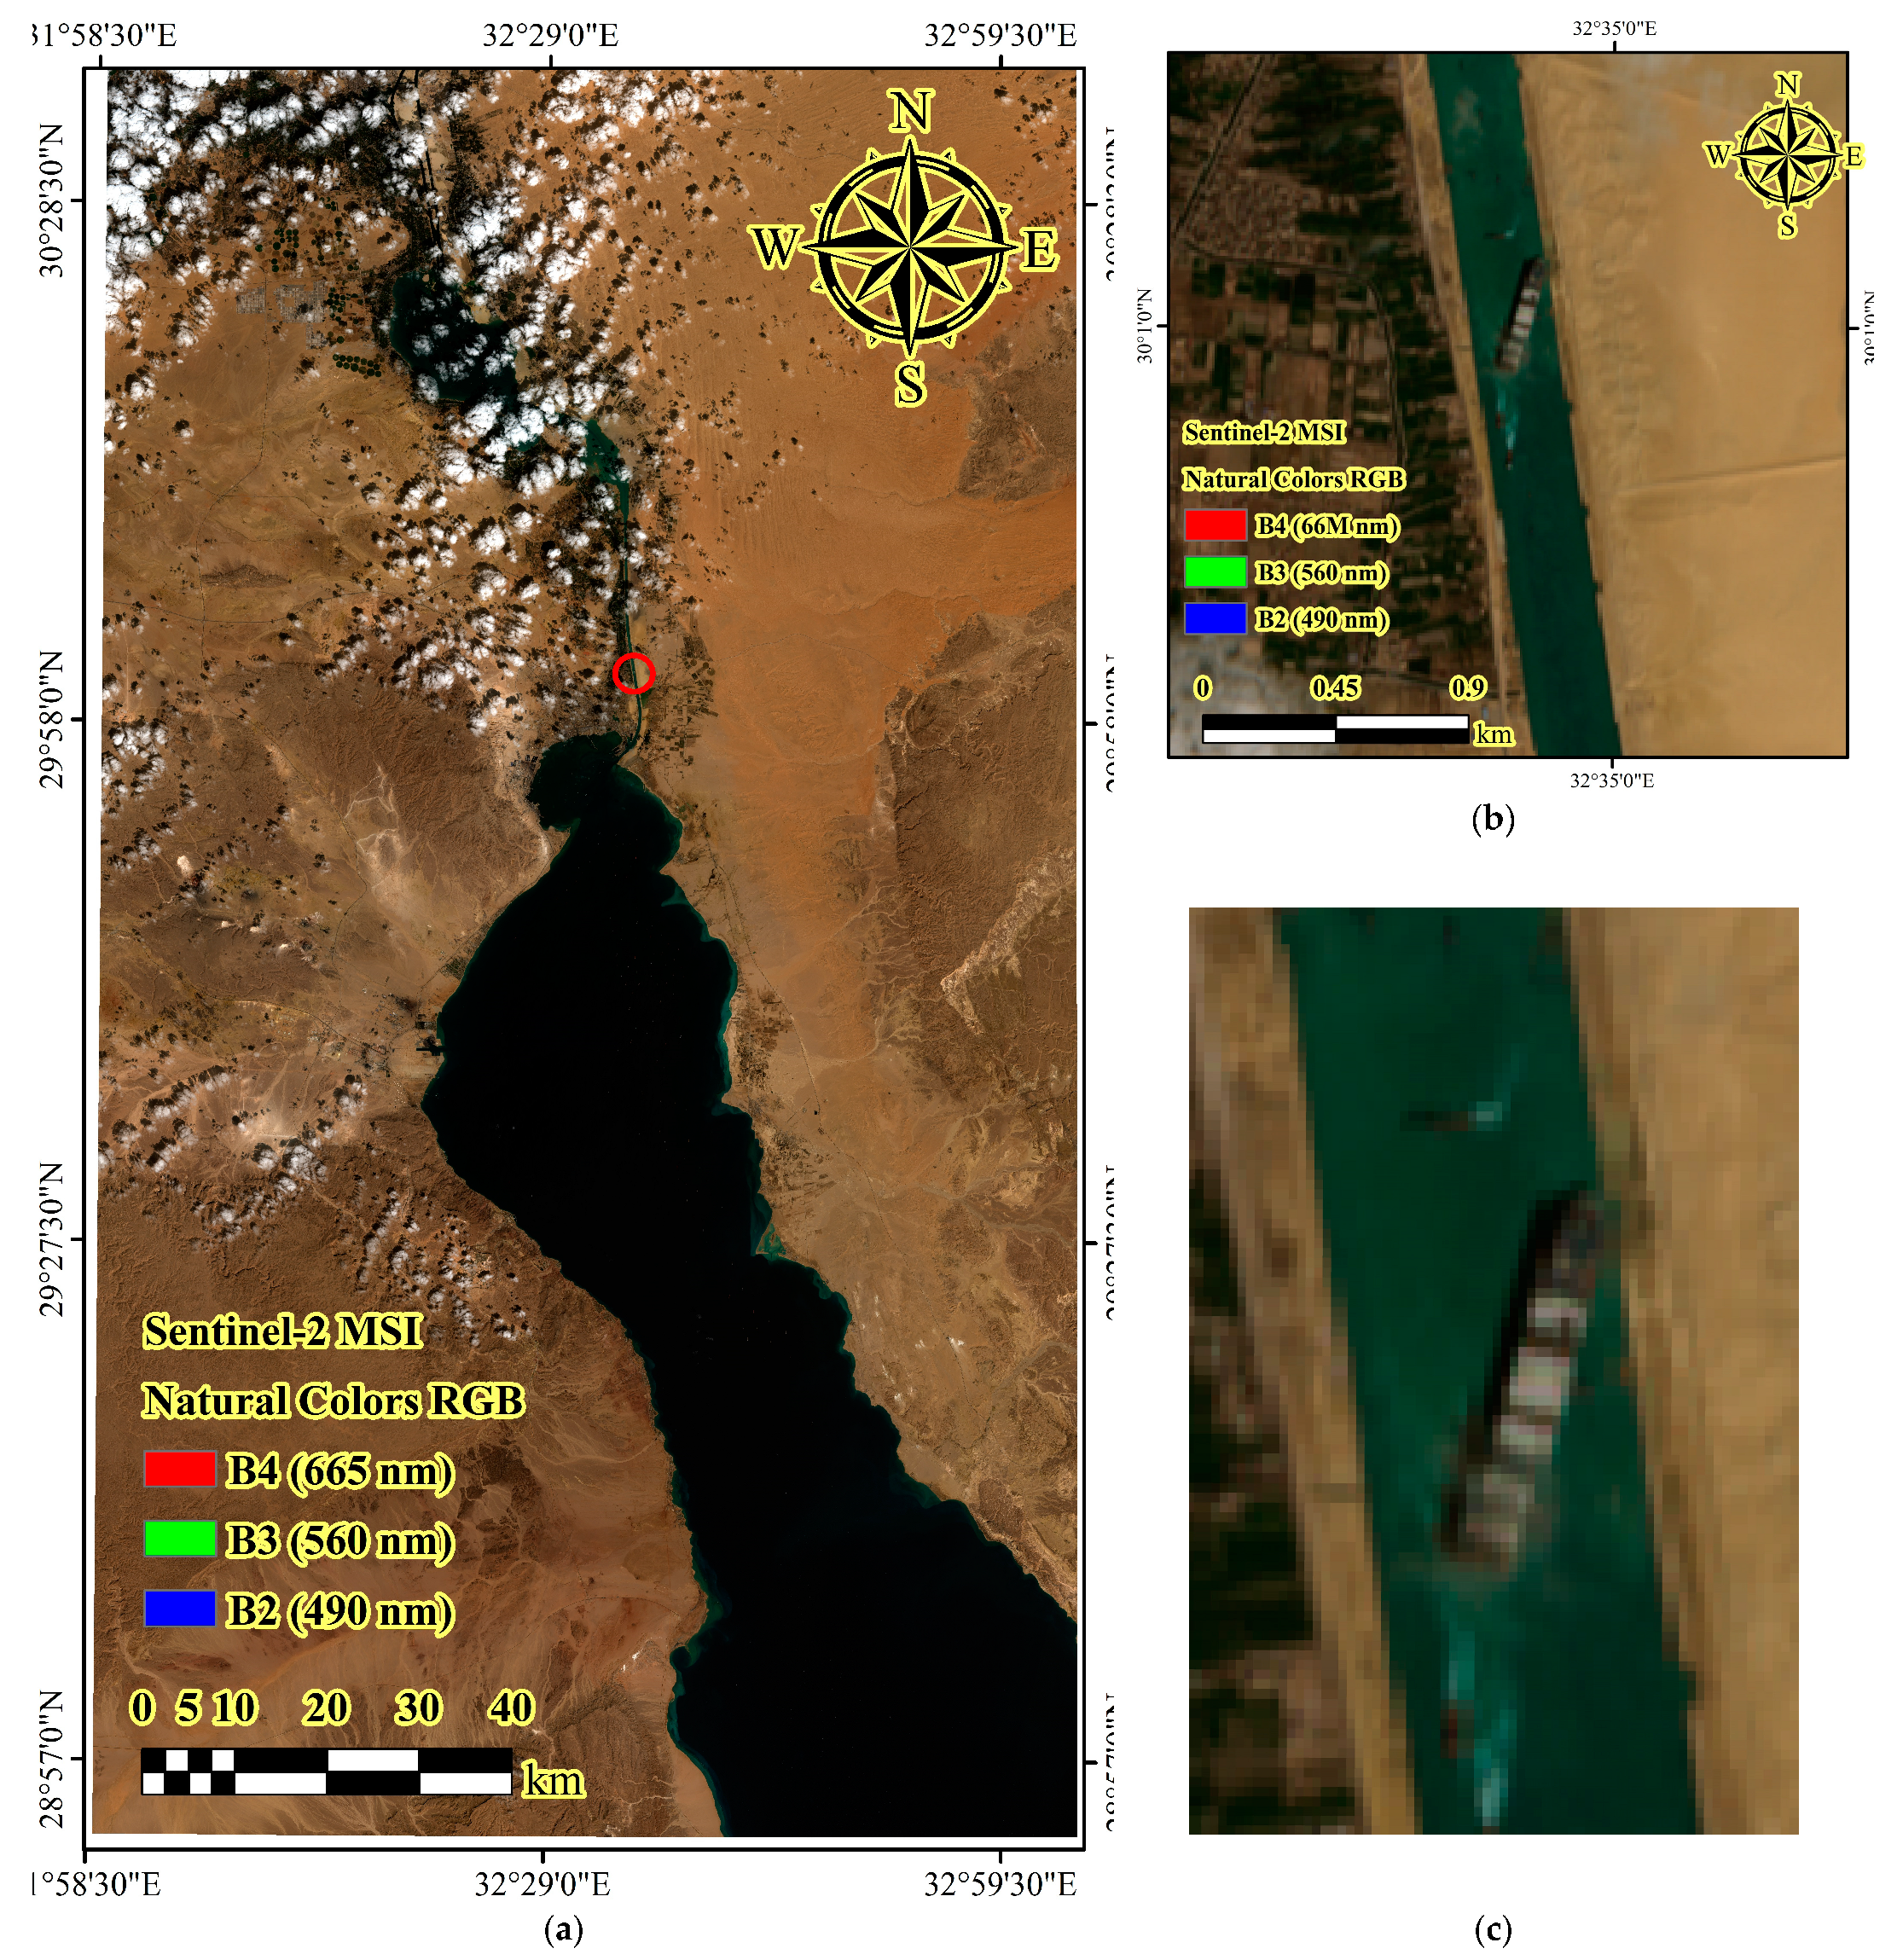
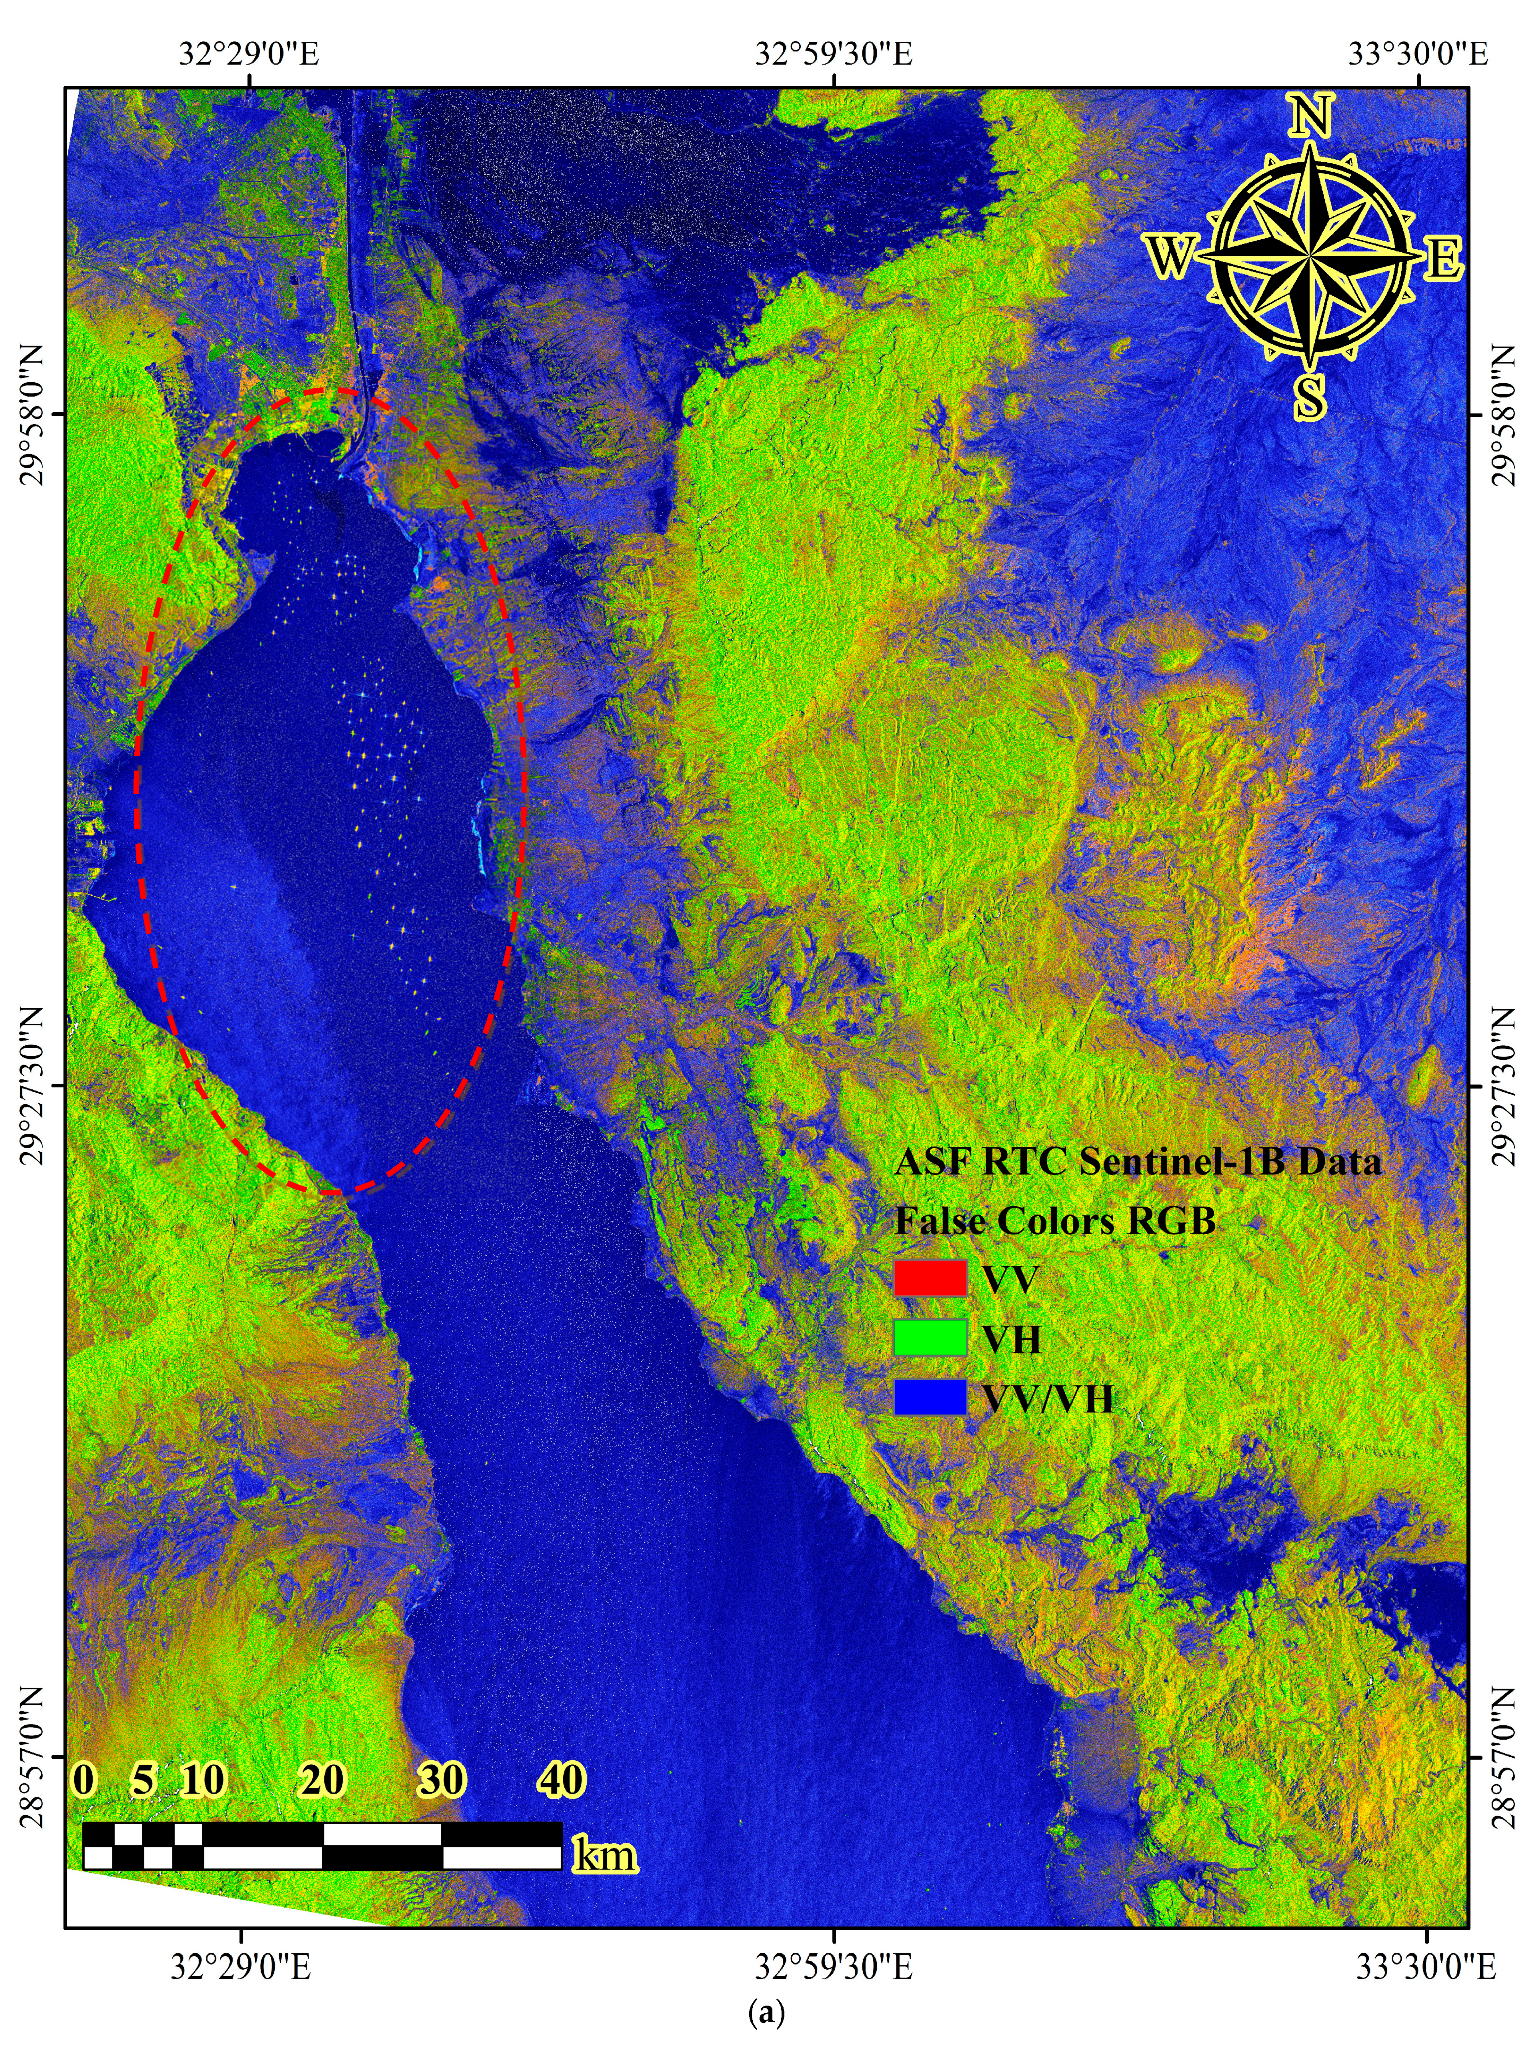
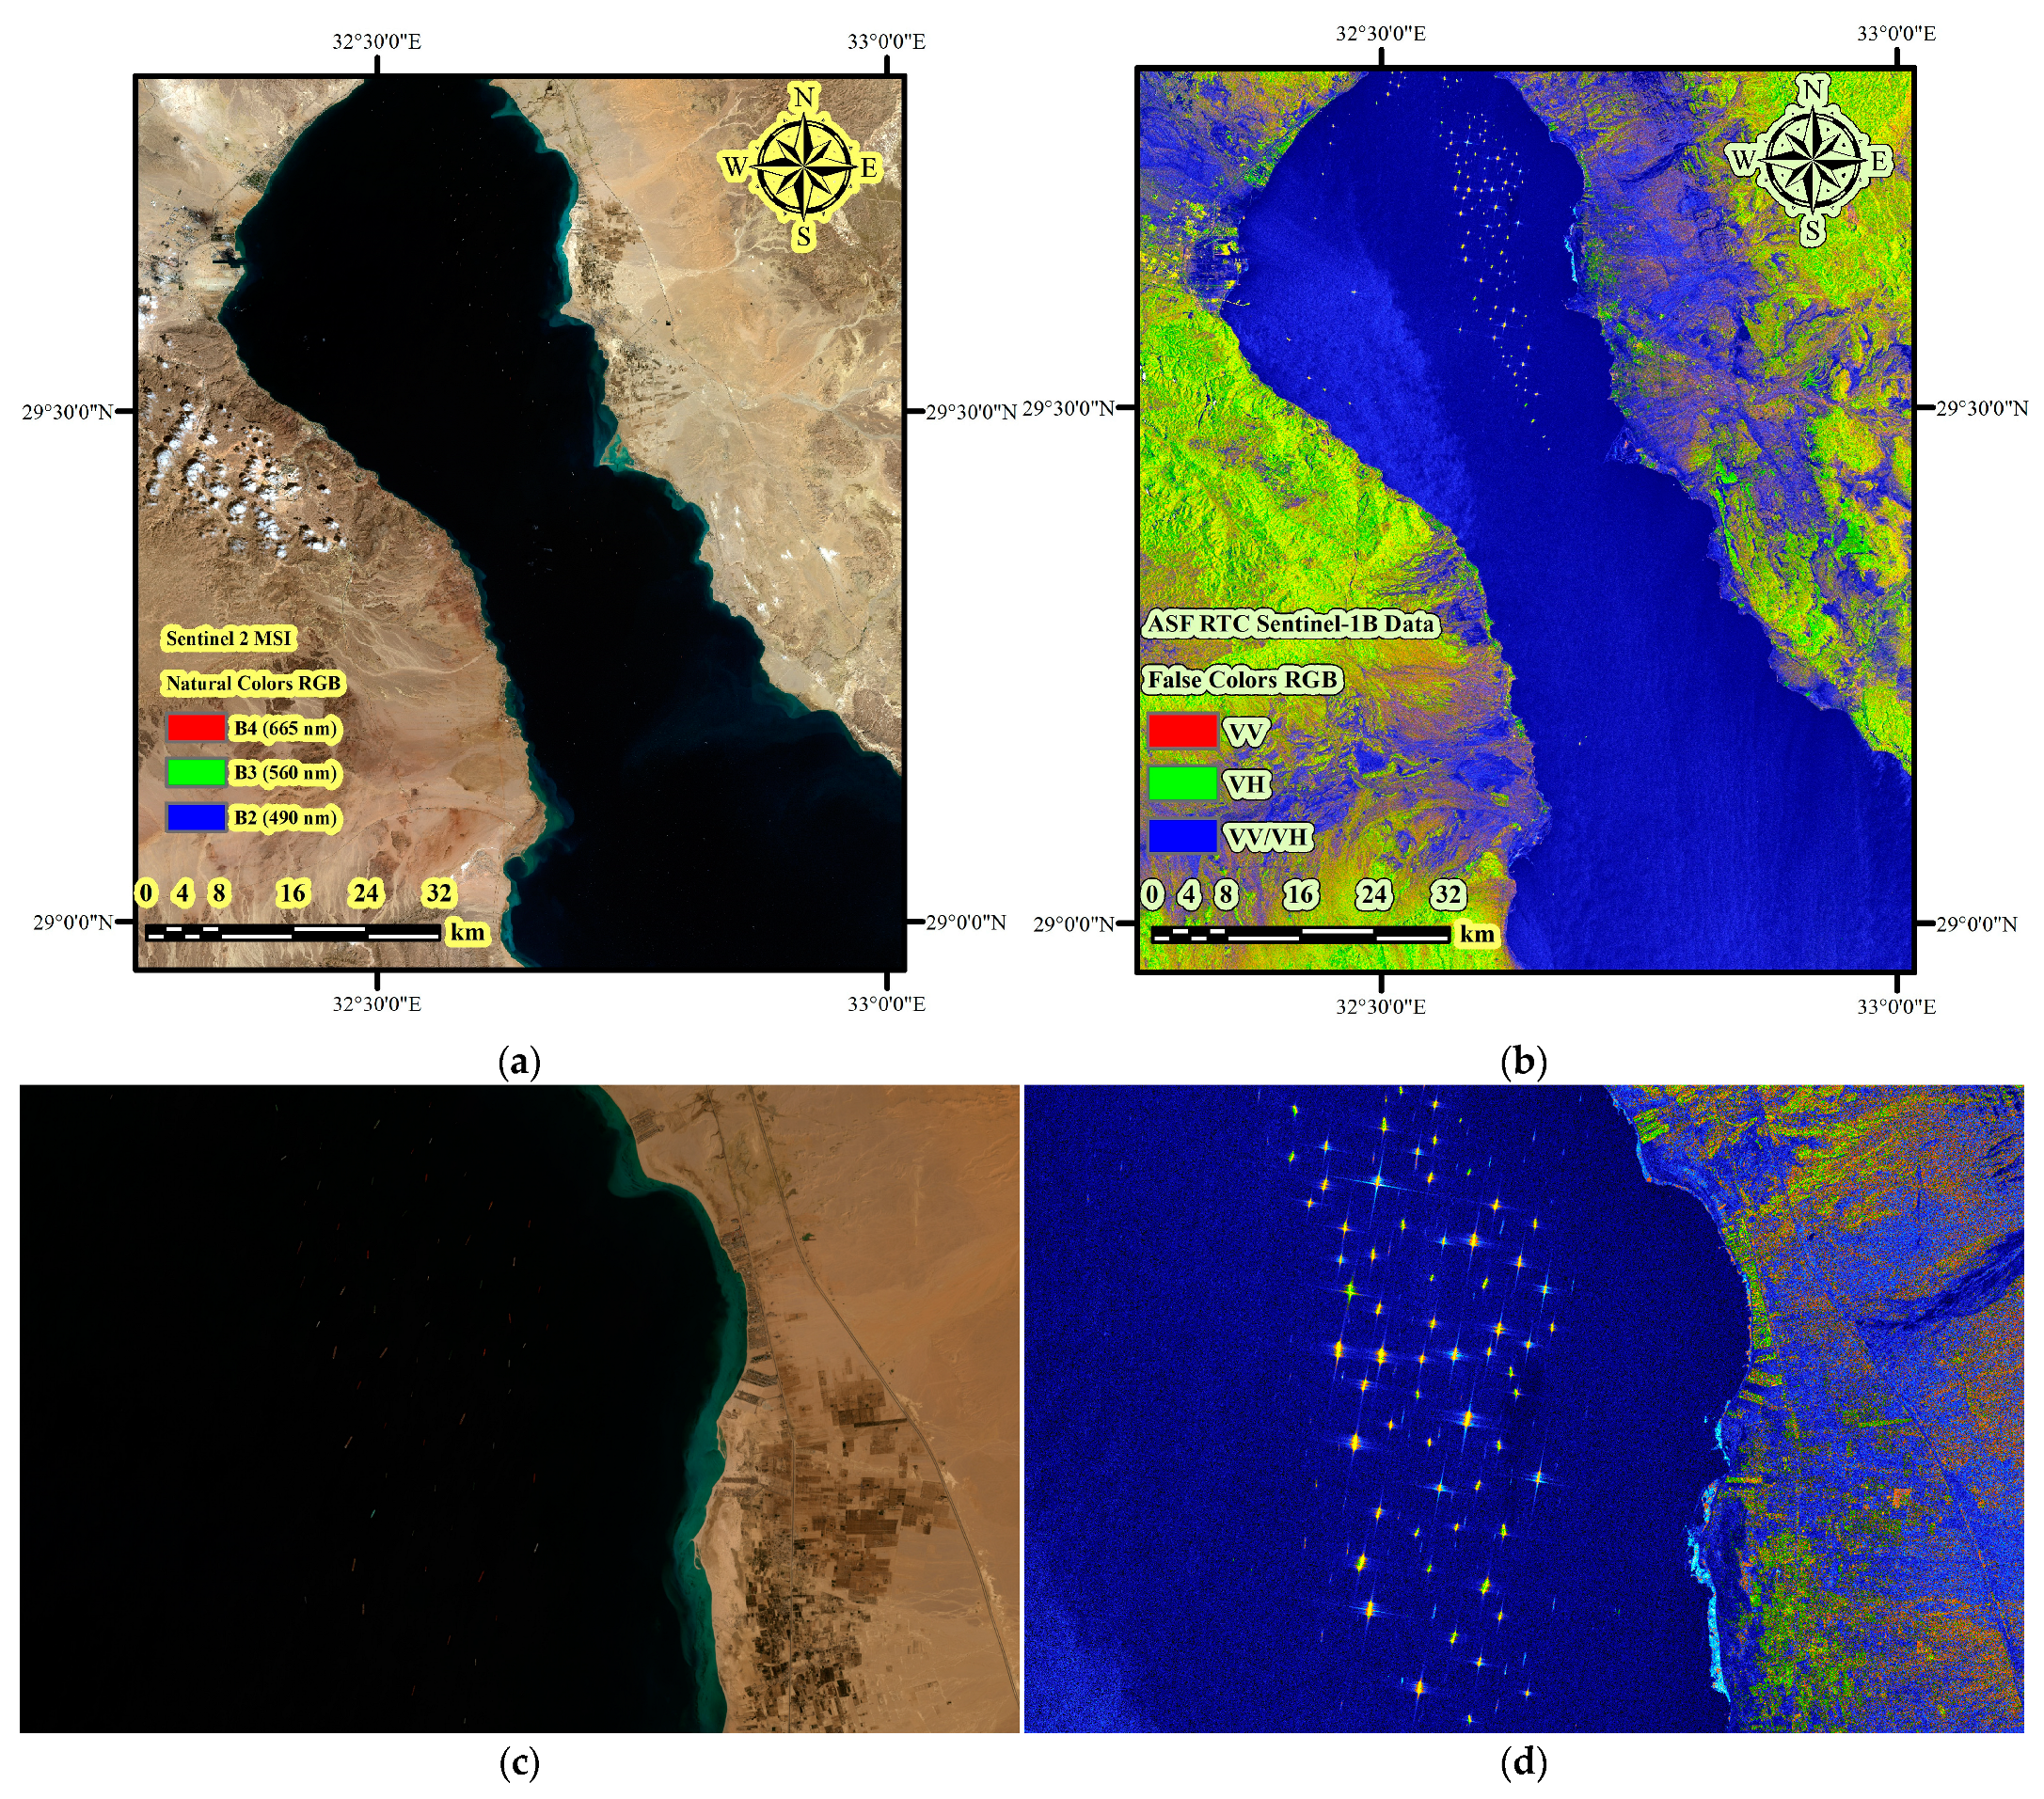
3.1. Study Area
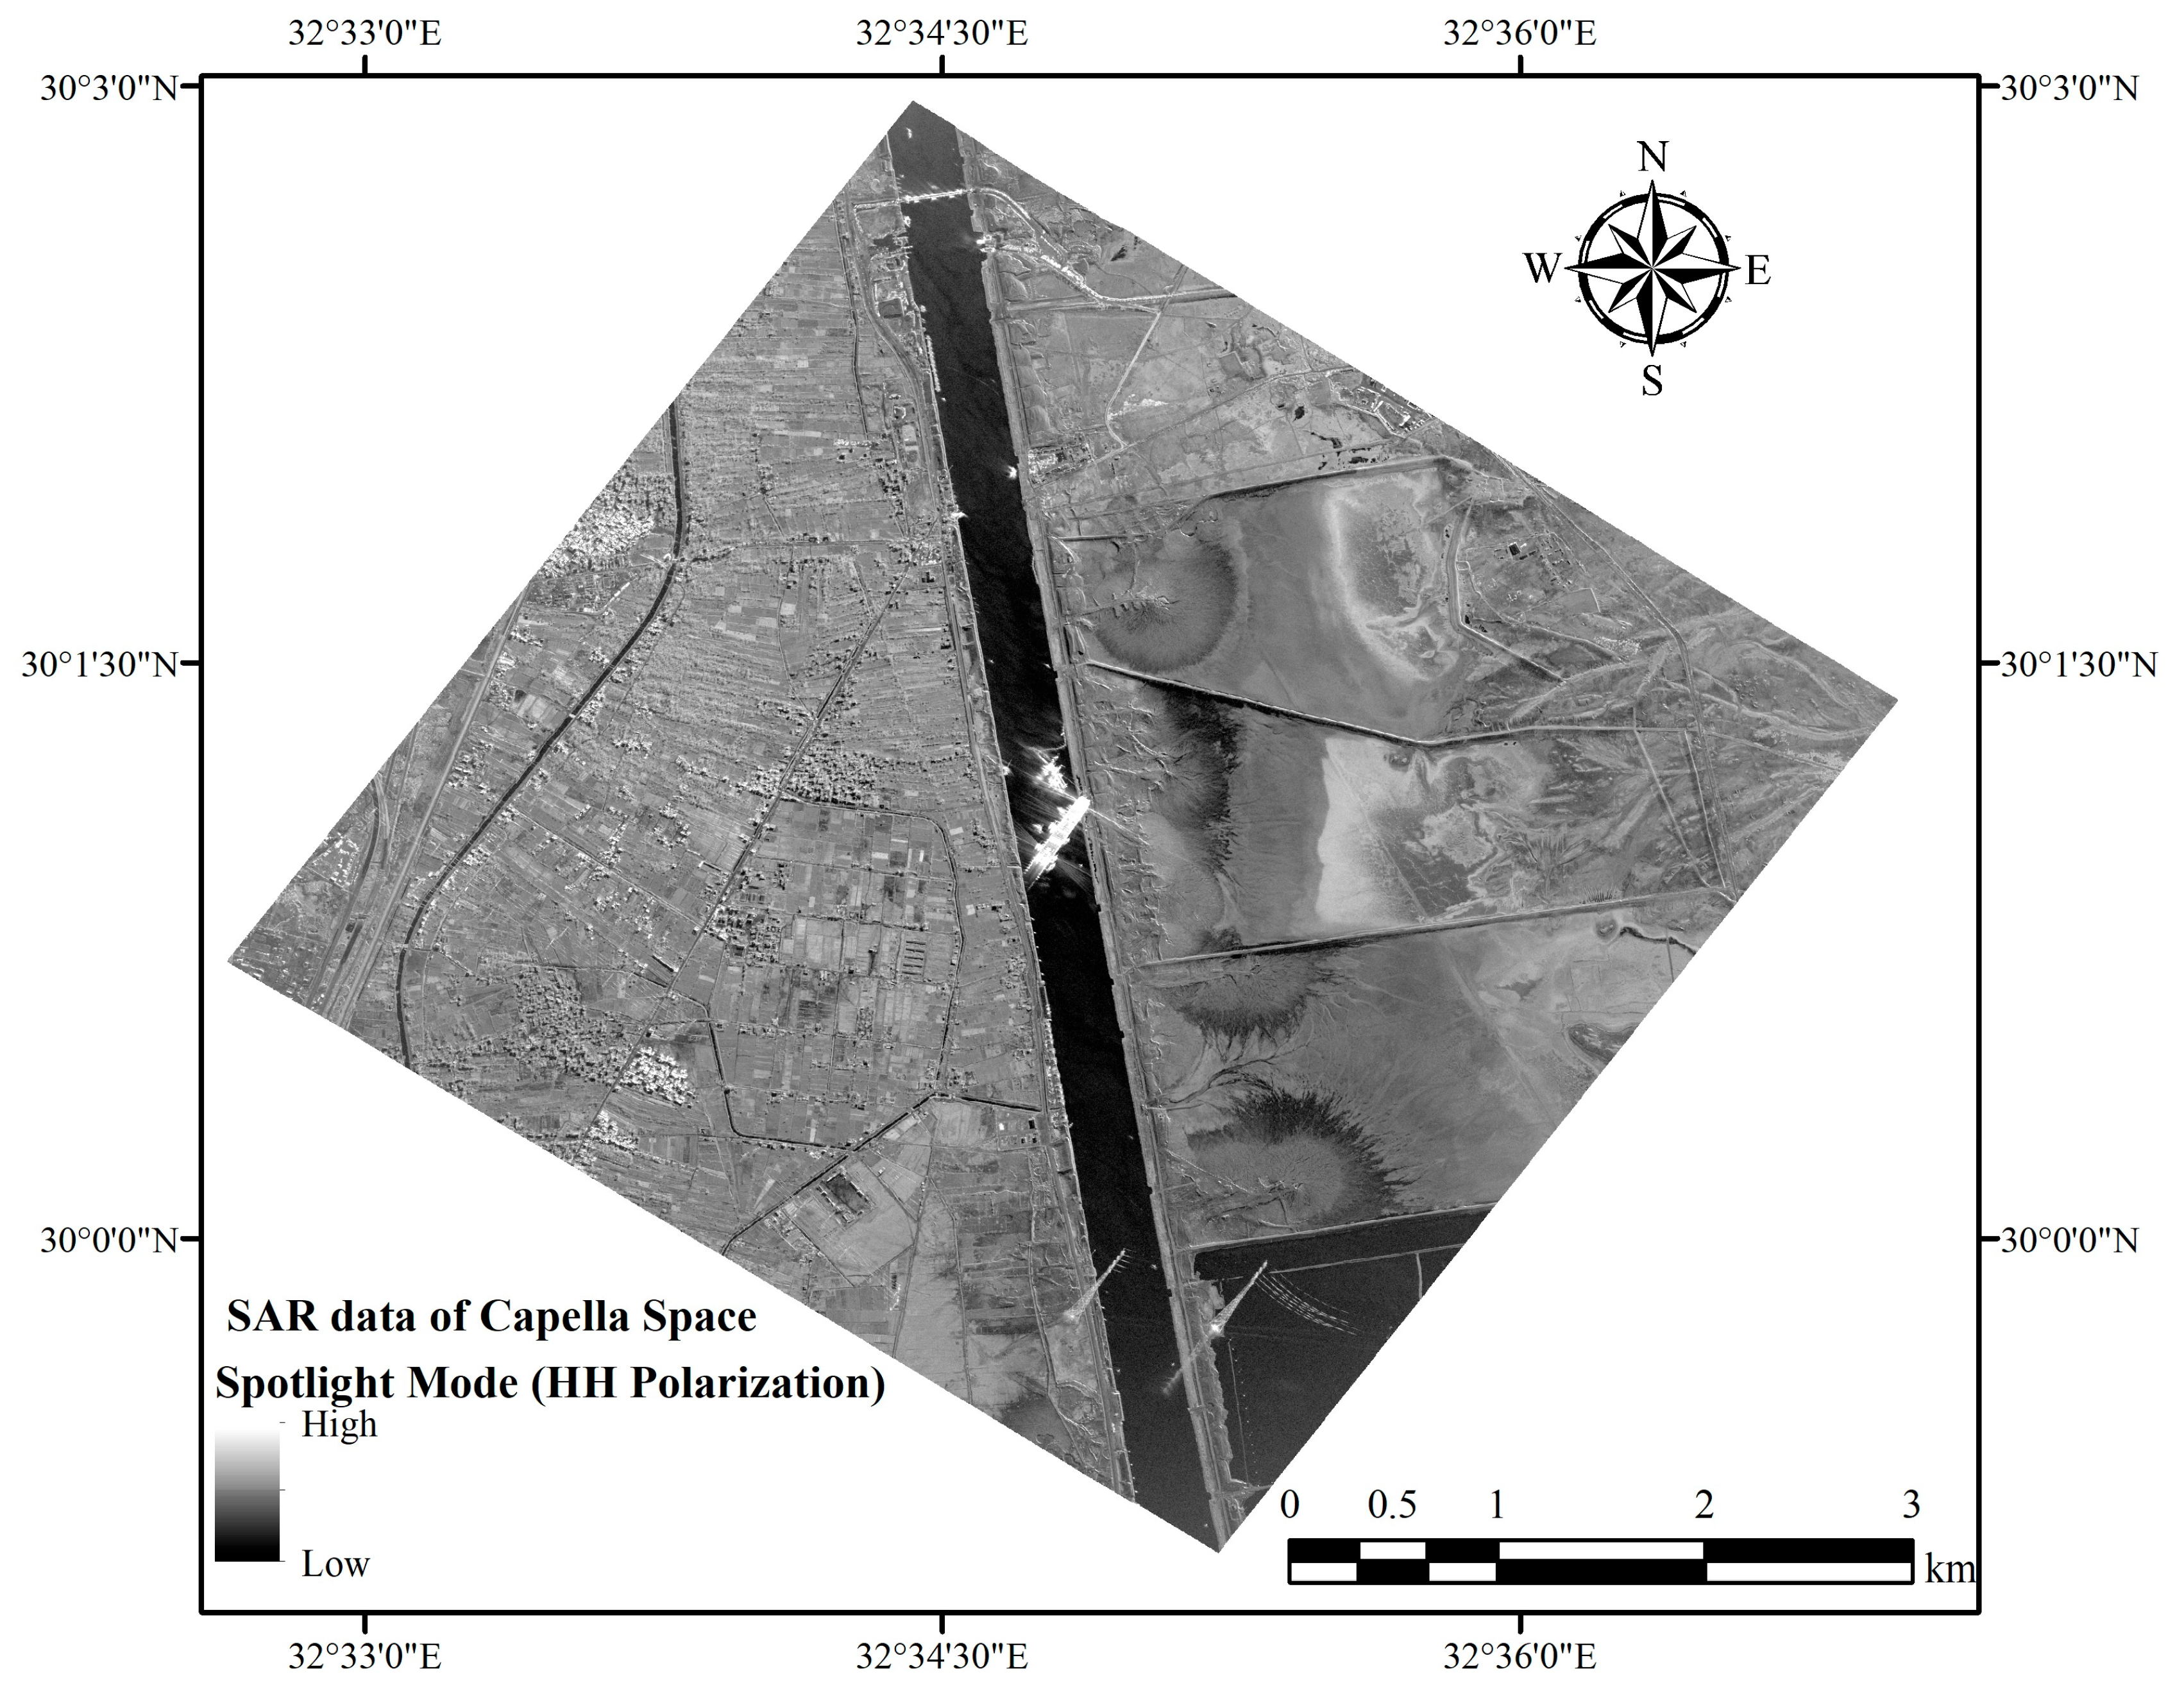
3.2. Dataset
4. Methodology
4.1. Pre-Processing of SAR Data
4.2. Ship Detection Using Sentinel-1 Dataset
- Land–Sea Masking: To minimize the erroneous detection of light poles, bridges, and land mass, which appear as bright pixels in SAR images, a land–sea mask must be built to mask the land area. By default, the SRTM 3-sec digital elevation model is utilized to detect and filter off regions of positive elevation. In certain ports, extensive pixel masking from the beach can be used to evade the detection of another object. Another approach might be to use vector data (.shp) to mask the region of interest and avoid false detection.
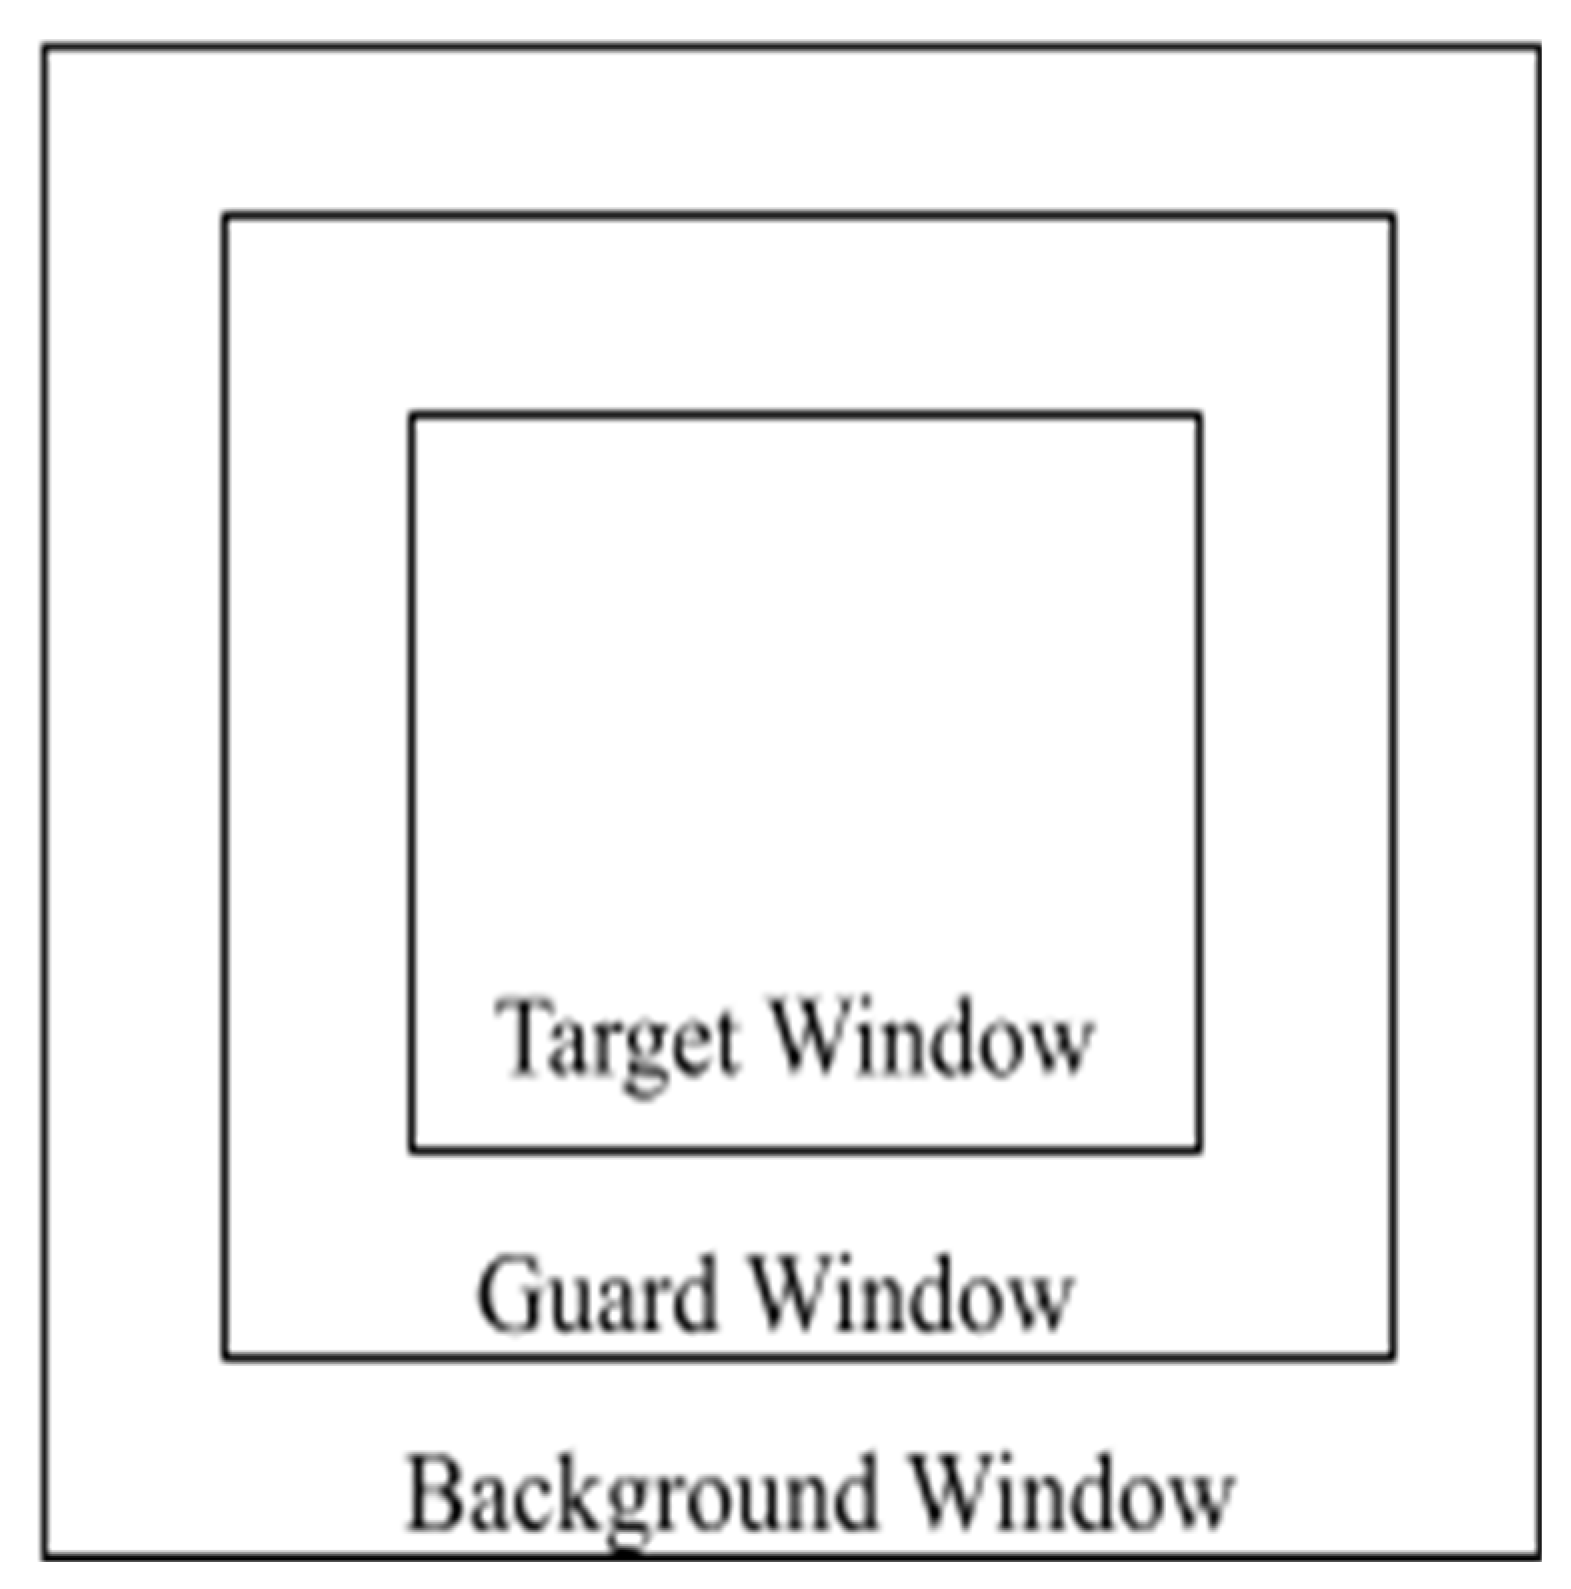
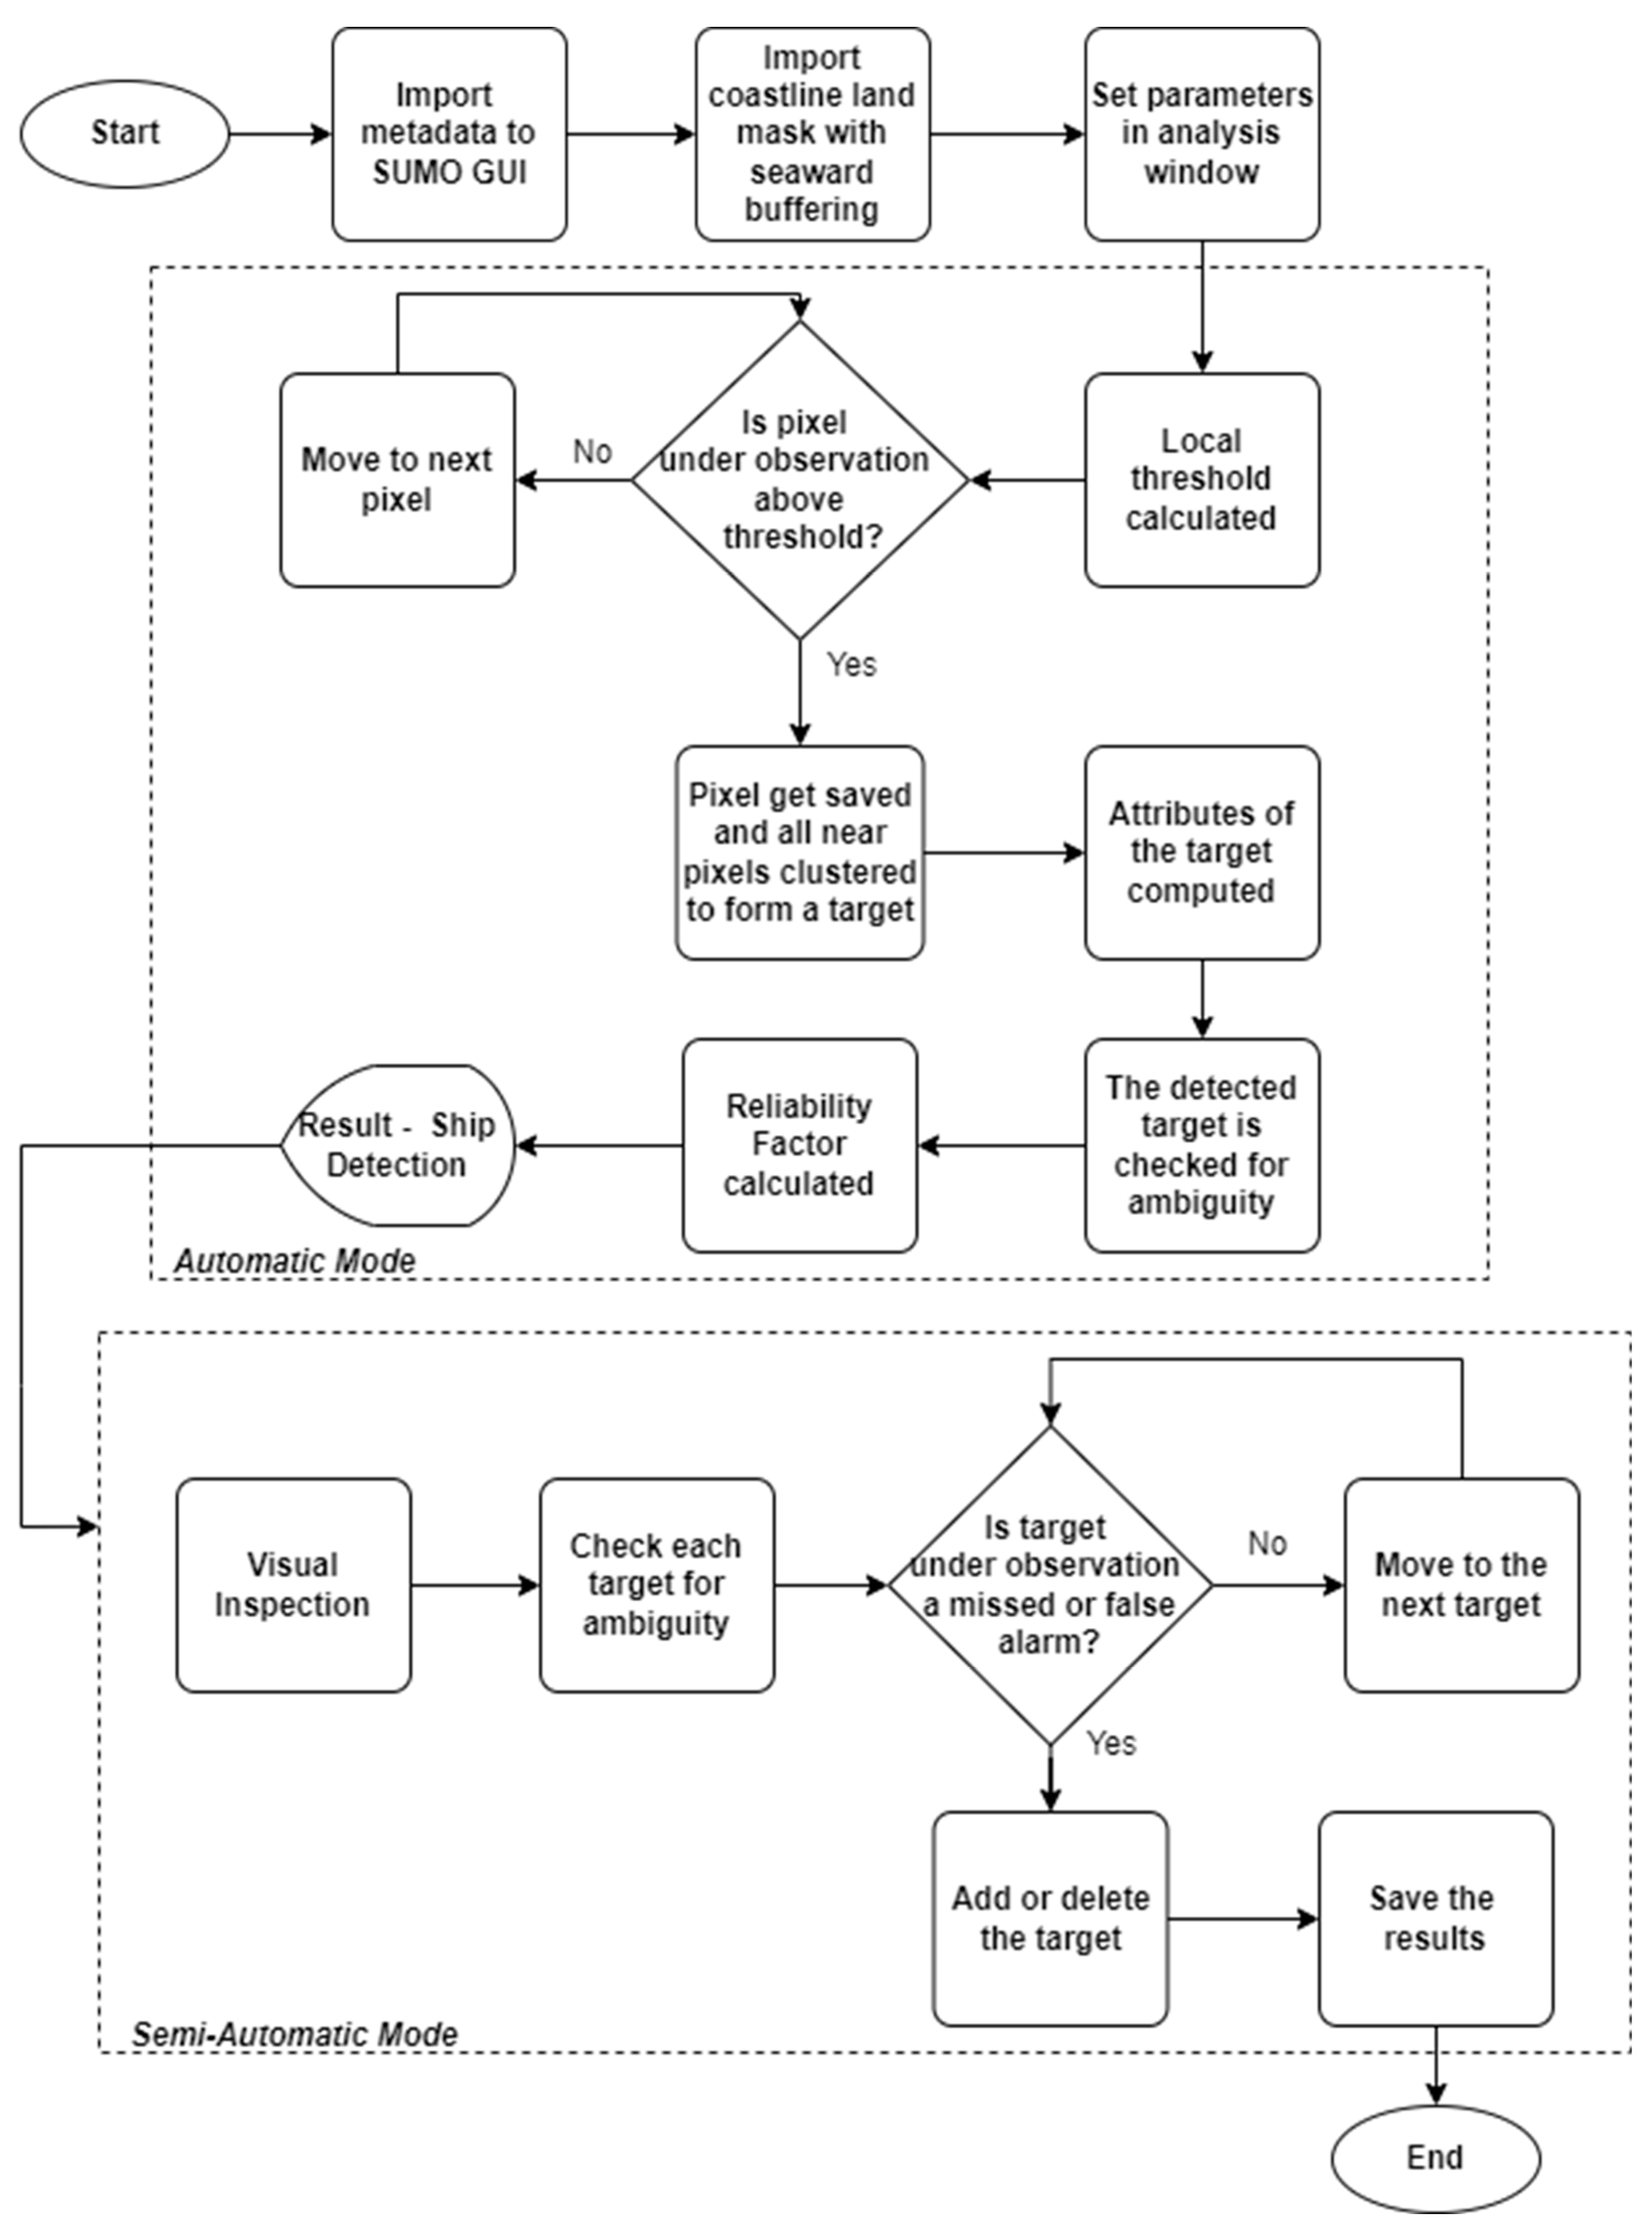
- Pre-Screening: Adaptive thresholding is a popular approach used for the prescreening process. It is applied to moving windows and, depending on each pixel under test, a new threshold is calculated based on the statistical characteristics of its local background. If the pixel under evaluation is higher than a certain threshold, it is considered an acceptable target [33]. SNAP’s CFAR algorithm for ocean object detection aids in the quick detection of ships. The user defines the parameters of the moving window. Each pixel being examined is divided into three panels. As illustrated in Figure 5, they are, from the outer to the inner layer, the background window, guard window, and target window.
- 3.
- Discrimination: The object discrimination operator performs the discrimination process. It assists in removing false target detection based on target dimensions. First, all contiguous detected pixels are combined into one cluster. Second, the width, as well as the length information of the clusters, are retrieved, followed by the exclusion of targets that do not fall within the detection limit, which helps to reduce false detection.
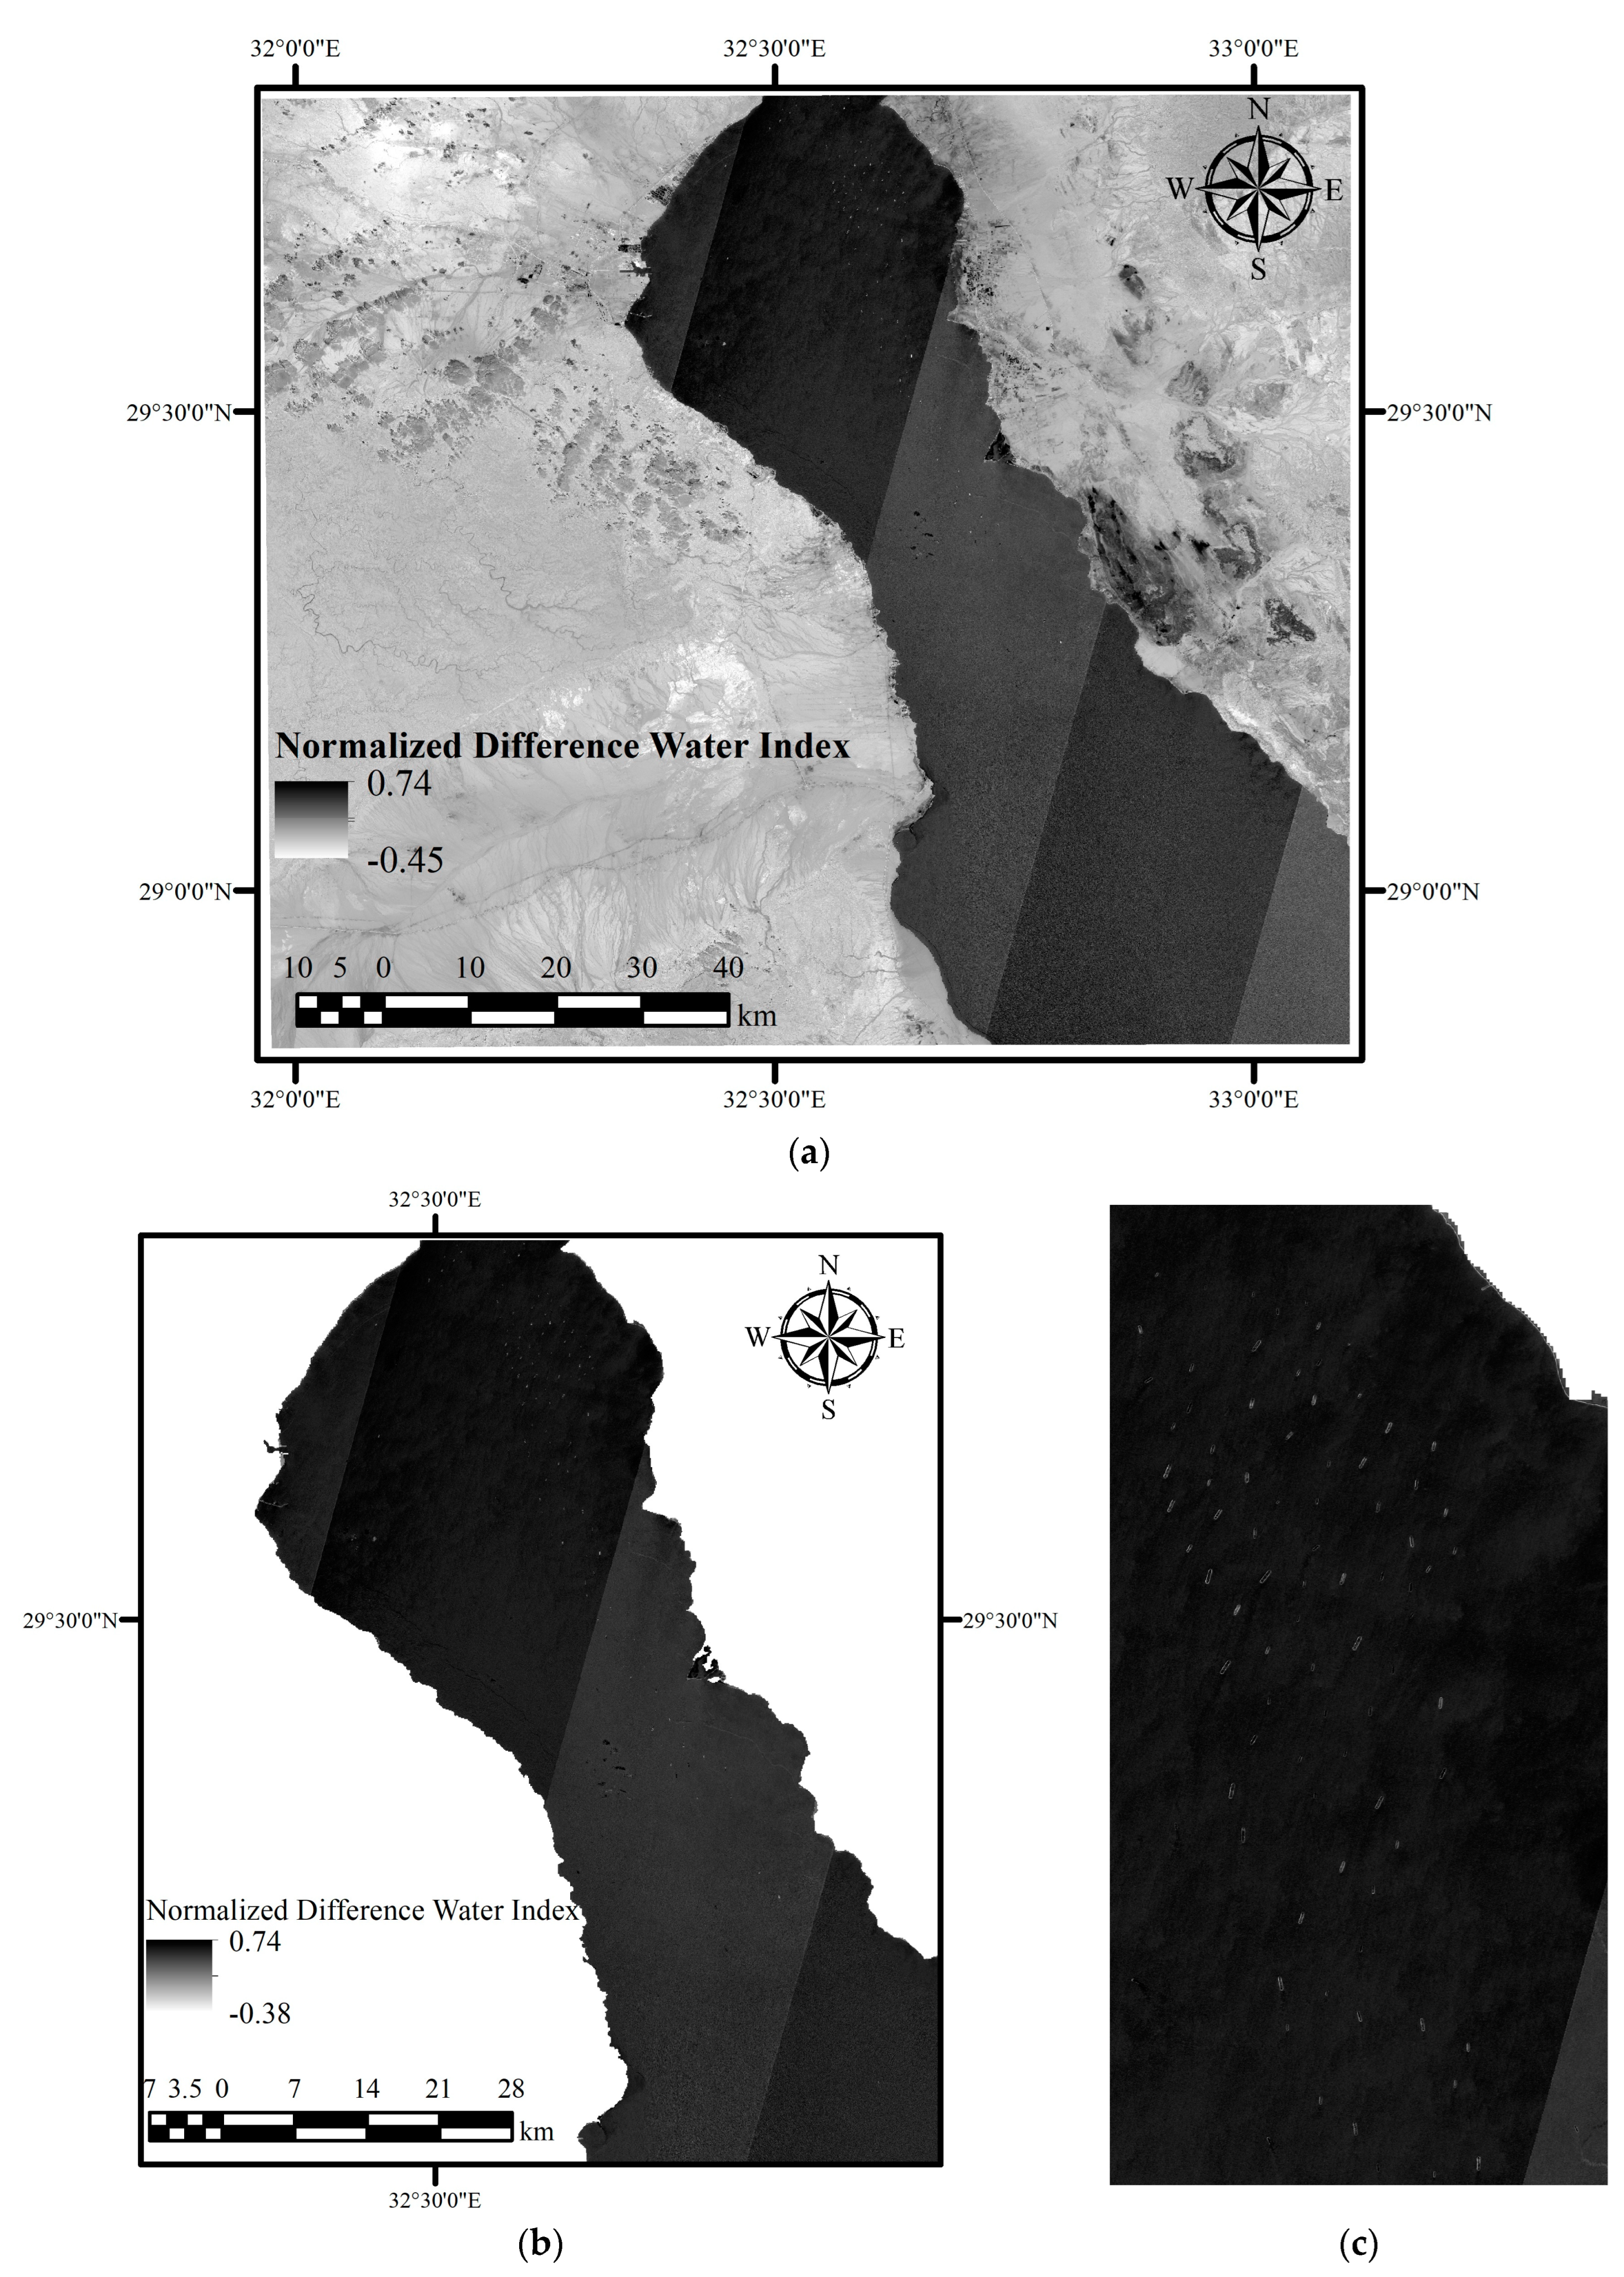
4.3. Ship Detection Using Sentinel-2 Dataset
5. Results and Discussion
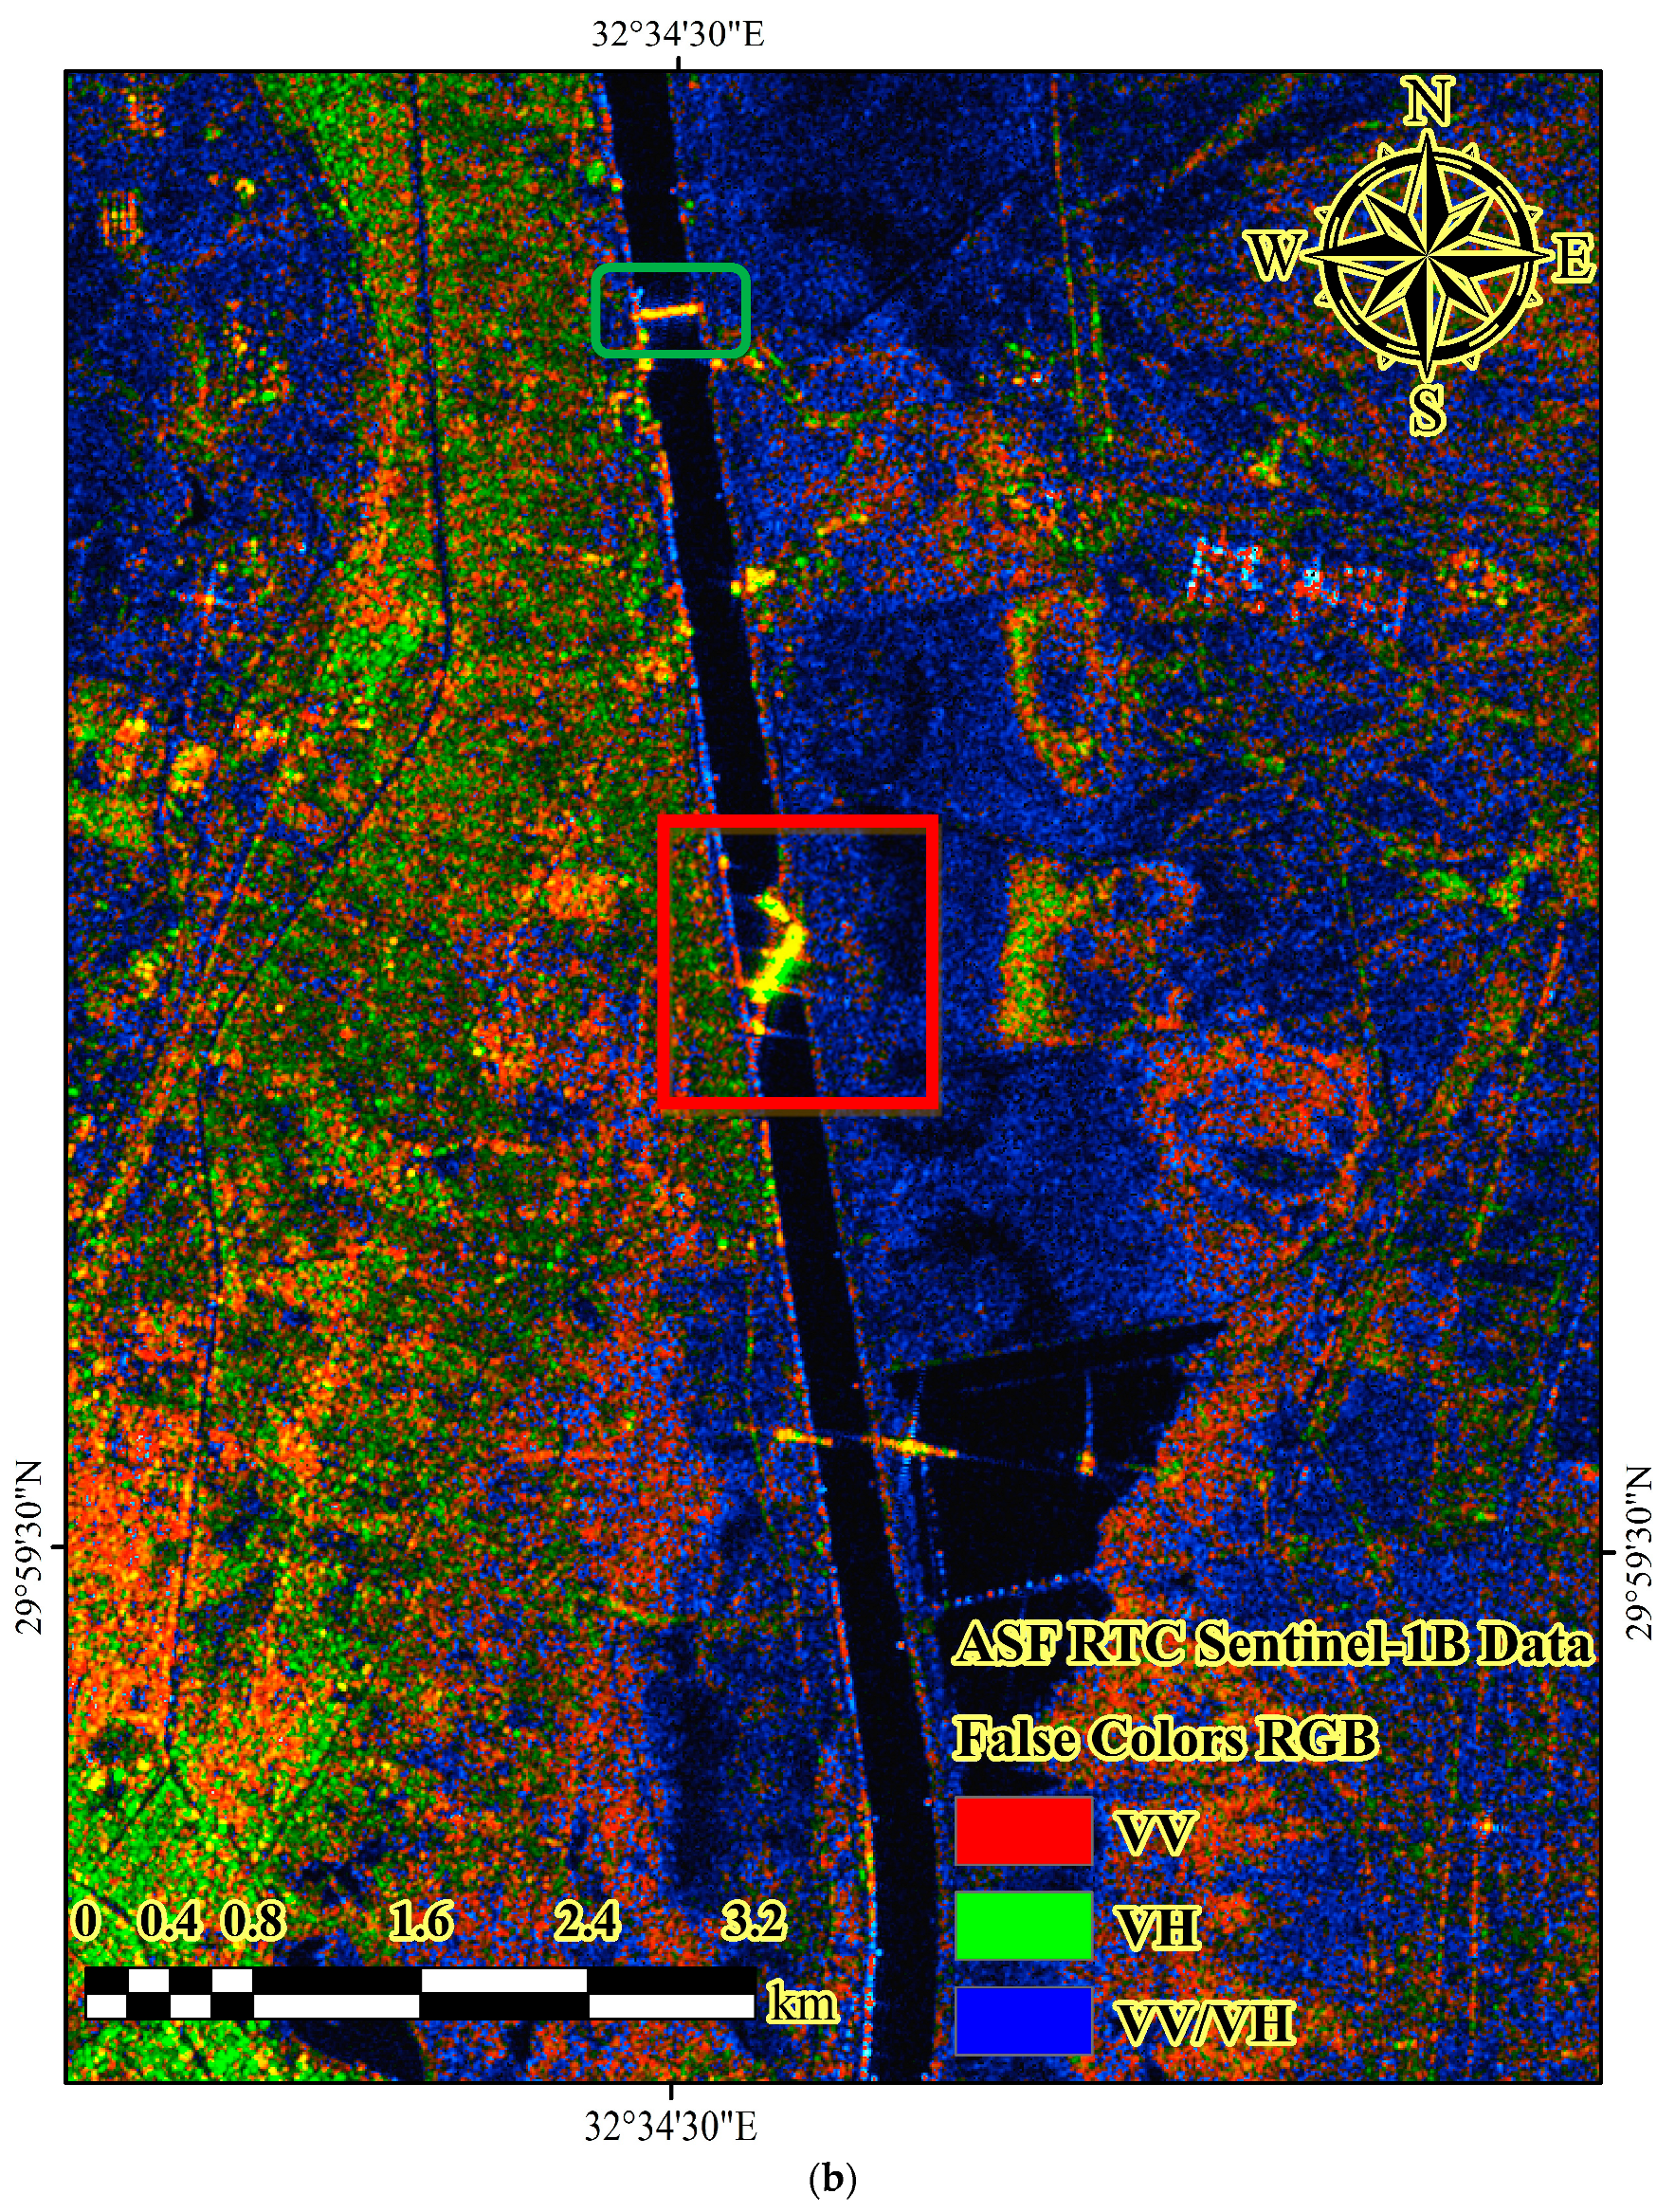
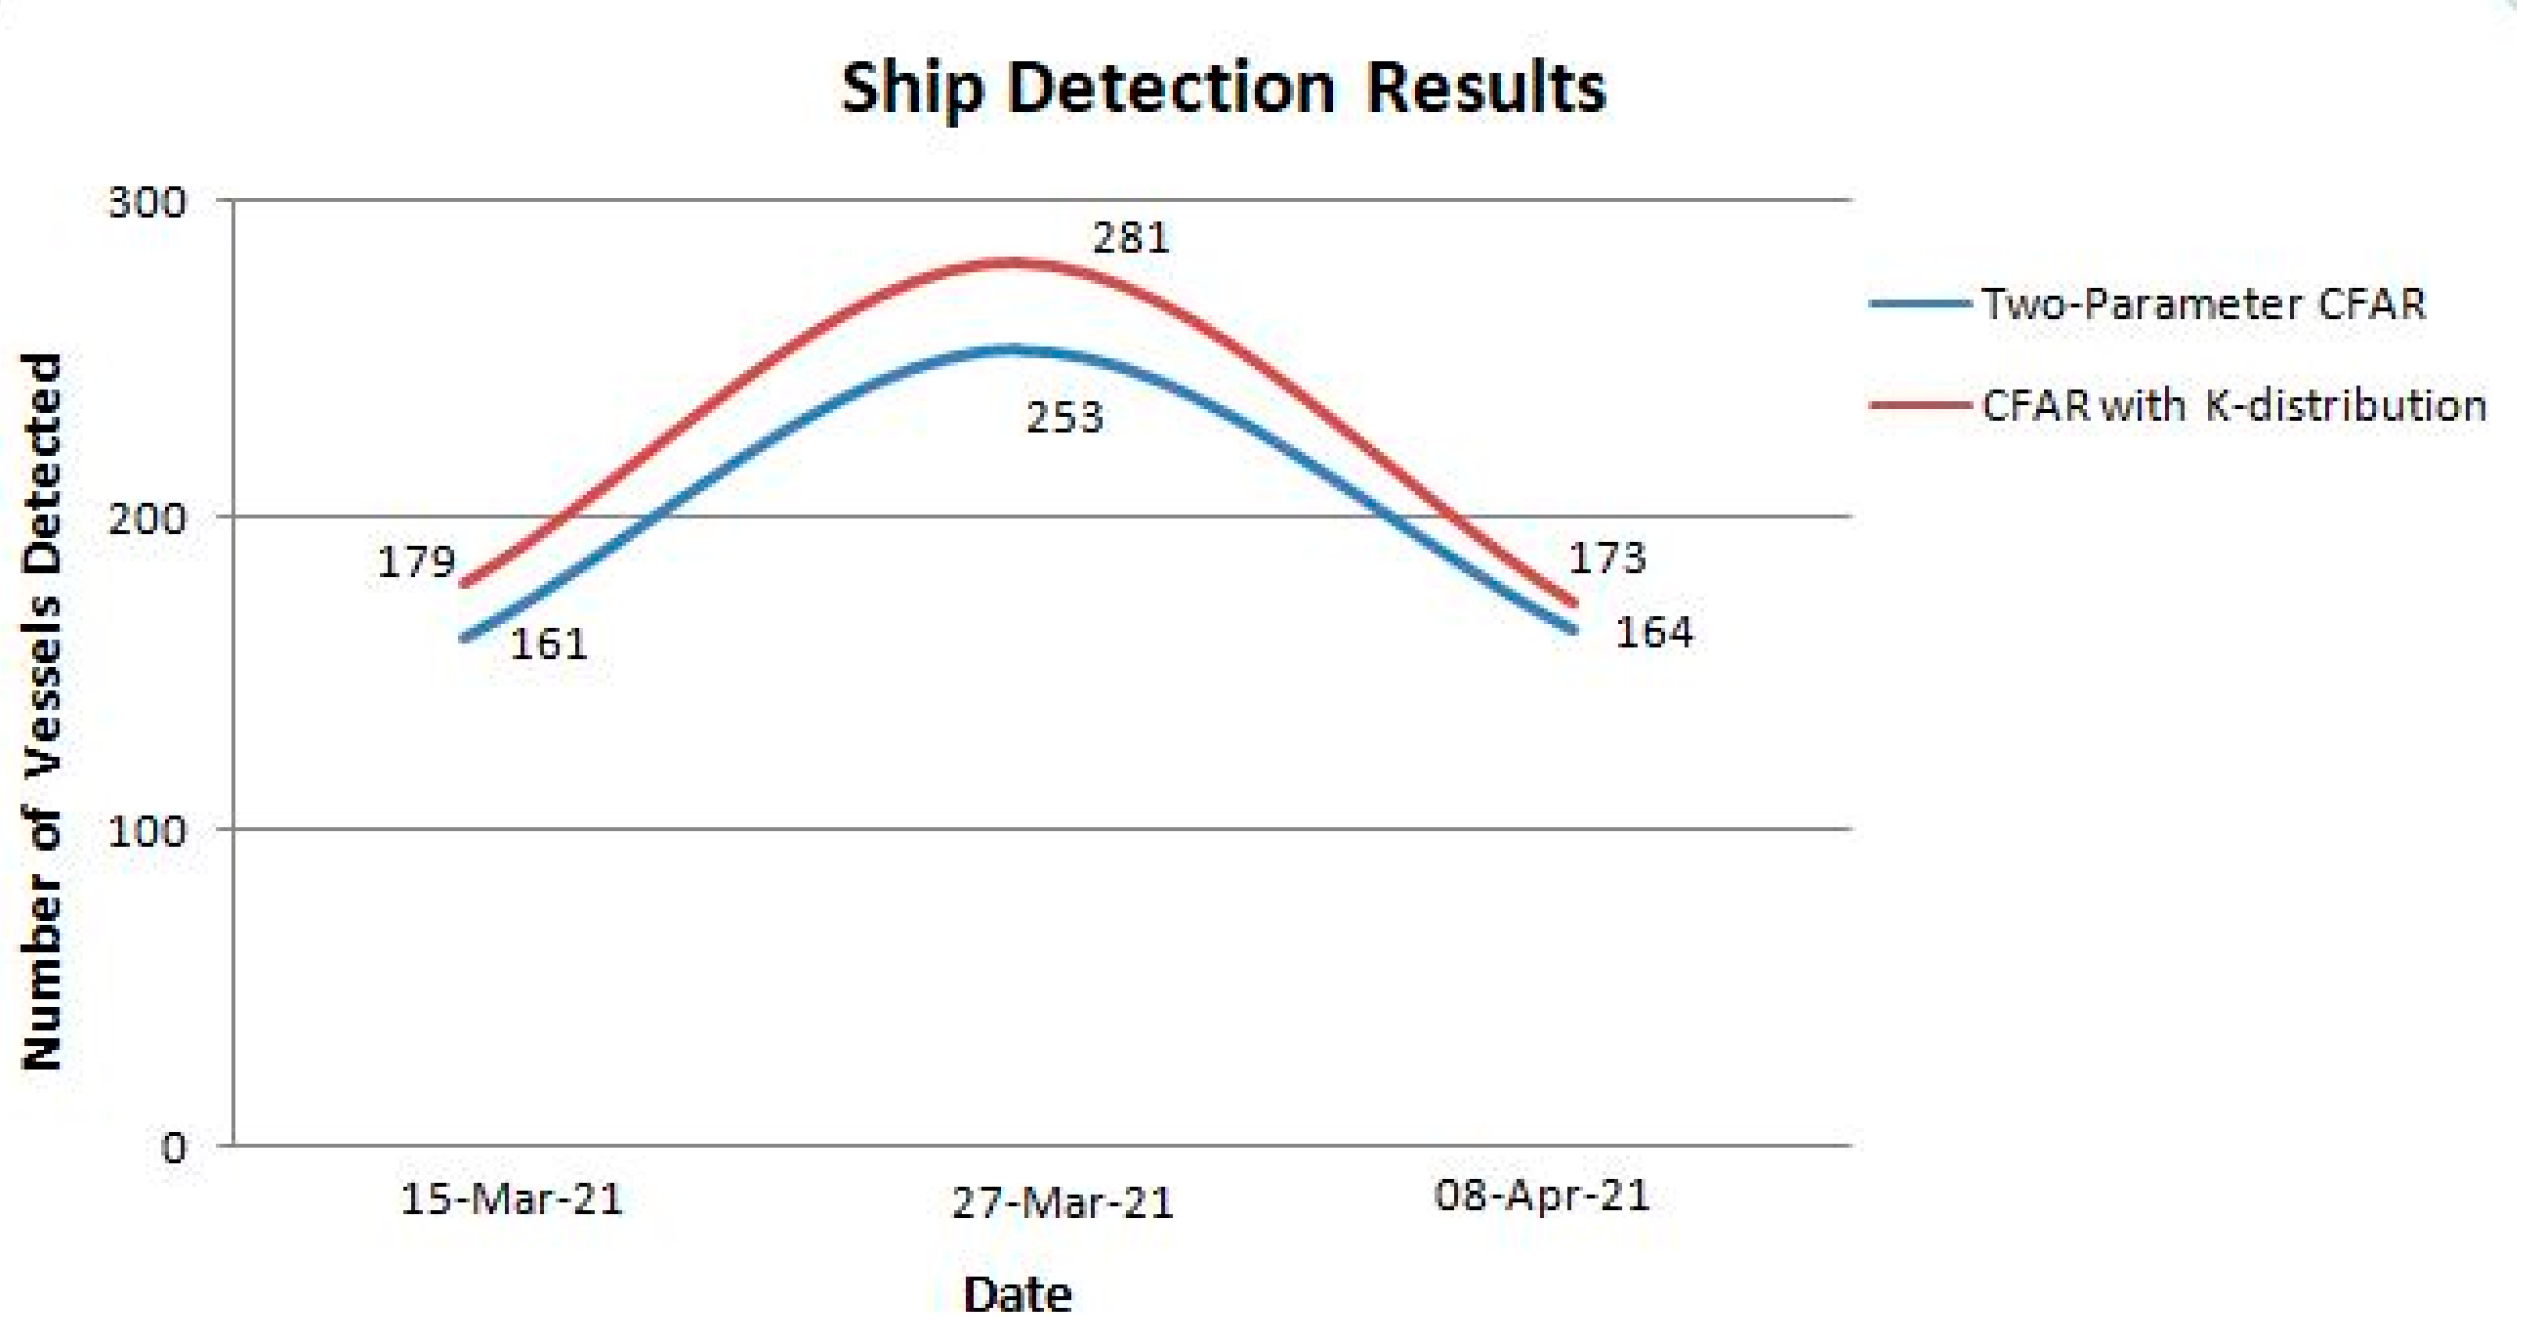
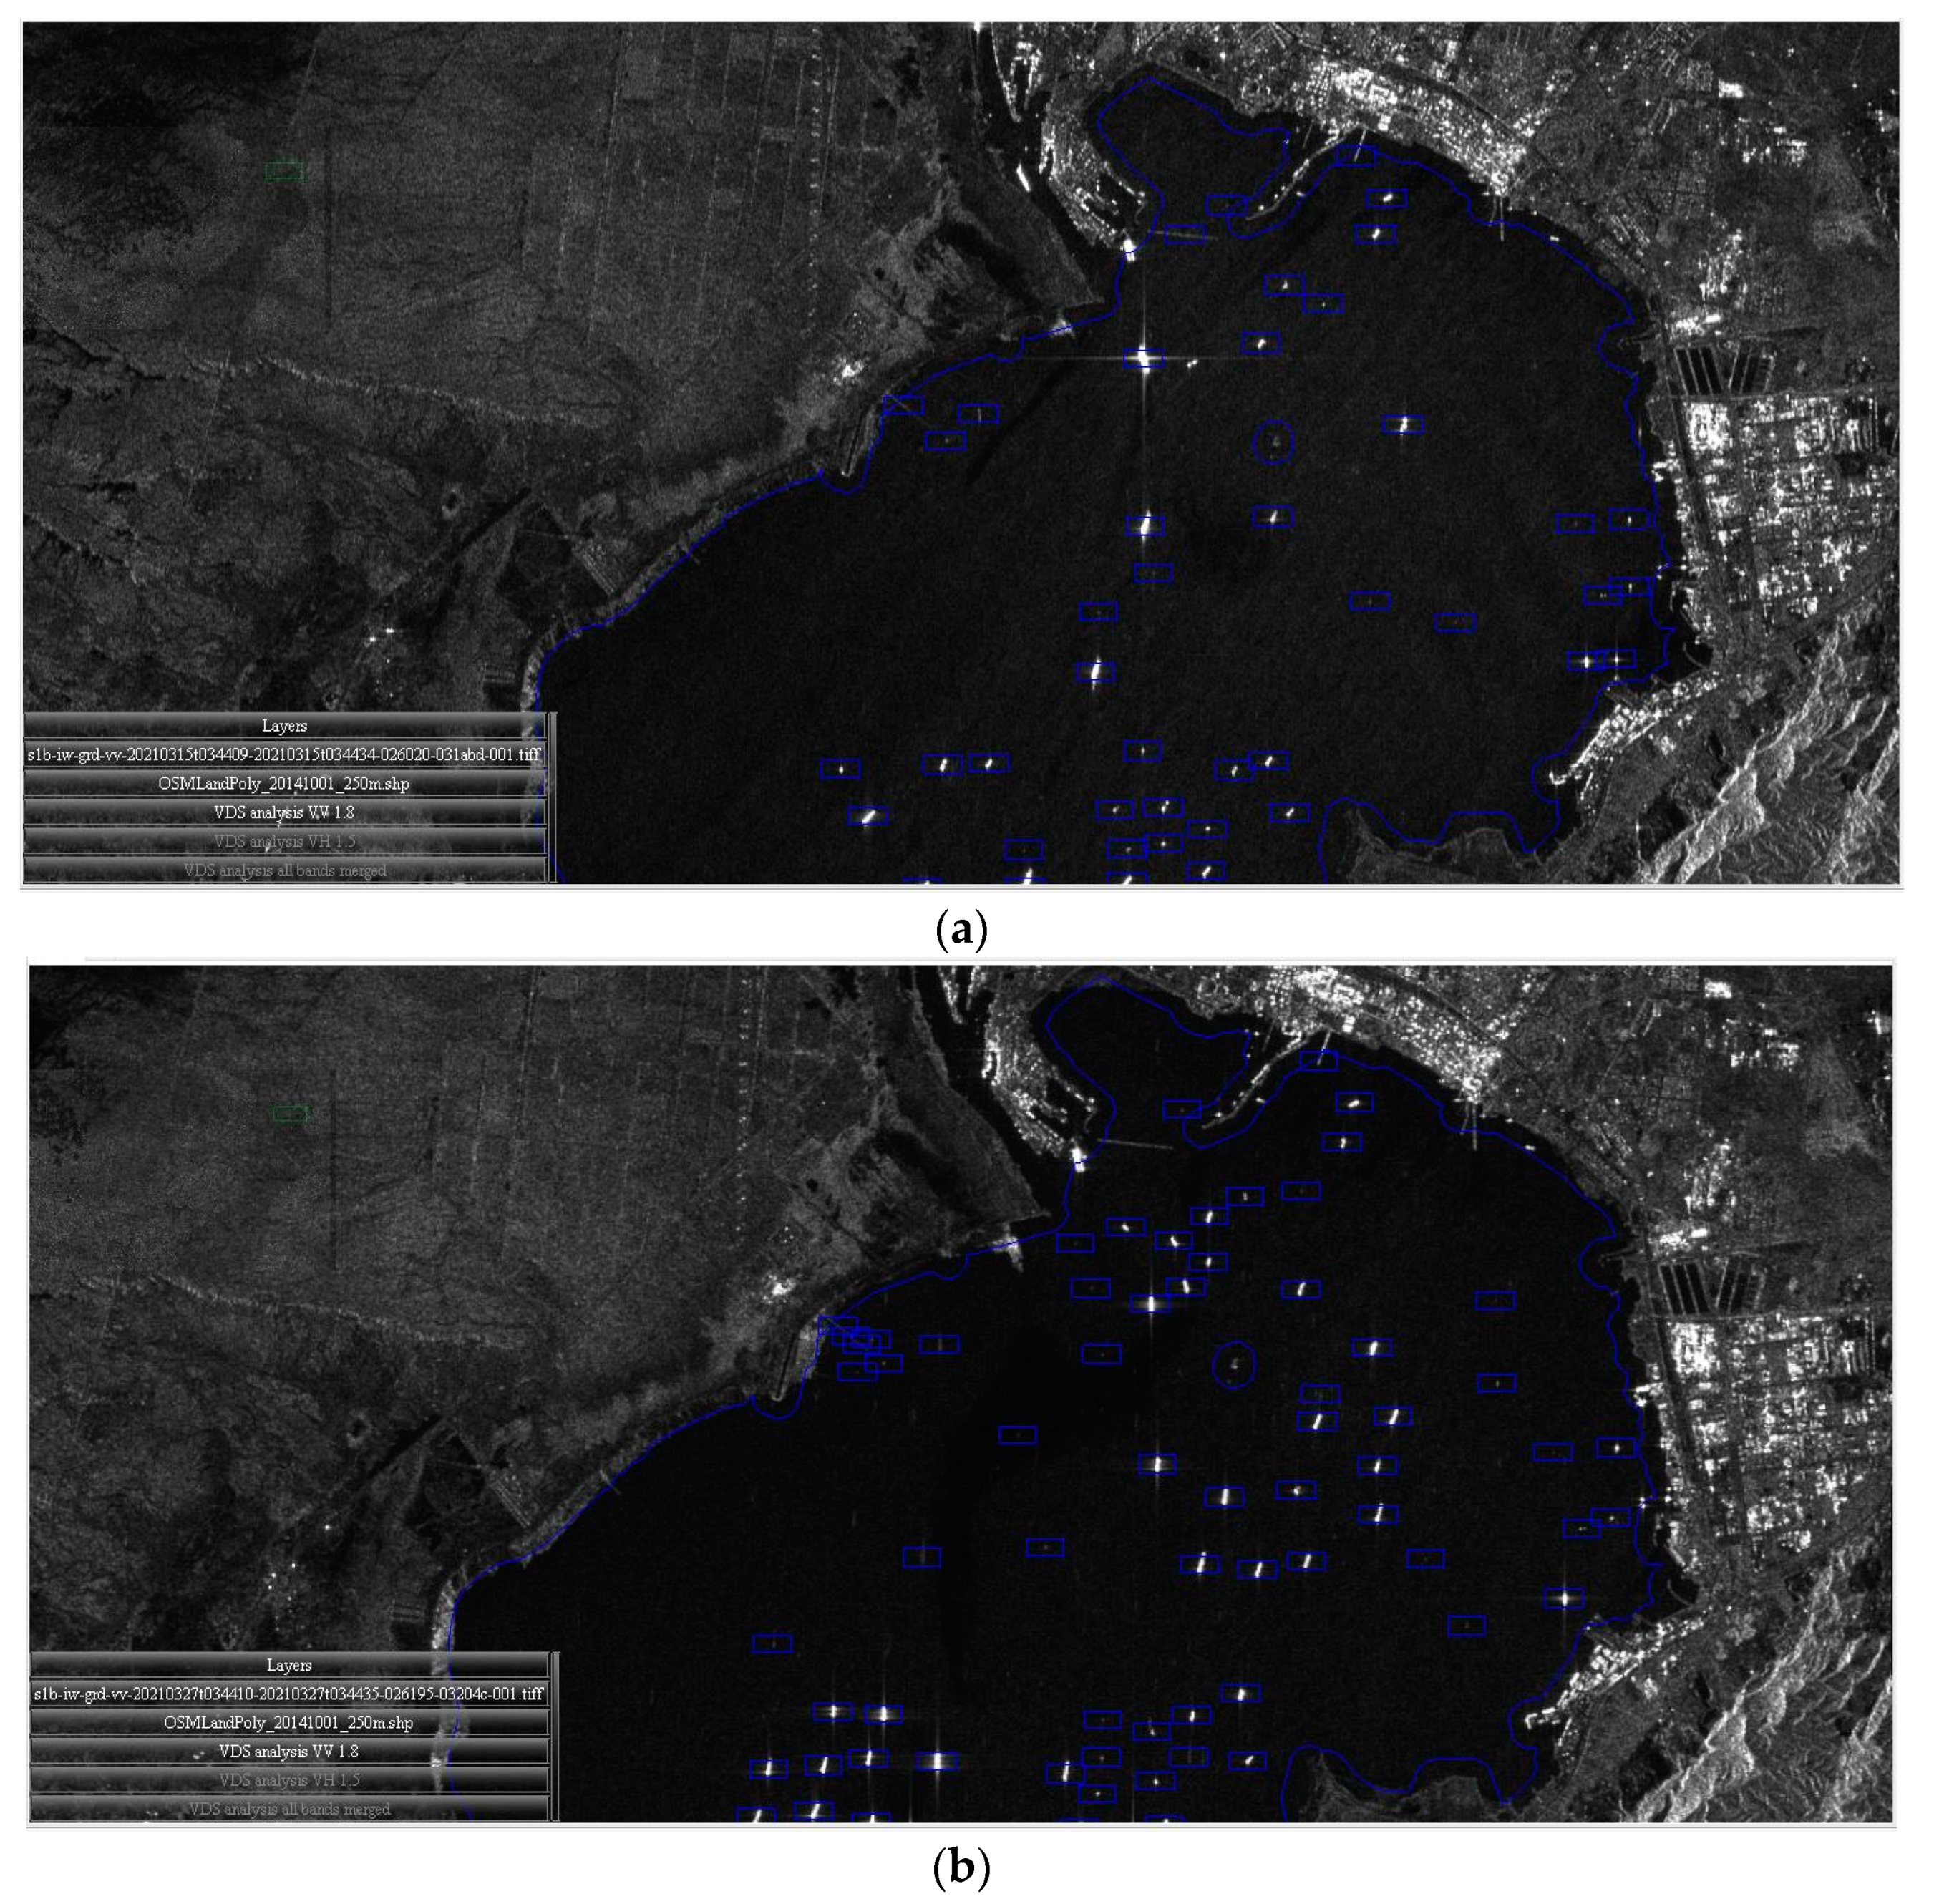
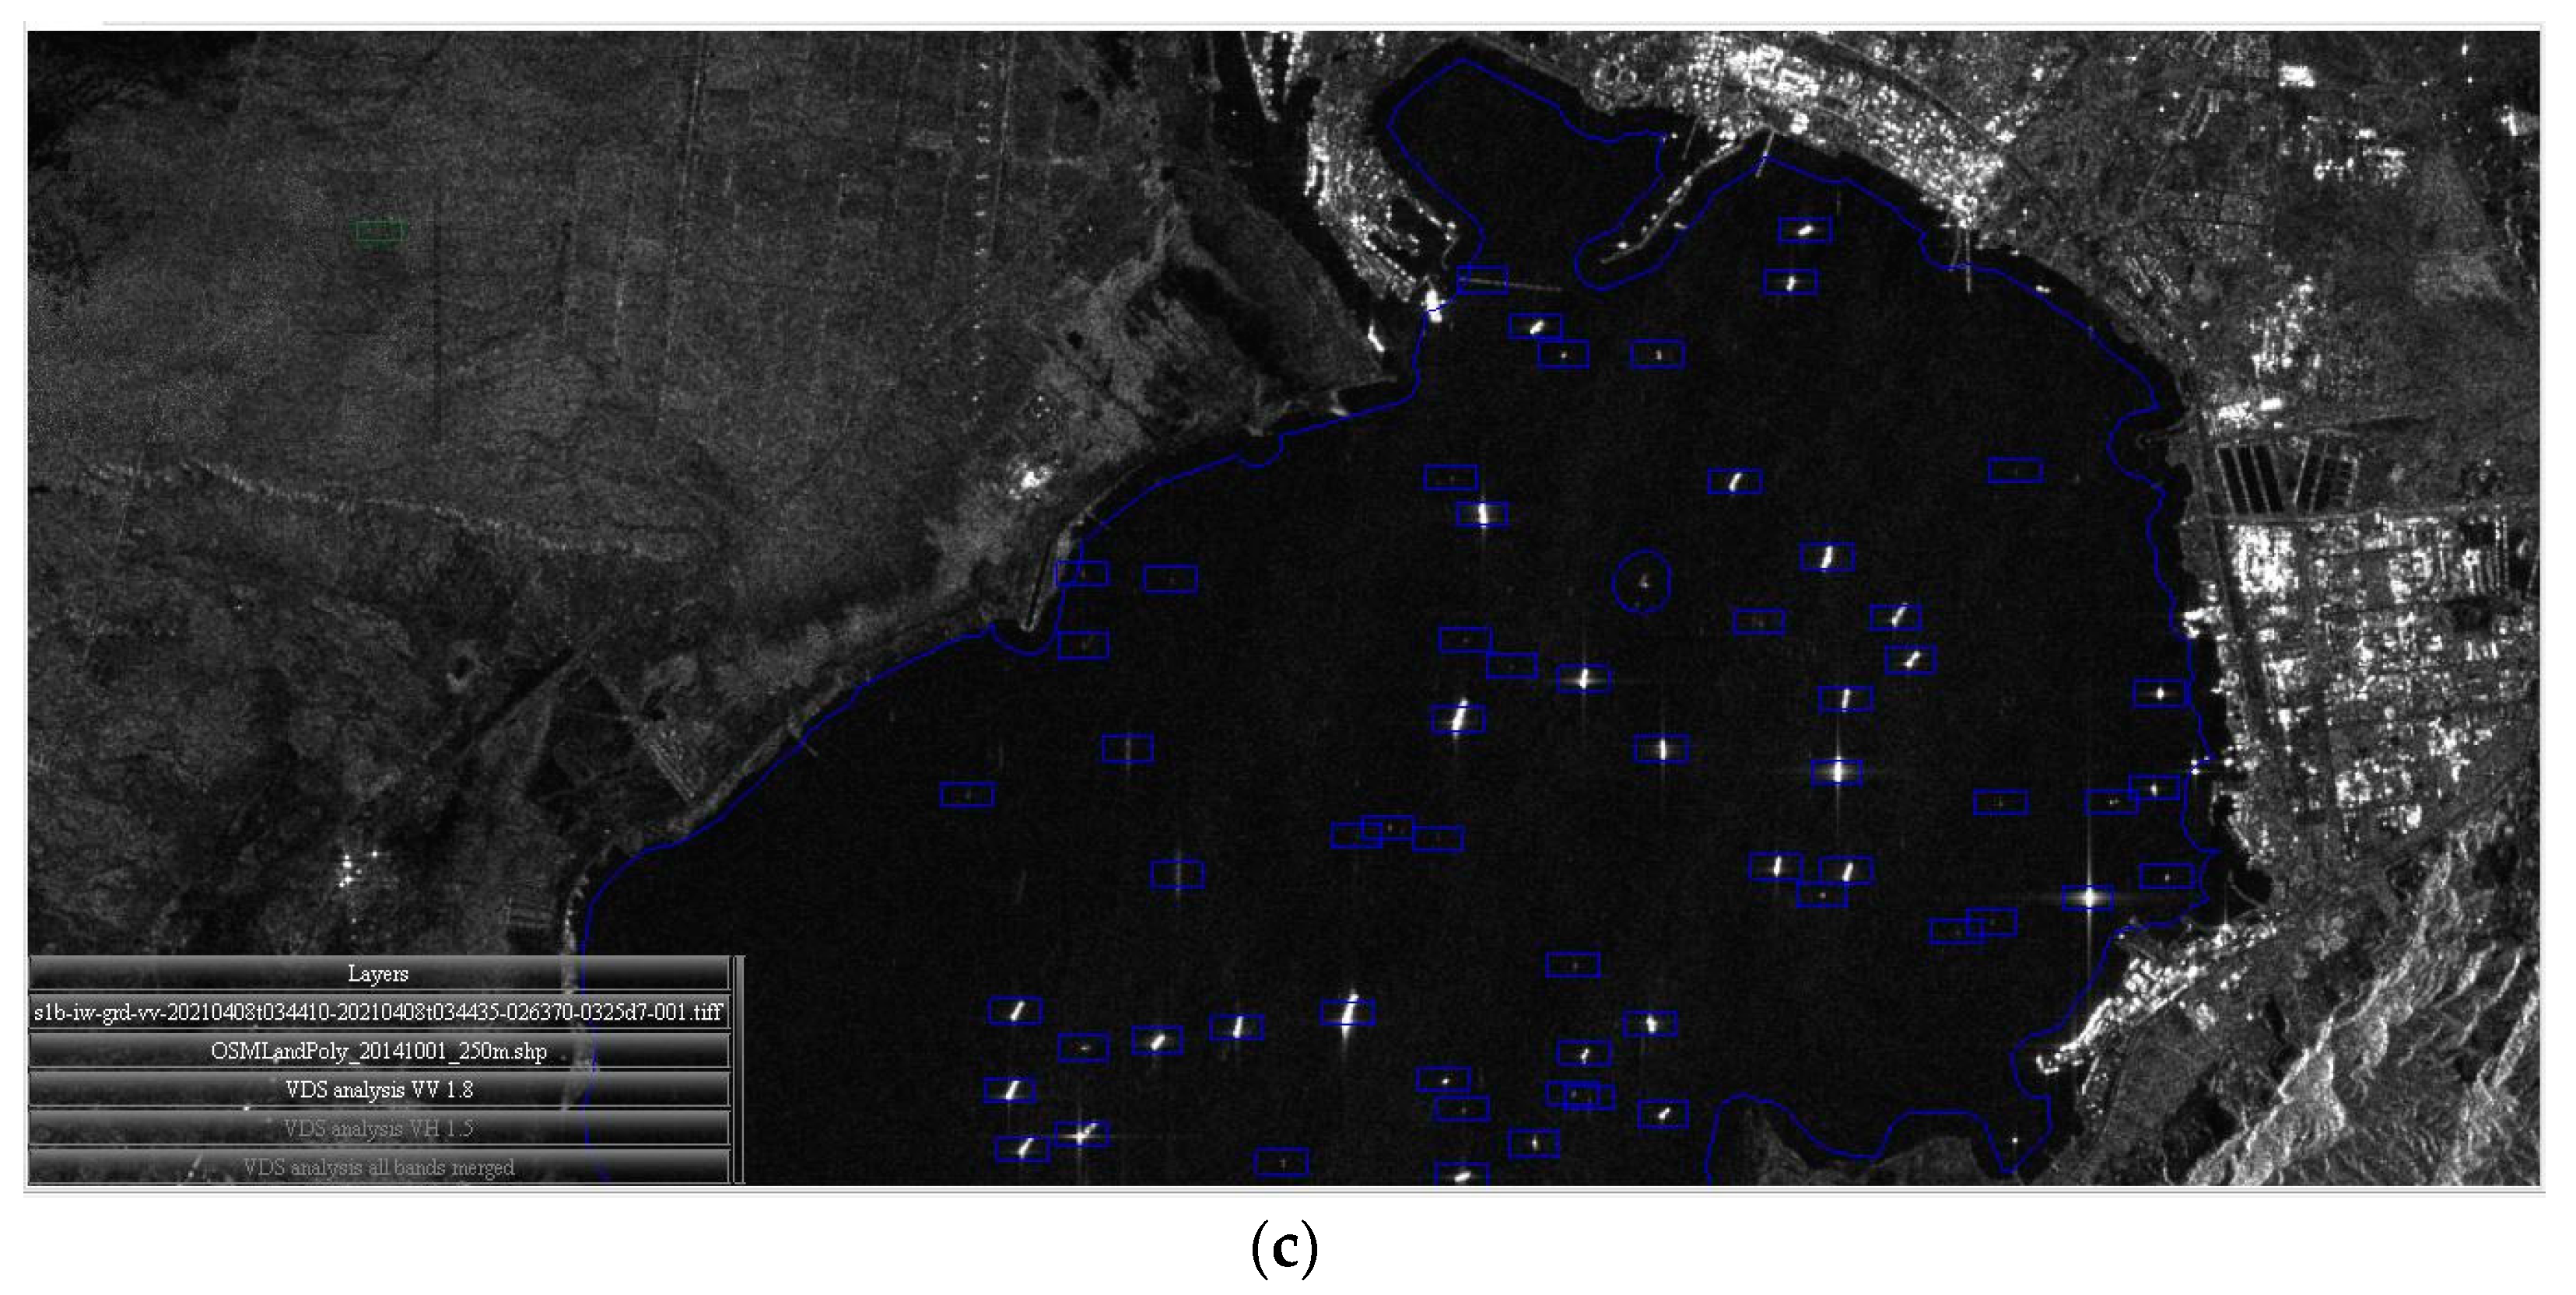
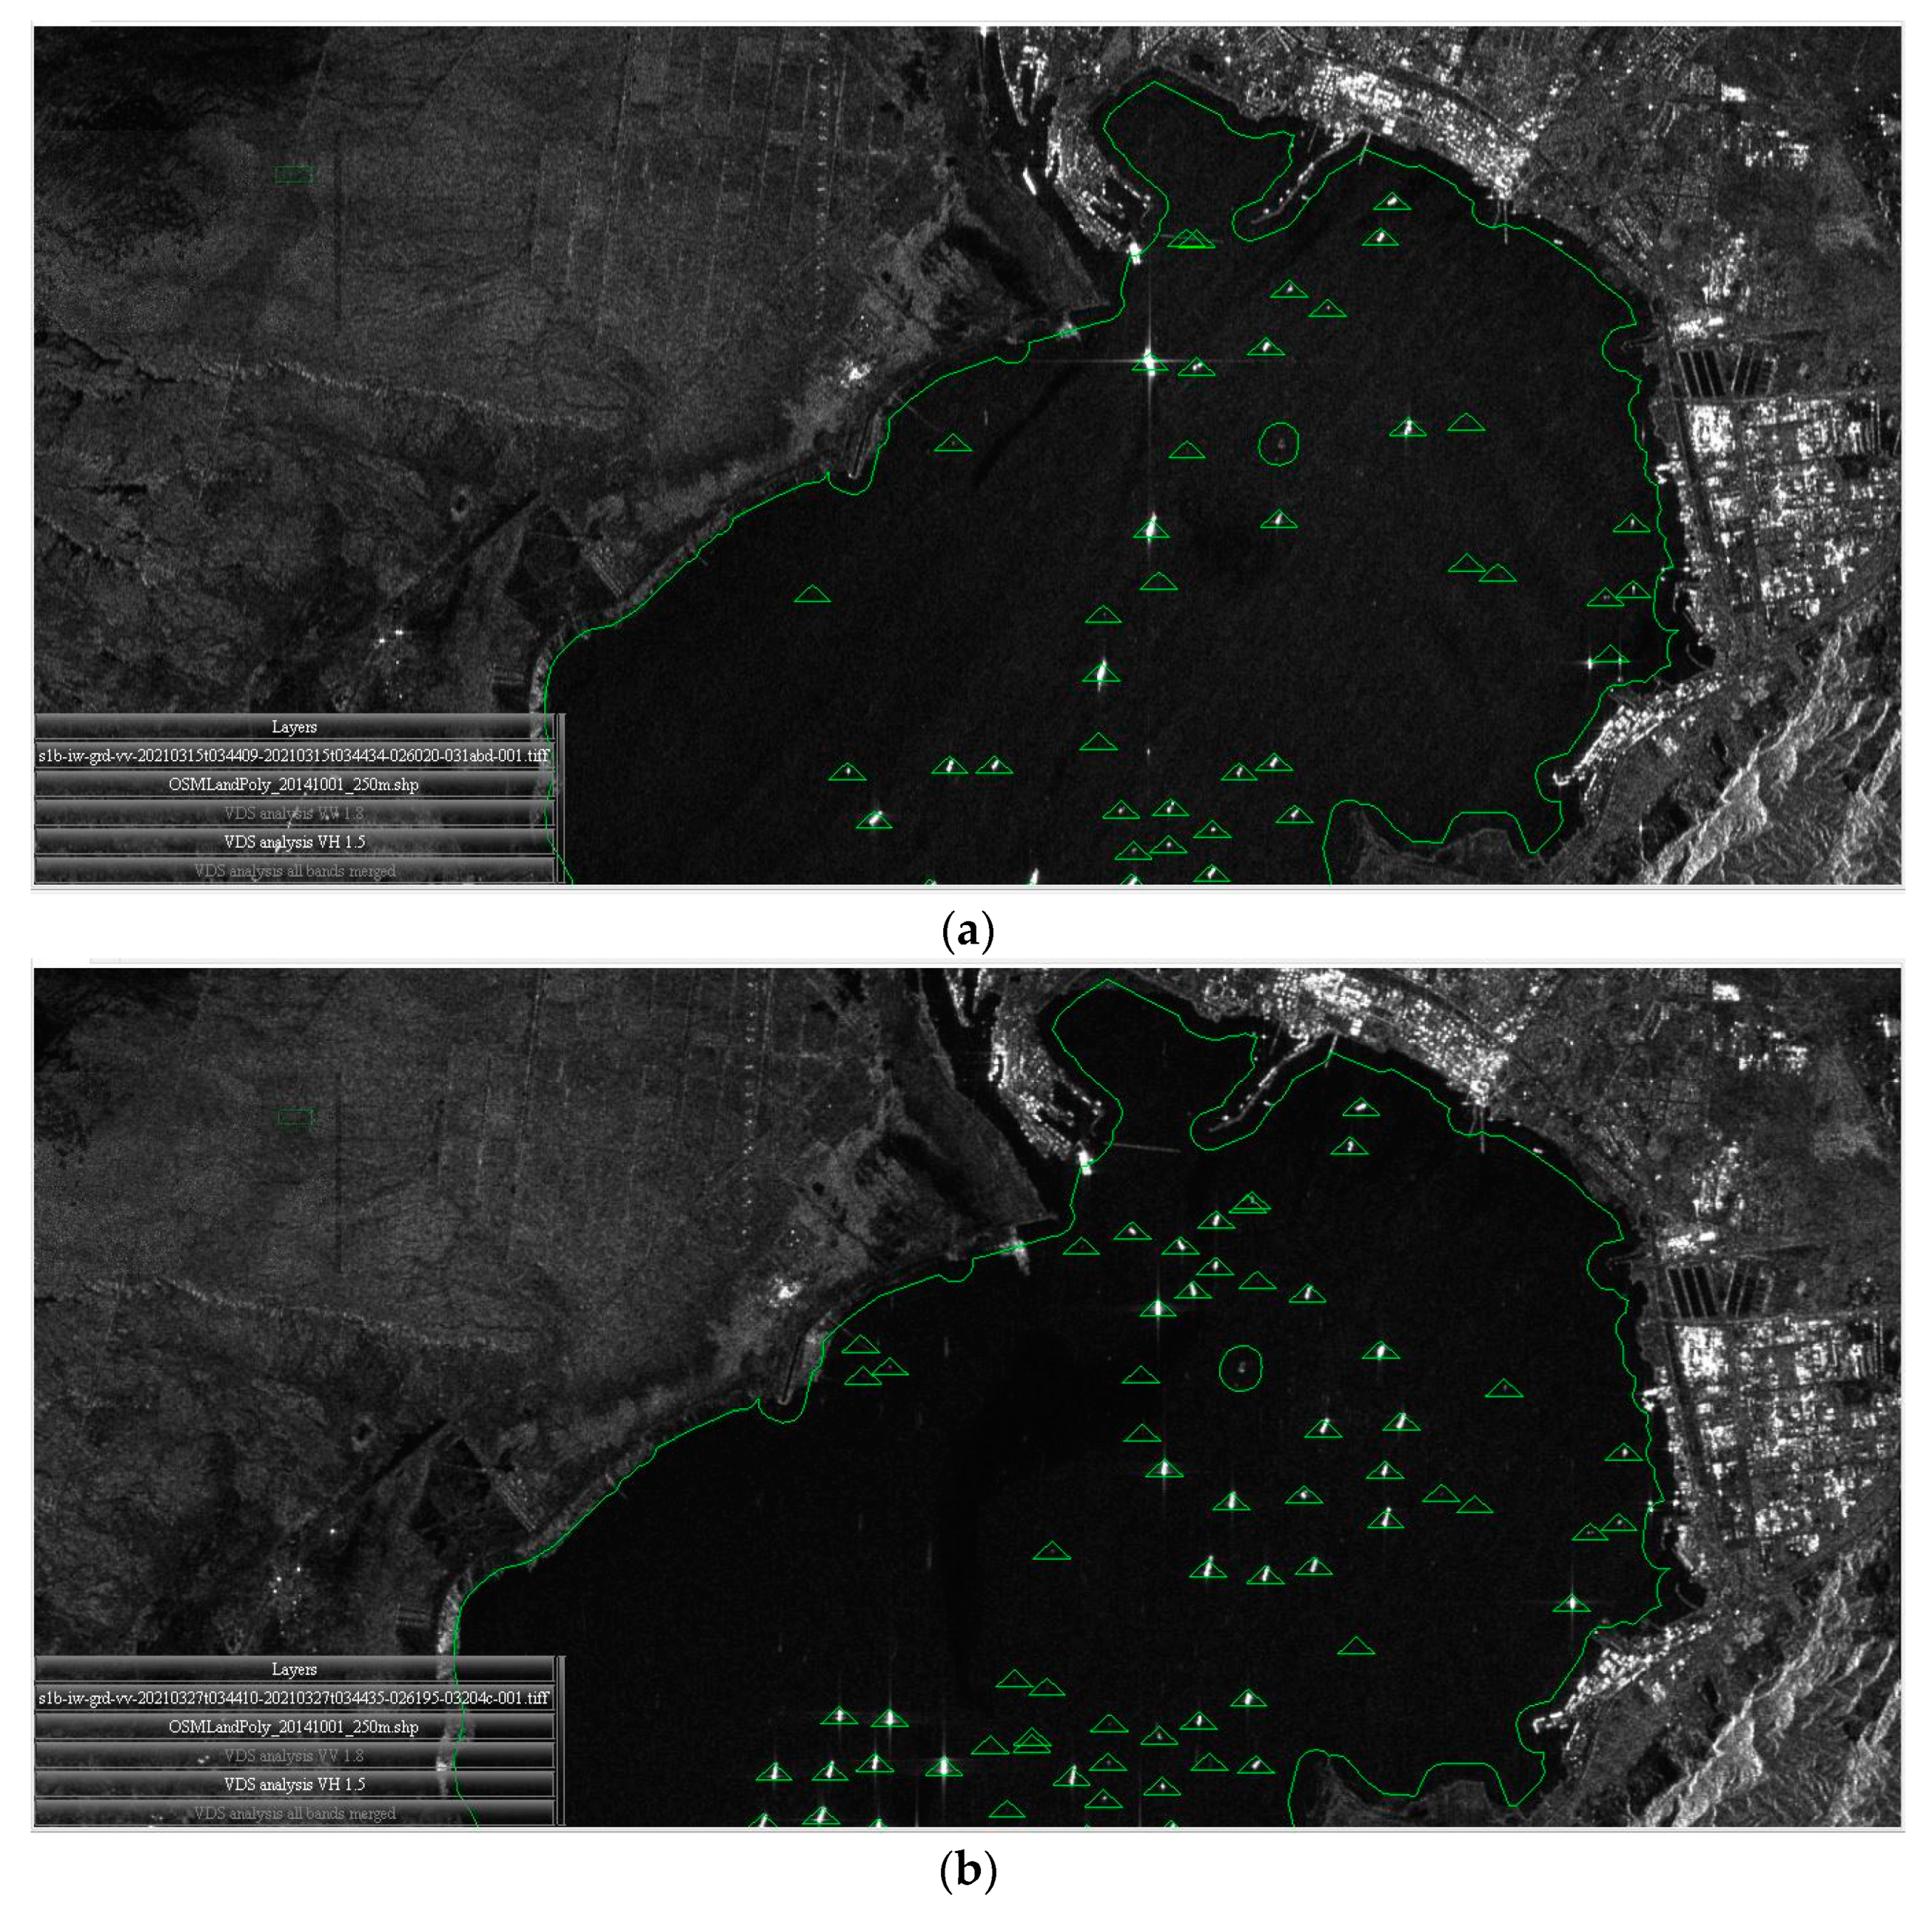
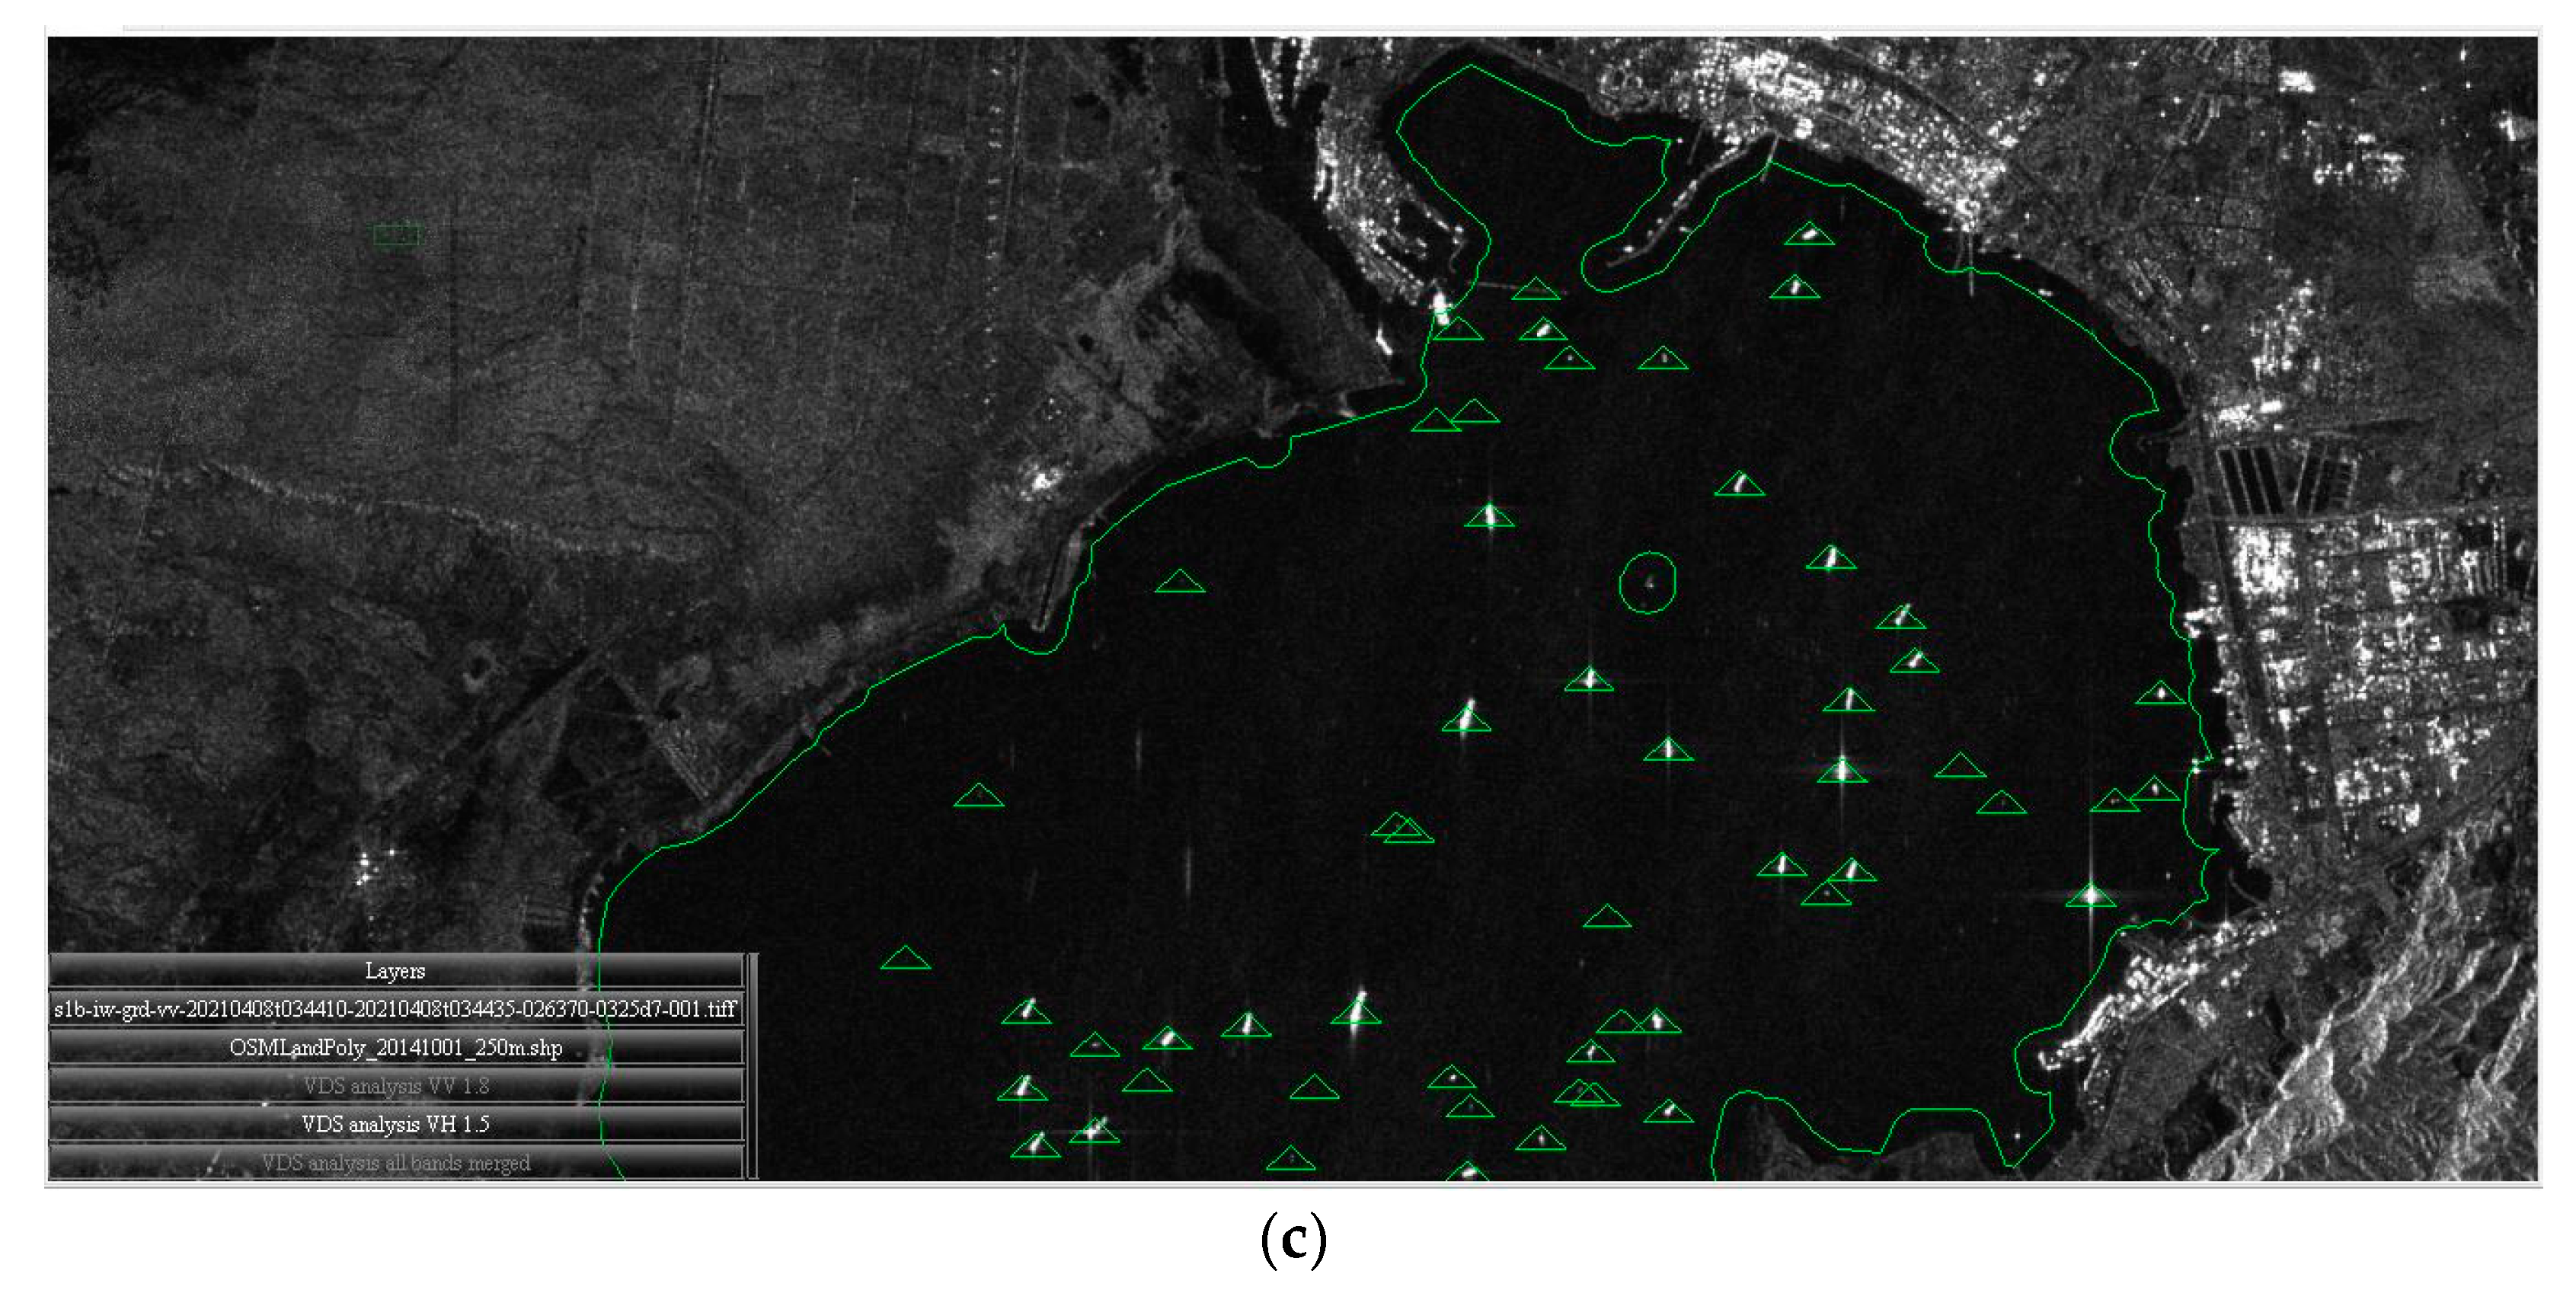
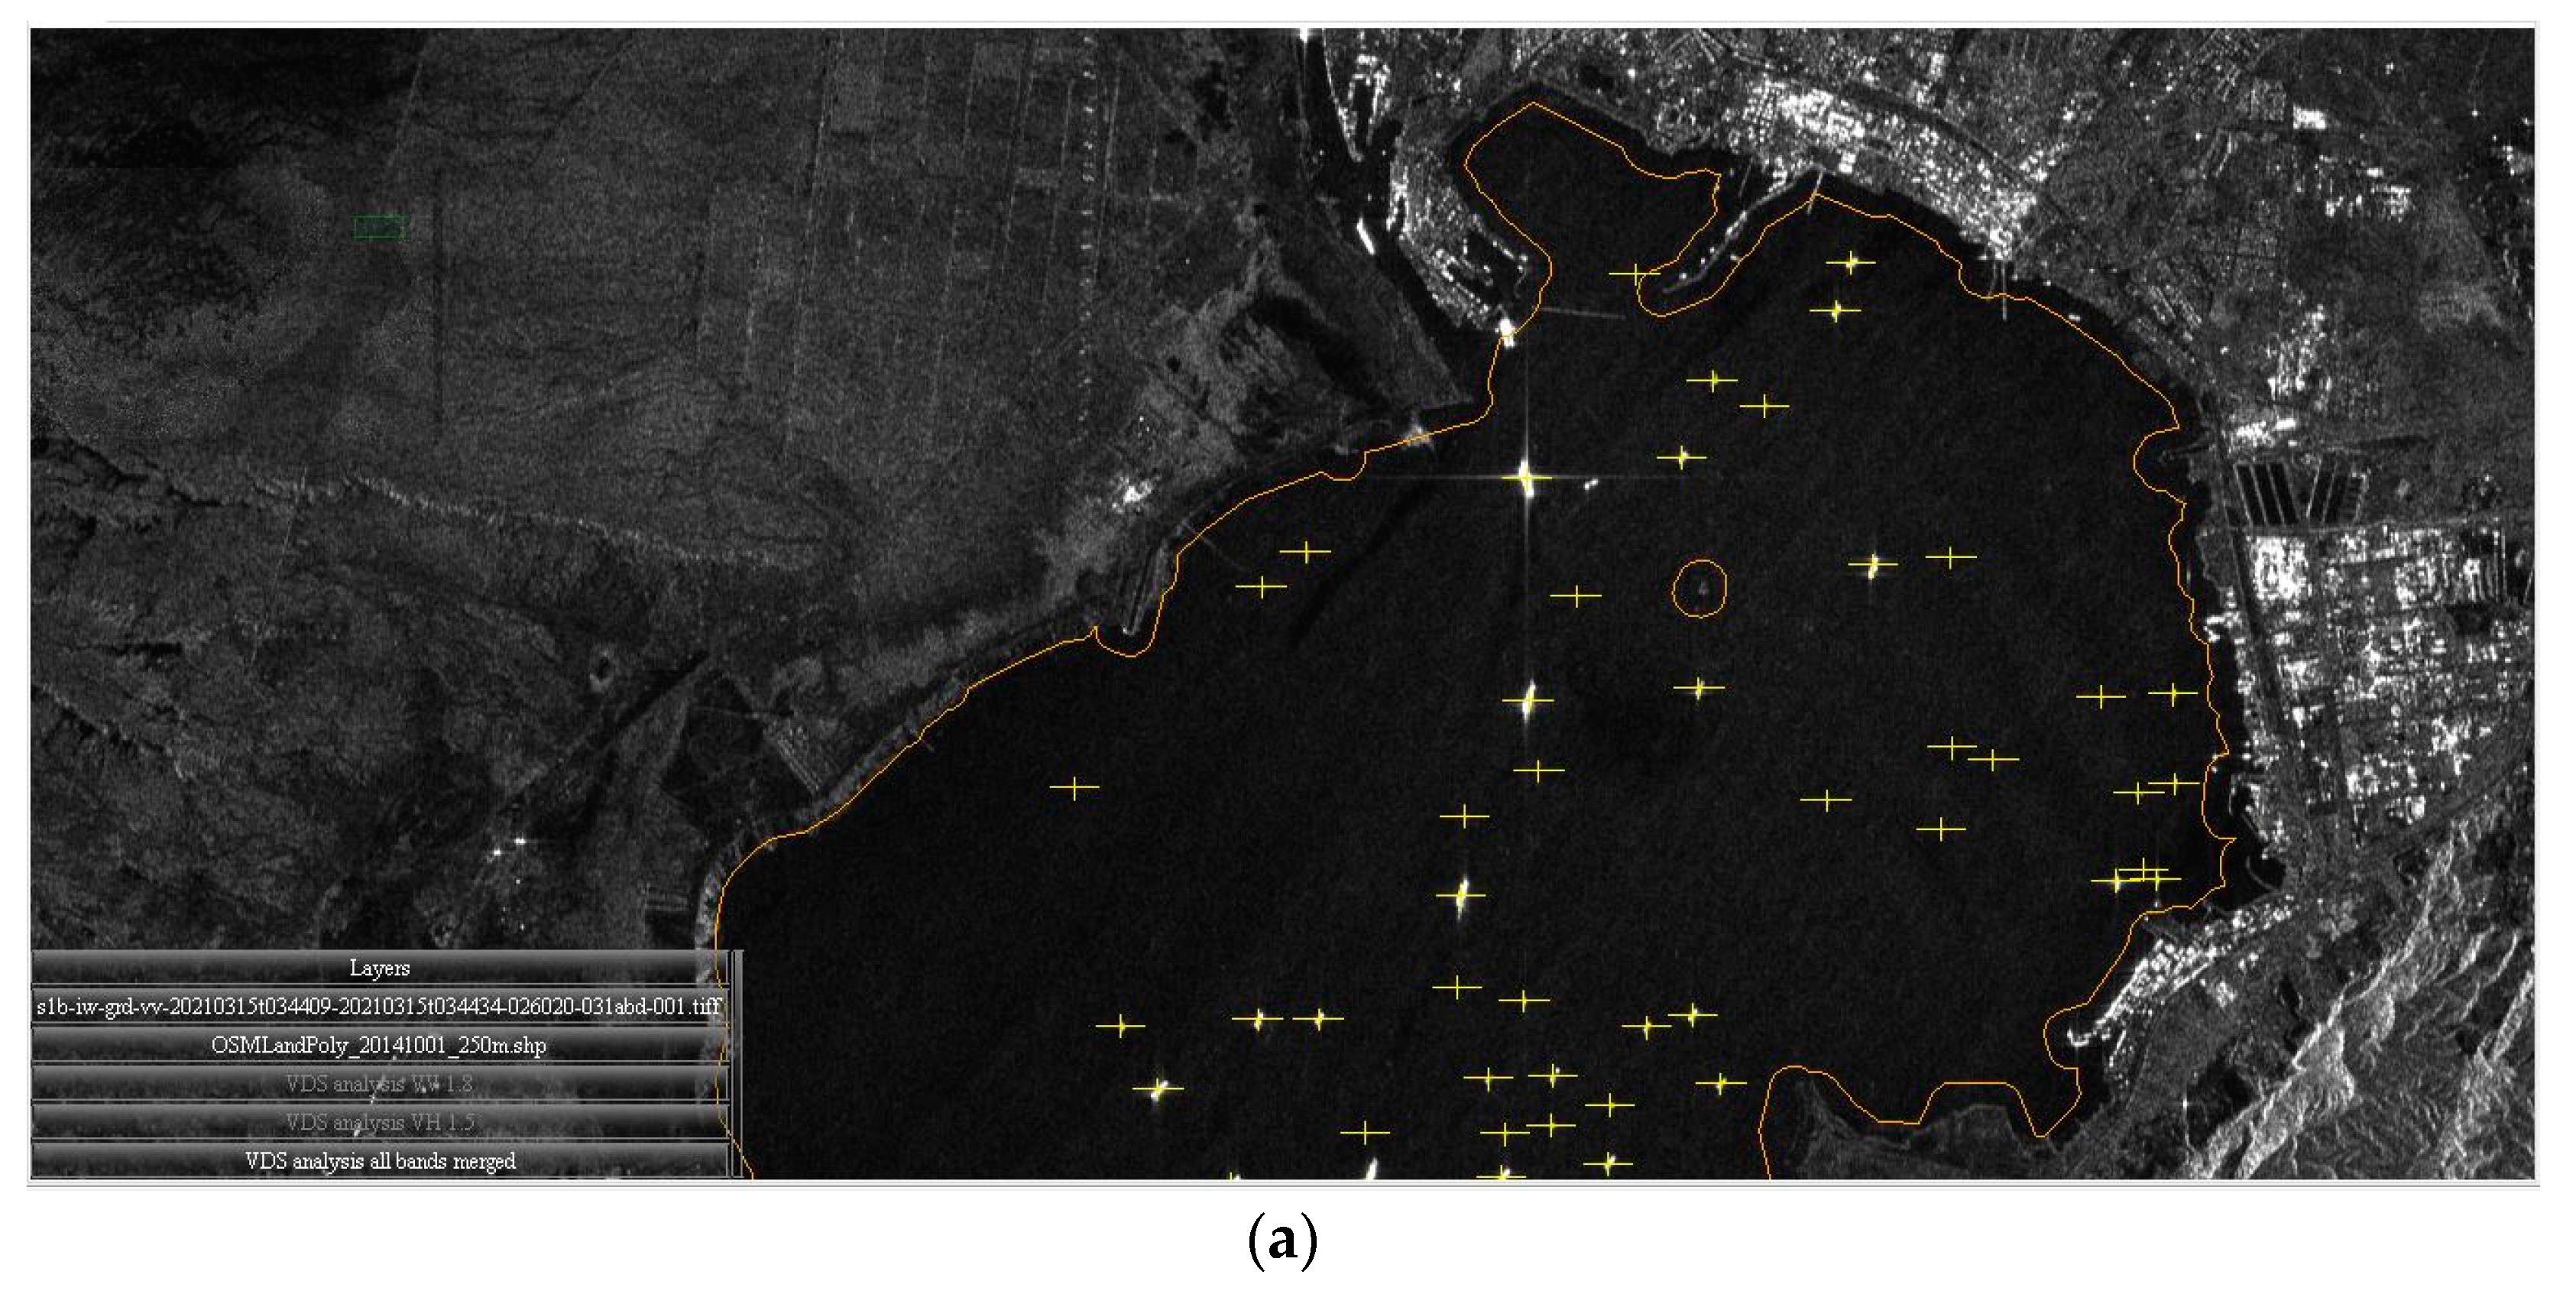
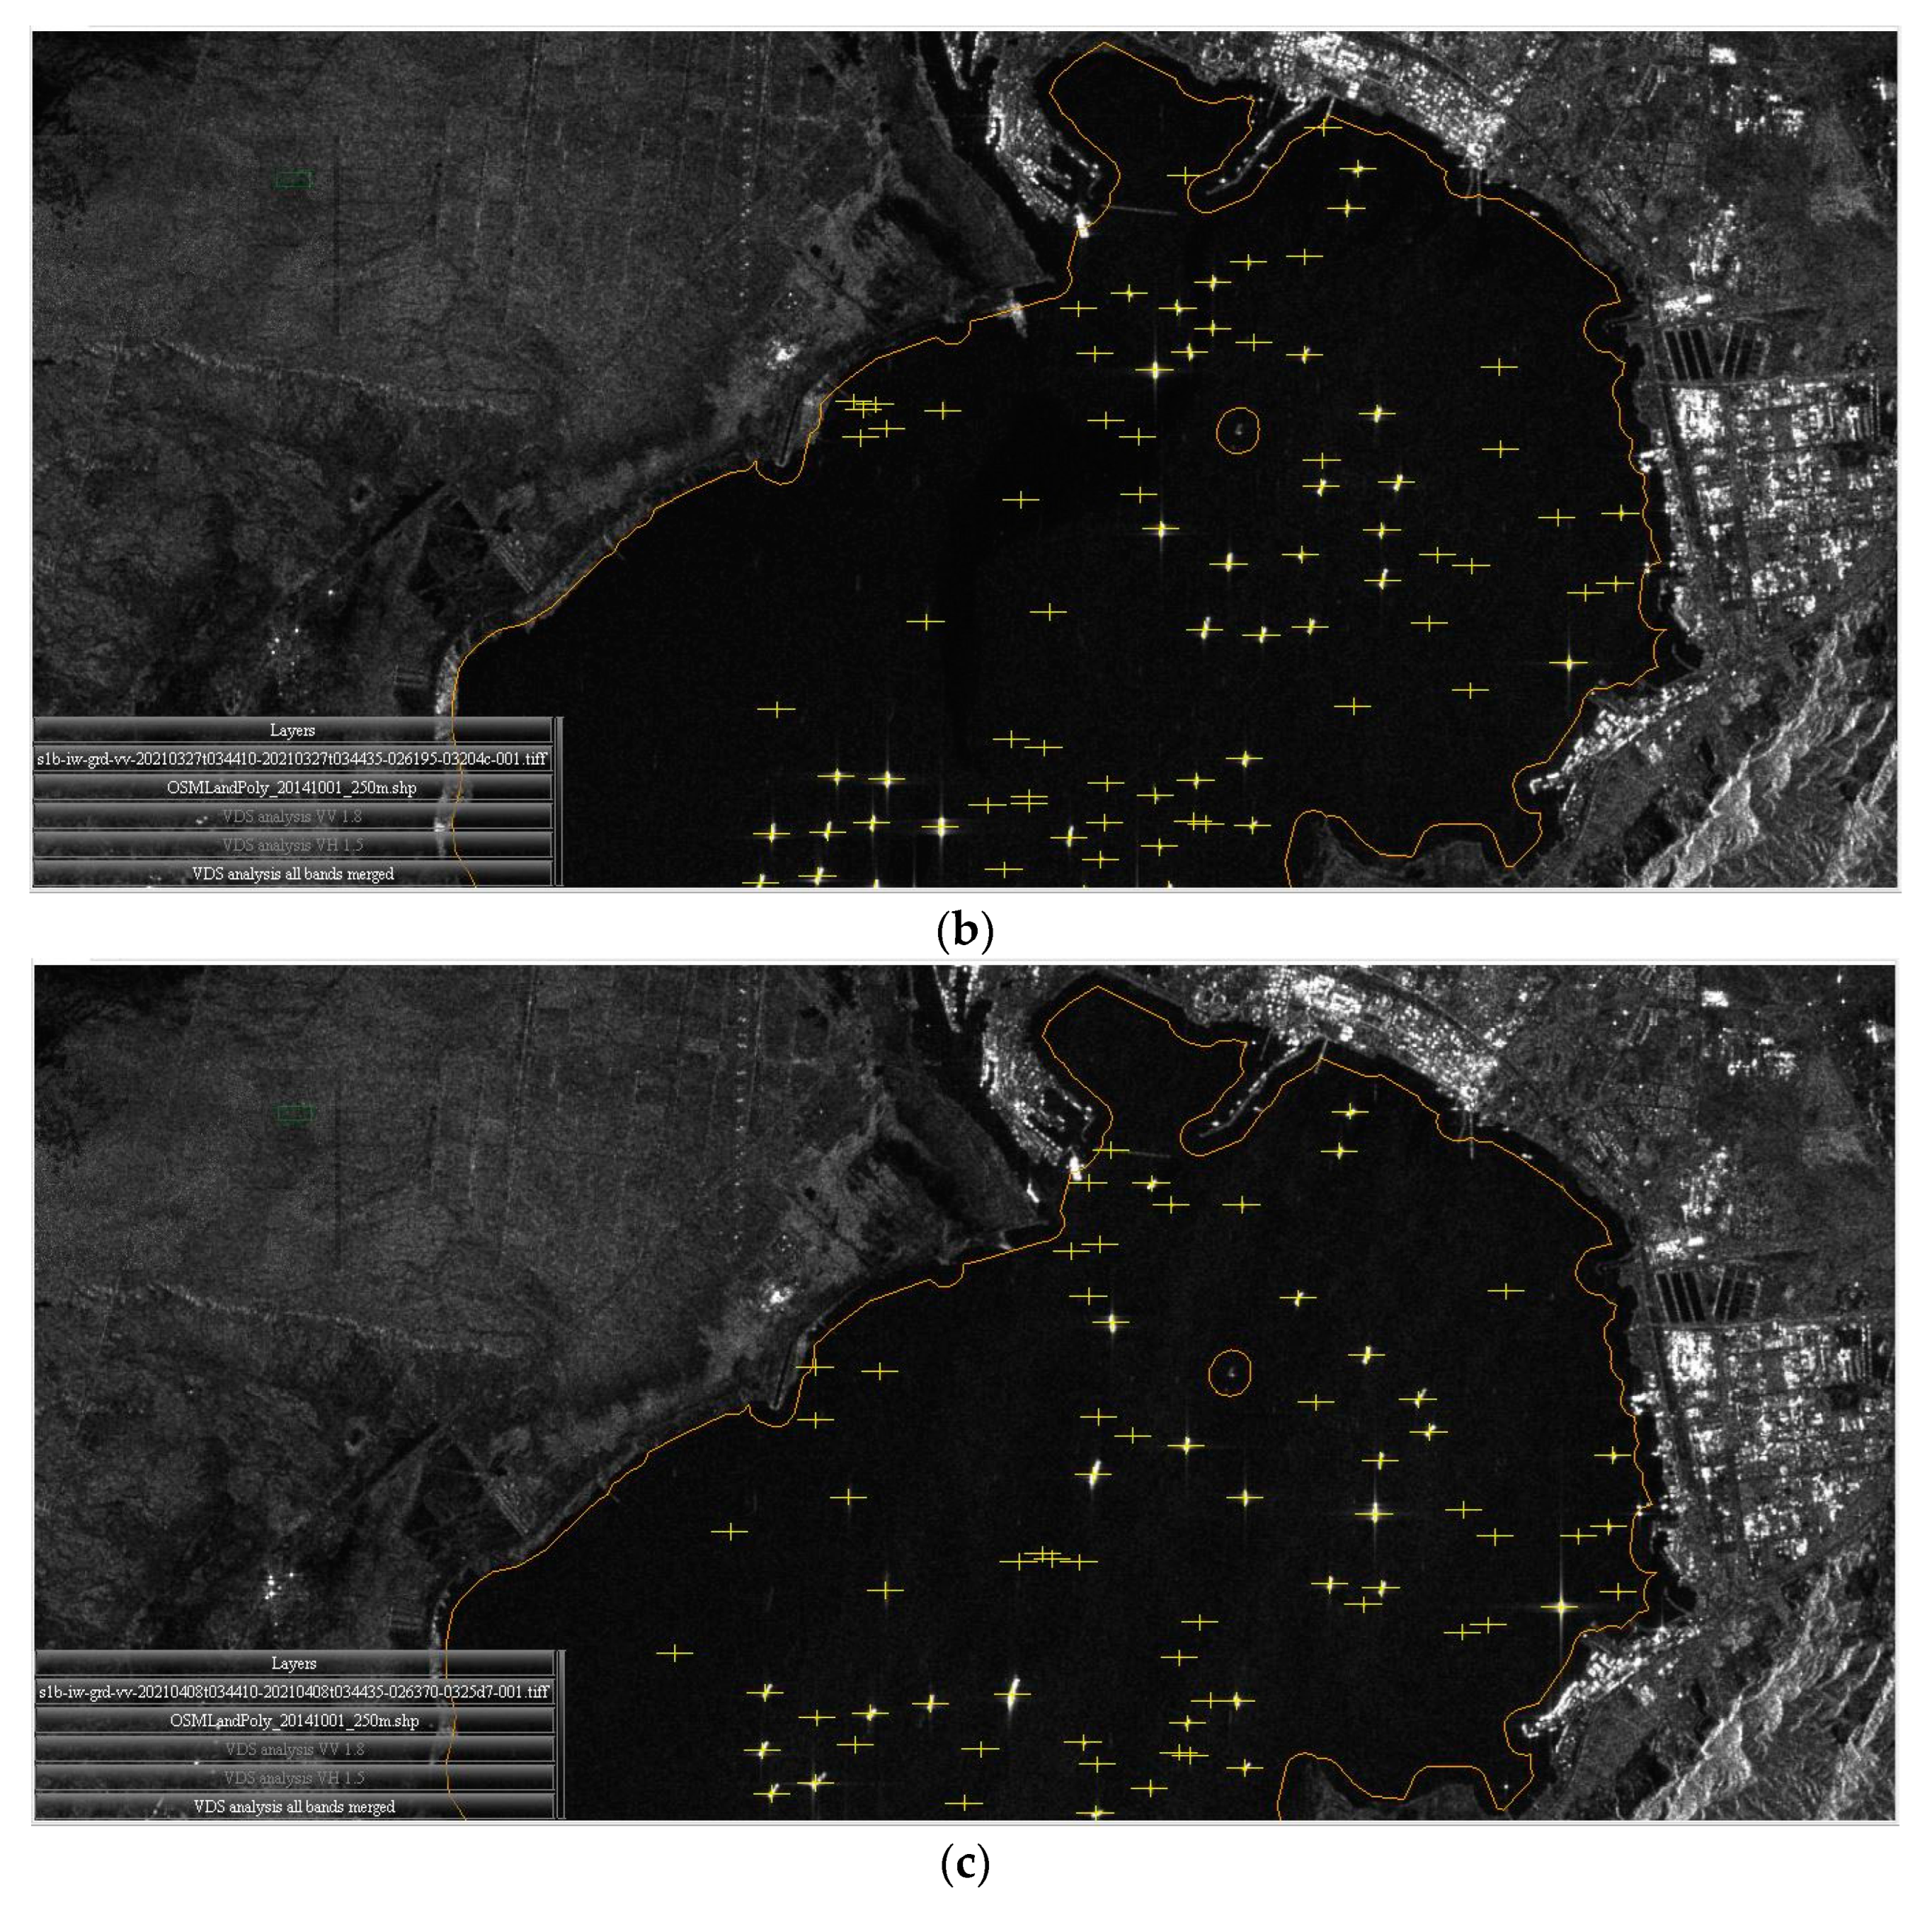
5.1. Ship Detection Results Using Sentinel-1 Dataset
5.2. Traffic Analysis Using Sentinel-2 Dataset
5.3. Traffic Analysis in the Gulf of Suez
5.4. Determining the Suitability of Polarimetric Channel
Vessel Detection Results in Different Polarization
6. Conclusions
Author Contributions
Funding
Institutional Review Board Statement
Informed Consent Statement
Data Availability Statement
Acknowledgments
Conflicts of Interest
References
- The Importance of Suez Canal to Global Trade—18 April 2021. Available online: https://www.mfat.govt.nz/en/trade/mfat-market-reports/market-reports-africa/the-importance-of-the-suez-canal-to-global-trade-18-april-2021/ (accessed on 24 March 2023).
- Kanjir, U.; Greidanus, H.; Oštir, K. Vessel detection and classification from spaceborne optical images: A literature survey. Remote Sens. Environ. 2018, 207, 1–26. [Google Scholar] [CrossRef] [PubMed]
- Grover, A.; Kumar, S.; Kumar, A. Ship Detection Using Sentinel-1 Sar Data. ISPRS Ann. Photogramm. Remote Sens. Spat. Inf. Sci. 2018, IV-5, 317–324. [Google Scholar] [CrossRef]
- Greidanus, H.; Alvarez, M.; Santamaria, C.; Thoorens, F.-X.; Kourti, N.; Argentieri, P. The SUMO ship detector algorithm for satellite radar images. Remote Sens. 2017, 9, 246. [Google Scholar] [CrossRef]
- Margarit, G.; Mallorqui, J.J.; Rius, J.M.; Sanz-Marcos, J. On the usage of GRECOSAR, an orbital polarimetric SAR simulator of complex targets, to vessel classification studies. IEEE Trans. Geosci. Remote Sens. 2006, 44, 3517–3526. [Google Scholar] [CrossRef]
- Leonidas, L.A.; Jie, Y. Ship Classification Based on Improved Convolutional Neural Network Architecture for Intelligent Transport Systems. Information 2021, 12, 302. [Google Scholar] [CrossRef]
- Ma, M.; Chen, J.; Liu, W.; Yang, W. Ship classification and detection based on CNN using GF-3 SAR images. Remote Sens. 2018, 10, 2043. [Google Scholar] [CrossRef]
- Dechesne, C.; Lefèvre, S.; Vadaine, R.; Hajduch, G.; Fablet, R. Ship identification and characterization in Sentinel-1 SAR images with multi-task deep learning. Remote Sens. 2019, 11, 2997. [Google Scholar] [CrossRef]
- Chaudhary, V.; Kumar, S. Marine oil slicks detection using spaceborne and airborne SAR data. Adv. Space Res. 2020, 66, 854–872. [Google Scholar] [CrossRef]
- Du, L.; Goerlandt, F.; Kujala, P. Review and analysis of methods for assessing maritime waterway risk based on non-accident critical events detected from AIS data. Reliab. Eng. Syst. Saf. 2020, 200, 106933. [Google Scholar] [CrossRef]
- The Economic Impacts of the Suez Canal Blockage. Available online: https://news.cleartax.in/the-economic-impacts-of-the-suez-canal-blockage/6030/ (accessed on 24 March 2023).
- Harun-Al-Rashid, A.; Yang, C.; Shin, D. Detection of maritime traffic anomalies using Satellite-AIS and multisensory Satellite imageries: Application to the 2021 Suez Canal obstruction. J. Navig. 2022, 75, 1082–1099. [Google Scholar] [CrossRef]
- Cremaschini, F.; Monaco, C.; Ilardi, E. Analysis of the effects of the Suez blockade on global containership traffic using AIS data and spatio-temporal data cube. Abstr. ICA 2022, 5, 46. [Google Scholar] [CrossRef]
- Gast, J.; Binsfeld, T.; Marsili, F.; Jahn, C. Analysis of the Suez Canal blockage with queueing theory. In Adapting to the Future: How Digitalization Shapes Sustainable Logistics and Resilient Supply Chain Management. Proc. Hambg. Int. Conf. Logist. (HICL) 2021, 31, 943–959. [Google Scholar]
- Niroumand-Jadidi, M.; Bovolo, F. Sentinel-2 Reveals Abrupt Increment of Total Suspended Matter While Ever Given ShipBlocked the Suez Canal. Water 2021, 13, 3286. [Google Scholar] [CrossRef]
- Li, B.; Xie, X.; Wei, X.; Tang, W. Ship detection and classification from optical remote sensing images: A survey. Chin. J. Aeronaut. 2021, 34, 145–163. [Google Scholar] [CrossRef]
- Renga, A.; Graziano, M.D.; Moccia, A.; D’Errico, M. Adaptive threshold and sub-look processing in ship detection by SAR. In OCEANS 2015-Genova; IEEE: Piscataway, NJ, USA, 2015; pp. 1–8. [Google Scholar]
- Stofa, M.M.; Zulkifley, M.A.; Zaki, S.Z.M. A deep learning approach to ship detection using satellite imagery. IOP Conf. Ser. Earth Environ. Sci. 2020, 540, 012049. [Google Scholar] [CrossRef]
- Li, Y.; Zhang, S.; Wang, W.-Q. A lightweight faster R-CNN for ship detection in SAR images. IEEE Geosci. Remote Sens. Lett. 2020, 19, 4006105. [Google Scholar] [CrossRef]
- Chen, Y.; Duan, T.; Wang, C.; Zhang, Y.; Huang, M. End-to-end ship detection in SAR images for complex scenes based on deep CNNs. J. Sens. 2021, 2021, 8893182. [Google Scholar] [CrossRef]
- Chang, Y.-L.; Anagaw, A.; Chang, L.; Wang, Y.C.; Hsiao, C.-Y.; Lee, W.-H. Ship detection based on YOLOv2 for SAR imagery. Remote Sens. 2019, 11, 786. [Google Scholar] [CrossRef]
- Khan, H.M.; Yunze, C. Ship detection in SAR image using YOLOv2. In Proceedings of the 2018 37th Chinese Control Conference (CCC), Wuhan, China, 25–27 July 2018; IEEE: Piscataway, NJ, USA, 2018; pp. 9495–9499. [Google Scholar]
- Han, X.; Zhao, L.; Ning, Y.; Hu, J. ShipYolo: An enhanced model for ship detection. J. Adv. Transp. 2021, 2021, 1060182. [Google Scholar] [CrossRef]
- Ting, L.; Baijun, Z.; Yongsheng, Z.; Shun, Y. Ship Detection Algorithm based on Improved YOLO V5. In Proceedings of the 2021 6th International Conference on Automation, Control and Robotics Engineering (CACRE), Dalian, China, 15–17 July 2021; pp. 483–487. [Google Scholar]
- Tello, M.; López-Martínez, C.; Mallorqui, J.J. A novel algorithm for ship detection in SAR imagery based on the wavelet transform. IEEE Geosci. Remote Sens. Lett. 2005, 2, 201–205. [Google Scholar] [CrossRef]
- Tello, M.; López-Martínez, C.; Mallorquí, J.J.; Greidanus, H. A Novel Algorithm for Ship Detection in ENVISAT SAR Imagery Based on the Wavelet Transform. In Proceedings of the 2004 Envisat & ERS Symposium (ESA SP-5572), Salzburg, Austria, 6–10 September 2004; European Space Agency: Paris, Frence; pp. 1557–1562. [Google Scholar]
- Stagliano, D.; Lupidi, A.; Berizzi, F. Ship detection from SAR images based on CFAR and wavelet transform. In Proceedings of the 2012 Tyrrhenian Workshop on Advances in Radar and Remote Sensing (TyWRRS), Naples, Italy, 12–14 September 2012; pp. 53–58. [Google Scholar] [CrossRef]
- Suez Canal. Available online: https://www.britannica.com/topic/Suez-Canal (accessed on 24 March 2023).
- Egypt’s Suez Canal Blocked by Huge Container Ship. Available online: https://www.bbc.com/news/world-middle-east-56505413 (accessed on 24 March 2023).
- Alaska Satellite Facility Sentinel-1 RTC Product Guide. Available online: https://hyp3-docs.asf.alaska.edu/guides/rtc_product_guide/ (accessed on 5 June 2023).
- Explained: How Much Did Suez Canal Blockage Cost World Trade. Available online: https://www.indiatoday.in/business/story/explained-how-much-did-suez-canal-blockage-cost-world-trade-1785062-2021-03-30 (accessed on 27 March 2023).
- Suez Canal Blockage a Large Loss Event for Global Reinsurers. Available online: https://www.fitchratings.com/research/insurance/suez-canal-blockage-large-loss-event-for-global-reinsurers-29-03-2021 (accessed on 27 March 2023).
- Bioresita, F.; Pribadi, C.B.; Firdaus, H.S. Ship detection in Madura Strait and Lamong Gulf using Sentinel-1 SAR data. In Proceedings of the 3rd International Conference on Science and Technology, Yogyakarta, Indonesia, 11–12 July 2017; Mustika, W., Kartini, I., Eds.; UGM Press: Yogyakarta, Indonesia, 2018; Volume 1, pp. 13–23. [Google Scholar]
- Normalized Difference Water Index. Available online: https://custom-scripts.sentinel-hub.com/sentinel-2/ndwi/ (accessed on 16 March 2023).
- Lee, J.M.Y.; Wong, E.Y.C. Suez Canal blockage: An analysis of legal impact, risks and liabilities to the global supply chain. In MATEC Web of Conferences; EDP Sciences: Les Ulis, France, 2021; Volume 339. [Google Scholar]
- Ship Detection. Available online: https://natural-resources.canada.ca/maps-tools-and-publications/satellite-imagery-and-air-photos/satellite-imagery-products/educational-resources/tutorial-radar-polarimetry/ship-detection/9519 (accessed on 14 March 2023).


| Characteristics | Dataset 1 | Dataset 2 | Dataset 3 |
|---|---|---|---|
| Mission | Sentinel-1B | Sentinel-1B | Sentinel-1B |
| Mission datatake ID | 203,453 | 204,876 | 206,295 |
| Sensing Start (UTC) | 15 March 2021, 03:44:09 | 27 March 2021, 03:44:10 | 8 April 2021, 03:44:10 |
| Sensing Stop (UTC) | 15 March 2021, 03:44:34 | 27 March 2021, 03:44:35 | 8 April 2021, 03:44:35 |
| Mode | IW | IW | IW |
| Product Type | GRDH | GRDH | GRDH |
| Polarization | VH, VV | VH, VV | VH, VV |
| Pass Direction | Descending | Descending | Descending |
| Looking Direction | Right | Right | Left |
| Product Level | L1 | L1 | L1 |
| Instrument Name | SAR (C-band) | SAR (C-band) | SAR (C-band) |
| Characteristics | Dataset 1 | Dataset 2 | Dataset 3 |
|---|---|---|---|
| Mission | Sentinel-2B | Sentinel-2B | Sentinel-2A |
| Sensing Start (UTC) | 19 March 2021, 08:26:39 | 29 March 2021, 08:25:59 | 13 April 2021, 08:26:01 |
| Bands | 13 Bands | 13 Bands | 13 Bands |
| Pass Direction | Descending | Descending | Descending |
| Instrument Name | MSI | MSI | MSI |
| Date | Detected Targets | Ambiguities Removed | Missed Targets | Total Targets |
|---|---|---|---|---|
| 15 March 2021 | 199 | 47 | 9 | 161 |
| 27 March 2021 | 298 | 62 | 17 | 253 |
| 8 April 2021 | 211 | 53 | 6 | 164 |
| Date | Detected Targets | Ambiguities Removed | Missed Targets | Total Targets |
|---|---|---|---|---|
| 15 March 2021 | 274 | 96 | 1 | 179 |
| 27 March 2021 | 382 | 101 | 0 | 281 |
| 8 April 2021 | 265 | 94 | 2 | 173 |
| Date | Targets Detected |
|---|---|
| 19 March 2021 | 87 |
| 29 March 2021 | 259 |
| 13 April 2021 | 76 |
| Date | VV Polarisation | VH Polarisation | Merged Products of VV and VH |
|---|---|---|---|
| 15 March 2021 | 250 | 220 | 274 |
| 27 March 2021 | 305 | 342 | 382 |
| 8 April 2021 | 217 | 226 | 265 |
Disclaimer/Publisher’s Note: The statements, opinions and data contained in all publications are solely those of the individual author(s) and contributor(s) and not of MDPI and/or the editor(s). MDPI and/or the editor(s) disclaim responsibility for any injury to people or property resulting from any ideas, methods, instructions or products referred to in the content. |
© 2023 by the authors. Licensee MDPI, Basel, Switzerland. This article is an open access article distributed under the terms and conditions of the Creative Commons Attribution (CC BY) license (https://creativecommons.org/licenses/by/4.0/).
Share and Cite
Sonkar, A.; Kumar, S.; Kumar, N. Spaceborne SAR-Based Detection of Ships in Suez Gulf to Analyze the Maritime Traffic Jam Caused Due to the Blockage of Egypt’s Suez Canal. Sustainability 2023, 15, 9706. https://doi.org/10.3390/su15129706
Sonkar A, Kumar S, Kumar N. Spaceborne SAR-Based Detection of Ships in Suez Gulf to Analyze the Maritime Traffic Jam Caused Due to the Blockage of Egypt’s Suez Canal. Sustainability. 2023; 15(12):9706. https://doi.org/10.3390/su15129706
Chicago/Turabian StyleSonkar, Ananya, Shashi Kumar, and Navneet Kumar. 2023. "Spaceborne SAR-Based Detection of Ships in Suez Gulf to Analyze the Maritime Traffic Jam Caused Due to the Blockage of Egypt’s Suez Canal" Sustainability 15, no. 12: 9706. https://doi.org/10.3390/su15129706
APA StyleSonkar, A., Kumar, S., & Kumar, N. (2023). Spaceborne SAR-Based Detection of Ships in Suez Gulf to Analyze the Maritime Traffic Jam Caused Due to the Blockage of Egypt’s Suez Canal. Sustainability, 15(12), 9706. https://doi.org/10.3390/su15129706