
Understanding the Importance of Eco-Labeling for Organic Foods at UNESCO Biosphere Reserves: A Case Study of the Cocoa Powder at the Dong Nai, Vietnam

 ,
,  ,
,
Abstract
1. Introduction
- -
- Are consumers willing to pay a premium for eco-labeled organic cocoa powder in DNBR? What factors influence their decisions?
- -
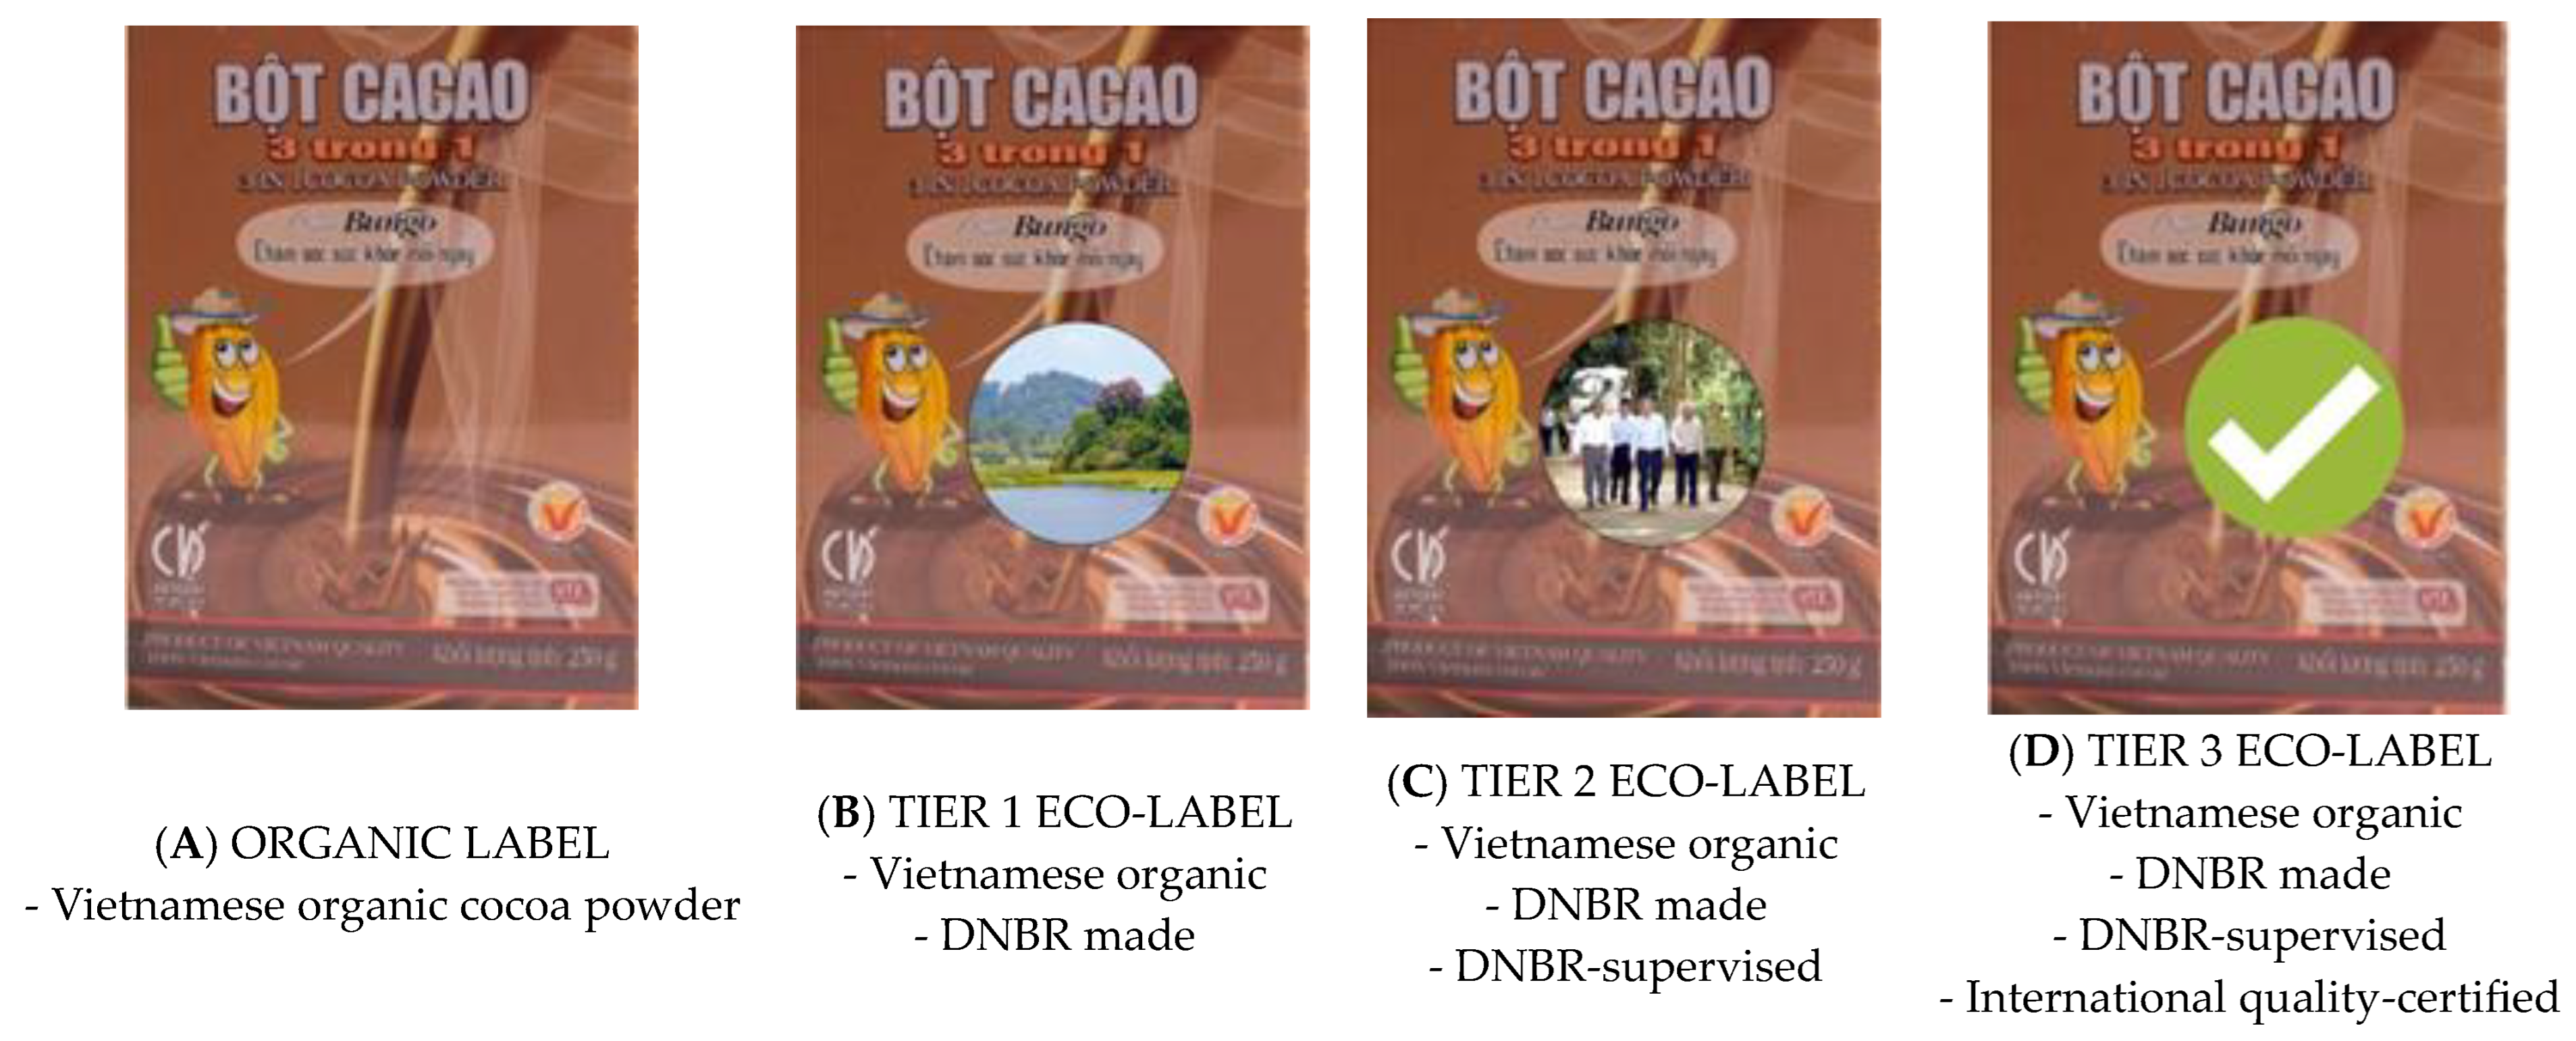
- Which eco-label variety would be most suitable?
2. Methodology
2.1. Cocoa Powder Production in DNBR
- -
- Low awareness: The majority of cocoa farmers in DNBR are still unfamiliar with the advantages of eco-labeling. Some individuals still do not comprehend the standards and requirements for eco-labeling evaluation and certification.
- -
- High investment costs: To meet the standards and obtain eco-labeling, cocoa powder producers must invest a substantial amount of money in the construction of cultivation systems, quality management, and product control. This may cause producers to be concerned about increased costs and decreased profits; and
- -
- Competition from products without eco-labeling: Despite the fact that cocoa powder with eco-labeling can provide higher economic value, products without eco-labeling remain fiercely competitive on the market. Eco-labeling can therefore make it difficult for local producers to compete.
2.2. Data Analysis Methods
2.2.1. Descriptive Statistics, Cross Tabulation, and ANOVA Test
- -
- “Male and female customers have various concerns about food safety, agricultural environment, and pricing and have varied product expertise about cocoa powder produced in DNBR”; and
- -
- “Customers with varying educational levels have various concerns about food safety, agricultural environment, and pricing in various ways and have varied product expertise about cocoa powder produced in DNBR”.
2.2.2. WTP Calculation
2.2.3. PLS-SEM
2.2.4. Data Collection
3. Results
3.1. Descriptive Statistics and ANOVA Test
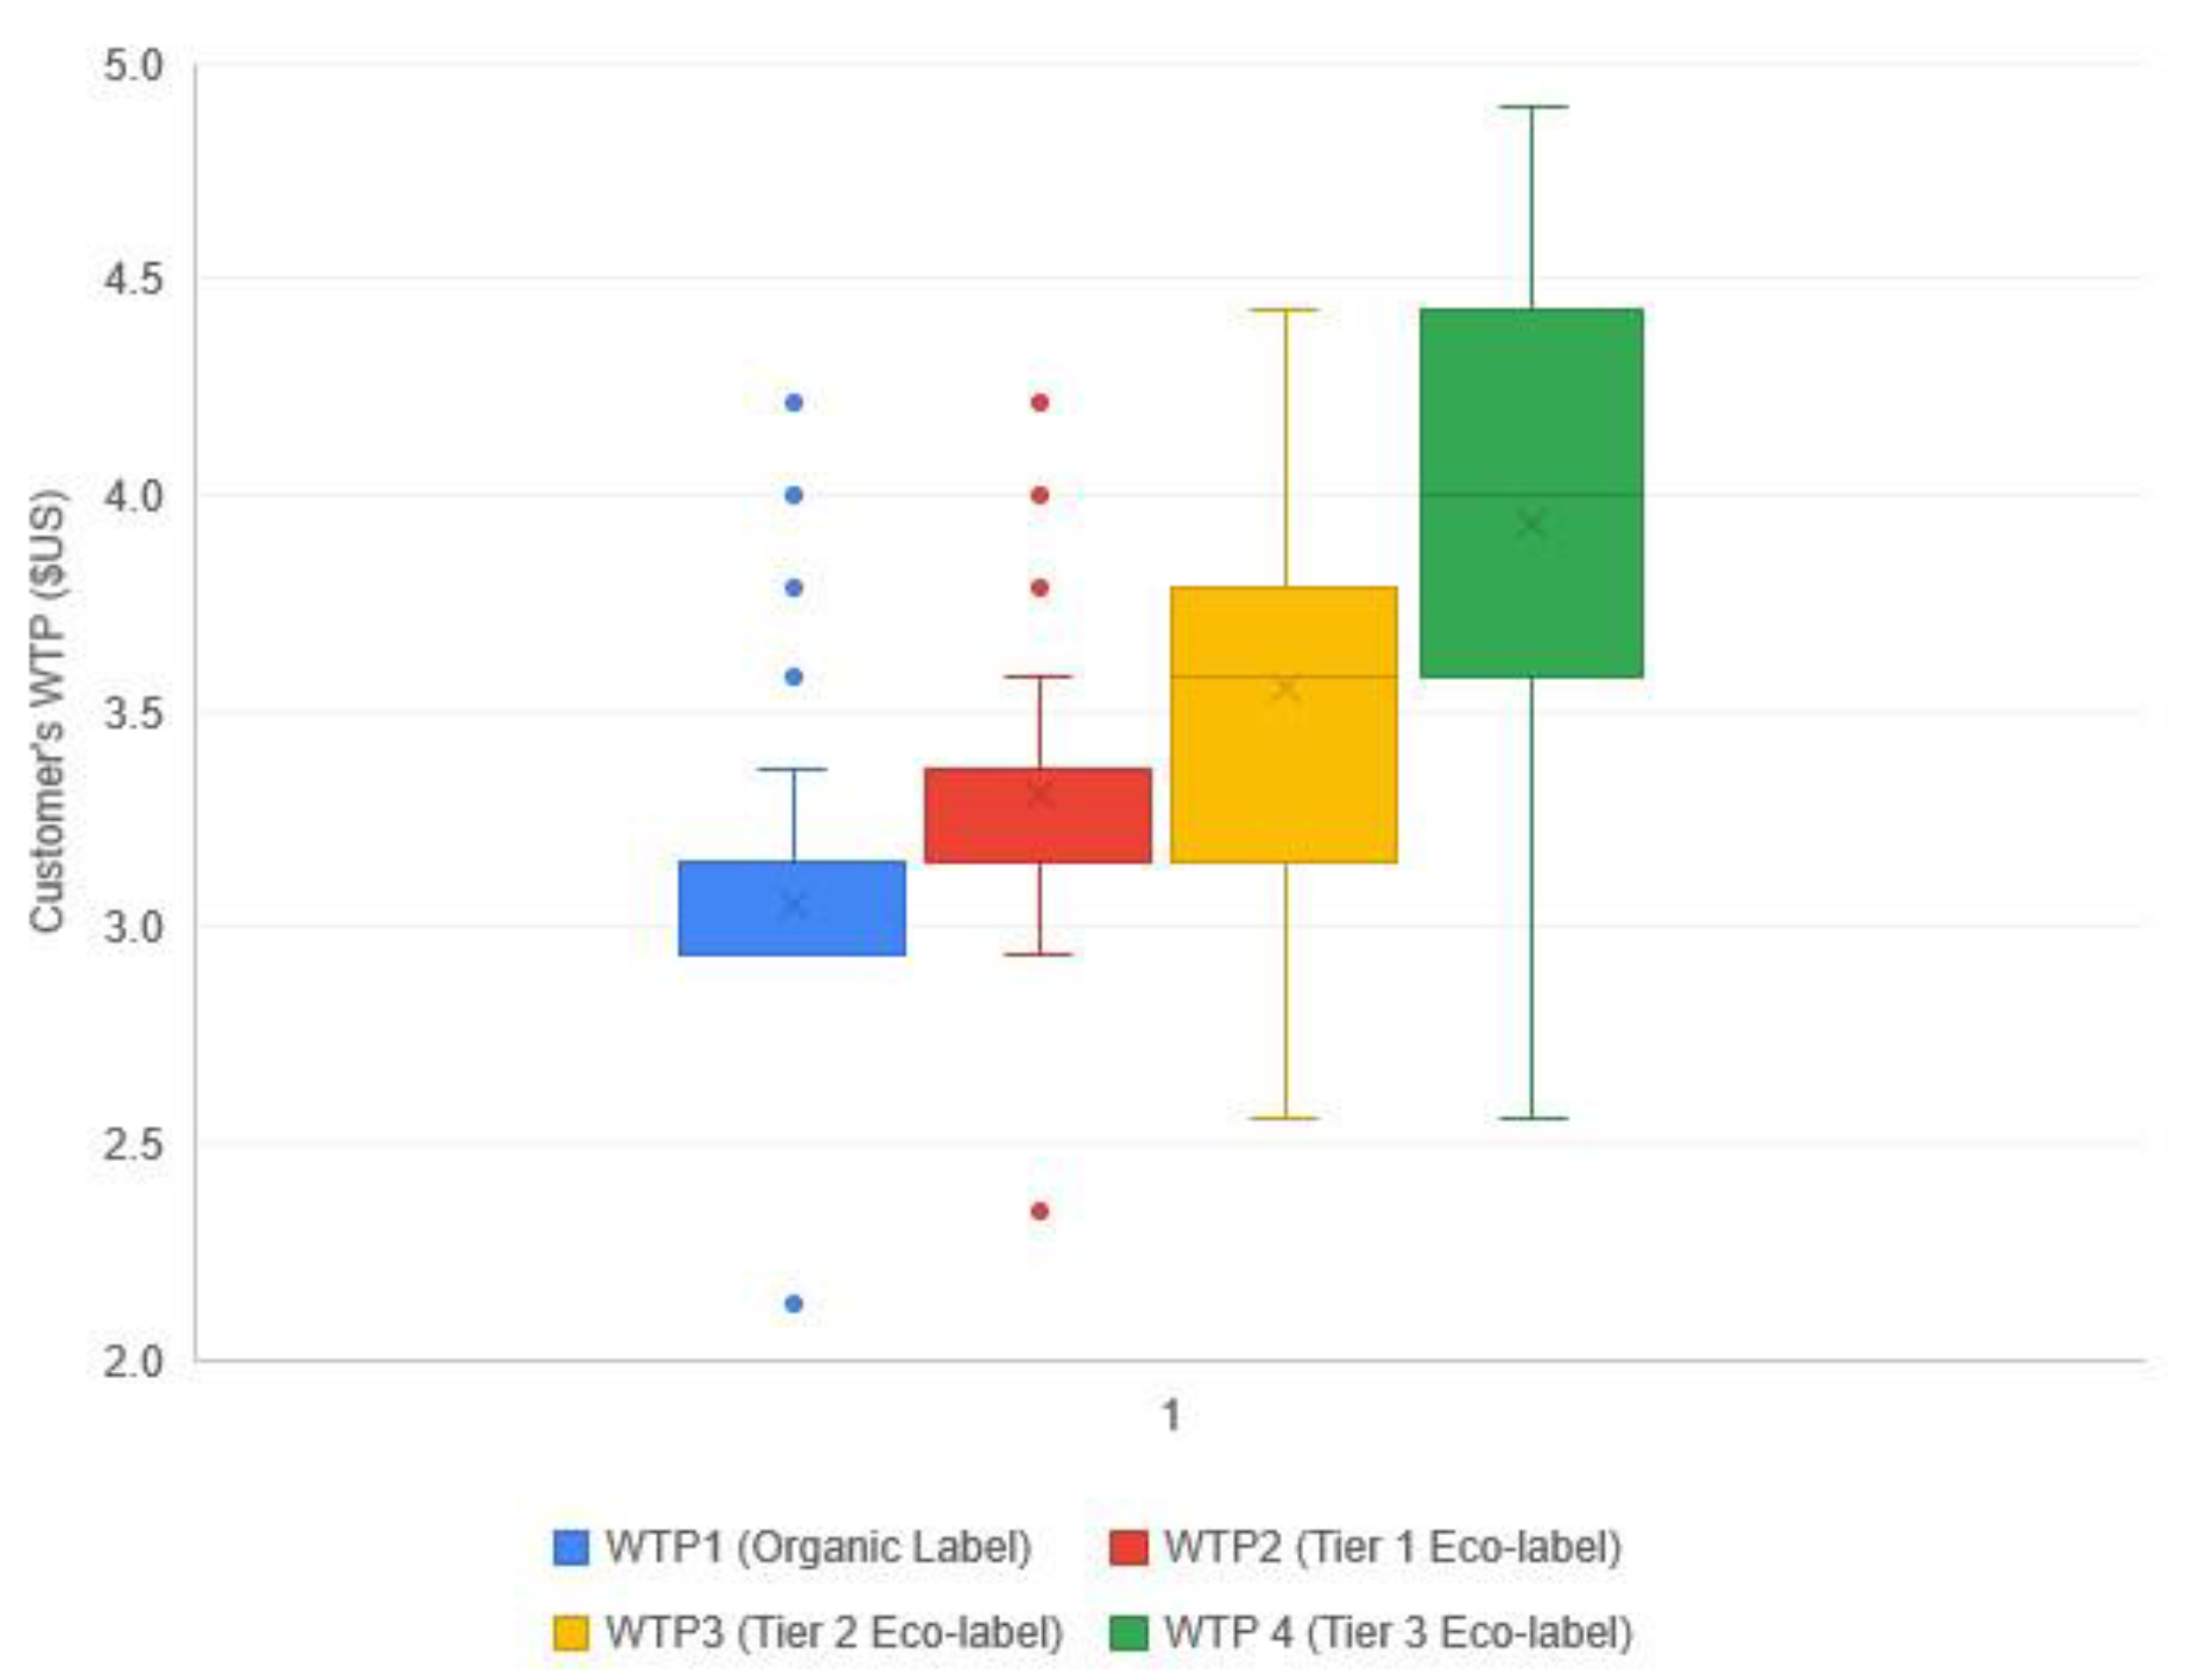
3.2. Willingness to Pay
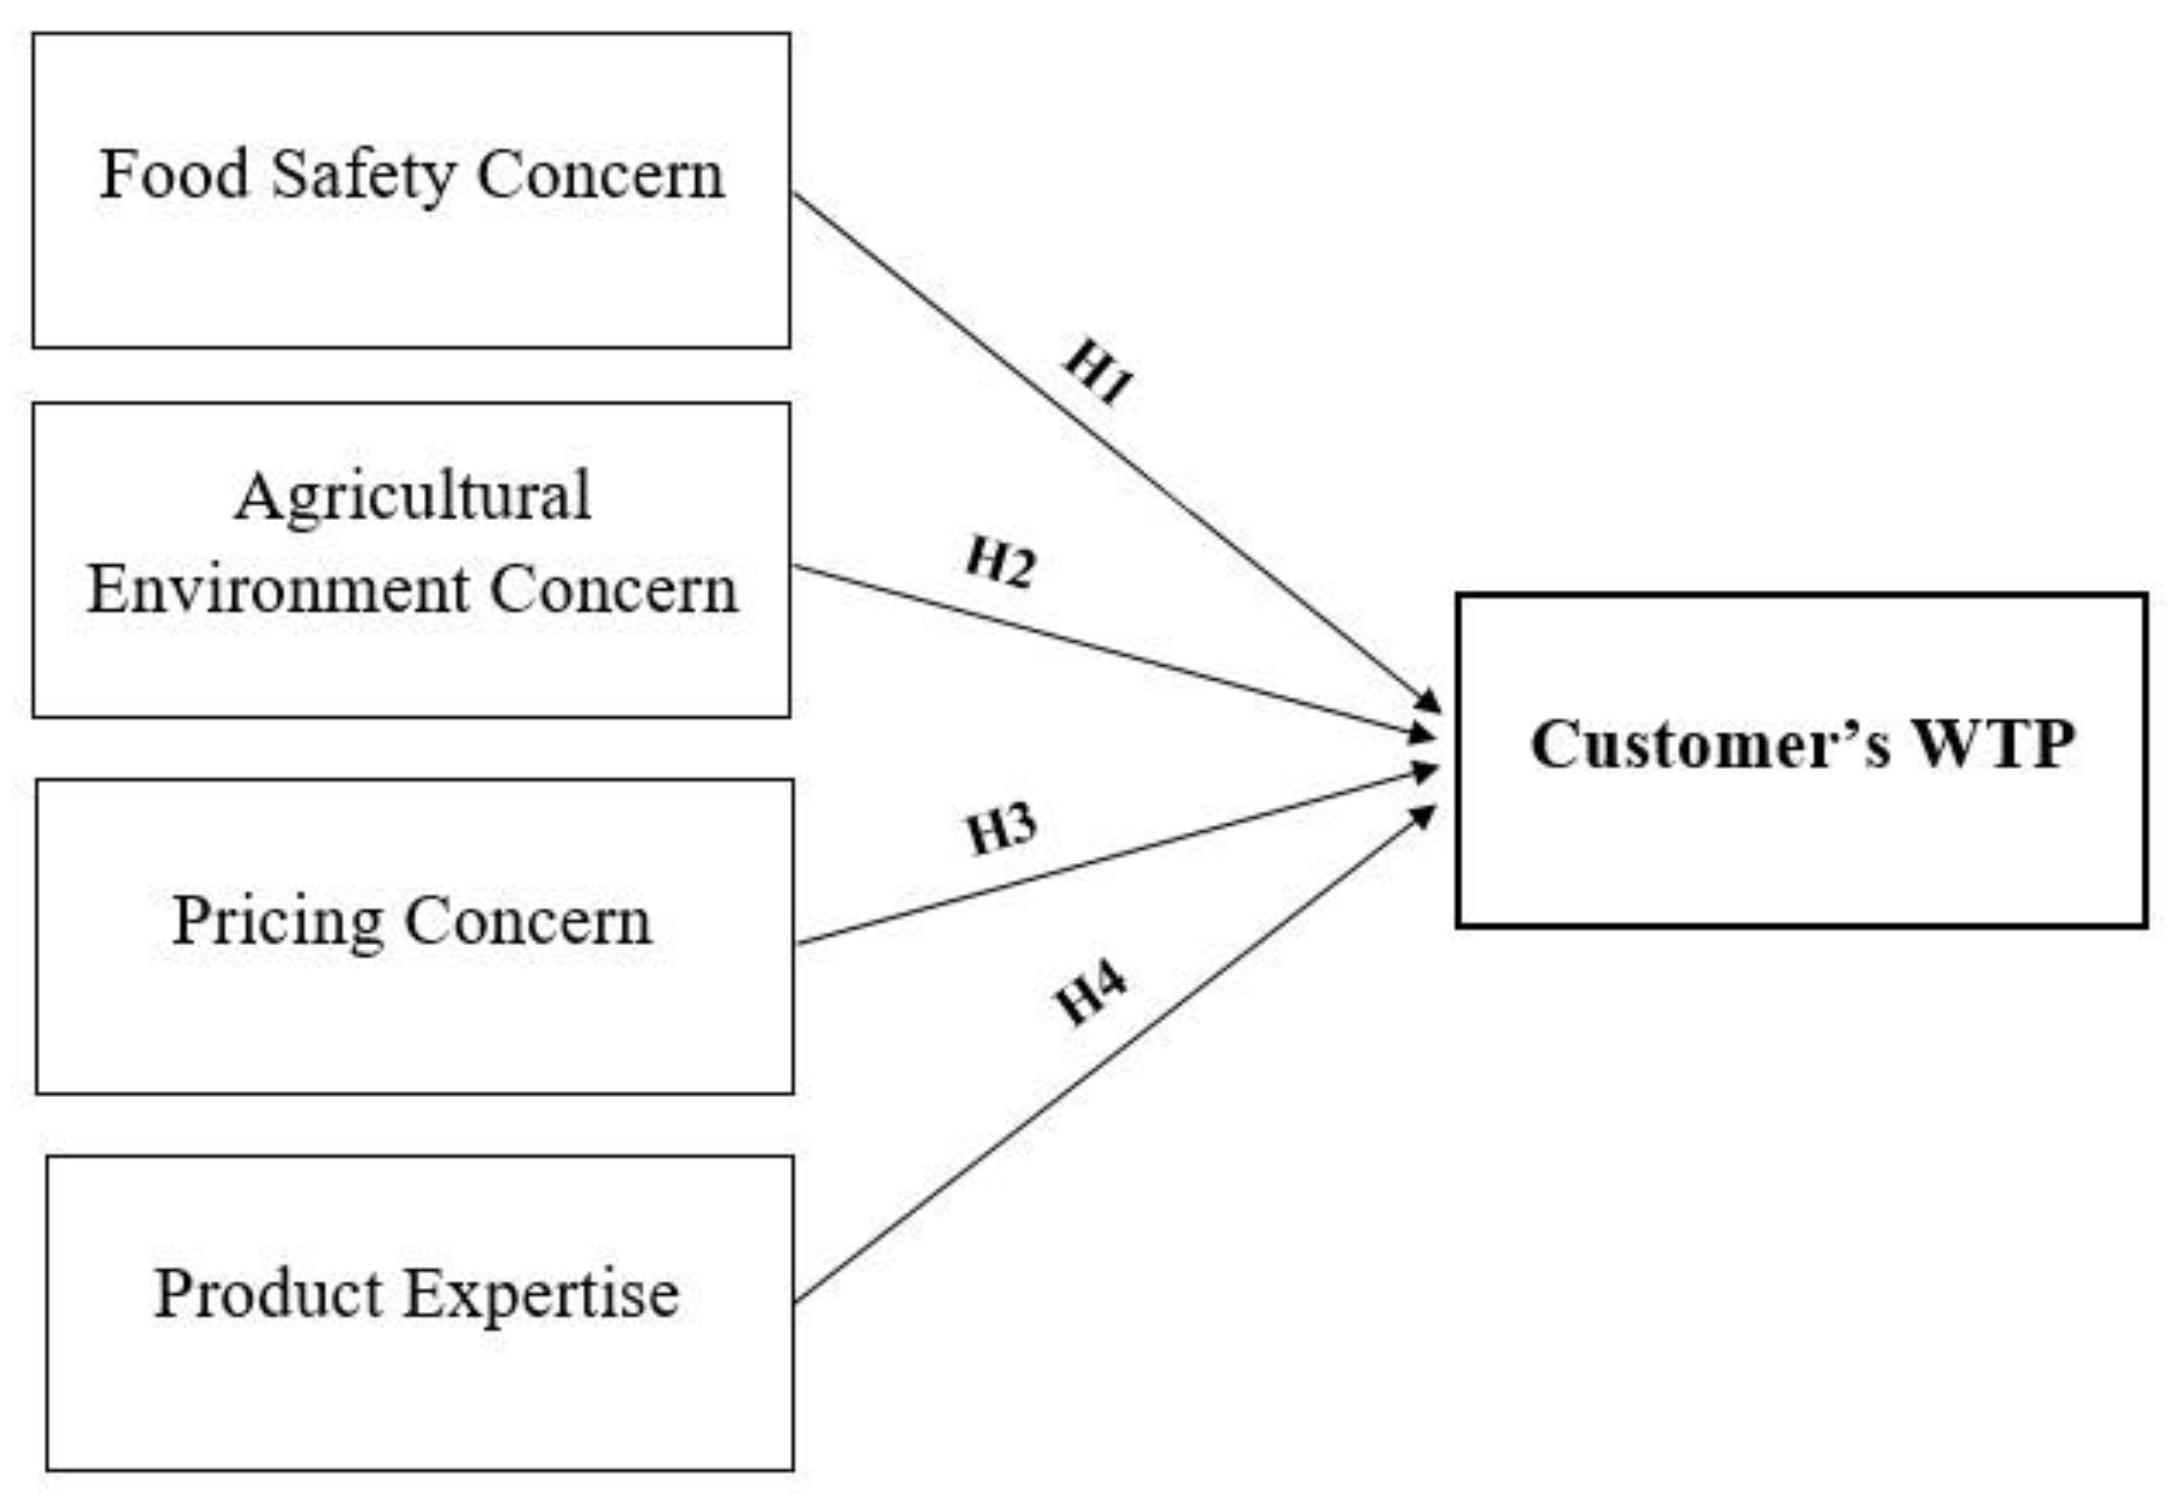
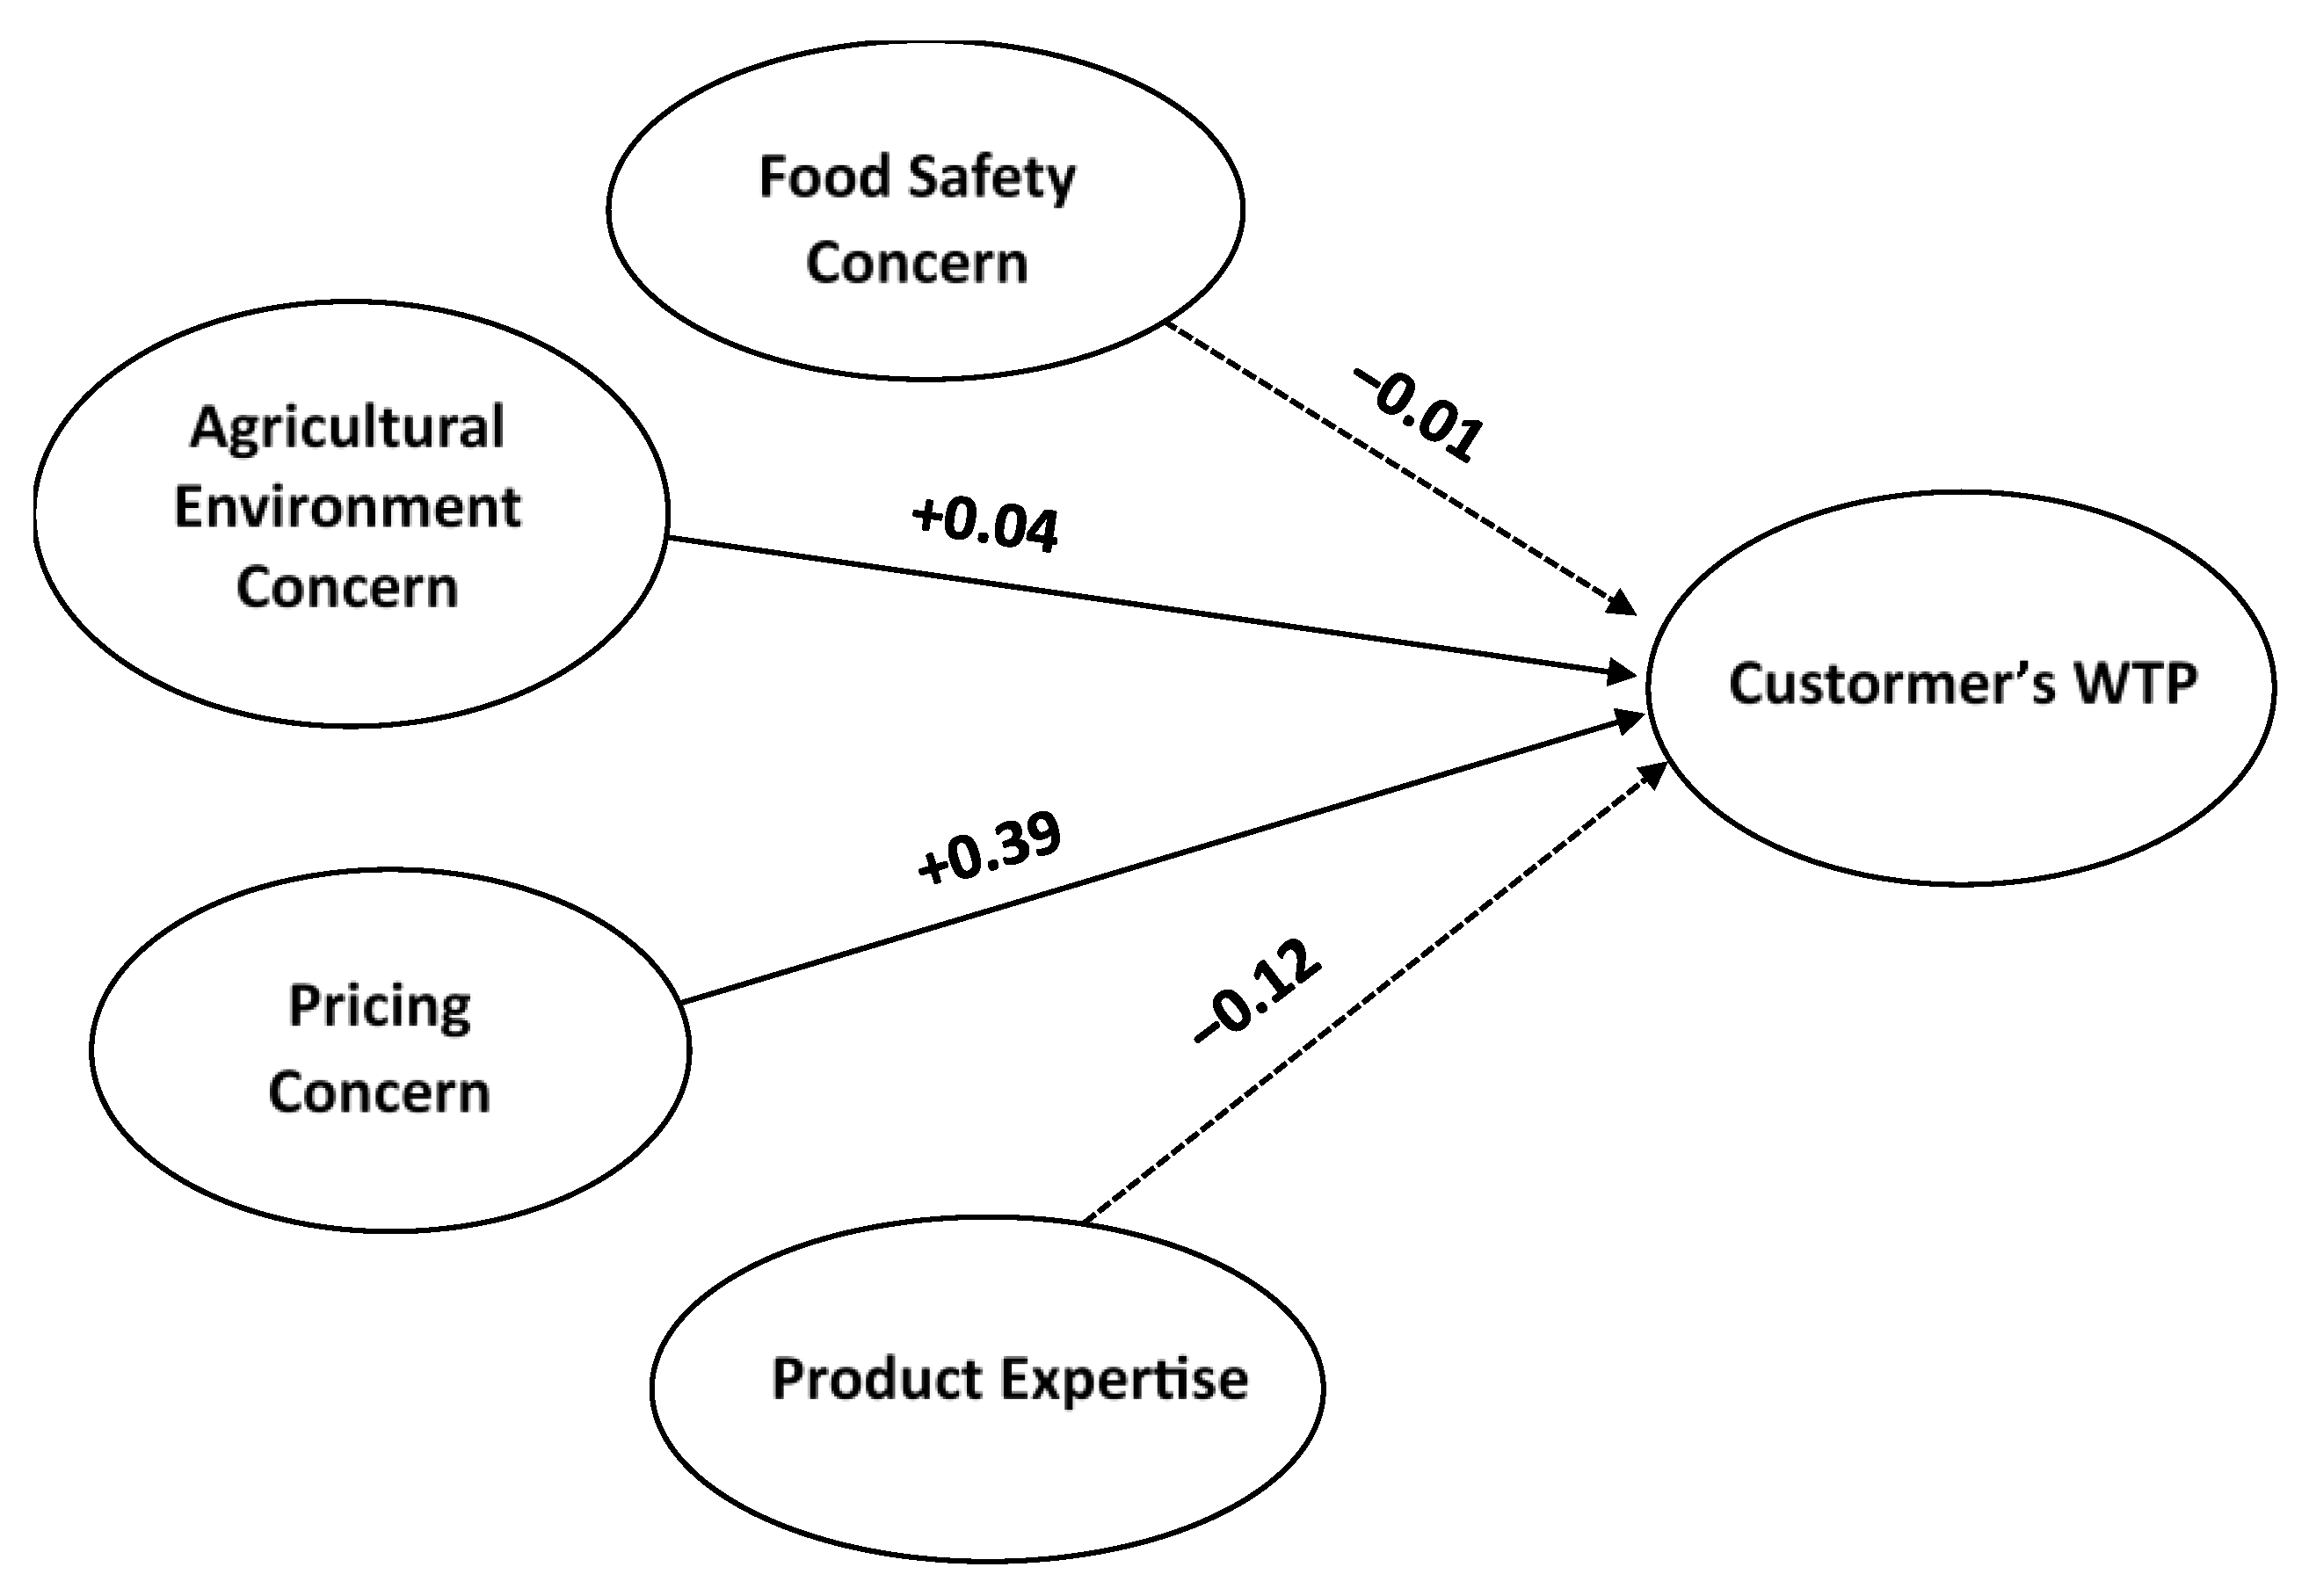
3.3. Determinants of Customers’ WTP
- (a)
- Reliability test
- (b)
- EFA
- (c)
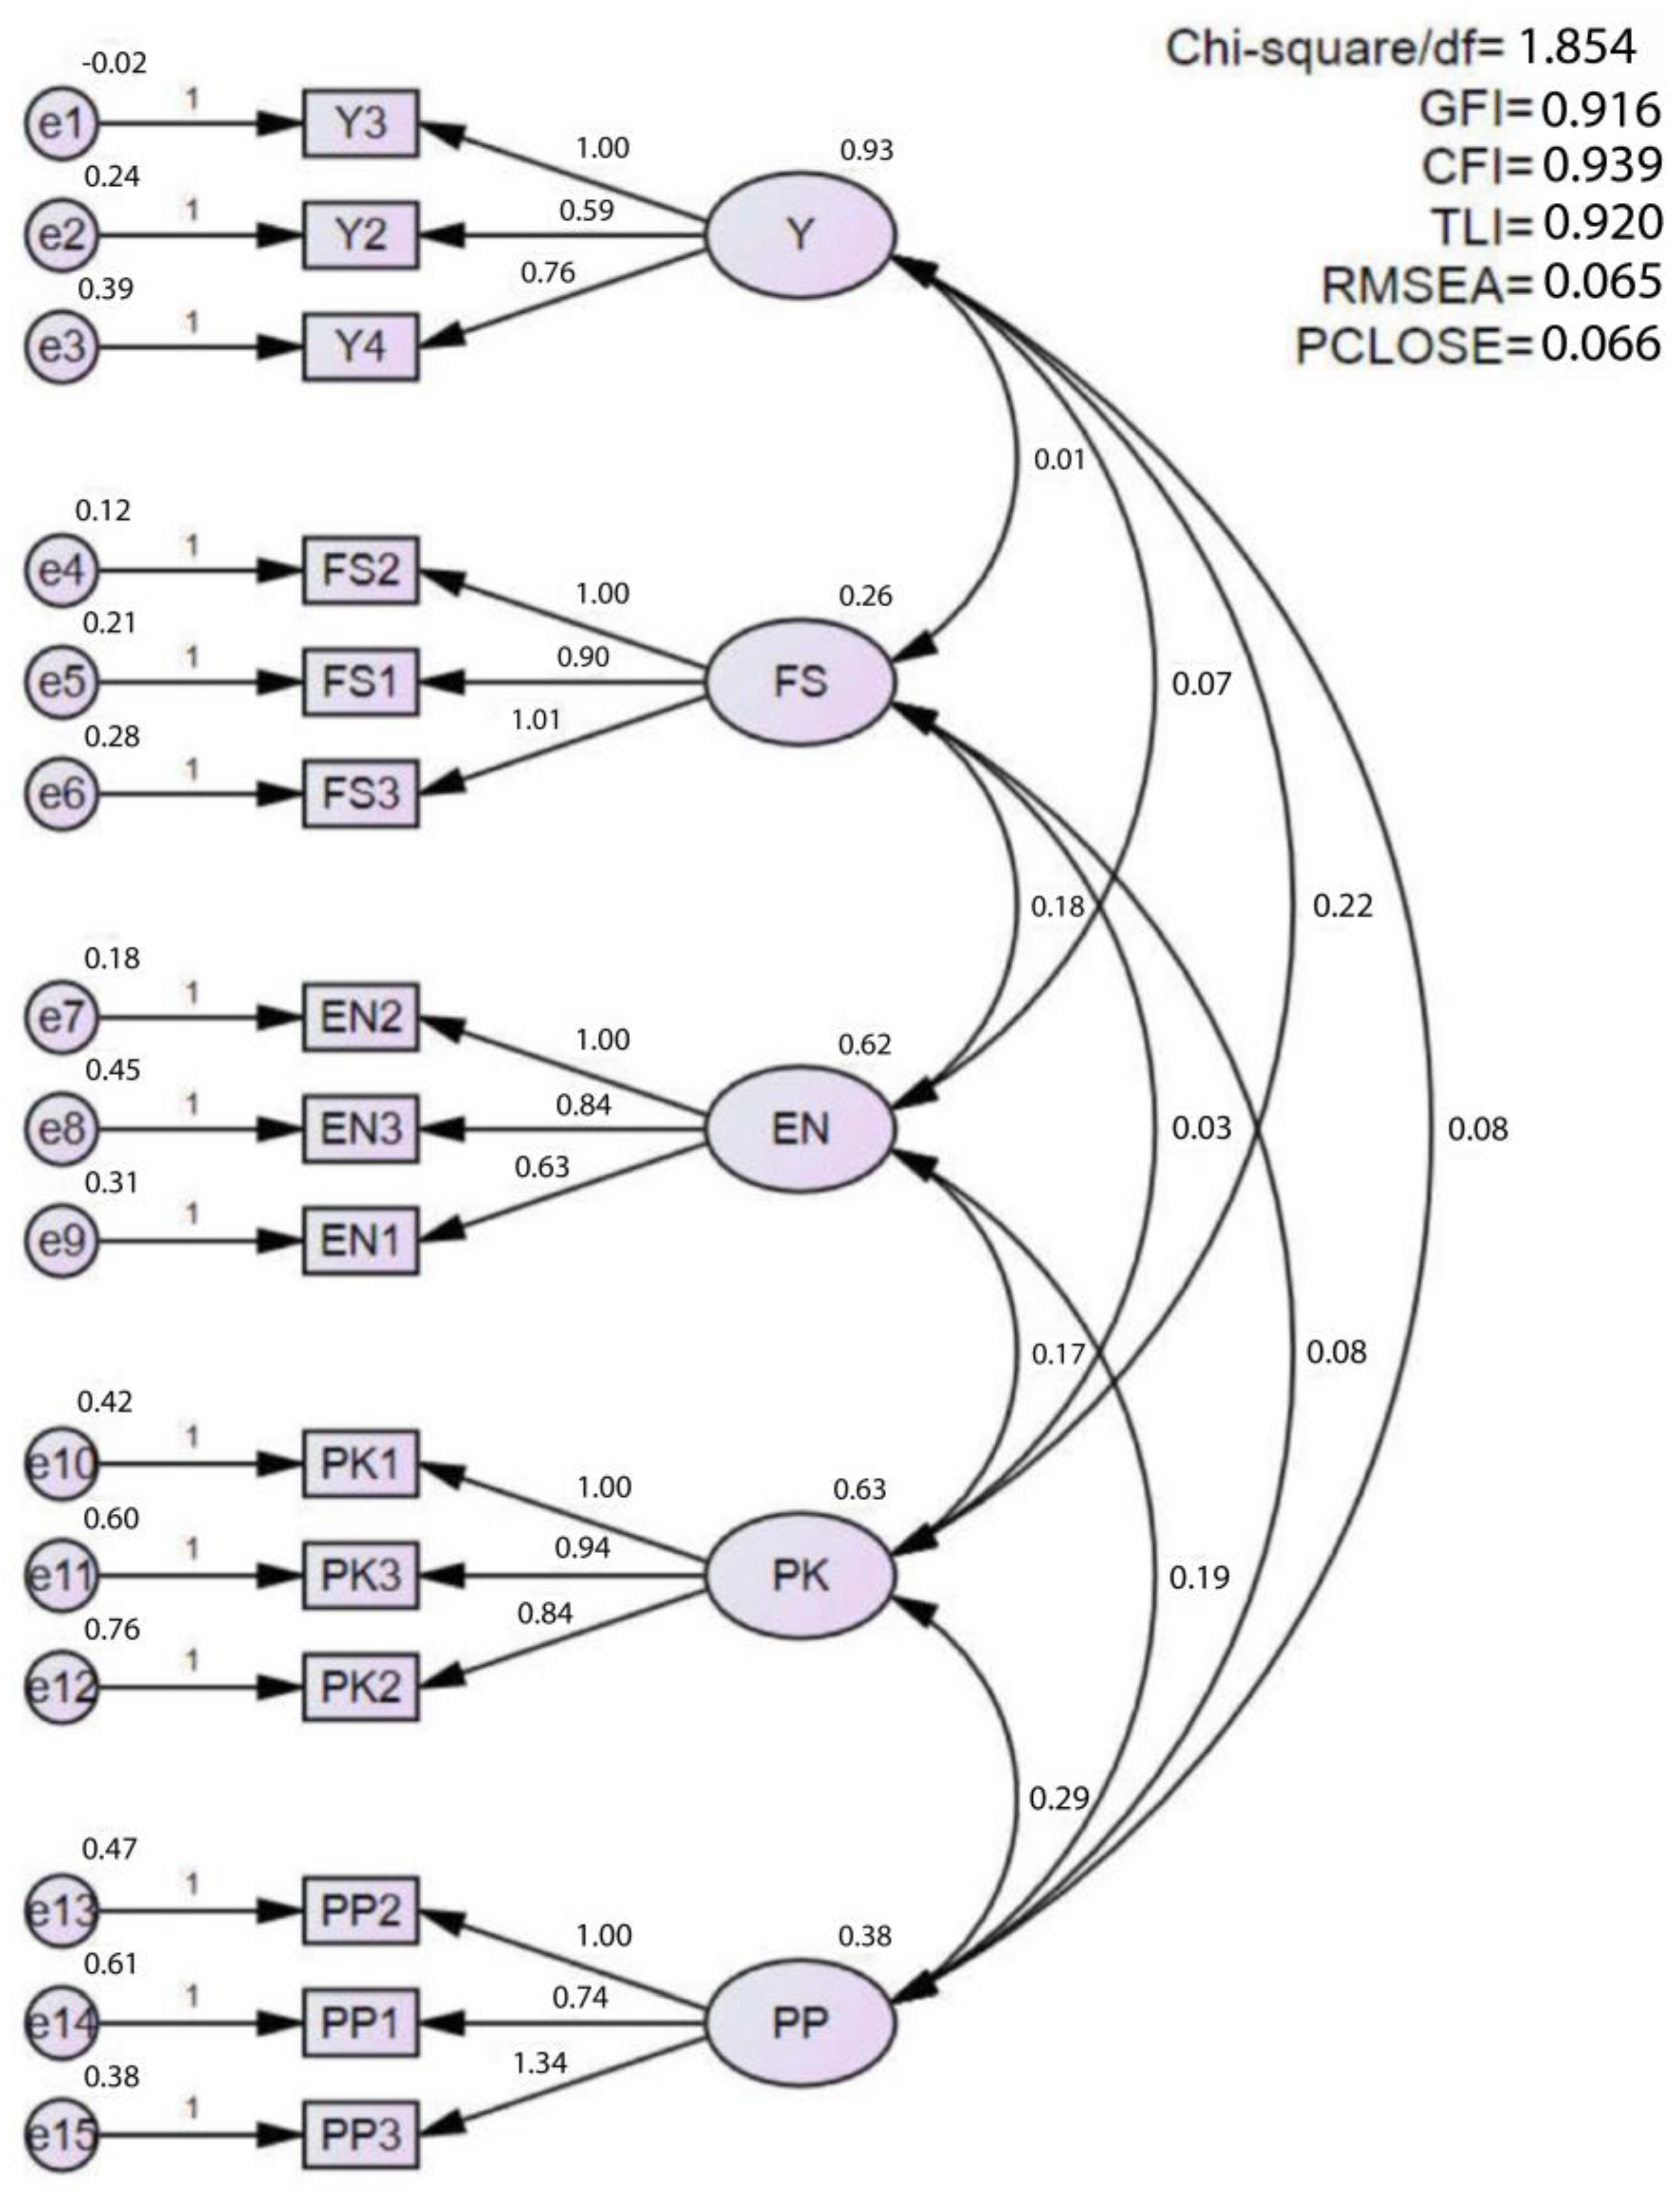
- CFA
- (d)
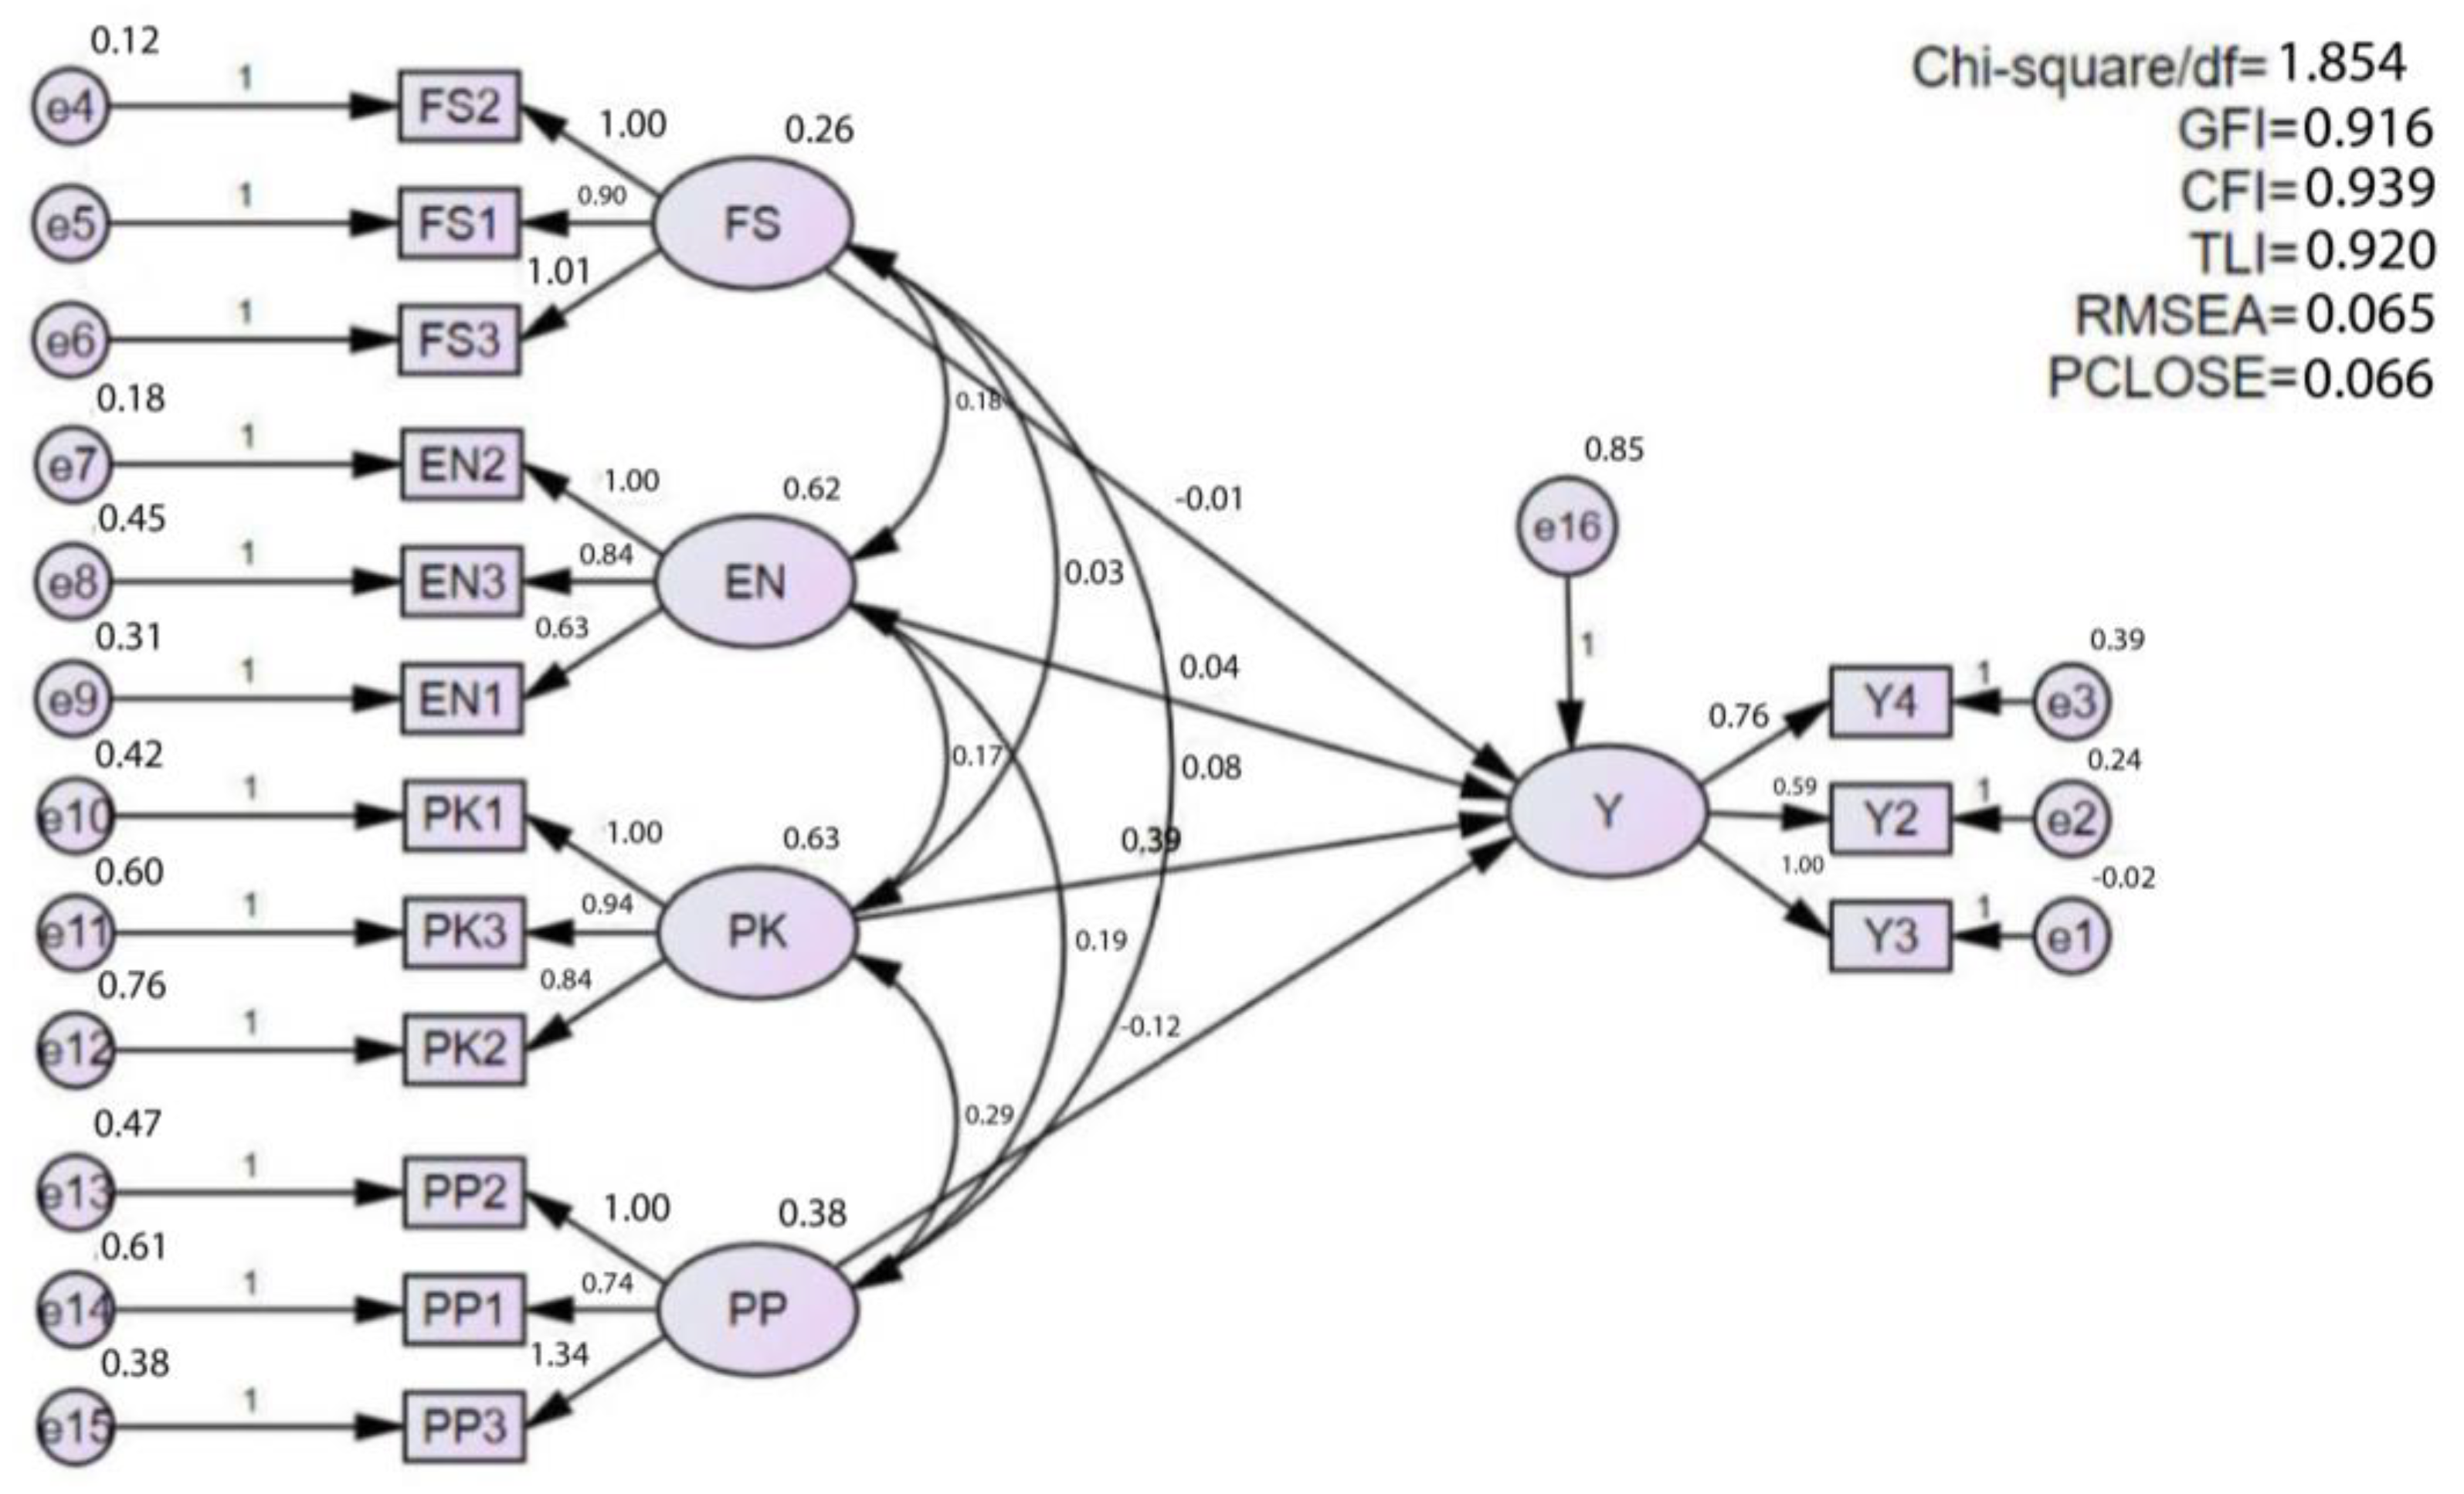
- Testing the theoretical SEM
- (e)
- Bootstrapping
4. Discussions, Policy Recommendations and Conclusions
4.1. Discussions
4.2. Policy Recommendations
4.3. Conclusions
Author Contributions
Funding
Institutional Review Board Statement
Informed Consent Statement
Data Availability Statement
Acknowledgments
Conflicts of Interest
References
- Mertz, O.; Ravnborg, H.M.; Lövei, G.L.; Nielsen, I.; Konijnendijk, C.C. Ecosystem services and biodiversity in developing countries. Biodivers. Conserv. 2007, 16, 2729–2737. [Google Scholar] [CrossRef]
- El-Ashry, M.T. Balancing economic development with environmental protection in developing and lesser developed countries. Air Waste 1993, 43, 18–24. [Google Scholar] [CrossRef]
- Bilali, H.E.; Callenius, C.; Strassner, C.; Probst, L. Food and nutrition security and sustainability transitions in food systems. Food Energy Secur. 2019, 8, e00154. [Google Scholar] [CrossRef]
- Salzman, J. Informing the green consumer: The debate over the use and abuse of environmental labels. Ind. Ecol. 1997, 1, 11–21. [Google Scholar] [CrossRef]
- Chen, X.; Gao, Z.; Swisher, M.; House, L.; Zhao, X. Eco-labeling in the Fresh Produce Market: Not All Environmentally Friendly Labels Are Equally Valued. Ecol. Econ. 2018, 154, 201–210. [Google Scholar] [CrossRef]
- Salladarré, F.; Brécard, D.; Lucas, S.; Ollivier, P. Are French consumers ready to pay a premium for eco-labeled seafood products? A contingent valuation estimation with heterogeneous anchoring. Agric. Econ. 2016, 47, 247–258. [Google Scholar] [CrossRef]
- Bonsi, R.; Hammett, A.L.; Smith, B. Eco–labels and International Trade: Problems and Solutions. World Trade 2008, 42, 407–432. [Google Scholar]
- Hameed, I.; Idrees, W. Eco Labels and Eco Conscious Consumer Behavior: The Mediating Effect of Green Trust and Environmental Concern. Manag. Sci. 2018, 5, 86–105. [Google Scholar] [CrossRef]
- Bruce, C.; Laroiya, A. The Production of Eco-Labels. Env. Resour. Econ. 2007, 36, 275–293. [Google Scholar] [CrossRef]
- Adhe, L.; Fenesia, W.; Katriana, T. Good Practices on Applying Eco-Labeling in Asia and the Pacific Biosphere Reserves; UNESCO Office in Jakarta: Jakarta, Indonesia, 2019; Volume 6, pp. 20–40. Available online: https://unesdoc.unesco.org/ark:/48223/pf0000373540 (accessed on 19 March 2023).
- Gallastegui, I.G. The use of eco-labels: A review of the literature. Eur. Environ. 2002, 12, 316–331. [Google Scholar] [CrossRef]
- Clapp, J.; Fuchs, D. Corporate Power in Global Agrifood Governance; MIT Press: Cambridge, MA, USA, 2009; 328p. [Google Scholar]
- Fairtrade International. Cocoa. 2021. Available online: https://www.fairtrade.net/product/cocoa (accessed on 17 March 2023).
- UTZ. Cocoa. 2021. Available online: https://utz.org/what-we-offer/cocoa/ (accessed on 15 March 2023).
- Chatterjee, S.; Hadi, A.S. Descriptive Statistics and Simple Regression Analysis. In Regression Analysis by Example, 5th ed.; John Wiley & Sons: Hoboken, NJ, USA, 2015; Chapter 2. [Google Scholar]
- Hinkle, D.E.; Wiersma, W.; Jurs, S.G. Applied Statistics for the Behavioral Sciences, 5th ed.; Houghton Mifflin: Boston, MA, USA, 2002; 756p. [Google Scholar]
- Montgomery, D.C.; Peck, E.A.; Vining, G.G. Introduction to Linear Regression Analysis; Wiley Series in Probability and Statistics; John Wiley & Sons: Hoboken, NJ, USA, 2021; 704p. [Google Scholar]
- Hair, J.F.; Black, W.C.; Babin, B.J.; Anderson, R.E.; Tatham, R.L. Multivariate data analysis. Pearson Educ. 2010, 31, 351–352. [Google Scholar]
- Verain, M.C.D.; Bartels, J.; Dagevos, H.; Sijtsema, S.J. Exploring the gap between consumers’ knowledge and behavior regarding sustainable seafood. Appetite 2014, 79, 159–166. [Google Scholar]
- Ha, V.D.; Thinh, N.A.; Anh, L.N. Eco-labeling for Green Economic Development in the Buffer Zones and Transition Areas of the World Biosphere Reserves in Vietnam. VNU J. Econ. Bus. 2021, 1, 3. [Google Scholar]
- Shen, J. Understanding the determinants of consumers’ willingness to pay for eco-labeled products: An empirical analysis of the China environmental label. Serv. Sci. Manag. 2012, 5, 87–94. [Google Scholar] [CrossRef]
- Thøgersen, J. How may consumer policy empower consumers for sustainable lifestyles? Consum. Policy 2005, 28, 143–177. [Google Scholar] [CrossRef]
- CDC US. People with a Higher Risk of Food Poisoning. 2022. Available online: https://www.cdc.gov/foodsafety/people-at-risk-food-poisoning.html (accessed on 23 January 2023).
- CARE. Gender Equality and Women’s Empowerment in the Context of Food Security and Nutrition; A Scoping Paper; CARE: Atlanta, GA, USA, 2020; 42p. [Google Scholar]
- Hirst, A.; Ashwin, I.M. Cross cultural difference between online shoppers in London and Bangkok. Int. Rev. Bus. Res. Pap. 2009, 5, 167–191. [Google Scholar]
- Yu, X.; Gao, Z.; Zeng, Y. Willingness to pay for the “Green Food” in China. Food Policy 2014, 45, 80–87. [Google Scholar] [CrossRef]
- Gil, J.M.; Gracia, A.; Sánchez, M. Market segmentation and willingness to pay for organic products in Spain. Int. Food Agribus. Manag. Rev. 2000, 3, 207–226. [Google Scholar] [CrossRef]
- Didier, T.; Lucie, S. Measuring consumer’s willingness to pay for organic and Fair Trade products. Int. J. Consum. Stud. 2008, 32, 479–490. [Google Scholar] [CrossRef]
- Van Doorn, J.; Verhoef, P.C. Willingness to pay for organic products: Differences between virtue and vice foods. Int. J. Res. Mark. 2011, 28, 167–180. [Google Scholar] [CrossRef]
- Kimenju, S.C.; De Groote, H. Consumer willingness to pay for genetically modified food in Kenya. Agric. Econ. 2008, 38, 35–46. [Google Scholar] [CrossRef]
- Clemons, E.K. How information changes consumer behavior and how consumer behavior determines corporate strategy. Manag. Inf. Syst. 2008, 25, 13–40. [Google Scholar] [CrossRef]
- Janssen, M.; Hamm, U. Product labelling in the market for organic food: Consumer preferences and willingness-to-pay for different organic certification logos. Food Qual. Prefer. 2012, 25, 9–22. [Google Scholar] [CrossRef]
- Bonn, M.A.; Cronin, J.J.; Cho, M. Do Environmental Sustainable Practices of Organic Wine Suppliers Affect Consumers’ Behavioral Intentions? The Moderating Role of Trust. Cornell Hosp. Q. 2016, 57, 21–37. [Google Scholar] [CrossRef]
- Namkung, Y.; Jang, S. Are Consumers Willing to Pay more for Green Practices at Restaurants? Hosp. Tour. Res. 2017, 41, 329–356. [Google Scholar] [CrossRef]
- Wong, V.; Turner, W.; Stoneman, P. Marketing Strategies and Market Prospects for Environmentally-Friendly Consumer Products. Br. J. Manag. 1996, 7, 263–281. [Google Scholar] [CrossRef]
- Lin, P.C.; Huang, Y.H. The influence factors on choice behavior regarding green products based on the theory of consumption values. Clean. Prod. 2012, 22, 11–18. [Google Scholar] [CrossRef]
- Gulzari, A.; Wang, Y.; Prybutok, V. A green experience with eco-friendly cars: A young consumer electric vehicle rental behavioral model. Retail. Consum. Serv. 2022, 65, 102877. [Google Scholar] [CrossRef]


| Characteristics | Number (n = 203) | Percentage (%) | |
|---|---|---|---|
| Gender | Male | 102 | 50.25 |
| Female | 101 | 49.75 | |
| Age | Under 20 | 20 | 9.85 |
| 20–25 | 66 | 32.51 | |
| 26–30 | 46 | 22.66 | |
| 31–40 | 38 | 18.72 | |
| Over 40 | 33 | 16.26 | |
| Educational level | Primary | 1 | 0.49 |
| Middle School | 10 | 4.93 | |
| High school | 37 | 18.23 | |
| Graduate | 121 | 59.61 | |
| Postgraduate | 34 | 16.75 | |
| Items | Mean | Std. Dev | Min | Max |
|---|---|---|---|---|
| Food safety concern (FS) | ||||
| The food safety of the product (FS1) | 4.65 | 0.65 | 2 | 5 |
| The quality of the product (FS2) | 4.60 | 0.62 | 2 | 5 |
| The origin of the product (FS3) | 4.47 | 0.75 | 1 | 5 |
| Agricultural environment concern (EN) | ||||
| Large-scale pesticide and chemical fertilizer contamination (EN1) | 4.38 | 0.75 | 1 | 5 |
| The consequences of agriculture environmental pollution (EN2) | 4.26 | 0.90 | 1 | 5 |
| The states of agriculture environmental pollution (EN3) | 4.18 | 0.94 | 1 | 5 |
| Pricing concern (PP) | ||||
| Compatibility with consumers’ payment capabilities (PP1) | 4.04 | 0.91 | 1 | 5 |
| Cocoa powder prices reflect product value (PP2) | 3.82 | 0.92 | 1 | 5 |
| Cocoa powder prices compared to others (PP3) | 3.76 | 1.03 | 1 | 5 |
| Product expertise (PK) | ||||
| Cocoa powder product is organic (PK1) | 3.74 | 1.03 | 1 | 5 |
| Cocoa powder product is supervised by DNBR Management Board (PK2) | 3.63 | 1.09 | 1 | 5 |
| International standards verify cocoa powder quality (PK3) | 3.88 | 1.08 | 1 | 5 |
| Food Safety Concern (FS) | Agricultural Environment Concern (EN) | Pricing Concern (PP) | Product Expertise (PK) | |||||||||
|---|---|---|---|---|---|---|---|---|---|---|---|---|
| Disagree | Neutral | Agree | Disagree | Neutral | Agree | Disagree | Neutral | Agree | Disagree | Neutral | Agree | |
| Gender | ||||||||||||
| Male | 1.48 | 0.49 | 48.28 | 3.45 | 3.45 | 43.35 | 4.93 | 6.40 | 38.92 | 7.88 | 6.40 | 35.96 |
| Female | 0.49 | 0.49 | 48.77 | 0.99 | 1.97 | 46.80 | 2.46 | 4.43 | 42.86 | 1.97 | 5.42 | 41.38 |
| Total | 1.97 | 0.99 | 97.04 | 4.43 | 5.42 | 90.15 | 7.39 | 10.84 | 81.77 | 9.85 | 11.82 | 77.34 |
| Education | ||||||||||||
| Primary school | 0.00 | 0.00 | 0.49 | 0.49 | 0.00 | 0.00 | 0.00 | 0.49 | 0.00 | 0.00 | 0.49 | 0.00 |
| Middle school | 0.49 | 0.49 | 3.94 | 1.48 | 0.00 | 3.45 | 0.00 | 0.00 | 4.93 | 0.00 | 0.99 | 3.94 |
| High school | 1.48 | 0.00 | 17.73 | 0.49 | 0.99 | 15.76 | 1.48 | 1.48 | 15.27 | 2.46 | 0.49 | 15.27 |
| Graduate | 0.99 | 0.49 | 58.13 | 1.97 | 2.96 | 54.68 | 2.96 | 7.88 | 48.77 | 6.40 | 7.88 | 45.32 |
| Post-graduate | 0.00 | 0 | 16.75 | 0.00 | 1.48 | 15.27 | 2.96 | 0.99 | 12.81 | 0.99 | 1.97 | 13.79 |
| Total | 2.96 | 0.99 | 97.04 | 4.43 | 5.42 | 89.16 | 7.39 | 10.84 | 81.77 | 9.85 | 11.82 | 78.33 |
| Gender | Food Safety Concerns (FS) | Agricultural Environment Concerns (EN) | Price Concerns (PP) | Product Expertise (PK) |
|---|---|---|---|---|
| df | 202 | 202 | 202 | 202 |
| MS | 0.317 | 0.52 | 0.57 | 0.74 |
| F | 1.23 | 5.22 | 4.63 | 7.53 |
| P(F ≤ f) one-tail | 0.27 | 0.023 | 0.033 | 0.018 |
| Prob > chi2 | 0.12 | 0.185 | 0.015 | 0.022 |
| Educational Level | Food Safety Concerns (FS) | Agricultural Environment Concerns (EN) | Price Concerns (PP) | Product Expertise (PK) |
|---|---|---|---|---|
| df | 202 | 202 | 202 | 202 |
| MS | 0.32 | 0.52 | 0.57 | 0.74 |
| F | 3.74 | 2.83 | 0.69 | 1.29 |
| P(F ≤ f) one-tail | 0.006 | 0.026 | 0.598 | 0.275 |
| Prob > chi2 | 0.001 | 0.67 | 0.107 | 0.997 |
| Observed Variables | Cronbach’s Alpha | Cronbach’s Alpha If Item Deleted |
|---|---|---|
| Food safety concern (FS) | ||
| The food safety of the product (FS1) | 0.778 | 0.728 |
| The quality of the product (FS2) | 0.629 | |
| The origin of the product (FS3) | 0.748 | |
| Agricultural environment concern (EN) | ||
| Large-scale pesticide and chemical fertilizer contamination (EN1) | 0.777 | 0.770 |
| The consequences of agriculture environmental pollution (EN2) | 0.559 | |
| The states of agriculture environmental pollution (EN3) | 0.741 | |
| Price concern (PP) | ||
| Compatibility with consumers’ payment capabilities (PP1) | 0.695 | 0.696 |
| Cocoa powder prices reflect product value (PP2) | 0.548 | |
| Cocoa powder prices compared to others (PP3) | 0.547 | |
| Product expertise (PK) | ||
| Cocoa powder product is organic (PK1) | 0.733 | 0.598 |
| Cocoa powder product is supervised by DNBR Management Board (PK2) | 0.700 | |
| International standards verify cocoa powder quality (PK3) | 0.640 | |
| WTP for the product (Y) | ||
| WTP for the organic labeled product (Y1) | 0.874 | 0.898 |
| WTP for the Tier 1 eco-labeled product (Y2) | 0.804 | |
| WTP for the Tier 2 eco-labeled product (Y3) | 0.769 | |
| WTP for the Tier 3 eco-labeled product (Y4) | 0.858 |
| Observed Variables | Components | ||||
|---|---|---|---|---|---|
| 1 | 2 | 3 | 4 | 5 | |
| Willingness to pay for the Tier 2 eco-labeled product (Y3) | 0.939 | ||||
| Willingness to pay for the Tier 1 eco-labeled product (Y2) | 0.872 | ||||
| Willingness to pay for the Tier 3 eco-labeled product (Y4) | 0.861 | ||||
| The quality of the product (FS2) | 0.880 | ||||
| The food safety of the product (FS1) | 0.800 | ||||
| The origin of the product (FS3) | 0.745 | ||||
| The consequences of agriculture environmental pollution (EN2) | 0.928 | ||||
| The states of agriculture environmental pollution (EN3) | 0.806 | ||||
| Large-scale pesticide and chemical fertilizer contamination (EN1) | 0.723 | ||||
| Cocoa powder product is organic (PK1) | 0.805 | ||||
| International standards verify cocoa powder quality (PK3) | 0.802 | ||||
| Cocoa powder product is supervised by DNBR Management Board (PK2) | 0.796 | ||||
| Cocoa powder prices reflect product value (PP2) | 0.830 | ||||
| Compatibility with consumers’ payment capabilities (PP1) | 0.779 | ||||
| Cocoa powder prices compared to others (PP3) | 0.708 | ||||
| Parameter | SE | SE-SE | Mean | Bias | SE-Bias | CR |
|---|---|---|---|---|---|---|
| Y ← FS | 0.205 | 0.006 | −0.003 | 0.004 | 0.009 | 0.444 |
| Y ← EN | 0.133 | 0.004 | 0.038 | −0.002 | 0.006 | −0.333 |
| Y ← PK | 0.155 | 0.005 | 0.389 | −0.001 | 0.007 | −0.142 |
| Y ← PP | 0.185 | 0.006 | −0.114 | 0.002 | 0.008 | 0.250 |
| Y3 ← Y | 0.000 | 0.000 | 1.000 | 0.000 | 0.000 | 0.000 |
| Y2 ← Y | 0.048 | 0.002 | 0.588 | 0.001 | 0.001 | 1.000 |
| Y4 ← Y | 0.059 | 0.002 | 0.766 | 0.002 | 0.003 | 0.666 |
| FS2 ← FS | 0.000 | 0.000 | 1.000 | 0.000 | 0.000 | 0.000 |
| FS1 ← FS | 0.153 | 0.005 | 0.909 | 0.010 | 0.007 | 1.428 |
| FS3 ← FS | 0.144 | 0.005 | 1.014 | 0.001 | 0.006 | 0.166 |
| EN2 ← EN | 0.000 | 0.000 | 1.000 | 0.000 | 0.000 | 0.000 |
| EN3 ← EN | 0.140 | 0.004 | 0.847 | 0.011 | 0.006 | 1.833 |
| EN1 ← EN | 0.107 | 0.003 | 0.627 | −0.003 | 0.005 | −0.600 |
| PK1 ← PK | 0.000 | 0.000 | 1.000 | 0.000 | 0.000 | 0.000 |
| PK3 ← PK | 0.171 | 0.005 | 0.961 | 0.021 | 0.008 | 2.625 |
| PK2 ← PK | 0.143 | 0.005 | 0.832 | −0.003 | 0.006 | 0.500 |
| PP2 ← PP | 0.000 | 0.000 | 1.000 | 0.000 | 0.000 | 0.000 |
| PP1 ← PP | 0.140 | 0.004 | 0.745 | 0.005 | 0.006 | 0.833 |
| PP3 ← PP | 0.209 | 0.007 | 1.366 | 0.024 | 0.009 | 2.666 |
Disclaimer/Publisher’s Note: The statements, opinions and data contained in all publications are solely those of the individual author(s) and contributor(s) and not of MDPI and/or the editor(s). MDPI and/or the editor(s) disclaim responsibility for any injury to people or property resulting from any ideas, methods, instructions or products referred to in the content. |
© 2023 by the authors. Licensee MDPI, Basel, Switzerland. This article is an open access article distributed under the terms and conditions of the Creative Commons Attribution (CC BY) license (https://creativecommons.org/licenses/by/4.0/).
Share and Cite
Nguyen, A.T.; Ha, V.D.; Ngo, H.K.; Le, N.A.; Khong, P.M.; Do, N.T.T.; Trinh, M.T.; Nguyen, T.D.; Ngo, T.Q.K.; Vu, L.C.; et al. Understanding the Importance of Eco-Labeling for Organic Foods at UNESCO Biosphere Reserves: A Case Study of the Cocoa Powder at the Dong Nai, Vietnam. Sustainability 2023, 15, 9603. https://doi.org/10.3390/su15129603
Nguyen AT, Ha VD, Ngo HK, Le NA, Khong PM, Do NTT, Trinh MT, Nguyen TD, Ngo TQK, Vu LC, et al. Understanding the Importance of Eco-Labeling for Organic Foods at UNESCO Biosphere Reserves: A Case Study of the Cocoa Powder at the Dong Nai, Vietnam. Sustainability. 2023; 15(12):9603. https://doi.org/10.3390/su15129603
Chicago/Turabian StyleNguyen, An Thinh, Van Dinh Ha, Huy Kien Ngo, Ngoc Anh Le, Phuong Mai Khong, Ngoc Tram Thi Do, Minh Thuan Trinh, Tuan Dat Nguyen, Tran Quoc Khanh Ngo, Linh Chi Vu, and et al. 2023. "Understanding the Importance of Eco-Labeling for Organic Foods at UNESCO Biosphere Reserves: A Case Study of the Cocoa Powder at the Dong Nai, Vietnam" Sustainability 15, no. 12: 9603. https://doi.org/10.3390/su15129603
APA StyleNguyen, A. T., Ha, V. D., Ngo, H. K., Le, N. A., Khong, P. M., Do, N. T. T., Trinh, M. T., Nguyen, T. D., Ngo, T. Q. K., Vu, L. C., Do, M. L. T., Le, A. T., Tran, B. M., & Nguyen, V. T. (2023). Understanding the Importance of Eco-Labeling for Organic Foods at UNESCO Biosphere Reserves: A Case Study of the Cocoa Powder at the Dong Nai, Vietnam. Sustainability, 15(12), 9603. https://doi.org/10.3390/su15129603