Article

Numerical Simulation of the Flood and Inundation Caused by Typhoon Noru Downstream from the Vu Gia-Thu Bon River Basin

1
Viet Nam Meteorological and Hydrological Administration, Hanoi 10000, Vietnam
2
Vietnam Journal of Hydrometeorology, Viet Nam Meteorological and Hydrological Administration, Hanoi 10000, Vietnam
3
Institute of Geophysics, Vietnam Academy of Science and Technology, Hanoi 10000, Vietnam
4
Northern Delta Regional Hydro-Meteorological Center, Viet Nam Meteorological and Hydrological Administration, Hanoi 10000, Vietnam
5
Faculty of Environmental Sciences, University of Science, Vietnam National University, Hanoi 10000, Vietnam
6
Transport Development & Strategy Institute, Ministry of Transport, Hanoi 10000, Vietnam
7
Vietnam Institute of Meteorology, Hydrology and Climate Change, Hanoi 10000, Vietnam
*
Author to whom correspondence should be addressed.
Sustainability 2023, 15(10), 8203; https://doi.org/10.3390/su15108203
Submission received: 5 April 2023 / Revised: 12 May 2023 / Accepted: 14 May 2023 / Published: 18 May 2023

Abstract

:
Typhoon Noru (2022) was a historic storm that caused significant damage to the central region of Vietnam. Typhoon Noru has caused strong winds and torrential rainfall in Da Nang, Quang Nam, and Quang Ngai. Quang Nam Province saw many trees and power lines fall, and many areas were flooded. The Da Nang government has reported the typhoon toppled many trees, blew the rooftops of three houses, damaged the walls of several schools, and caused a power outage at some 3200 substations. It resulted in widespread flooding in coastal areas and downstream from the Vu Gia-Thu Bon River river basin. This study evaluates the impact of Typhoon Noru. The results show that: (1) The numerical simulation was applied to re-analyze the offshore meteorological field with the Coupled Ocean–Atmosphere–Wave–Sediment Transport (COAWST) model as an input for 2D wave propagation and hydraulic models; (2) The study couples the 1D and 2D models in MIKE FLOOD to simulate the flood and inundation caused by Typhoon Noru in the study area. The calibration and validation results of the 1D hydraulic model, the 2D wave propagation model, and the 2D hydrodynamic model were reasonably good, with a Nash coefficient ranging from 0.84 to 0.96 and a percent bias (BIAS) of −0.9% to 7.5%. The results of the simulation showed that the flood and inundation caused by Typhoon Noru resulted in significant damage in two districts: Thang Binh in Quang Nam province and Hoa Vang in Da Nang province. The practical significance of these results is that they provide valuable support for warning systems and troubleshooting efforts related to the impact of typhoons.

1. Introduction

Floods and inundations caused by storms or storm surges often result in heavy damage to coastal areas and the areas downstream from river basins worldwide [1,2,3]. The coastal area is a highly sensitive ecological environment and is vulnerable to the impact of rises in sea levels, waves, and high tides caused by storms, tropical cyclones, and circulation [4,5,6]. Many studies have been conducted to evaluate the effects of storm surges that cause floods and inundations [7,8,9,10,11]. There are three main causes, namely, meteorology, hydraulics, and hydrology, that affect the characteristics of storm surges, floods, and inundations. The study of the interaction between the sea and the atmosphere has been quite popular, and the dynamical and meteorological components have been analyzed and simulated through modeling. However, the hydrological component of the interaction has only received attention in recent years [12,13]. Storm surge scenarios of flooding in previous studies have shown that the contribution of hydrological components such as river discharge and in situ rainfall contribute significantly to increased inundation for coastal areas and downstream areas of rivers. Therefore, studies showing the interaction between tides and rising water have profound importance in the operation of storm surge forecasting systems [14,15]. The interaction between the hydrological and hydrodynamic components in the river under storm surge conditions can significantly alter the characteristics of the surge as well as the flooding scenarios along the lower reaches of the river [14,15].
Previous studies on the interaction between tides and rivers have been published [16,17,18,19], and there are also a few studies that discussed the interaction between rivers and rising tides [20,21]. Therefore, studies on integrating hydrological components into storm surge models are still under development [22]. For example, a storm surge caused by Hurricane Isaac (2012) as it made landfall in southern Louisiana was simulated using the SWAN + ADCIRC modeling system for coastal waves and circulation [23]. A storm surge in the low-lying delta of Bangladesh was simulated using a combination of wave and hydrodynamic modeling (SWAN + ADCIRC) [13]. Additionally, hydrodynamic and coastal hydrodynamic models were combined to evaluate the performance of a real-time forecasting system during Hurricane Irene (2011) [24]. The use of a surge, wave, and tidal model (SuWAT) was combined to simulate storm surges for three storms: Xang-sane (2006), Ketsana (2009), and Nary (2013) [24]. Furthermore, the use of surge, wave, and tidal models (SuWAT) was combined to simulate storm surges for two storms: Frankie (1996) and Washi (2005) [25]. Models were also developed to predict/prevent storm surges at Sakaiminato Port, Torrori, Japan, using the method of data processing (GMDH) algorithms for Typhoons Maemi (2003), Songda (2004), and Megi (2004) [26]. Finally, a summary of previous studies shows that the results only focus on individual problems such as waves, tides, and storm surges combined using open-source models (SWAN, SuWAT, etc.). There has not been an overall study to comprehensively evaluate flooding in the river, sea-atmosphere interactions, waves, and inundation on the coast.
Vietnam has a coastline of 3260 km from north to south. According to statistics from the National Center for Hydrometeorology Forecasting (NCHMF), every year in the East Sea, there are about 9 to 10 typhoons and 3 to 4 active tropical depressions, of which about 5 to 6 storms and 2 to 3 tropical depressions directly affect the mainland of Vietnam. This study focused on analyzing and evaluating the effects of Typhoon Noru, which caused floods and inundation in Quang Nam province and Da Nang City. The storm formed on 21 September 2022 and dissipated on 28 September 2022. This is considered to have been the strongest storm in the past 20 years since Typhoon Xangsane (2006) made direct landfall in Da Nang City [27,28]. To date, there has not been a study that analyzed and evaluated the impact of Typhoon Noru and how it caused floods and inundation in Quang Nam province and Da Nang City.
This is the first study that comprehensively simulated and evaluated the impact of storm surges, tides, waves, floods, and inundation using a combination of hydraulic, atmospheric, and rainfall-produced wave, flood, and inundation models (MIKE 11, Coupled Ocean–Atmosphere–Wave–Sediment Transport (COAWST), MIKE 21SW, MIKE 21 FM, MIKE FLOOD) and GIS tools to simulate and display the results of flooding in the areas affected by Typhoon Noru. Usually, coupled flood models have focused on the effects of only one of the components (storm surges, tides, waves, floods, sediment transport, etc.) [29,30,31,32,33], which leaves a gap in the precise representation of the combined interactions among them [34].
The study objectives were: (1) To apply the atmospheric and rainfall figures produced by the COAWST model to simulate and evaluate the wave propagation results of Typhoon Noru. (2) To establish the coupled mesh domain in 1D and 2D to simulate wave propagation from the sea to the rivers. (3) To use the hydraulic model FM in a 2D model to analyze the hydraulic regime. (4) To use the coupled 1D and 2D MIKE FLOOD model to calculate and determine the depth of the flood before, during, and after the typhoon.
This study is structured as follows: Section 2 introduces the study site, the methods used, the numerical model, and its setup. Section 3 presents the results of model calibration and validation of the 1D hydraulic model, the 2D wave propagation model, the 2D flow regime, and the simulation of the flooding and inundation caused by Typhoon Noru. Section 4 discusses a lack of comparative analysis with the study results. Finally, Section 5 summarizes the major findings of this study and future work to improve the quality of the study results.

2. Materials and Methods

2.1. Description of the Study Site

According to the World Meteorological Organization, Vietnam is located in the area of the Northwest Pacific typhoon zone, with about 30 typhoons per year and accounting for 38% of global typhoons [35]. Statistics from the National Center for Hydrometeorology Forecasting (NCHMF) show that every year in the East Sea, there are about 9 to 10 typhoons and 3 to 4 active tropical depressions, of which about 5 to 6 typhoons and 2 to 3 tropical depressions directly affect the mainland of Vietnam. As a result, every year, Vietnam suffers heavy damage caused by typhoons in terms of both people and property. Improving forecasts of the location, intensity, and area of strong winds during typhoons will contribute to ensuring the safety of fishers at sea. Better forecasting of the time and location of landfall, heavy rain zones, and areas of strong winds will contribute to minimizing the number of deaths and missing people and reducing the economic damage caused by a typhoon.
The central coastal region is an area with harsh natural conditions that are affected by many natural disasters and dangers. In recent years, the central region has been greatly affected by climate change, storms, floods, and rising sea levels. Statistics from the past four decades, from the 1970s to the present, show that the intensity and frequency of storms and regional flooding are increasing [36].
The Vu Gia-Thu Bon River river basin is a major river basin of Vietnam and an important river basin of the central region (Figure 1). The Vu Gia-Thu Bon River basin is representative of the central river basins, with a short, steep terrain and a fast flood concentration time in the basin and the mainstream, combined with narrow plains and very poor flood storage and flood regulation. As a result, this area often experiences widespread flooding every year. Under the impact of climate change, increasingly extreme rains and storms are increasing the level of danger for buildings and downstream areas. The Vu Gia-Thu Bon River river basin, the coast, and the sea are interrelated. Therefore, flooding downstream from the Vu Gia-Thu Bon River river basin, in addition to being caused by heavy rains upstream, is also relatively strongly affected by sea level rises due to flooding. Therefore, this study focused on researching and applying simulation models of floods and inundation in the areas downstream from the Vu Gia-Thu Bon River river basin under the impact of sea level rises caused by Typhoon Noru, which occurred in September 2022.

2.2. Methodology

The outline of the study is presented in Figure 2. This study used the re-analyzed wind field from the COAWST model to simulate and evaluate wave propagation for the MIKE 21 SW model of Typhoon Noru. The study established the coupled mesh domain in 1D and 2D to simulate the propagation of waves from the sea to the river. The hydraulic model FM in the 2D model was used to analyze the hydraulic regime. A coupled 1D–2D model, the MIKE FLOOD model, was used to calculate the depth of the flood before, during, and after the typhoon (Figure 2).

2.2.1. Description of the COAWST Model

The COAWST 3.7 model system is a state-of-the-art, community-based, open-source modeling framework that allows for the simulation of complex physical processes in the coastal ocean and atmosphere, as well as the transport of sediments and the generation of waves [37]. The COAWST model system is a powerful tool for studying the impacts of climate change, coastal hazards, and oceanographic processes in coastal regions and has been widely used in research and operational applications [38].
The COAWST model system is based on the coupling of several models, including the Weather Research and Forecasting (WRF) atmospheric model, the Regional Ocean Modeling System (ROMS), the Simulating Waves Nearshore (SWAN) model, and the Community Sediment Transport Model (CSTM) [39]. The COAWST model system allows for two-way coupling between the atmosphere and the ocean, as well as one-way coupling between the ocean and waves and between the waves and sediment transport. The system is highly configurable, allowing users to choose which models to use, the spatial and temporal resolutions, and the boundary conditions, among other options.
The COAWST model system has been used in a variety of applications, including studies to predict typhoon-related coastal flooding and erosion [40], the impact of storms on coastal communities [41], and the effects of climate change on coastal ecosystems [42]. The system has also been used for operational forecastings, such as predicting storm surges and flooding during hurricanes and typhoons [43,44,45,46,47]. For example, the author of [48] applied a high-resolution COAWST model to simulate storm surges and inundation in the northern Gulf of Mexico during Hurricane Laura. The author of [49] used a COAWST model to simulate the storm surges and inundation in the East China Sea during Typhoon In-Fa. The results showed that the COAWST model accurately simulated the storm surges and inundation along the coast, and the model could be used for early warning systems and decision-making during typhoon events.
Previous studies have demonstrated that the COAWST model system can accurately simulate storm surges and inundations along the coast and provide valuable information for early warning systems and decision-making during typhoon events. This study applied the COAWST model system to simulate atmospheric and rainfall factors for evaluating the results of the SW wave propagation model for Typhoon Noru.

2.2.2. Description of the 1D and 2D Models

(a)
One-Dimensional Hydraulic MIKE 11 Model
MIKE 11 HD by DHI, Denmark (2014) is applied for the dynamic description of waves. It solves the vertically integrated equations of the conservation of continuity and momentum (the Saint Venant equations) [50] based on the following assumptions.
The derivation of the equations of continuity and momentum, as used by MIKE 11, are as follows:
Q x + A t = q
Q t + α Q 2 A x + g A h x + g Q Q C 2 A R = 0
where Q is the discharge, A is the area of the flow, q is the lateral inflow, h is the stage above the datum, C is the Chezy resistance coefficient, R is the hydraulic or resistance radius, and α is the distribution coefficient of the momentum.
The solution of the equations of continuity and momentum was based on the implicit finite difference scheme developed by [50]. The scheme was structured to be independent of the specific wave description (i.e., kinematic, diffusive, or dynamic).
(b)
MIKE 21 SW Wave Propagation Model
The dynamics of the gravity waves are described by the transport equation for the density of the waves’ action. For small-scale applications, the basic transport is usually formulated in Cartesian coordinates, while spherical polar coordinates are used for large-scale applications. The density spectrum of waves’ action varies in time and space and is a function of two parameters of the wave phase [51]. The two parameters of the wave phase are the vector of the wave number k with a magnitude of k and the direction of θ. Alternatively, the parameters of the wave phase can be the waves’ direction, θ, and either the relative (intrinsic) angular frequency, σ = 2πƒa, or the absolute angular frequency, ω = 2πƒa. In the present model, a formula for the waves’ direction, θ, and the relative angular frequency, σ, was chosen [52]. The density of action, N(σ,θ), is related to the energy density E(σ,θ) by Equation (3):
N = E σ
For the propagation of waves over slowly varying depths and currents, the relationship between the relative angular frequency (as observed in a frame of reference moving with the current’s velocity) and the absolute angular frequency, ω, (as observed in a fixed frame) is given by the following linear dispersion relationship:
σ = g k   t a n h ( k d ) = ω k · U
where g is the acceleration of gravity, d is the depth of the water depth, and U is the current’s velocity vector. The magnitude of the group velocity, cg, of the wave’s energy relative to the current is given by Equation (5):
c g = σ k = 1 2 1 + 2 k d s i n h ( 2 k d ) σ k
The phase velocity, c, of the wave relative to the current, is given by Equation (6):
c = σ k
The frequency spectrum is limited to the range between a minimum frequency, σmin, and the maximum frequency, σmax. The frequency spectrum was split into a deterministic prognostic part for frequencies lower than the cut-off frequency and an analytical, diagnostic part for frequencies higher than the cut-off frequency. A dynamic cut-off frequency depending on the local wind speed and the mean frequency was used, as in the WAM Cycle 4 model [53]. The deterministic part of the spectrum is determined by solving the transport equation for the density of wave action using numerical methods. Above the cut-off frequency limit of the prognostic region, a parametric tail was applied.
E σ , θ = E σ m a x , σ σ σ m a x m
where m is a constant, and the present model applied is m = 5. The maximum prognostic frequency was determined as
σ c u t - o f f = m i n σ m a x , m a x ( 2.5 σ ¯ , 4 σ P M )
where σ m a x is the maximum discrete frequency used in the deterministic wave model, σ ¯ is the mean relative frequency and σ P M = g / ( 28 u 10 ) is the Pierson–Moskowitz peak frequency for fully developed waves (U10 is the wind speed 10 m above the mean sea level). The diagnostic tail was used in the calculation of the non-linear transfer and the calculation of the integral parameters used in the source functions. Below the minimum frequency, the spectral densities were assumed to be zero [52].
(c)
Two-Dimensional Hydraulic MIKE 21 Model
The MIKE 21 FM (2014) module is a two-dimensional model for calculating the flow in a vertically homogeneous fluid layer [54]. The flow’s modulus is solved by the finite element grid method. This module is based on the solution of the Reynolds-averaged Navier–Stokes equations for 2- or 3-dimensional incompressible fluids combined with the Boussinesq hypothesis and the hydrostatic pressure hypothesis. The two-dimensional elements can be triangular or quadrangular. Through the integration of the horizontal momentum equations and the continuity equation over the depth h = η + d, the following two-dimensional equations for shallow water can be obtained:
h t + u x + v y + w z = S
where t is time; x, y, and z indicate the direction in Cartesian coordinates; η is the surface elevation; d is the depth of still water; h = η + d is the total depth of the water; u, v, and w are the velocity components in the x, y, and z directions, respectively; S is the magnitude of the discharge due to point sources; and (us, vs) is the velocity at which the water is discharged into the ambient water [55].
(d)
The MIKE FLOOD Simulation Model
A dynamic link between the one-dimensional model and the two-dimensional model was developed in the form of a pair of points, where the endpoint of the tributary was assigned to a point or region in the two-dimensional model, e.g., the river flowing in or out of the lake. The types of connections in MIKE FLOOD (2014) [56] include standard links, lateral links, structure links, and zero flow links. In a standard connection, one or several grid cells of MIKE 21 are linked to one end of the flow in MIKE 11. Standard connections are available when only the ends of a stream have water pouring out, such as water pipes. In a lateral connection, a sequence of grid cells in MIKE 21 will be linked to either side of a flow segment (a section, a flow section, or an entire flow). We used lateral links when the current was likely to overflow, such as rivers and the sea [54]. MIKE FLOOD has the following model connection types: HD coupling, AD coupling, and both dynamic and propagandistic connections. The connection depends on the requirements of each problem [56].

2.2.3. Setting Up the Model

(a)
Model Input
This study used the following data as input for the model:
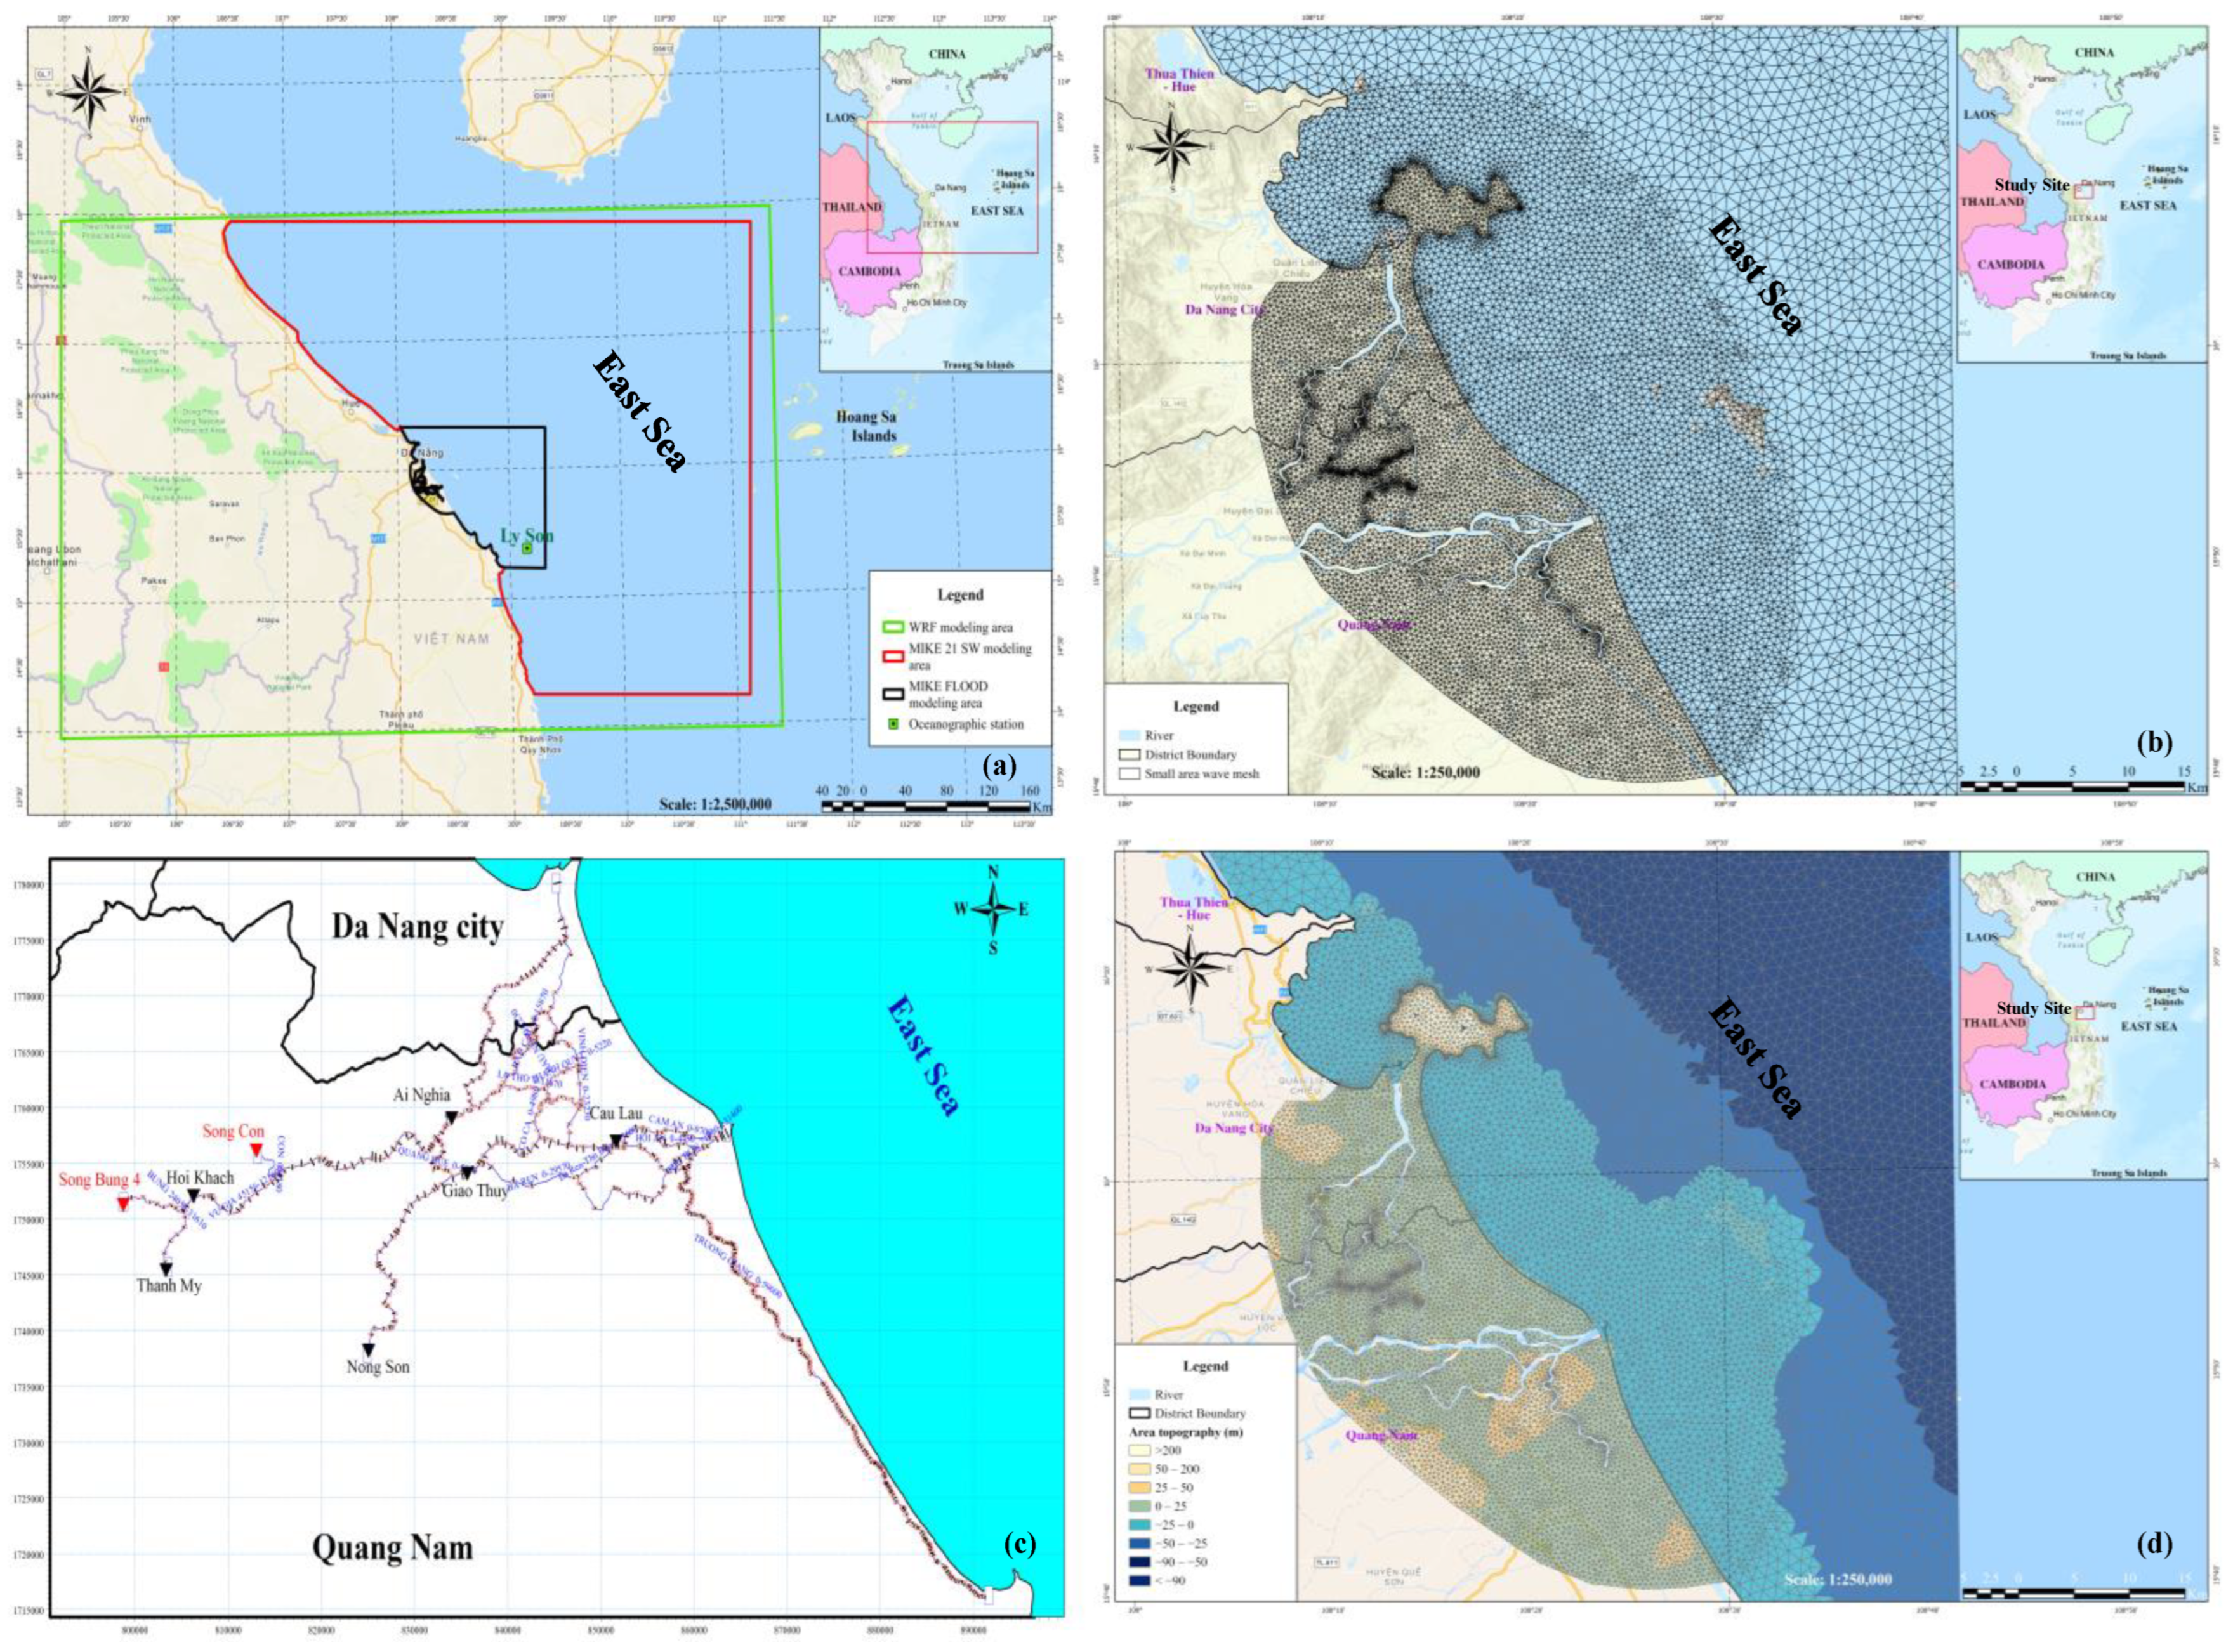
Discharge data from the hydrographic stations of Nong Son and Thanh My (Figure 3c);
Water level data from the stations of Hoi Khach, Ai Nghia, Giao Thuy, Cau Lau, Hoi An, Son Tra, and Ly Son (Figure 3a,c);
For some coastal estuary locations where there was no measuring station, this study used the tides predictions in the MIKE 21 toolbox as the lower boundary for the calculation model (Figure 3d);
Meteorological data from the COAWST model with a resolution of 0.125° (14 km);
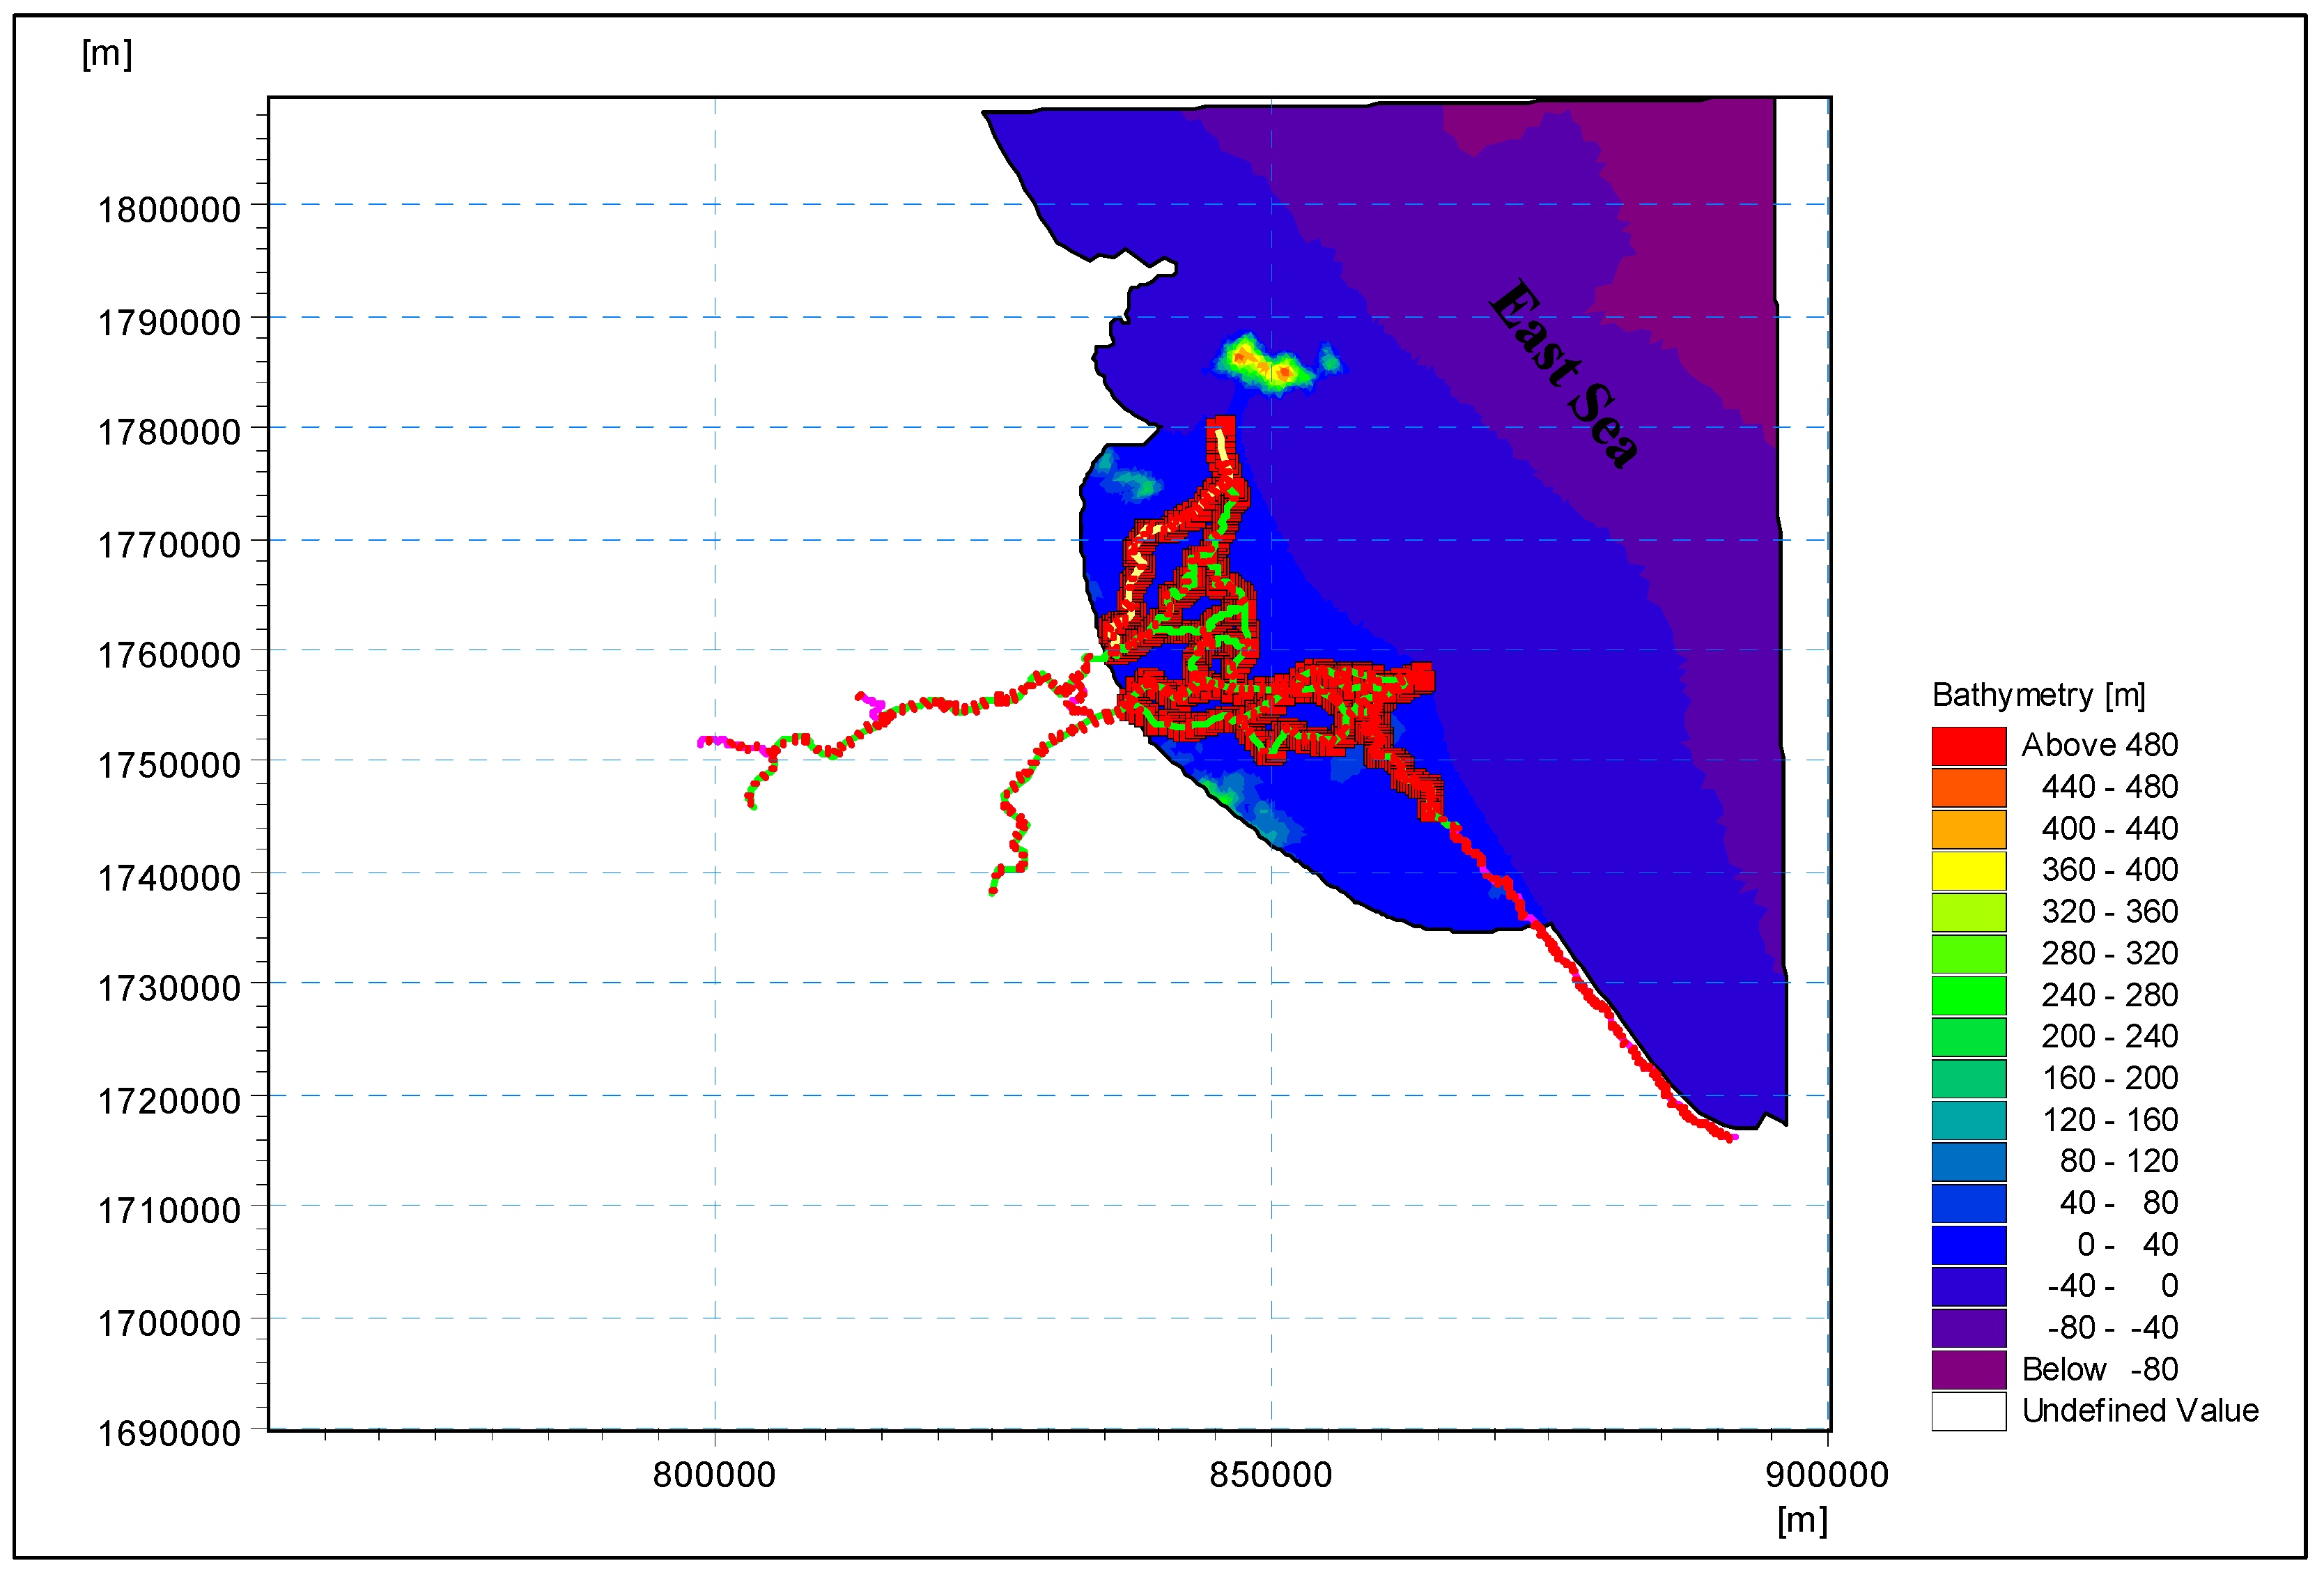
Topography: DEM 30 m × 30 m;
The study established an integrated mesh of the meteorological, wave, and hydraulic data at the study site and detailed mesh coupling of rivers and the sea (Figure 3a,b).
(b)
MIKE 11 HD Model
The hydraulic network of the MIKE 11 HD model was established for the Vu Gia-Thu Bon River river system: Vu Gia River, Thu Bon River, Bung River, Cai River, Con River, Co Co River, Vinh Dien River, Ba Ren River, La Tho River, and Ai Nghia River (Figure 3c).
(c)
MIKE 21 SW Model
To obtain a wave field for the study area, it was necessary to simulate the wave field for the wider area, so the calculation range of the selection model was as shown below. The wide area of the simulated waves ensured that the scale of the wind’s momentum was large enough to form a wave mode that propagated into the coastal area to create a high-precision wave field. The domain used for the area of the MIKE 21 SW model was limited from longitudes of 106°44′ E to 111°23′ E and latitudes of 14°23′ N to 17°88′ N.
After simulating the waves for the entire large area, this study set the domain for the study area, using the wave transmission function from the deep-water wave model to the study area with the margins scaled.
A small grid area was modeled for the area of 108°02′ E to 109°32′ E and 15°24′ N to 16°31′ N. The grid of signal h was selected as a grid combining unstructured grids, and the domain had a mesh of 24,000 elements and 1300 grid nodes. In particular, the area was set up with a relatively detailed grid with a smooth resolution in the coastal area, with the smallest mesh edge being about 10 m. The zone was set up with a rough grid in the offshore area, with the largest mesh edge being 1000 m (Figure 3d).
(d)
MIKE 21 FM Model
The MIKE 21 FM model was set up using the same mesh as the MIKE 21 SW model, with the marginal data being the tidal water level obtained by DHI’s MIKE 21 toolbox. The MIKE 21 model, once set up for the study area, was connected to the simulated hydrometry network in the MIKE 11 model described above to establish the MIKE FLOOD model that simulated flooding over the study area.
(e)
MIKE FLOOD Model
The MIKE FLOOD model was established on the coupled link between MIKE 11 and MIKE 21 for the study area. The link was lateral, connecting the left and right banks. For the chainage of the river’s end, the link was the standard link for the hydraulic connection between MIKE 11 and MIKE 21 (Figure 4).

3. Results

3.1. Calibration and Validation of the Hydraulic Model

3.1.1. Calibration and Validation of the MIKE 11 HD Model

The results of the calibration and validation of the water level in the MIKE 11 HD model were used to find a suitable parameter for the Vu Gia-Thu Bon River basin during the floods from 15 October 2019 to 15 November 2019 and on 1–31 October 2020 at the hydrological locations of Hoi Khach, Ai Nghia, Giao Thuy, and Cau Lau (Figure 5 and Figure 6). The calibration and validation results showed that the error index reached an outstanding level, with the Nash index ranging from 0.84 to 0.96 and the PBIAS error ranging from −0.9 to 5.9% (PBIAS < ±10%) for both calibration and validation (Table 1) [57]. The parameters of MIKE 11 HD were used to simulate and calculate a pair of 1D–2D models to evaluate the impact of flooding and inundation in the areas downstream from the Vu Gia-Thu Bon River river basin. The bed resistance (Manning number) of the rivers was from 0.023 to 0.032 (s/m1/3), and the timestep was 5 s.

3.1.2. Calibration and Validation of the MIKE 21 SW Model

The calibration and validation of wave height used the Coupled Ocean–Atmosphere–Wave–Sediment Transport (COAWST) model [37,38,39,40] for a re-analysis of the simulated wind field. The COAWST model was established with a definition of 0.125° (14 km) from longitude 105°00′ E to 111°40′ E and latitude 14°00′ N to 18°00′ N (Figure 3a). The calibration and validation of wave height used the data from the Ly Son marine station during the floods from 15 October 2019 to 15 November 2019 and 1–31 October 2020, respectively (Figure 7a,b). An assessment of the results of calibration and validation with the Nash index ranged from 0.68 to 0.79, and PBIAS ranged from 4.4 to 7.5 (PBIAS < ±10%) for both calibration and validation (Table 2). The set of parameters used for the MIKE 21 SW model wave propagation model are presented in Table 3.
Generally, the errors in the waves’ height and pattern were within the permissible range. The model was calibrated to ensure reliability, and it could be used to forecast waves in the study area. The results of the maximum wave height simulated for Typhoon Noru are presented in Figure 8. The time of the sea level rise during Typhoon Noru was from 11:00 p.m. on 27 September 2022 to 14:00 p.m. on 28 September 2022. According to the water level observed at the hydrographic stations, the biggest sea level rise during Typhoon Noru at the Ly Son station (Quang Ngai Province) was 1.1 m.

3.1.3. Calibration and Validation of the MIKE 21 FM Model

The calibration and validation of the MIKE 21 FM used the water level at the Ly Son marine station from 15 October 2019 to 15 November 2019 and 1–31 October 2020, respectively (Figure 9). The results of calibration and validation based on the Nash and PBIAS criteria showed high similarity in the phase and amplitude of oscillations (Table 4). The results for the offshore water levels and flow rates in the river showed that the hydraulic parameters of the MIKE 21 FM model were relatively suitable for the study area. Therefore, it would be possible to use the MIKE 21 FM model to simulate the impact of the hydraulic regime on flooding and inundation in the study area. Table 5 presents the set of parameters of the hydraulic model.

3.2. Results of Flooding and Inundation

Typhoon Noru formed on 22 September from a tropical depression east of the Philippines. After three days of approaching Luzon Island, the depression strengthened into a super-typhoon with winds from 185 to 210 km/h. The super-typhoon then went westward, entering the mainland of the central provinces and cities of Vietnam, causing very heavy rain, followed by floods, flash floods, and landslides. In fact, due to the influence of Typhoon Noru, from the afternoon of 25 September, the eastern sea in the north and the middle of the East Sea had strong winds, gradually increasing up to Category 8–9 and then to Category 10–11. The area near the center of the typhoon passed Category 12–13, with gusts reaching Category 16. The sea waves were 6–8 m high, those in the area near the center of the typhoon were 8–10 m high, and the sea was violent. At 7:00 p.m. on 27 September, Typhoon Noru’s winds reduced to 195 km/h (Category 16). However, by 7:00 a.m. on 28 September, the strongest winds near the center of the typhoon were expected to remain at 165 km/h (Category 14) [28]. At 9:00 p.m. on 27 September, the National Center for Hydrometeorological Forecasting said it had measured a Category 10, Category 12 hurricane, up one level from several hours earlier. The islands also recorded increased hurricane levels; for example, Con Co recorded Category 7 and Category 9, and Dong Hoi, Hue, and Da Nang recorded Category 7.
The results of the simulation of the COAWST model relatively accurately forecasted the trajectory and intensity of typhoons in the East Sea and forecasted the area of heavy rain and strong winds during the typhoon’s landfall that affected the central region (Figure 10), so the results of simulating the flood in the study area were quite close to reality (Figure 11). After the typhoon weakened to a tropical depression under the influence of rain, the tropical convergence band formed by Typhoon Noru continued to cause moderate rain, heavy rain, and very heavy rain and caused widespread flooding in the north-central areas. Thus, if the study’s calculation areas were expanded, it would be possible to assess not only the impact caused by Typhoon Noru when it came inland but also the impact of heavy rains after the typhoon on neighboring areas, which was an avenue for future study.
The study used the results of Typhoon Noru simulated with the COAWST model and combined with the MIKE FLOOD model to simulate flooding and inundation in the areas downstream from the Vu Gia-Thu Bon river basin at the time before the storm made landfall, when the storm made landfall, and after the storm weakened.
From the morning of 27 to 28 September, due to the influence of circulation, Typhoon Noru weakened into a tropical depression and then into a low-pressure area over Southern Laos, so there was heavy rain in the central region. The rainfall from 07:00 h on 27 September to 13:00 h on 28 September in Da Nang and Quang Nam was 300–400 mm and over 450 mm in some places. The simulation of the flood in the Vu Gia-Thu Bon River on 27–29 September 2022 showed that the peak flood at the Hoi Khach and Ai Nghia stations on the Vu Gia River at 11:00 h and 14:00 h on 28 September 2022 was 15.35 m (<BD2 = 0.15 m) and 8.87 m (<BD3 = 0.13 m), respectively; the peak flood at the Giao Thuy and Cau Lau stations on the Thu Bon River at 15:00 h and 21:00 h on 28 September 2022 was 7.64 m (>BD2 = 0.14 m) and 3.41 m (>BD2 = 0.41 m), respectively (Figure 11). The flood’s amplitude fluctuated on Vu Gia River from 5.37 m to 6.04 m. The fluctuation on Thu Bon River was from 2.87 m to 6.65 m.
The map (Figure 12) shows the flooded part of the study area before the typhoon made landfall and after Typhoon Noru weakened into a tropical depression and off the area outside the mainland of Quang Nam Province and Da Nang City. The results for the flooded area by the administrative unit are shown in the statistics of the corresponding flood area in Table 6, Table 7 and Table 8. The total area of flooding before the typhoon made landfall was smaller than after the typhoon made landfall. This is reasonable because before the typhoon made landfall, the downstream area was mainly flooded due to heavy rains that caused an overflow at the shore, but when the typhoon made landfall, heavy rains combined with the sea level rise caused by the typhoon made the flooding worse, especially in coastal areas with a low terrain such as Thang Binh, Dien Ban, Hoi An, and Hoa Vang.
Detailed results of the flooded area by the district in Quang Nam Province and Da Nang City before and after Typhoon Noru fell (Figure 13) are as follows:
Quang Nam Province: After the typhoon made landfall, the flooded area increased significantly, partly due to heavy rains combined with sea level rise caused by the typhoons, which made water from the river not only not drain into the sea but also flow back into the river. In coastal districts, strongly influenced by the lower margin of the sea level (e.g., Thang Binh, Dien Ban, and Hoi An), the area and depth increased significantly. After the typhoon passed, Quang Nam was still deeply flooded in some locations because although the seawater had receded and the water could drain from the river, the hydropower upstream discharged floods;
Da Nang City: Similar to Quang Nam Province, Da Nang City also had heavy rains before the typhoon made landfall. After it made landfall, heavy rains caused the river water to increase rapidly, overflowing the banks and flooding many areas of Da Nang. When Typhoon Noru went inland, the sea level rise reduced the ability of the river to drain, and the flooding was aggravated. After Typhoon Noru passed, the sea level lowered, the river water drained into the sea, and the water level of the rivers decreased, increasing the drainage capacity. Therefore, the city was almost no longer flooded.
Early forecasts of the time when the storm will make landfall, as well as warnings about the risk of inundation caused by rainstorms, will help the district’s People’s Committees to proactively come up with an effective and timely response plan. For example, the simulation results showed that Thang Binh district (Figure 13a) had the deepest and widest area of flooding in Quang Nam Province. Thang Binh district is agricultural, with nearly 60% of the population engaged in agricultural production, and the area of agriculture is 29,081 ha, accounting for 70.5% of the district’s area. At present, the proposed response plan is to proactively harvest rice and vegetables early, and check the operation of the pump system, etc., to minimize the consequences that the storm has in that district.
For Da Nang City, the results of the simulation showed that the Hoa Vang district (Figure 13b) was the most affected by flooding. Hoa Vang is an agricultural district and has the famous tourist area Ba Na and Nui Chua. Therefore, when the results of the simulation indicated the possibility of large-scale inundation, the district’s People’s Committee should not only formulate plans to reduce the damage to agriculture but also take proactive measures regarding the response of the tourism industry such as mapping the route with the possibility of deep flooding, prolonged flooding, etc., and providing complete and accurate information early so that visitors can arrange the most favorable travel schedule.

4. Discussion

The results showed that forecasts of the trajectory and intensity of typhoons in the East Sea, the heavy rains, and strong winds associated with landfalling typhoons affecting the central region, combined with flood simulation models, will give warnings based on the impact caused by typhoons and floods on each specific object. This study was limited to the statistics of flooded areas by administrative unit. However, these, if combined with other databases such as agricultural production and aquaculture, can be used to issue a warning bulletin for each specific audience, supporting detailed scenarios to support decision-making.
Quang Nam Province and Da Nang City are one of the areas frequently affected by typhoons. Damage is caused by typhoons every year, especially in the lower Vu Gia-Thu Bon River river basin, where there is a large population and a strong tourism industry. Currently, there have been many studies related to the problem of adapting to as well as mitigating the impacts of climate change in general and of typhoons and floods in the study area. However, most of the study results have only provided methods to predict the likelihood of typhoons or heavy rains occurring in the region or to assess the impact of typhoons on Da Nang’s society and economy. However, these have been limited to sporadic studies, without providing warnings based on specific impacts when typhoons occur so those responsible can proactively take effective measures, minimizing the possible damage.
Through applying the COAWST model, a warning system based on the impact of typhoons and floods in Vietnam can be built with high accuracy, which may become one of the effective support tools for supporting decisions to respond to typhoons and floods at all levels of government. Currently, in Vietnam, there are no studies that have applied the COAWST model to simulate storms. Most studies have only used the WRF model to simulate the meteorological field without combining it with the simulation of ocean waves. Some storm forecasting studies can be mentioned, such as a study evaluating the heavy rain predicted by the WRF model due to the formation of cold air combined with high easterly winds for the central region [58]. Another study applied numerical modeling (SWAN + SuWAT) [24] to examine the storm surges of Typhoon Xangsane [59] and Ketsana [60] on the central coast of Vietnam. The author of [61] determined the influence of moving speeds, wind speeds, and sea level pressures on after-runner storm surges in the Gulf of Tonkin, Vietnam. The author of [62] found results for 24 h to 48 h rainfall forecasts but did not give any possible impacts or apply the WRF model for forecasting weather and storms in Vietnam. By researching and applying the WRF model to forecast storms in the East Sea, this study used the combination of storm forecasting models and a model for simulating inundation to draw a map of inundation under the impact of hurricanes [24,59,60]. The study results clearly showed the area that is likely to be flooded when the storm passes instead of just predicting the path of the storm.
There have been several domestic and foreign studies on the formation mechanism of storms operating in the East Sea. The use of the high-resolution three-dimensional ocean–atmospheric interaction model in this study has provided an in-depth understanding of the mechanism of the formation of storms that make landfall and affect the central region of Vietnam. The model needed to be updated and implemented. This is the first study that comprehensively simulates and evaluates the impact of storm surge, tide, wave, flood, and inundation using a combination of models (MIKE 11, COAWST, MIKE 21SW, MIKE 21 FM, and MIKE FLOOD) and GIS tools to simulate and display the results of flooding and inundation in areas affected by Typhoon Noru. Thus, to evaluate the accuracy of the study results, it will be necessary to verify with the field survey data to calibrate and validate the model when applying simulations to evaluate similar storms in the future. The methodology of this study can be applied to simulate and evaluate the impact of storm surges, tides, waves, floods, and inundation using a combination of hydraulic, atmospheric, and rainfall produced, wave, flood, and inundation models for other areas or catchments in Vietnam.

5. Conclusions

The study has combined meteorological models and hydrological models to initially issue warnings based on the impacts caused by typhoons on people downstream of Vu Gia-Thu Bon River, piloted with data from Typhoon Noru—one of the major typhoons that severely affected Quang Nam Province and Da Nang City in September 2022. The COAWST model system applied to forecast storms with a hydraulic model to calculate the flow and a flood model to simulate the flooded area will improve the results of forecasting. The combination of meteorological, wave, hydrological, and hydrographic models not only provides results for forecasting natural disasters but also serves as a basis for giving warnings based on the impacts, thus supporting the managers’ and departments’ response to natural disaster prevention and controls, they can choose the most appropriate and effective plan. The results can be used as a premise to expand the research to all coastal river basins of Vietnam.
The calibration and validation of the 1D model showed that the error index reached an outstanding level, with the Nash index ranging from 0.84 to 0.96 and the PBIAS error ranging from −0.9 to 5.9% (PBIAS < ±10%) for both calibration and validation. The set parameters of MIKE 11 HD were used to simulate and calculate a pair of 1D–2D models to evaluate the impact of flooding and inundation at the areas downstream from the Vu Gia-Thu Bon River river basin.
The calibration and validation of wave height used the COAWST model for a re-analysis of the simulated wind field simulation with a resolution of 0.125° (14 km). The assessment results of calibration and validation with the Nash index ranged from 0.68 to 0.79, and the PBIAS ranged from 4.4 to 7.5 (PBIAS < ±10%).
The results of flood simulation in the study area are also quite accurate with reality. After the typhoon weakened to a tropical depression on the influence of rain, the tropical convergence band formed by Typhoon Noru continued to cause moderate rain, heavy rain, and very heavy rain and caused widespread flooding of the North Central. The flooded area of the study area at the time before the typhoon made landfall and after Typhoon Noru weakened into a tropical depression and off the mainland of Quang Nam Province and Da Nang City.
For a future study, warnings based on the impact of natural disasters are currently one of the research problems with high practical significance. Instead of just predicting the likelihood of a natural disaster, the impact-based warning also specifies, if a natural disaster occurs, how the impact will be, where, and at what time. It is recommended that the uncertainty of the modeling needs is reduced. The following aspects may be improved:
-
The topography of the flooded downstream area needs to be supplemented with more detailed topographical survey data at the commune level of the flooded areas;
-
The number of calibration and validation locations in the 2D models is few. It may not be enough to evaluate the adequacy of the model in the study area.

Author Contributions

Conceptualization, T.H.T., D.Q.T., H.V.N., V.V.H. and H.T.T.P.; methodology, T.H.T., D.Q.T., N.X.A., H.V.N., N.V.N., V.V.H., P.H.C., Q.T.T.T., V.V.T. and T.D.T.; software, D.Q.T., N.V.N., V.V.T. and T.D.T.; calibration and validation, D.Q.T., N.V.N. and Q.T.T.T.; formal analysis, H.V.N., N.V.N., V.V.H. and Q.T.T.T.; investigation, T.H.T., D.Q.T., H.V.N., N.X.A., H.T.T.P. and P.H.C.; data curation, H.V.N., V.V.T., T.D.T. and N.V.N.; writing—original draft preparation, H.V.N., D.Q.T., T.H.T., N.X.A., Q.T.T.T., P.H.C. and H.T.T.P.; writing—review and editing, D.Q.T.; visualization, T.H.T., D.Q.T., H.V.N., N.X.A., V.V.H., V.V.T., P.H.C., T.D.T. and H.T.T.P. All authors have read and agreed to the published version of the manuscript.

Funding

This research was funded by the national project titled “Research on the role of cloud physics processes and atmospheric–ocean interactions on the track and intensity of typhoons in the East Sea and forecasting typhoon-related strong winds and heavy rains over the Central region” with the grant code: ĐTĐL.CN-90/21.

Institutional Review Board Statement

Not applicable.

Informed Consent Statement

Not applicable.

Data Availability Statement

Not applicable.

Conflicts of Interest

The authors declare no conflict of interest.

References

  1. Tate, C.A.; Frazier, T.G. A GIS Methodology to Assess Exposure of Coastal Infrastructure to Storm Surge & Sea-Level Rise: A Case Study of Sarasota County, Florida. J. Geogr. Nat. Disasters 2013, 3 (Suppl. S1), 1–12. [Google Scholar] [CrossRef]
  2. The General Insurance Association of Japan. Survey Results on Insurance Payments Due to Resent Flood and Wind Events. Available online: http://www.sonpo.or.jp/news/statistics/disaster/weather/index.html#2018 (accessed on 23 October 2019).
  3. Low, P. Topics Geo, Natural Catastrophes; Munich Re: Munich, Germany, 2018; p. 66. [Google Scholar]
  4. Wu, S.; Yarnal, B.; Fisher, A. Vulnerability of coastal communities to sea-level rise: A case study of Cape May County, New Jersey, USA. Clim. Res. 2002, 22, 255–270. [Google Scholar] [CrossRef]
  5. Kleinosky, L.R.; Yarnal, B.; Fisher, A. Vulnerability of Hampton Roads, Virginia to storm-surge flooding and sea-level rise. Nat. Hazards 2007, 40, 43–70. [Google Scholar] [CrossRef]
  6. Liu, Q.; Xu, H.; Wang, J. Assessing tropical cyclone compound flood risk using hydrodynamic modelling: A case study in Haikou City, China. Nat. Hazards Earth Syst. Sci. 2022, 22, 665–675. [Google Scholar] [CrossRef]
  7. Lapetina, A.; Sheng, Y.P. Three-dimensional modeling of storm surge and inundation including the effects of coastal vegetation. Estuaries Coasts 2014, 37, 1028–1040. [Google Scholar] [CrossRef]
  8. Yang, K.; Paramygin, V.A.; Sheng, Y.P. A Rapid Forecasting and Mapping System of Storm Surge and Coastal Flooding. Weather Forecast. 2020, 35, 1663–1681. [Google Scholar] [CrossRef]
  9. Miller, M.M.; Shirzaei, M. Assessment of future flood hazards for southeastern Texas: Synthesizing subsidence, sea-level rise, and storm surge scenarios. Geophys. Res. Lett. 2021, 48, e2021GL092544. [Google Scholar] [CrossRef]
  10. Li, M.; Zhang, F.; Barnes, S.; Wang, X. Assessing storm surge impacts on coastal inundation due to climate change: Case studies of Baltimore and Dorchester County in Maryland. Nat. Hazards 2020, 103, 2561–2588. [Google Scholar] [CrossRef]
  11. Sheng, Y.P.; Alymov, V.; Paramygin, V.A. Simulation of storm surge, wave, currents and inundation in the Outer Banks and Chesapeake Bay during Hurricane Isabel in 2003: The importance of waves. J. Geophys. Res. 2010, 115, C04008. [Google Scholar] [CrossRef]
  12. Sassi, M.G.; Hoitink, A.J.F. River flow controls on tides an tide-mean water level profiles in a tidel freshwater river. J. Geophys. Res. Ocean. 2013, 118, 4139–4151. [Google Scholar] [CrossRef]
  13. Dresback, K.M.; Fleming, J.G.; Blanton, B.O.; Kaiser, C.; Gourley, J.J.; Tromble, E.M.; Luettich, R.A., Jr.; Kolar, R.L.; Hong, Y.; Cooten, S.V.; et al. Skill assessment of a realtime forecast system utilizing a coupled hydrologic and coastal hydrodynamic model during Hurricane Irene (2011). Cont. Shelf Res. 2013, 71, 78–94. [Google Scholar] [CrossRef]
  14. Beardsley, R.C.; Chen, C.; Xu, Q. Coastal flooding in Scituate (MA): A FVCOM study of the 27 December 2010 noreaster. J. Geophys. Res. Ocean. 2013, 118, 6030–6045. [Google Scholar] [CrossRef]
  15. Georgas, N.; Yin, L.; Jiang, Y.; Wang, Y.; Howell, P.; Saba, V.; Schulte, J.; Orton, P.; Wen, B. An open-access, multi-decadal, three-dimensional, hydrodynamic hindcast dataset for the Long Island Sound and New York/New Jersey Harbor Estuaries. J. Mar. Sci. Eng. 2016, 4, 48. [Google Scholar] [CrossRef]
  16. Godin, G. Modification of river tides by the discharge. J. Waterw. Port Coast. Ocean Eng. 1985, 111, 257–274. [Google Scholar] [CrossRef]
  17. Vongvisessomjai, S.; Rojanakamthorn, S. Interaction of tide and river flow. J. Waterw. Port Coast. Ocean Eng. 1989, 115, 86–104. [Google Scholar] [CrossRef]
  18. Westerink, J.J.; Luettich, R.A.; Feyen, J.C.; Atkinson, J.H.; Dawson, C.; Roberts, H.J.; Powell, M.D.; Dunion, J.P.; Kubatko, E.J.; Pourtaheri, H. A basin-to channel-scale unstructured grid hurricane storm surge model applied to southern Louisiana. Mon. Weather Rev. 2008, 136, 833–864. [Google Scholar] [CrossRef]
  19. Dietrich, J.C.; Zijlema, M.; Westerink, J.J.; Holthuijsen, L.H.; Dawson, C.; Luettich, R.A.; Jensen, R.E., Jr.; Smith, J.M.; Stelling, G.S.; Stone, G.W. Modeling hurricane waves and storm surge using integrally-coupled, scalable computations. Coast. Eng. 2011, 58, 45–65. [Google Scholar] [CrossRef]
  20. Xiao, Z.; Yang, Z.; Wang, T.; Sun, N.; Wigmosta, M.; Judi, D. Characterizing the Non-linear Interactions Between Tide, Storm Surge, and River Flow in the Delaware Bay Estuary, United States. Front. Mar. Sci. 2021, 8, 715557. [Google Scholar] [CrossRef]
  21. Sampurno, J.; Vallaeys, V.; Ardianto, R.; Hanert, E. Modeling interactions between tides, storm surges, and river discharges in the Kapuas River delta. Biogeosciences 2022, 19, 2741–2757. [Google Scholar] [CrossRef]
  22. Dietrich, J.C.; Dawson, C.N.; Proft, J.M.; Howard, M.T.; Wells, G.; Fleming, J.G.; Luettich, R.A., Jr.; Westerink, J.J.; Cobell, Z.; Vitse, M.; et al. Real-Time Forecasting and Visualization of Hurricane Waves and Storm Surge Using SWAN+ADCIRC and Figure Gen. In Computational Challenges in the Geosciences; Dawson, C., Gerritsen, M., Eds.; The IMA Volumes in Mathematics and its Applications; Springer: New York, NY, USA, 2013; Volume 156, pp. 49–70. [Google Scholar] [CrossRef]
  23. Deb, M.; Ferreira, C.M. Simulation of cyclone-induced storm surges in the low-lying delta of Bangladesh using coupled hydrodynamic and wave model (SWAN+ADCIRC). J. Flood Risk Manag. 2016, 11 (Suppl. S2), S750–S765. [Google Scholar] [CrossRef]
  24. Thuy, N.B.; Kim, S.; Chien, D.D.; Dang, V.H.; Cuong, H.D.; Wettre, C.; Hole, L.R. Assessment of Storm Surge along the Coast of Central Vietnam. J. Coast. Res. 2017, 33, 518–530. [Google Scholar] [CrossRef]
  25. Thai, T.H.; Thuy, N.B.; Dang, V.H.; Kim, S.; Hole, L.R. Impact of the interaction of surge, wave and tide on a storm surge on the north coast of Vietnam. Procedia IUTAM 2017, 25, 82–91. [Google Scholar] [CrossRef]
  26. Kim, S.; Mase, H.; Thuy, N.B.; Takeda, M.; Tran, C.T.; Dang, V.H. Development of GMDH-Based Storm Surge Forecast Models for Sakaiminato, Tottori, Japan. J. Mar. Sci. Eng. 2020, 8, 797. [Google Scholar] [CrossRef]
  27. Available online: https://zingnews.vn/sieu-bao-Noru-lien-tuc-manh-len-mien-trung-bat-dau-mua-lon-post1359422.html (accessed on 27 September 2022).
  28. Available online: https://vi.wikipedia.org/wiki/B%C3%A3o_Noru_(2022) (accessed on 2 May 2023).
  29. Kumbier, K.; Carvalho, R.C.; Vafeidis, A.T.; Woodroffe, C.D. Investigating compound flooding in an estuary using hydrodynamic modelling: A case study from the Shoalhaven River, Australia. Nat. Hazards Earth Syst. Sci. 2018, 18, 463–477. [Google Scholar] [CrossRef]
  30. Pasquier, U.; He, Y.; Hooton, S.; Goulden, M.; Hiscock, K.M. An integrated 1D–2D hydraulic modelling approach to assess the sensitivity of a coastal region to compound flooding hazard under climate change. Nat. Hazards 2019, 98, 915–937. [Google Scholar] [CrossRef]
  31. Wing, O.E.; Sampson, C.C.; Bates, P.D.; Quinn, N.; Smith, A.M.; Neal, J.C. A flood inundation forecast of Hurricane Harvey using a continental-scale 2D hydrodynamic model. J. Hydrol. X 2019, 4, 100039. [Google Scholar] [CrossRef]
  32. Muñoz, D.F.; Moftakhari, H.; Moradkhani, H. Compound effects of flood drivers and wetland elevation correction on coastal flood hazard assessment. Water Resour. Res. 2020, 56, e2020WR027544. [Google Scholar] [CrossRef]
  33. Huang, W.; Yin, K.; Ghorbanzadeh, M.; Ozguven, E.; Vijayan, L. Integrating storm surge modeling with traffic data analysis to evaluate the effectiveness of hurricane evacuation. Front. Struct. Civ. Eng. 2021, 15, 1301–1316. [Google Scholar] [CrossRef]
  34. Santiago-Collazo, F.L.; Bilskie, M.V.; Hagen, S.C. A comprehensive review of compound inundation models in low-gradient coastal watersheds. Environ. Modell. Softw. 2019, 119, 166–181. [Google Scholar] [CrossRef]
  35. Available online: https://factsanddetails.com/southeast-asia/Vietnam/sub5_9h/entry-3489.html (accessed on 20 May 2014).
  36. Available online: http://vmrcc.gov.vn/thong-tin-khi-tuong-thuy-van/nhung-con-so-biet-noi-ve-bao-vao-viet-nam-trong-70-nam-qua-728.html (accessed on 4 May 2023).
  37. Warner, J.C.; Sherwood, C.R.; Arango, H.G.; Signell, R.P.; Harris, C.K. Development of a coupled ocean-atmosphere-wave-sediment transport (COAWST) modeling system. Ocean Modell. 2008, 25, 126–148. [Google Scholar] [CrossRef]
  38. Ruggiero, P.; Kennedy, A.B.; van Dongeren, A. A review of recent applications, advancements, and shortcomings of coastal modeling systems. J. Mar. Sci. Eng. 2016, 4, 46. [Google Scholar]
  39. Khangaonkar, T.; Wang, T.; Wang, T.; Yang, Z. COAWST Model System Documentation; Pacific Northwest National Laboratory (PNNL): Richland, WA, USA, 2017.
  40. Lai, X.; Wei, J.; Zhang, J. A COAWST model application for coastal inundation study: A case study in Haikou Bay, China. J. Mar. Syst. 2018, 187, 1–13. [Google Scholar]
  41. Williams, J.W.; Best, M. Assessing the potential for predicting storm impact on an eroding coast through a coupled modelling system. Nat. Hazard. 2017, 86, 463–491. [Google Scholar]
  42. Wei, J.; Lai, X.; Chen, Q.; Chen, Y. Assessing the impacts of climate change on the ecology of Xiamen Bay, China, using a COAWST model. Estuar. Coast. Shelf Sci. 2018, 200, 26–37. [Google Scholar]
  43. Luettich, R.A., Jr.; Westerink, J.J.; Scheffner, N.W.; Hetland, R.D.; Hope, M.E. The surge response to Irene and Lee: A comparison of the coastal ocean modeling testbed hindcast results with observations. J. Geophys. Res. Oceans 2014, 119, 2434–2462. [Google Scholar]
  44. Huang, S.; Chen, J.; Gong, W. The use of a coupled ocean–atmosphere–wave–sediment transport model for typhoon-induced storm surges in the northern South China Sea. Nat. Hazards Earth Syst. Sci. 2017, 17, 613–628. [Google Scholar]
  45. Li, Q.; Li, Y.; Li, R.; Li, C.; Li, X. A three-dimensional, coupled ocean–atmosphere–wave model for predicting typhoon-related flooding and inundation in the coastal areas of the South China Sea. Ocean Eng. 2018, 161, 28–41. [Google Scholar]
  46. Liu, Y.; Wei, H.; Xu, H.; Wu, Y. Modeling the effects of tidal flats on storm surges during Typhoon Talim (2017) in the Taiwan Strait. J. Mar. Syst. 2019, 194, 131–146. [Google Scholar]
  47. Li, C.; Li, X. Coupled atmosphere-ocean-wave-sediment transport modeling of typhoon-induced storm surge and inundation in the Pearl River Estuary. J. Mar. Syst. 2019, 195, 1–14. [Google Scholar]
  48. Chen, Y.; Weishampel, J.F.; Ye, Y.; Yeganeh-Bakhtiary, A. A high-resolution COAWST model for simulating storm surge and inundation during Hurricane Laura in the northern Gulf of Mexico. Nat. Hazards 2021, 107, 1191–1212. [Google Scholar]
  49. Ding, J.; Xie, X.; Zhang, J.; Wu, X. A coupled atmosphere-ocean-wave-sediment transport model for simulating the storm surge and inundation in the East China Sea during Typhoon In-Fa. J. Hydrol. 2021, 598, 126332. [Google Scholar]
  50. DHI. MIKE 11 A Modelling System for Rivers and Channels: Reference Manual. MIKE Powered by DHI. 2014. Available online: https://fr.scribd.com/document/94010463/Mike-11-Reference-Manual# (accessed on 4 February 2023).
  51. DHI. MIKE 21 Spectral Waves. Denmark. 2014. Available online: https://www.mikepoweredbydhi.com/products/mike-21/waves/spectral-waves (accessed on 4 February 2023).
  52. Abbott, M.B.; Ionescu, F. On the Numerical Computation of Nearly Horizontal Flows. J. Hydraul. Res. 1967, 5, 97–117. [Google Scholar] [CrossRef]
  53. WAMDI Group. The WAM Model—A Third Generation Ocean Wave Prediction Model. J. Phys. Oceanogr. 1988, 18, 1775–1810. [Google Scholar] [CrossRef]
  54. DHI. MIKE 21 Flow Model FM. Denmmark. 2014. Available online: https://www.mikepoweredbydhi.com/-/media/shared%20content/mike%20by%20dhi/flyers%20and%20pdf/product-documentation/gpu-verification-report.pdf (accessed on 4 February 2023).
  55. Komen, G.J.; Cavaleri, L.; Doneland, M.; Hasselmann, K.; Hasselmann, S.; Janssen, P.A.E.M. Dynamics and Modelling of Ocean Waves; Cambridge University Press: Cambridge, UK; p. 560.
  56. DHI. MIKE FLOOD Urban, coastal and riverine flooding. Denmmark. 2014. Available online: https://www.mikepoweredbydhi.com/products/mike-flood (accessed on 4 February 2023).
  57. Moriasi, D.N.; Arnold, J.G.; Van Liew, M.W.; Bingner, R.L.; Harmel, R.D.; Veith, T.L. Model evaluation guidelines for systematic quantification of accuracy in watershed simulations. Trans. ASABE (Am. Soc. Agric. Biol. Eng.) 2007, 50, 885–900. [Google Scholar] [CrossRef]
  58. Toan, N.T.; Thanh, C.; Phuong, P.T.; Anh, V.T. Assessing the Predictability of WRF Model for Heavy Rain by Cold Air Associated with the Easterly Wind at High-Level Patterns over Mid-Central Vietnam. VNU J. Sci. Earth Environ. Sci. 2018, 34 (Suppl. S1), 133–137. [Google Scholar] [CrossRef]
  59. Tran, T.D.; Dinh, D.T.; Doan, Q.T.; Tran, Q.T. Applications of Numerical Modelling for the Study on Storm Surge in Typhoon Xangsane in the Central Coast of Vietnam. Trop. Cyclone Res. Rev. 2018, 7, 179–192. [Google Scholar]
  60. Tran, H.T.; Doan, Q.T.; Dinh, V.H. Research on the affected simulation of waves and storm surge in coastal central Vietnam. VN J. Hydrometeorol. 2018, 678, 1–14. (In Vietnamese) [Google Scholar]
  61. Thuy, N.B.; Kim, S.; Anh, T.N.; Cuong, N.K.; Thuc, P.T.; Hole, L.R. The influence of moving speeds, wind speeds, and sea level pressures on after-runner storm surges in the Gulf of Tonkin, Vietnam. Ocean Eng. 2020, 212, 107613. [Google Scholar] [CrossRef]
  62. Cuong, H.D.; Khiem, M.V.; Phuong, N.N.B.; Thang, V.V.; Thanh, N.V. Research and Application of WRF Model for Weather and Storm Forecasting in Vietnam; Final Report of MoNRE; Institute of Meteorology, Hydrology and Environment: Hanoi, Vietnam; p. 112.
Figure 1. Map of the study location.
Sustainability 15 08203 g001
Figure 2. Flowchart of the study (the upper-right panel is from www.usgs.gov).
Sustainability 15 08203 g002
Figure 3. (a) Establishment of the integrated mesh of the study site; (b) detailed mesh coupling of rivers and the sea; (c) hydraulic network in MIKE 11; (d) mesh in the coupled 1D–2D models in MIKE FLOOD.
Sustainability 15 08203 g003
Figure 4. Coupled 1D–2D models in MIKE FLOOD.
Sustainability 15 08203 g004
Figure 5. The results of calibration of the water level in the 1D hydraulic model.
Sustainability 15 08203 g005
Figure 6. The results of validation of the water level in the 1D hydraulic model.
Sustainability 15 08203 g006
Figure 7. The results of (a) calibration and (b) validation for wave height at the Ly Son marine station.
Sustainability 15 08203 g007
Figure 8. The results of maximum wave height for 26–28 September 2022.
Sustainability 15 08203 g008
Figure 9. The results of (a) calibration and (b) validation of the water level at the Ly Son marine station.
Sustainability 15 08203 g009
Figure 10. The results of the wind field in the 2D model from 26 to 28 September 2022.
Sustainability 15 08203 g010
Figure 11. The simulated and observed results of the water level at Hoi Khach, Giao Thuy, Ai Nghia, and Cau Lau stations in the Vu Gia-Thu Bon River river basin after, during, and before Typhoon Noru.
Sustainability 15 08203 g011
Figure 12. Map of inundation depth in the Vu Gia-Thu Bon River basin caused by rain (a) before Typhoon Noru; (b) during Typhoon Noru; and (c) after Typhoon Noru.
Sustainability 15 08203 g012
Figure 13. The statistics of inundated areas by the flooding depth due to the influence of rain before, during, and after Typhoon Noru in (a) Quang Nam Province and (b) Da Nang City.
Sustainability 15 08203 g013
Table 1. Assessment of the error of calibration and validation of the hydraulic parameters.
StationRiverCalibrationValidation
NSEPBIASNSEPBIAS
Hoi KhachVu Gia0.891.40.96−0.9
Ai NghiaVu Gia0.935.50.945.7
Giao ThuyThu Bon0.945.90.963.4
Cau LauThu Bon0.845.60.945.9
Table 2. Assessment of the error of calibration and validation of the MIKE 21 SW model.
StationRiverCalibrationValidation
NSEPBIASNSEPBIAS
Ly SonVu Gia0.794.40.687.5
Table 3. The set of parameters used for the MIKE 21 SW model wave propagation model.
No.ParametersValue
1Number of directions16
2Bottom Friction0.035–0.04 (m)
3Energy transferInclude quadruplet-wave interaction
4Wave breaking0.7–0.8
Table 4. Assessment of the error of calibration and validation of the MIKE 21 FM model.
StationCalibrationValidation
NSEPBIASNSEPBIAS
Ly Son0.902.80.843.6
Table 5. The set of parameters for the MIKE 21 FM hydraulic model.
No.ParametersValue
1Eddy viscosity—Smagorinsky0.28–0.38 (m2/s)
2Bed resistance—Manning32–42 (m1/3/s)
3Wind Friction0.002–0.0027
4Time step30 (s)
Table 6. Statistics of the flooded area caused by rains before Typhoon Noru.
Province/
City
District0.2–0.50.5–1.01.0–2.02.0–5.0>5.0Sum
Quang Nam ProvinceThang Binh0.03%0.06%0.01%0.05%0.003%0.15%
Dien Ban1.21%0.001%0.00005%1.21%
Duy Xuyen0.02%0.10%0.03%0.23%0.38%
Que Son
Hoi An0.46%0.00%0.20%0.001%0.66%
Dai Loc0.19%0.07%0.26%
Nui Thanh0.09%0.01%0.10%
Tam Ky0.001%0.001%
Sum1.91%0.23%0.24%0.37%0.01%2.75%
Da Nang CityHoa Vang0.54%0.59%0.32%0.02%0.01%1.49%
Cam Le3.29%0.63%3.92%
Hai Chau6.27%2.26%0.56%2.43%1.04%12.56%
Thanh Khe11.61%7.09%1.39%0.28%20.37%
Lien Chieu0.54%0.49%0.40%0.29%0.23%1.94%
Son Tra0.53%0.49%0.70%1.53%0.46%3.71%
Ngu Hanh Son2.98%0.43%0.24%3.66%
Sum25.76%11.98%3.62%4.55%1.74%47.65%
Table 7. Statistics of the flooded area caused by Typhoon Noru.
Province/CityDistrict0.2–0.50.5–1.01.0–2.02.0–5.0>5.0Sum
Quang Nam ProvinceThang Binh3.65%4.21%6.73%7.83%0.003%22.42%
Dien Ban14.97%4.65%0.10%0.06%19.78%
Duy Xuyen1.80%1.21%0.54%0.51%0.13%4.20%
Que Son0.86%1.06%0.21%2.13%
Hoi An5.32%1.48%0.34%7.14%
Dai Loc0.27%0.21%0.02%0.51%
Nui Thanh0.09%0.005%0.10%
Tam Ky0.001%0.001%
Sum26.87%12.83%7.94%8.49%0.14%56.27%
Da Nang CityHoa Vang0.55%0.59%1.22%0.27%0.03%2.65%
Cam Le3.73%4.81%2.78%11.32%
Hai Chau5.16%3.11%2.50%1.99%1.04%13.79%
Thanh Khe10.74%13.99%0.76%0.28%25.76%
Lien Chieu1.13%0.53%0.75%0.16%0.22%2.79%
Son Tra0.29%0.34%0.86%1.51%0.46%3.46%
Ngu Hanh Son2.93%0.71%0.24%3.88%
Sum24.52%24.08%9.11%4.20%1.74%63.64%
Table 8. Statistics of the flooded area after Typhoon Noru.
Province/CityDistrict0.2–0.50.5–1.01.0–2.02.0–5.0>5.0Sum
Quang Nam ProvinceThang Binh0.03%0.06%0.01%0.05%0.003%0.15%
Dien Ban1.21%0.001%0.00005%1.21%
Duy Xuyen0.02%0.10%0.03%0.23%0.38%
Que Son
Hoi An0.46%0.00%0.20%0.001%0.66%
Dai Loc0.19%0.07%0.26%
Nui Thanh0.09%0.01%0.10%
Tam Ky0.001%0.001%
Sum1.91%0.23%0.24%0.37%0.01%2.75%
Da Nang CityHoa Vang0.54%0.59%0.32%0.02%0.01%1.49%
Cam Le3.29%0.63%3.92%
Hai Chau6.27%2.26%0.56%2.43%1.04%12.56%
Thanh Khe11.61%7.09%1.39%0.28%20.37%
Lien Chieu0.54%0.49%0.40%0.29%0.23%1.94%
Son Tra0.53%0.49%0.70%1.53%0.46%3.71%
Ngu Hanh Son2.98%0.43%0.24%3.66%
Sum25.76%11.98%3.62%4.55%1.74%47.65%
Disclaimer/Publisher’s Note: The statements, opinions and data contained in all publications are solely those of the individual author(s) and contributor(s) and not of MDPI and/or the editor(s). MDPI and/or the editor(s) disclaim responsibility for any injury to people or property resulting from any ideas, methods, instructions or products referred to in the content.

