Article

Indoor Air Quality Perception in Built Cultural Heritage in Times of Climate Change

1
Department of Geography, Tourism and Territorial Planning, Faculty of Geography, Tourism and Sport, University of Oradea, 1 Universitatii Street, 410087 Oradea, Romania
2
Department of Digital Economy, Samarkand State University, Samarkand 140105, Uzbekistan
3
Department of Environmental Engineering, Faculty of Environmental Protection, University of Oradea, Magheru Street 26, 410087 Oradea, Romania
4
Department of Geography Education, Faculty of Social Sciences and Law, Universitas Negeri Surabaya, Surabaya 60213, Indonesia
5
Department of Geography, Planning, Environment and Development, University of Reunion Island, BP 7151, CEDEX 9, Reunion Island, 97715 Saint-Denis, France
6
Department of Social Studies, College of Arts, King Faisal University, Al Ahsa 31982, Saudi Arabia
7
Tourism Studies Department, Faculty of Tourism and Hotel Management, Helwan University, Cairo 12612, Egypt
8
Department of Geography and Environment, Jagannath University, Dhaka 1100, Bangladesh
*
Author to whom correspondence should be addressed.
Sustainability 2023, 15(10), 8284; https://doi.org/10.3390/su15108284
Submission received: 16 April 2023 / Revised: 12 May 2023 / Accepted: 15 May 2023 / Published: 19 May 2023
(This article belongs to the Special Issue Advances in Sustainability Research from the University of Oradea)

Abstract

:
Low quality in a museum’s internal microclimate can induce both the deterioration of the exhibit collections, as well as affecting the health of visitors, employees and restorers. Starting from this premise, the present study aims to study the perception of visitors and employees of Darvas-La Roche Museum House (Romania) in relation to the air quality in the exhibition spaces. Their opinions were analyzed based on a questionnaire comprising 11 items aimed at understanding the influence of the indoor environment on the health of individuals, the degree of disturbance induced by the indoor air, if they experienced symptoms of illness after visiting the museum, etc. The obtained data were analyzed statistically in the SPSS 28 program, using tests such as coefficient, analysis of variance (ANOVA) and model summary, in order to obtain correlations between the sets of variables. The results obtained indicate that the majority of respondents perceived the indoor air quality as good, but there were also exceptions (approximately 20% of the respondents), which indicated different symptoms induced by the indoor air. Most of those (%) affected stated that they had pre-existing conditions, wear contact lenses or are smokers. In their case, the statistical-mathematical analyses indicated strong correlations between the ailments they suffer from and the appearance of certain discomforts (caused by too low or too high temperature, dust or dry air, etc.) and disease symptoms (nasal congestion, eye and skin irritations, coughs, migraines, frequent colds, etc.).

1. Introduction

Cultural tourism is one of the emerging activities in urban environments, which has seen a constant development recently at urban tourist destinations [1,2,3,4,5]. One of the basic pillars on which cultural tourism is premised is represented by museums [6,7,8]. Museums diversify tourist activity, thus contributing to increasing the length of stay in a tourist destination, improving the image of the destination and, finally, increasing the satisfaction of tourists by improving the lived experiences [9].
In the Oradea Tourist Destination, there are 12 museums and museum collections, all operating in heritage buildings, some with historical monument status [10]. These buildings have existed without much attention from researchers regarding the internal microclimate [11]. Recently, there have been numerous studies that refer both to the conservation of heritage buildings and their interiors [12,13,14,15,16], and to indoor air quality [17,18,19,20,21]. Monitoring and analyzing the concentration of pollutants that decrease air quality is paramount to prevent the potential risk to human health caused by sick building syndrome [22,23,24,25]. In order to assess the danger to which the citizens are subjected, it is also necessary to determine the microbial load of the surfaces and the air inside the building [26,27,28,29,30,31,32,33,34,35,36].
The climate change—indoor air quality—public health nexus, known and argued over since the first decade of the 21st century [37,38,39,40], has today become an emerging issue, the understanding and solution of which largely depends on maintaining a balance between the use of heritage buildings and their preservation over time [41,42]. In this sense, EU-project FP7 “Climate for Culture” [43], which continues the research activity focused on climate change and heritage from the FP6 Noah’s Ark project, based on two moderate scenarios regarding gas emissions. Scenarios A1B and RCP4.5 [44], carried out by the Intergovernmental Panel on Climate Change (IPCC), forecast indoor climates in historic buildings until the year 2100. The results of the project show that the temperature increases forecast for outdoor climates in Europe (between 1–3 °C for RCP4.5 and 2–4.5 °C for A1B) and extreme weather events will accelerate building degradation rates and raise air conditioning costs. Increases in the temperature inside buildings (indoor temperature) are expected in Sweden, Norway, Denmark, Holland, central Romania, the Alps, Italy, on the Adriatic coast and Greece. An increase in indoor temperature is also indicated by the study carried out for the southern part of England (Southern England) by Lankester and Brimblecombe [45], and the analysis carried out by González et al. [46], demonstrates that these temperature changes will affect the thermal comfort of visitors. Vardoulakis et al. [47] shows that the measures aimed at reducing greenhouse gas emissions have positive effects for public health, but there are also secondary effects, in the sense that the sealing of buildings to increase energy efficiency can lead to an increase in pollutant concentrations inside them. This means an increase in energy consumption for ventilation and air conditioning systems [46,48,49,50] and smart building technologies, with a possible indirect effect of increasing the degree of pollution outside [51].
In order to accredit and operate the heritage buildings as museum institutions, they have undergone some structural (recompartmentalization of the interiors) and functional (change of the original purpose for which they were built) modifications. Often, these changes affected the optimal functionality of the buildings, represented by microclimatic variations and deviations (temperature, relative humidity, carbon dioxide, suspended particles, brightness, formaldehyde concentration and volatile organic compounds) and biological (bacteria, molds and fungi) [26,52].
Indoor air quality has a decisive role for human health, for a healthy working environment and leisure time. The level of pollutant concentration, the indoor microclimate, as well as the exposure time are determinants both for human health and for the interiors of heritage buildings and their exhibits [53,54,55,56]. Air pollution inside heritage buildings, as well as an inadequate indoor microclimate, can negatively affect the health of visitors and employees [52,57,58,59,60] and can have consequences on the degree of preservation inside the building [61,62].
Too high temperatures can cause symptoms of physical and mental exhaustion, while low temperatures can lead to constriction of blood vessels and chills. Air humidity has significant effects on the quality of life over time. Too much humidity produces a favorable environment for the development of mold and considerably increases the risk of allergies and bronchial asthma, leading to fatigue, lack of concentration and headaches. In contrast, low humidity leads to drying of the nasal mucosa, skin irritations, allergies and drying of the skin. For the well-being of the human body, the relative humidity should be between 40–70% [63].
Indoor air pollution is a risk factor for people’s health, the most exposed being workers and restaurateurs who spend longer time indoors. Among the manifested symptoms are respiratory problems, allergies and decreased work capacity [64,65]. Tourists, even if they spend a shorter time inside heritage buildings, can be affected by the microclimate and indoor air quality [66,67,68]. Among their manifested symptoms are dizziness, vomiting, headache, fatigue, eye irritation and skin rashes, coughs, etc. [69,70]. Indoor air pollution with suspended particles, especially with PM2.5 and PM10, has been associated with the intensification of bronchial asthma and cognitive disorders [71,72,73].
Indoor air quality also damages in time the interiors of heritage buildings by degrading walls and equipment. Temperature variations, as well as high or low humidity, contribute to damage to equipment and specific objects (religious, artistic, etc.). A high humidity of over 70% and a reduced ventilation is conducive for the growth of fungi [66].
The state of health is an interesting and important aspect that must be taken into account when the problem of the perception of indoor air quality is raised, in parallel with the knowledge of the consumption behavior of potential visitors [74,75]. The perception of indoor air quality refers to how each individual, thanks to the endosomatic instruments with which he/she is naturally endowed, perceives the air quality as good or otherwise [76,77,78]. In this context, the aim of the present study is to study the perception of indoor air quality in the Darvas-La Roche Museum in Oradea, Romania (Figure 1 and Figure 2). This is a heritage building, built in the Art Nouveau style, between 1911 and 1912. Starting in 2020, after an extensive restoration aimed at restoring its former beauty and glory, Darvas-La Roche House reopened its doors in the form of an Art Nouveau museum. Within it, there are numerous important pieces of furniture, clothing, crockery, as well as other household items dating from La Belle Époque.
The working hypothesis is that air quality influences the perception of visitors and staff, thus good air quality will be reflected in good perception and vice versa. We note that the present study is a continuation of other studies aimed at understanding air quality [66] and the bacteriological microflora inside buildings [79]. Regarding indoor air quality, previous studies have revealed that the indoor environment can be quite unstable, mainly due to wide and very frequent fluctuations in temperature, relative humidity (RH), carbon dioxide (CO2) and particles in suspension (PM). Exceedances of the international standards in force were also recorded for pollutants such as SO2, O3, NO2, NO and H2S, but these were sporadic and limited in terms of quantity. The pollutants VOC and HCHO have a high degree of risk for human health and the integrity of the exhibits, considering that during the measurement period, they exceeded the allowed limits by 28% (VOC) and 125% (HCHO).
At the same time, in the research conducted by Ilies et al. [79], the interior of the museum was monitored to determine the bacteriological microflora in the air and on the surfaces for establishing the degree of security for the health of museum employees, restorers and visitors. The results obtained emphasize the presence of some fungi and bacteria, among them Alternaria spp., Aspergillus spp., Penicillium spp., Cladosporium spp. and Botrytis spp., while the degree of contamination of the rooms was high to very high (between 524 and 3674 CFU/m3). These results indicate a high degree of risk for human health, considering that some types of identified fungi can cause health problems for people with low sensitivity, while also being able to amplify already existing conditions.
Taking into account the issues identified in previous studies, and to extend existing information, the current study aims to understand the perception that museum employees and visitors have of the quality of the microclimate inside the Darvas-La Roche House. Thus, this series of studies not only aims to identify quantitatively and qualitatively the main indicators of the internal microclimate and bacteriological microflora, but also aims to obtain valuable information from those actively involved inside the museum. The data obtained are important as they include both employees and restaurateurs (those who spend up to 8 h a day/6 out of 7 days per week in this environment), as well as visitors (who spend between 1 and 4 h in this environment); starting from the premise that their experiences in relation to the inner environment are definitely different.

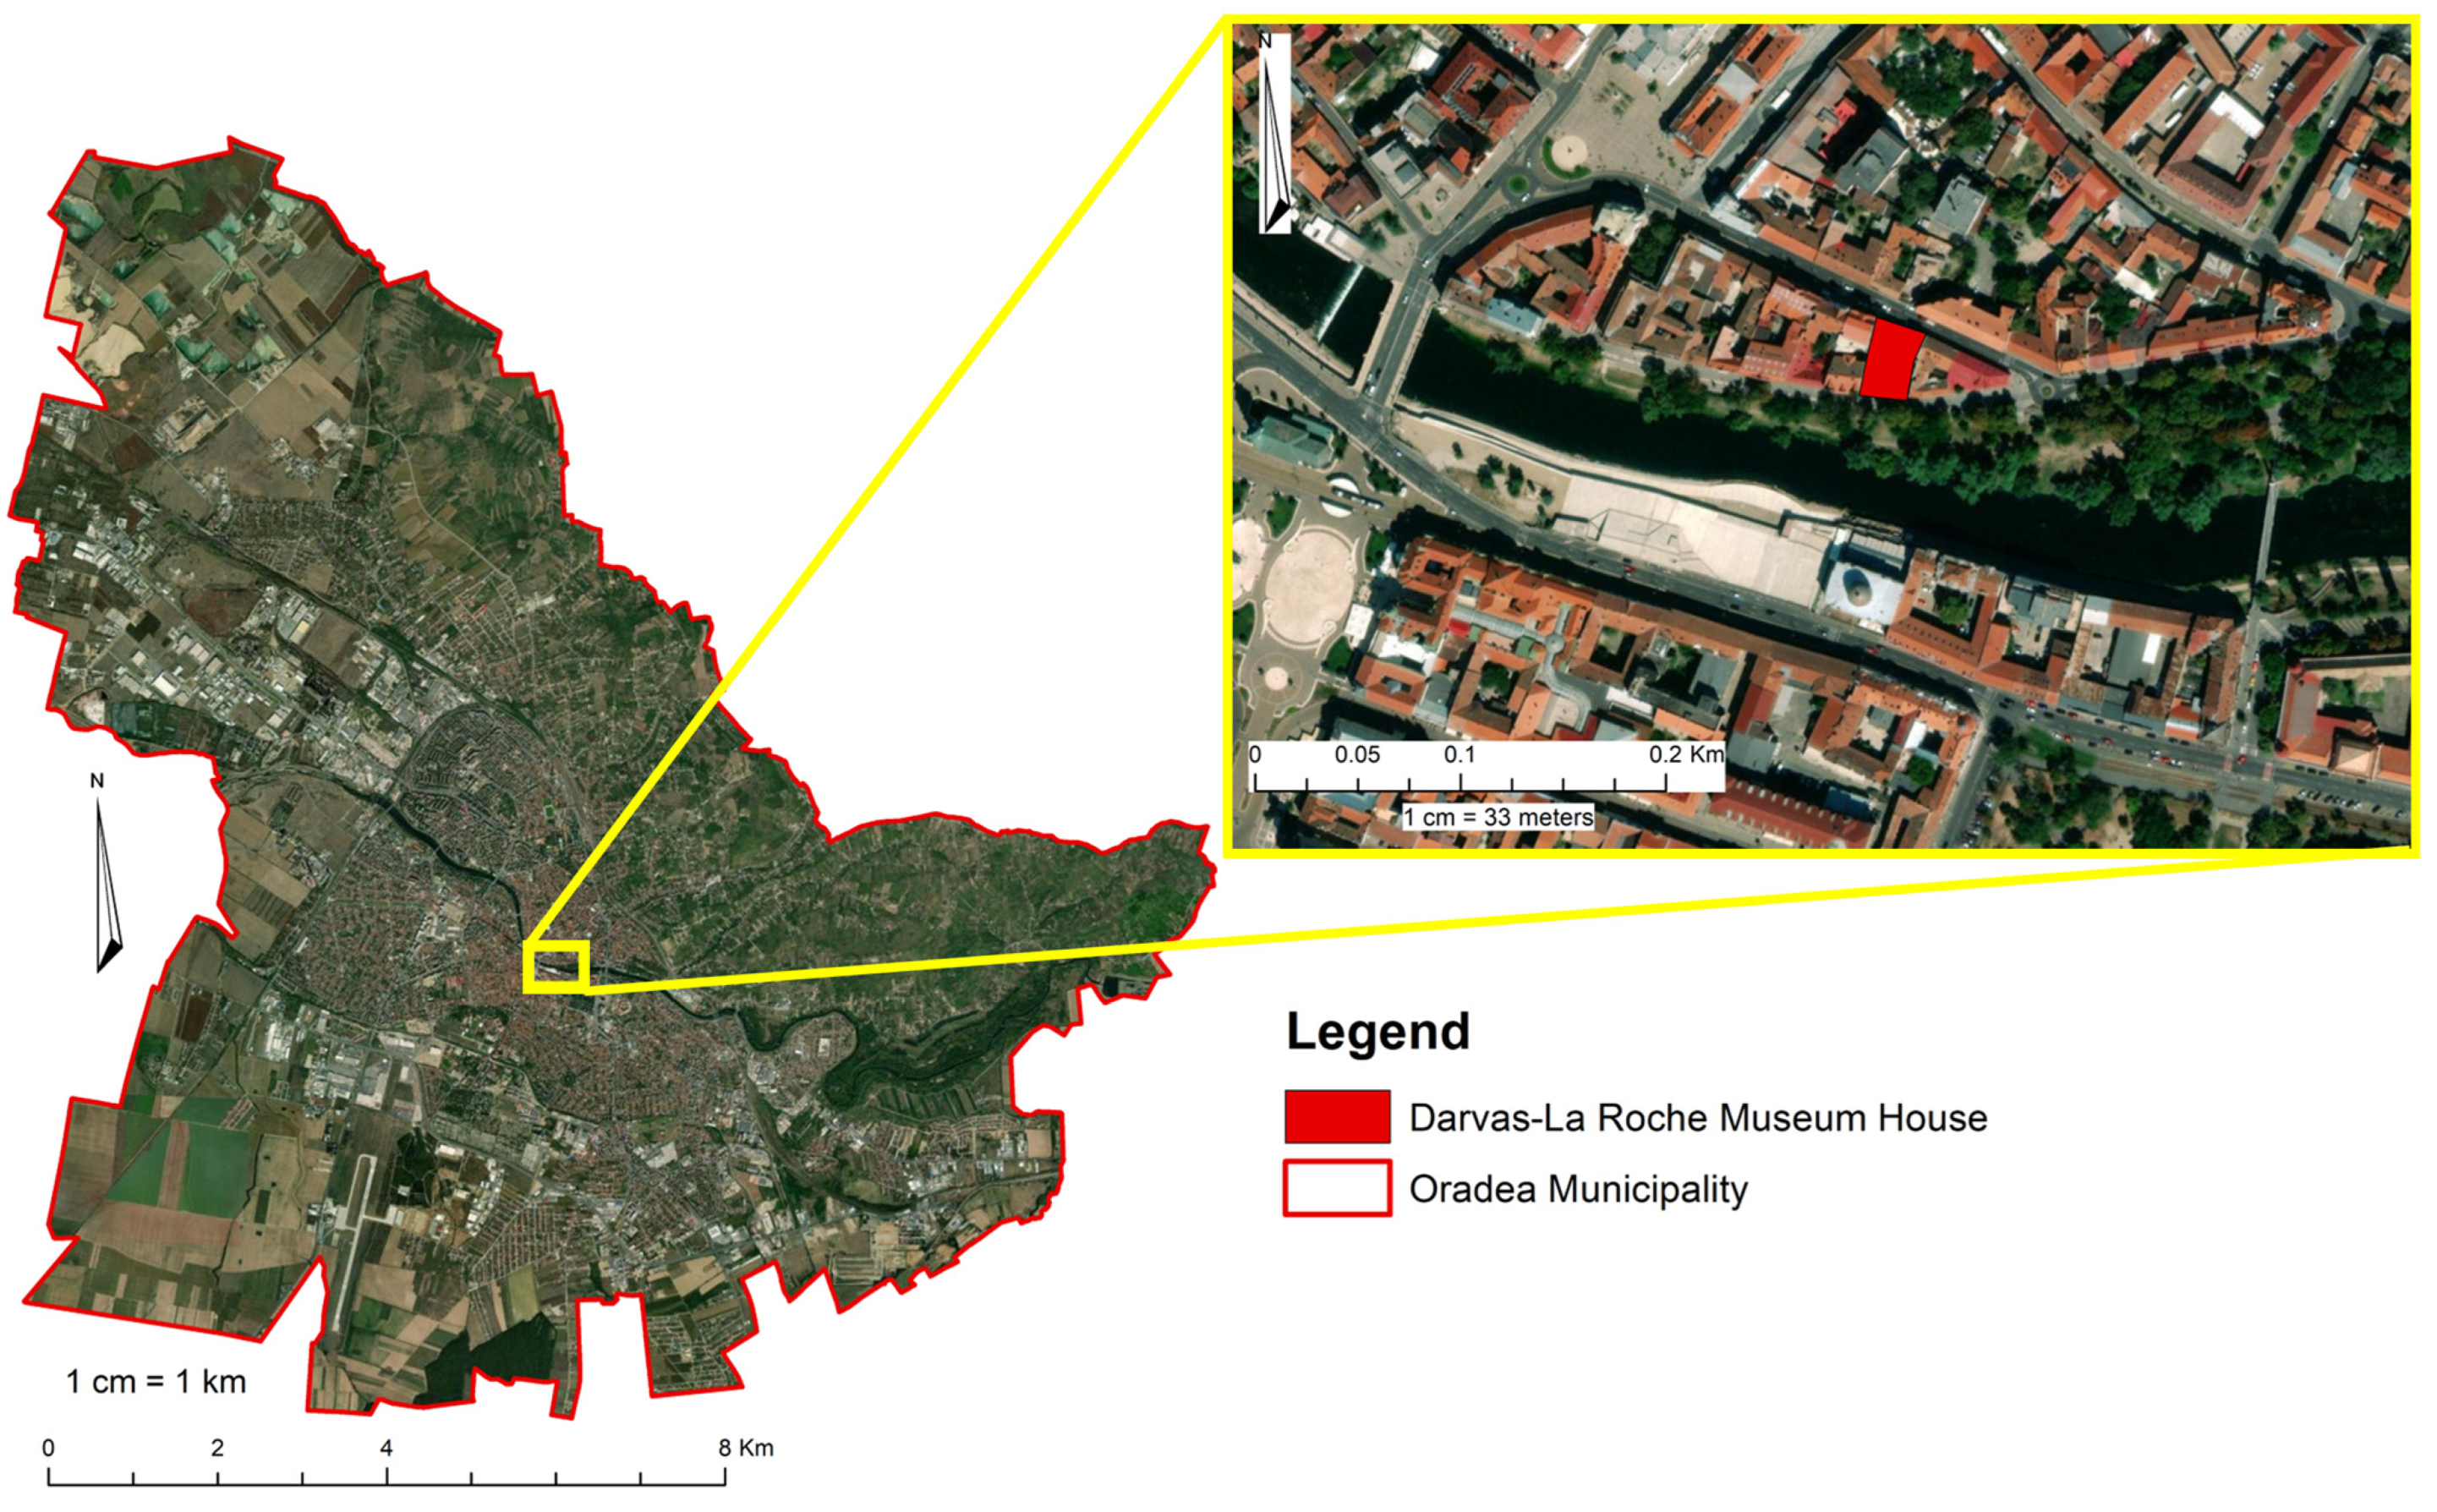
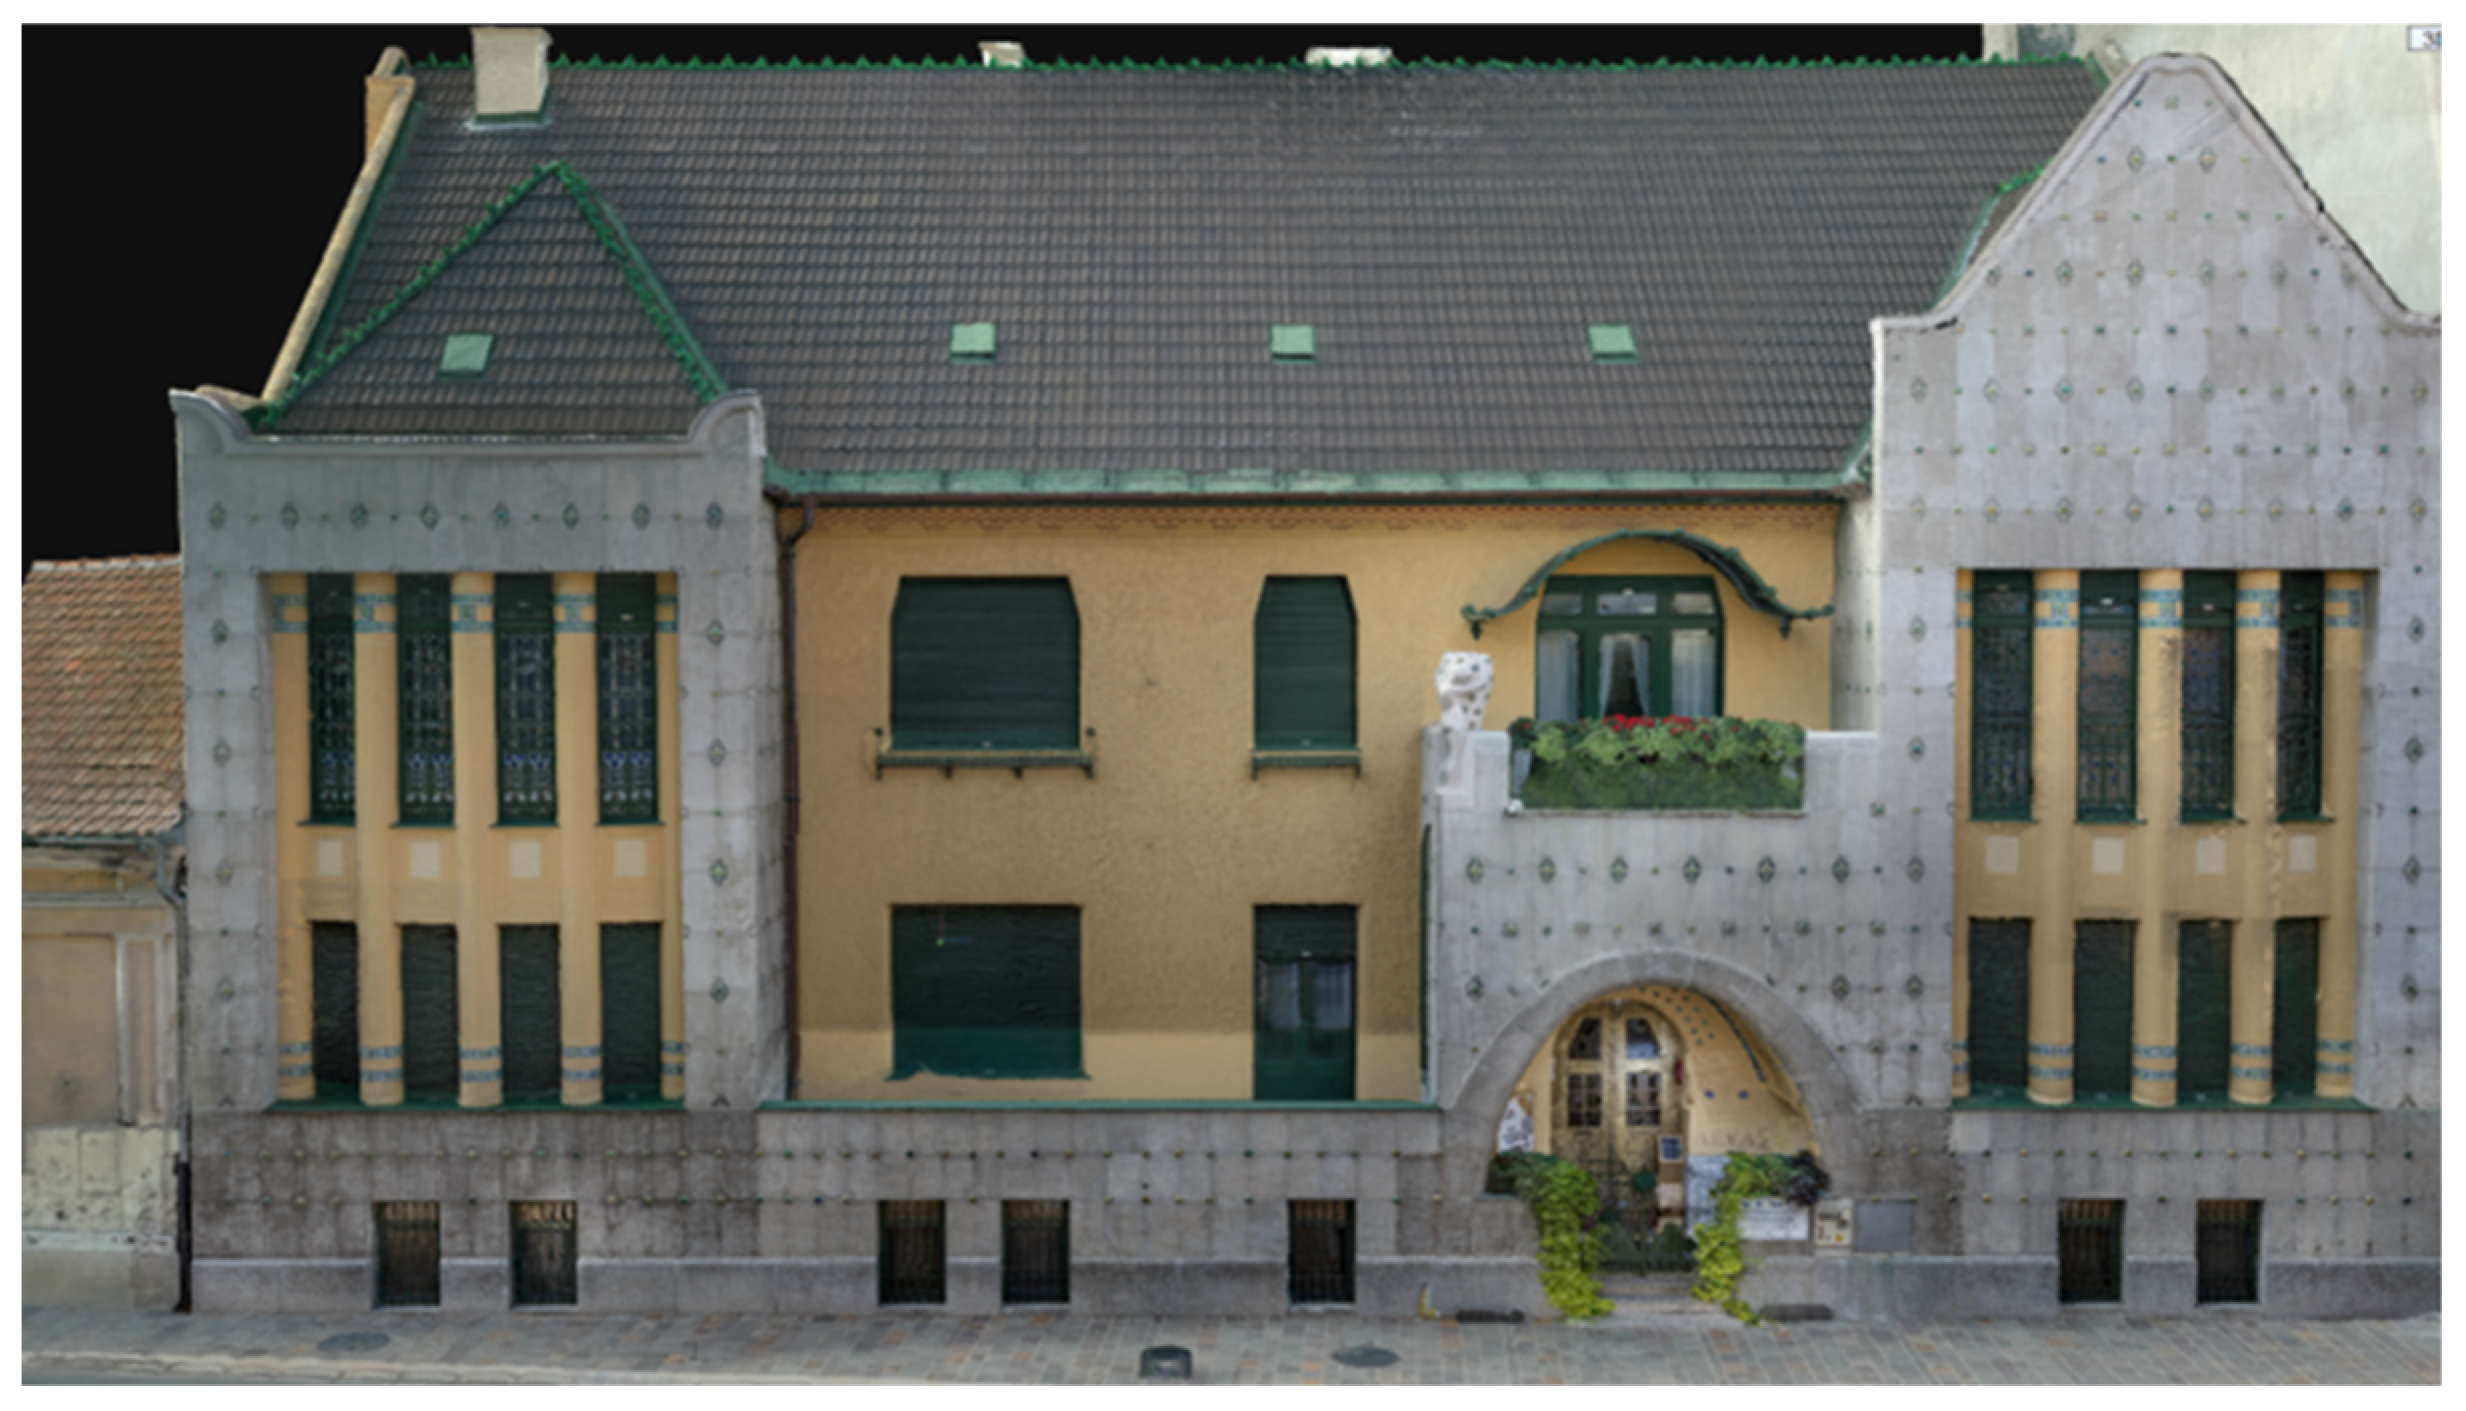
2. Materials and Methods

Considering the fact that poor quality air can negatively affect humans, the study also took into account the analysis of their perception of the air quality inside the exhibition spaces of Darvas-La Roche House. This study is mainly based on primary data from the questionnaire survey. Secondary sources of data were also used to supplement primary data sources. In the period September 2023–March 2023, 250 questionnaires were administered to study the perception of both employees and visitors of the museum in terms of air quality. The target group was chosen in such a way as to cover all age groups and genders, to include both people sensitive to impure air, under treatment, as well as healthy people, people who come into daily contact with the indoor environment and people who visit the museum only occasionally, etc.
The opinions of the visitors and staff were analyzed based on a questionnaire comprising 11 items, which aimed to determine the influence of the indoor environment on the health of individuals, the degree of disturbance induced by the indoor air, if they experienced symptoms of illness after visiting the museum, etc. At the same time, for an accurate interpretation, the analysis of the details that take into account the age of the respondents, their occupation, the number of visits they have made so far inside the Darvas-La Roche House and the average duration of a visit were taken into account.
Regarding the questions on the disturbing factors inside the exhibition spaces, they had a choice between multiple answer options, prepared following the identification of shortcomings at the site. Irregularities in terms of temperature and air humidity, unpleasant odors, dust in suspension and the presence of molds were thus taken into account. At the same time, the visitors were also questioned regarding the symptoms they felt after visiting the museum, such as: headaches, vomiting, repeated coughing and sneezing, eye and skin irritations, severe fatigue, etc.
In order to determine the effects of indoor air on human health, the data obtained from the respondents were entered into the SPSS 28 program, where various analyses and statistical calculations were carried out. Among the statistical calculations, coefficient, analysis of variance (ANOVA) and model summary are applied in this study.

3. Results and Discussion

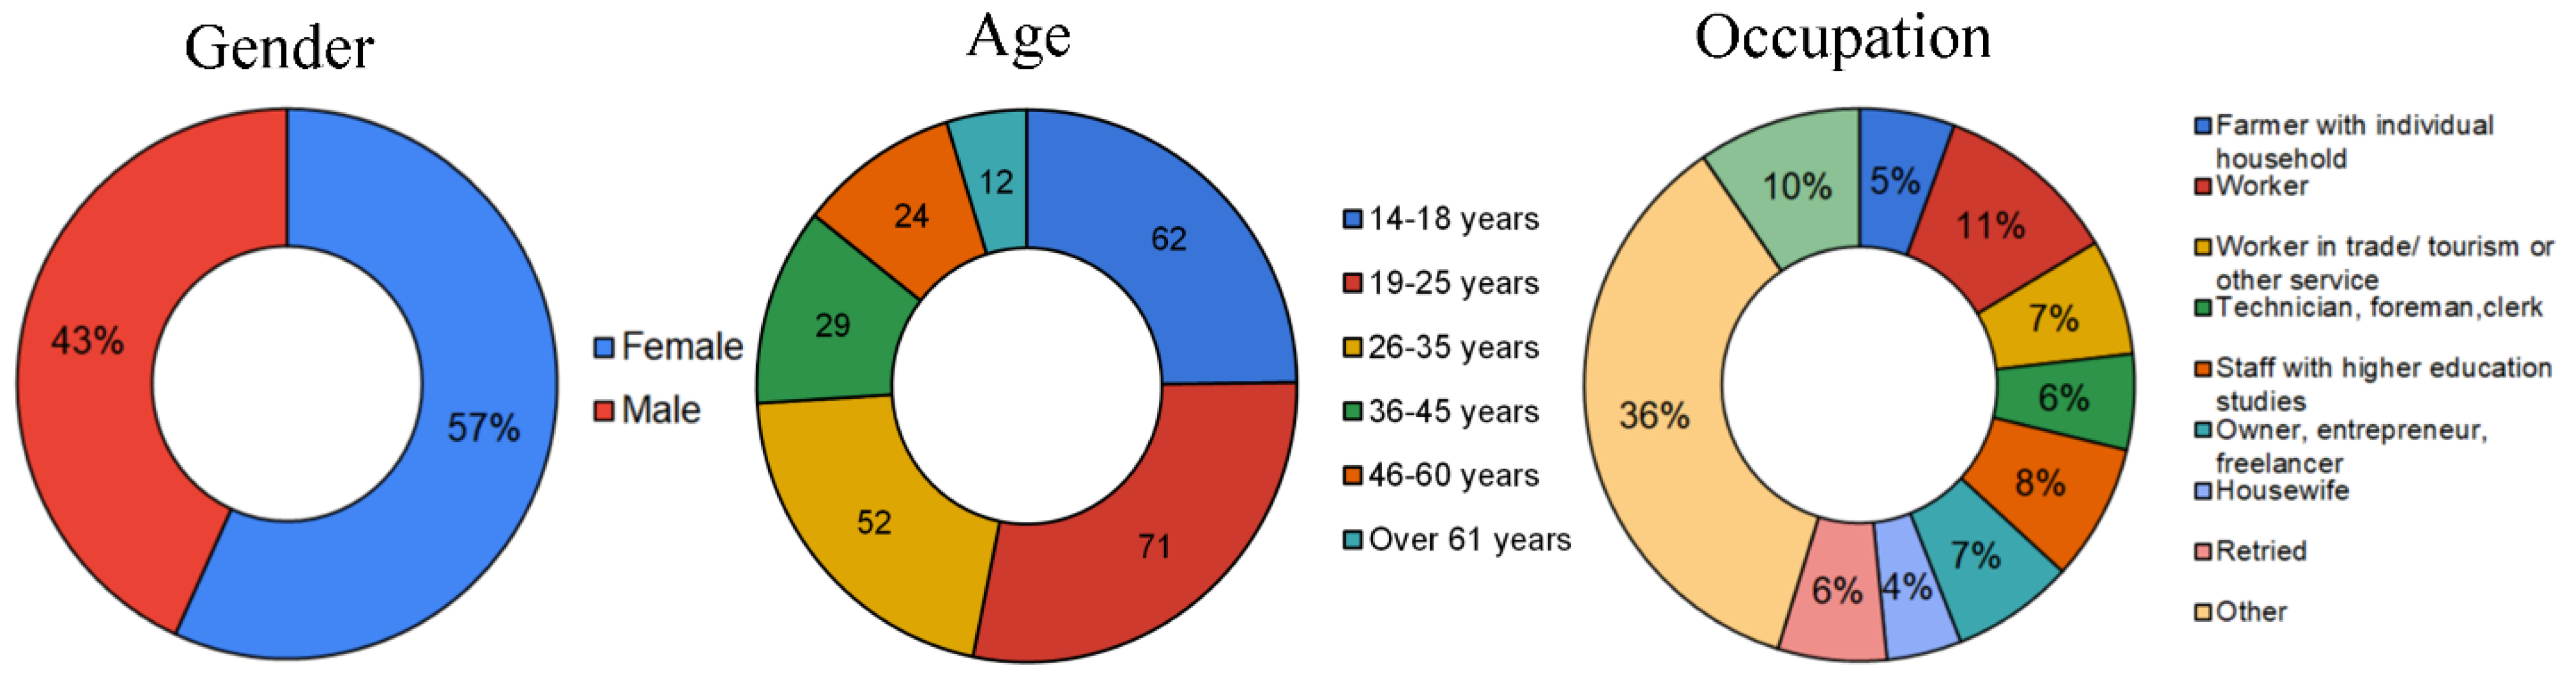
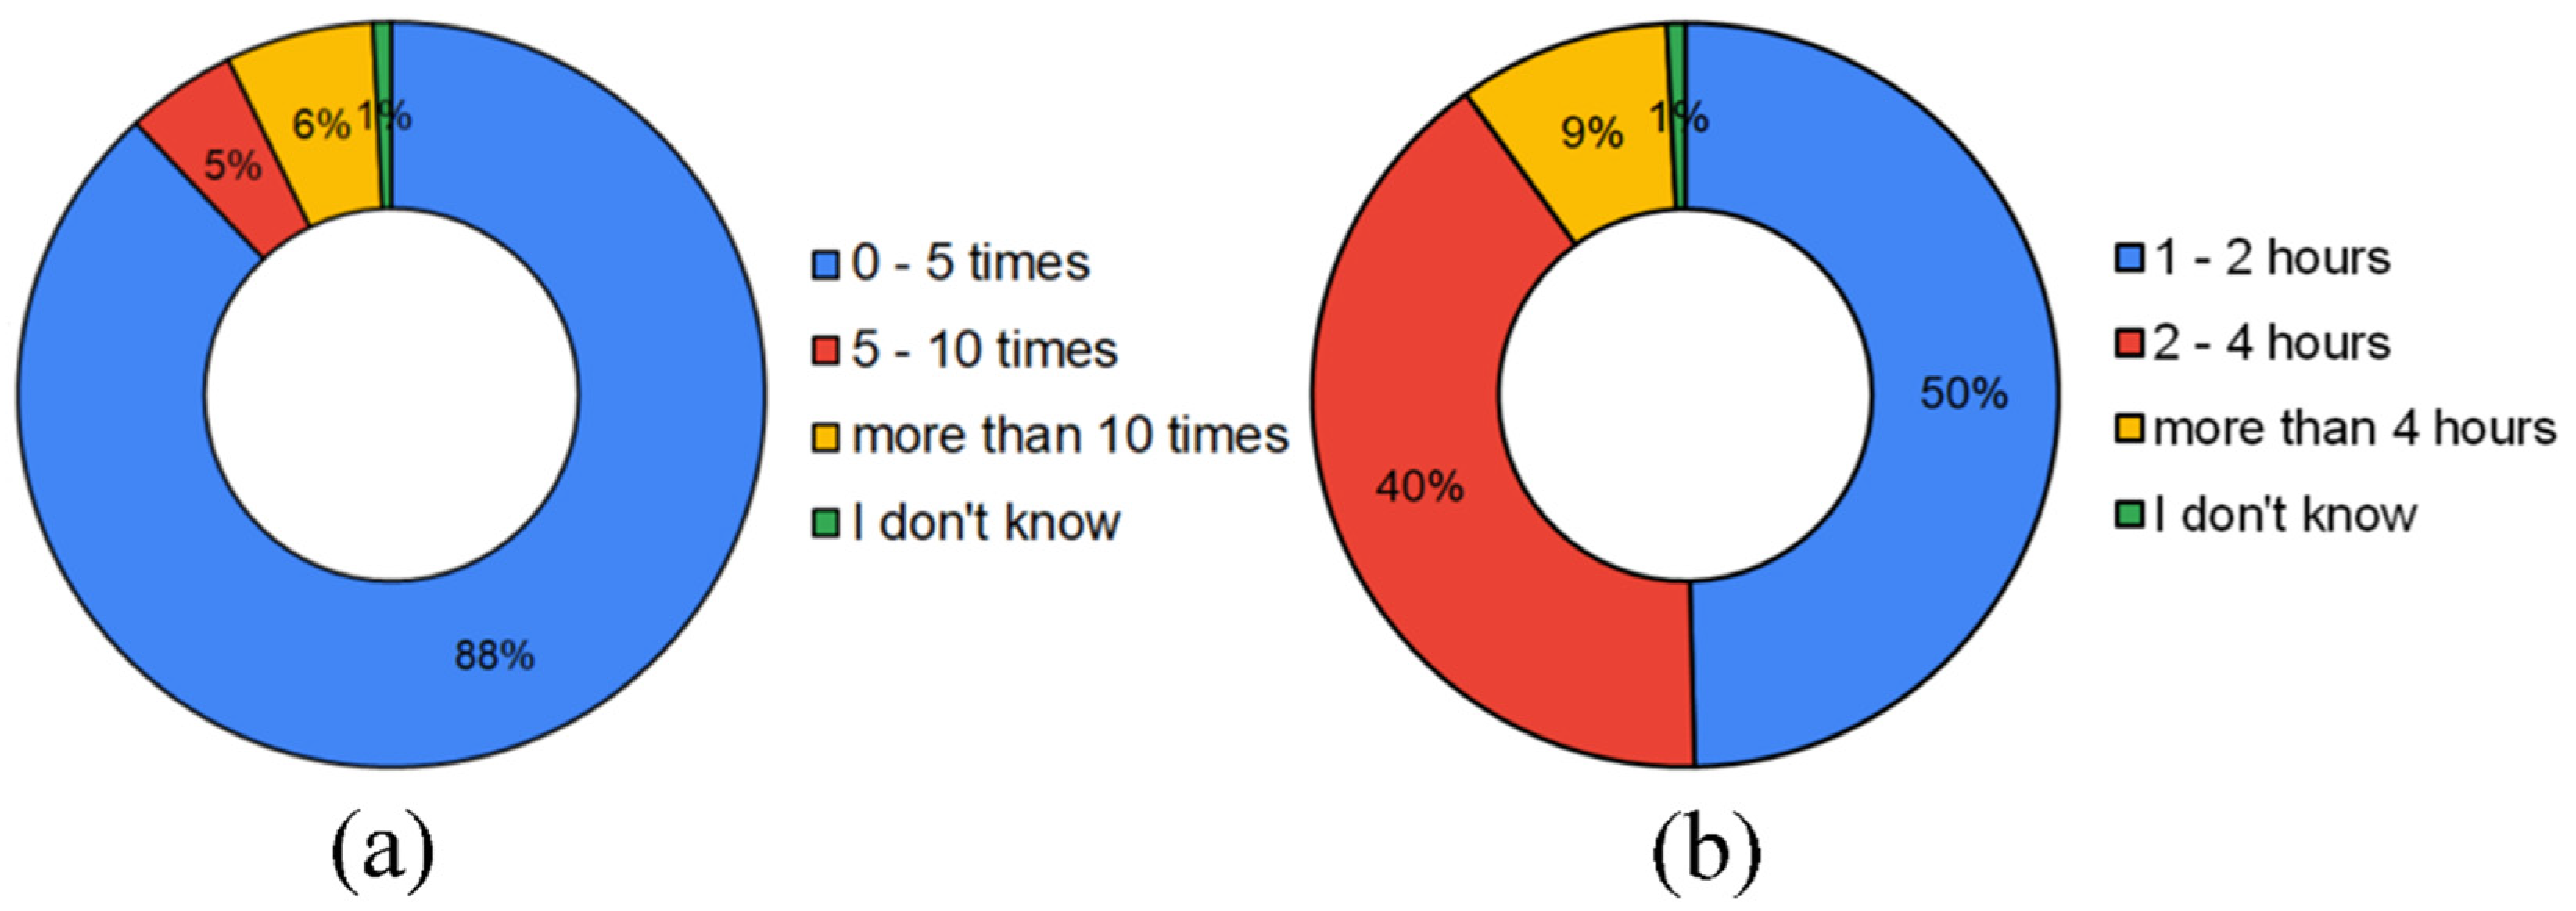
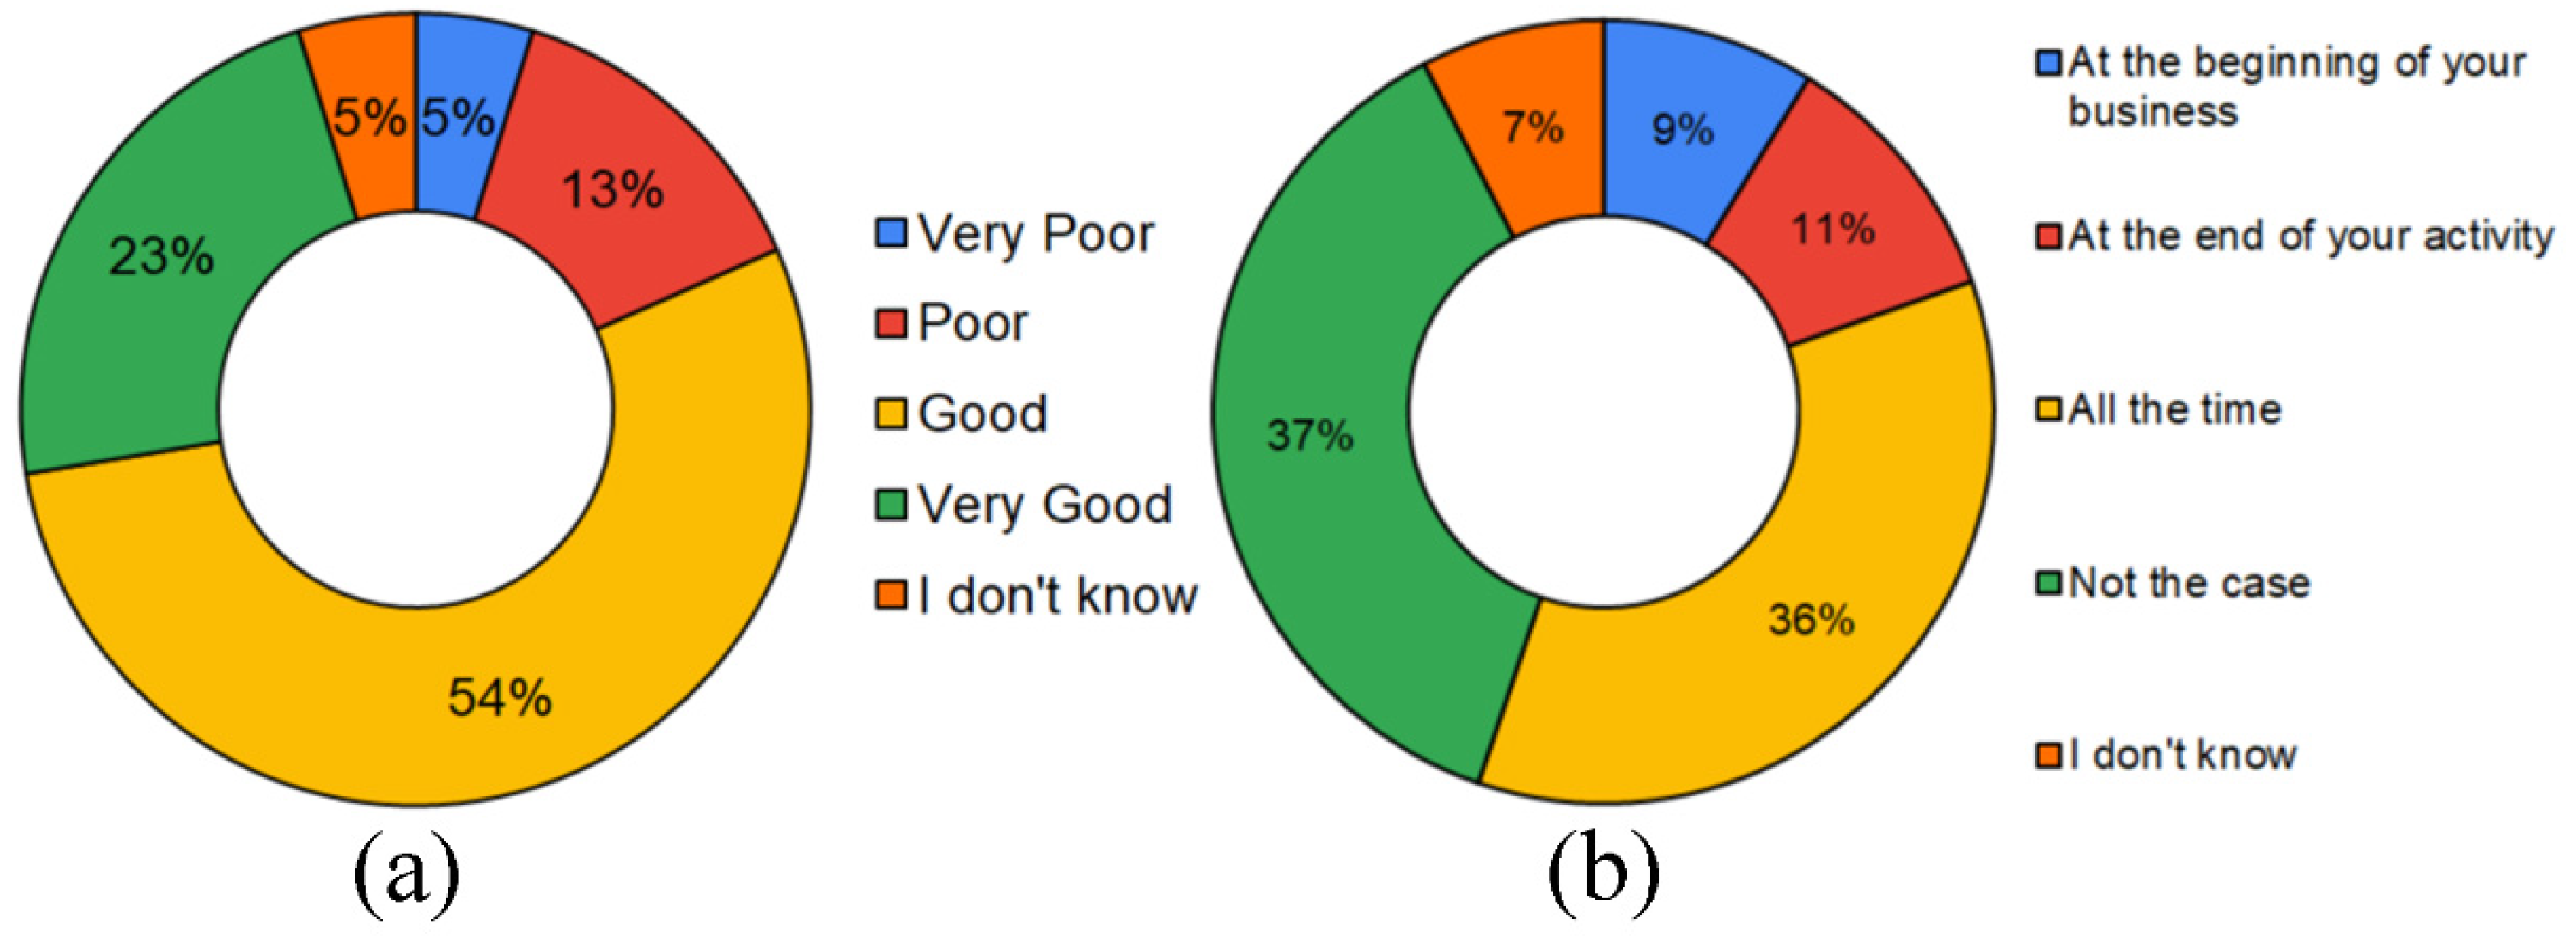
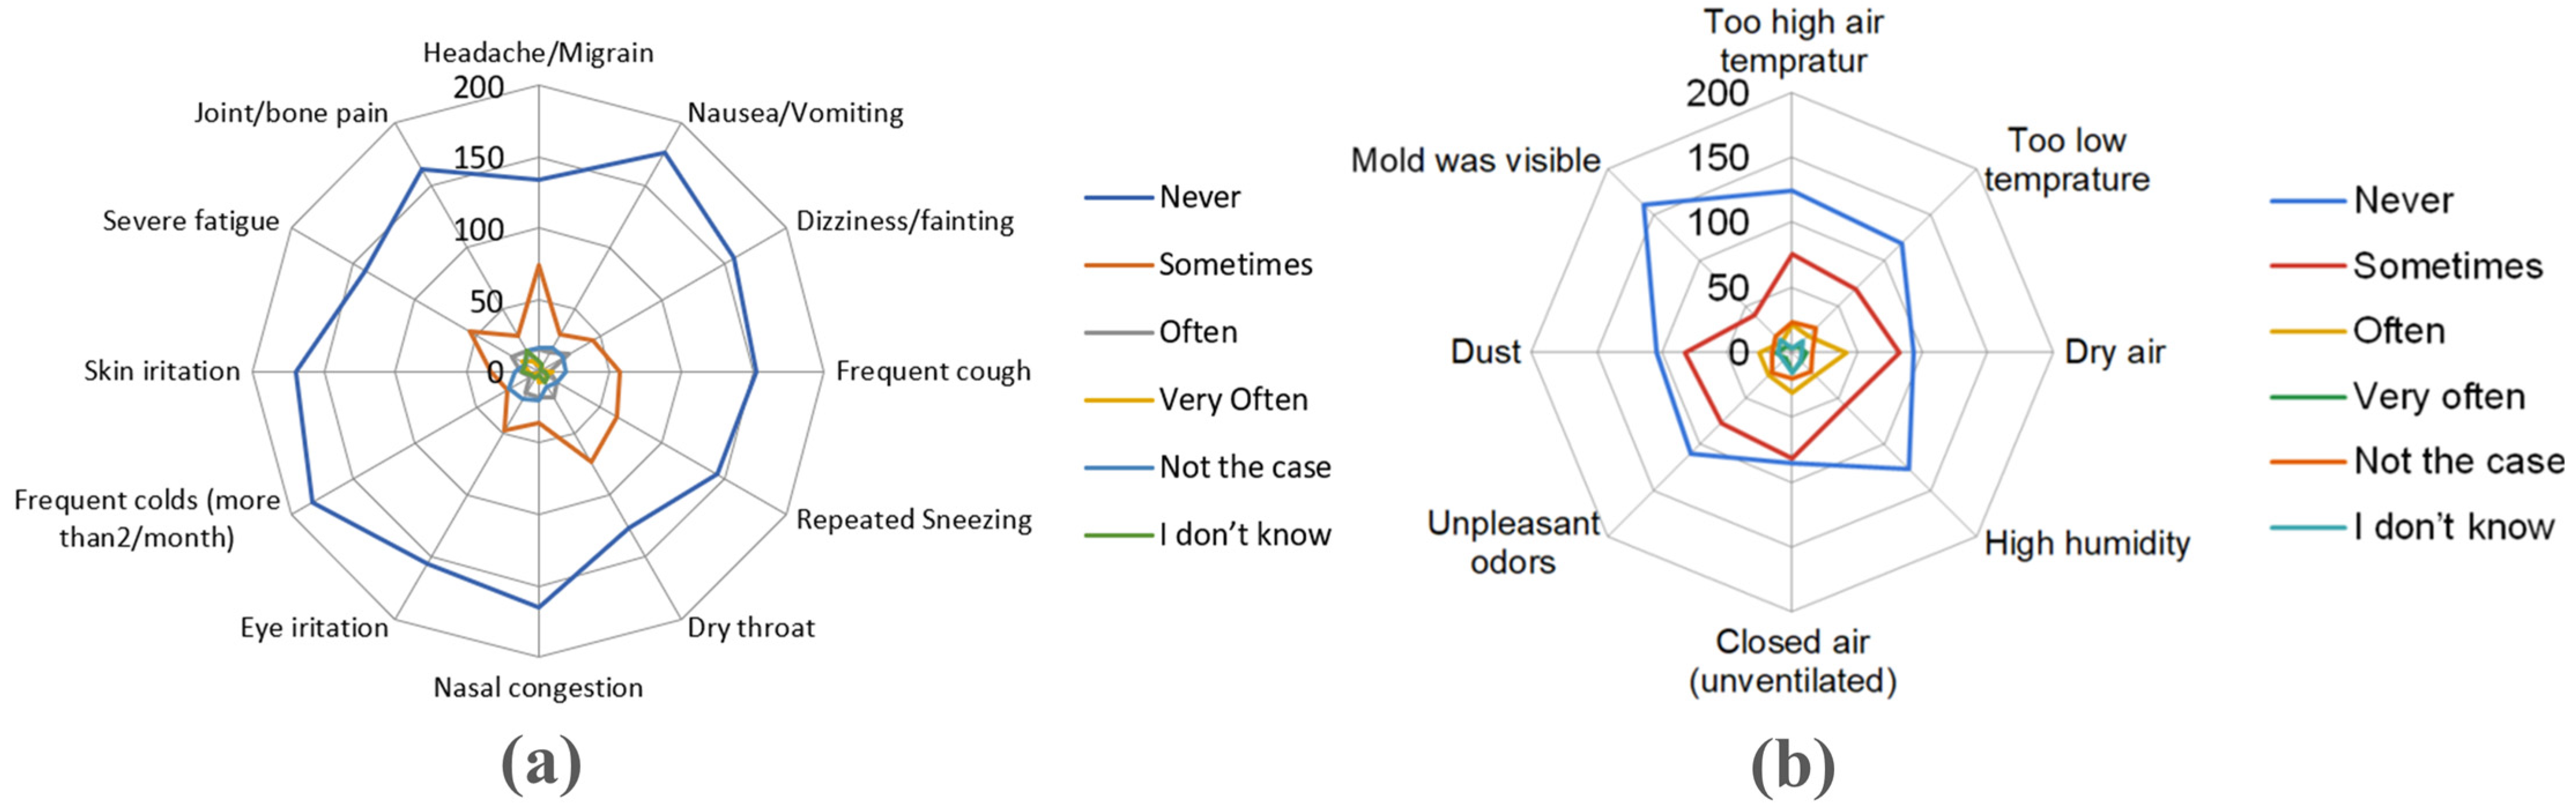
3.1. The Results of the Questionnaire Implementation

Among the 250 respondents, 108 (43%) were men, and 142 (57%) were women. Most of them, 71 respondents, were aged between 19–25 years, followed by those between 14–18 years (62 respondents) and the 26–35 age group (52 respondents). The smallest group comprised those over 61, represented by only 12 respondents. About 11% declared that they were workers, 10% did not have a stable job (they were mainly represented by pupils and students), 8% were staff with higher education, and 7% were entrepreneurs and 7% were workers in the tourism and services industry (Figure 3). The majority of respondents (220–88%) visited Darvas-La Roche House less than five times, 16 respondents (6%) visited more than 10 times, while 12 (5%) between five and 10 times (Figure 4a). According to the respondents, visiting the museum mostly lasted (50% of the cases) between 1 and 2 h, 101 (40%) of them usually visited it in 2–4 h, while only 23 (9%) needed more than four hours for a visit (Figure 4b).
Approximately 77% of the respondents were satisfied with the indoor air quality, 23% evaluating its quality as very good, while 54% recognized it as good. On the contrary, 13% of them claim that the air is poor, while 5% stated that it is very poor (Figure 5a). Among those who report problems regarding air quality, they claimed that they felt most acutely throughout the activities (36%), at the end of the activities (11%) but also at the beginning (9%) (Figure 5b).
Based on the data presented in Figure 6a, it can be explained that, generally, the respondents never experienced disease symptoms when they visited the exhibition spaces. Of the 24 respondents out of 250, approximately 9.8% often felt dizziness/fainting. More than 54% never felt any disease symptoms during a visit to the exhibition room. The most common ailments that respondents felt were headache, dry throat, cough, fatigue and eye irritation; but these symptoms appeared only sometimes, without being based on a well-established pattern. Regarding the influence of the quality of the indoor microclimate on visitors and employees, most of them declared that they never encountered any inconveniences. Some claimed that sometimes they suffered due to high temperature differences, dry and unventilated air, dust in suspension and unpleasant smells. Other respondents (47) stated that they quite often encountered air that was too dry and dusty (Figure 6b).

3.2. Implementation of Statistical Analyses

Furthermore, to determine the effect of the respondent’s health on the discomfort and disease symptoms when visiting the exhibition spaces, two statistical calculations were applied. The results show that there is a strong correlation between the pre-existing conditions/habits of visitors and employees and the symptoms they face after spending a certain amount of time inside the exhibition spaces.

3.2.1. The Influence between Health and Discomfort in the Exhibition Spaces

Based on the data presented in Table 1, it can be seen that smokers have an effect on discomfort in exhibition spaces seen from the significance value of very high temperature (0.023 < 0.05), closed and unventilated air (0.000 < 0.05) and dust (0.013 < 0.05). Wearing contact lenses influences discomfort in exhibition spaces, seen from the significance value of too low temperature (0.048 < 0.05), high humidity (0.010 < 0.05) and unventilated (0.000 < 0.05). Medical treatment to which the respondents were subjected contributed to the disturbance created in the exhibition spaces by the significance value of unpleasant odors (0.015 < 0.05) and visible mold (0.000 < 0.05); while health problems affected discomfort by significance value of too high temperature (0.006 < 0.05), dry air (0.018), high humidity (0.001), unventilated air (0.000 < 0.05), unpleasant odors (0.002 < 0.05), dust (0.001 < 0.05) and molds (0.006 < 0.05). All this indicates a positive correlation between the analyzed variables, so that the influence between health and discomfort is one of reciprocity and interdependence. We want to note that the significance value, the p-value, is the coefficient utilized in this argument. The p-value is used in this situation to establish whether there is a significant association between the variables being studied and their impact on discomfort in exhibition spaces, such as smoking, using contact lenses, receiving medical treatment, and having health issues. The null hypothesis, according to which there is no association between the variables under investigation, is tested using the p-value. A statistically significant association exists between the variables if the p-value is less than 0.05. According to this argument, there is a substantial correlation between smoking, using contact lenses, receiving medical attention, and health issues and their impact on discomfort in exhibition spaces. All of the p-values stated in this argument are less than 0.05.
The statistical analysis’s findings suggest a significant linear association between the number of severe smokers and the discomfort felt in the exhibition area. The null hypothesis (H0) was rejected, indicating a statistically significant correlation between the two variables. This study underscores the need for initiatives to lower smoking prevalence in such situations and has significant implications for understanding the factors influencing smoking behavior in public settings. The data also showed a substantial linear link between the discomfort felt in the exhibition space and additional elements such as contact lens use, medical care, and health issues. In this instance, the rejection of H0 shows that these characteristics are also significant predictors of discomfort felt in public areas. This finding emphasizes the significance of considering various variables when developing treatments to enhance public health outcomes. Overall, our results shed important light on the intricate interplay between personality traits and environmental variables affecting public health behaviors. This study can guide focused actions to lower smoking prevalence and enhance overall public health outcomes by identifying important determinants of bother experienced in exhibition settings. More research is required to fully understand these links and create successful ways to promote healthy behaviors in public environments (Table 2).
The study’s summary model sheds light on the degree of correlation between different variables, according to the Adjusted R-Square correlation coefficient, which is used to gauge the strength of the correlation between smoker variables and Y. Variable X influences Y to the extent of 10.9%, with other variables influencing the remaining percentage. The Adjusted R-Square correlation coefficient for medical treatment variables is 0.113, which shows a strong link between these and Y. Variable X controls Y by 11.3%. Wearing contacts, on the other hand, offers a weaker connection with Y, with an Adjusted R-square correlation coefficient of 0.065 and variable X having a 6.5% effect on Y. The study also shows that, as demonstrated by an Adjusted R-Square correlation coefficient of 0.24, health problem factors reveal a much higher association level with Y than any other variable evaluated. This implies that, while other factors affect the remaining percentage, variable X significantly impacts Y by 24.6%. It is critical to emphasize that these findings substantially influence healthcare practitioners and decision-makers in creating efficient interventions and strategies to deal with smoking-related health issues and medical care. Additionally, by being aware of the different degrees of connection between various variables, healthcare professionals can better adapt their treatment to fit each patient’s specific needs and circumstances (Table 3).
A multiple linear regression test using the Enter method is to enter all predictor variables with sig t >. The value of the variable regression coefficient is as follows. The multiple linear regression equation model proves that:
  • Smoker = 2.322 − 0.321 (too high temperature) + 0.033 (too low temperature) − 0.062 (dry air) + 0.150 (high humidity) + 0.211 (closed air unventilated) + 0.010 (Unpleasant odors) + 0.187 (dust) − 0.061 (visible mold);
  • Wearing Contact Lenses = 1.286 − 0.131 (too high temperature) − 0.101 (too low temperature) + 0.011 (dry air) + 0.182 (high humidity) + 0.138 (closed air unventilated) − 0.106 (Unpleasant odors) + 0.024 (dust) + 0.032 (visible mold);
  • Medical Treatment = 1.261 − 0.178 (too high temperature) + 0.022 (too low temperature) + 0.091 (dry air) + 0.056 (high humidity) + 0.029 (closed air unventilated) − 0.153 (Unpleasant odors) − 0.010 dust + 0.244 (visible mold);
  • Health Problems = 0.648 − 0.269 (too high temperature) − 0.042 (too low temperature) + 0.151 (dry air) + 0.219 (high humidity) + 0.294 (closed air unventilated) − 0.185 (Unpleasant odors) − 0.178 (dust) + 0.124 (visible mold).

3.2.2. The Influence between Health and Disease Symptoms in the Exhibitions Space

Based on the data presented in Table 4, it could be stated that smoking has an effect on symptoms in exhibition spaces seen from the headache significance value (0.000 < 0.05), nausea (0.001 < 0.05), dizziness (0.022 < 0.05), dry throat (0.000 < 0.05) and skin irritation (0.007 < 0.05). Those who wear contact lenses declared that they feel affected inside the museum by dizziness (0.000 < 0.05), dry throat (0.000 < 0.05), nasal congestion (0.000 < 0.05) and joint/bone pain (0.029 < 0.05). Those under treatment indicated increased sensitivity to dizziness (0.041 < 0.05), repeated sneezing (0.000 < 0.05) and skin irritation (0.000 < 0.05). Finally, health problems affected symptoms in exhibition spaces seen from the significance value of dizziness (0.044 < 0.05), dry throat (0.000 < 0.05), skin irritation (0.000 < 0.05) and joint/bone pain (0.000 < 0.05).
The current study aimed to examine the connections between symptoms in an exhibition setting and significant smoking variables, as well as other potential influences such as contact lens use, medical care, and health issues. With a Sig value of 0.000, less than the preset alpha limit, the statistical analysis’s findings showed that the linear model between smokers and symptoms in the exhibition space was significant. According to this result, H0—which contends that no conclusive link exists between smokers and symptoms in the exhibition space—can be ruled out. Additionally, the linear model between symptoms in the exhibition space and contact lens use, medical care and health issues yielded comparable results. Given that each component has a Sig value of 0.000, which is less than, H0 can also be rejected for each. These results indicate a strong correlation between these factors and the symptoms people experience in exhibition venues.
It is important to remember that smoking has been a significant risk factor for several health issues, including cancer and respiratory disorders (CDC, 2021). Smokers may develop more symptoms when exposed to environmental elements such as those in exhibition rooms. Similarly, wearing contact lenses or having specific medical conditions may worsen the sensations people experience in these situations. These findings significantly impact public health initiatives intended to lessen exposure to hazardous environmental elements in exhibition venues. Targeted interventions can be created to limit exposure and enhance overall health outcomes for those who frequent these places by identifying the precise risk variables linked to symptom exacerbation (Table 5).
The summary model provides an overview of the Adjusted R-Square correlation coefficient, which measures the level of relationship between medical treatment variables and their impact on Y. The coefficient for medical treatment variables is 0.145, indicating that variable X affects Y by 14.5%, while other variables influence the remaining percentage. Similarly, the summary model reveals that smoker variables have a correlation coefficient of 0.255, meaning that variable X affects Y by 25.5%. On the other hand, the summary model also shows that wearing contact lenses has a correlation coefficient of 0.290, indicating that variable X affects Y by 29%. This suggests a stronger relationship between wearing contact lenses and their impact on Y than medical treatment and smoker variables (Table 6).
Additionally, the summary model highlights that health problem variables have a correlation coefficient of 0.437, meaning that variable X affects Y by 43.7%. This indicates a significant relationship between health problems and their impact on Y. Overall, these findings suggest that different variables have varying degrees of influence on Y and should be considered when analyzing data related to medical treatment, smoking habits, wearing contact lenses and health problems. Further research could explore these relationships in more detail to better understand how these factors affect outcomes in various contexts.
A multiple linear regression test using the enter method is to enter all predictor variables with sig t > α. The value of the variable regression coefficient is as follows:
  • Smoker = 3.151 + 0.829 (headache) − 0.446 (nausea) − 0.692 (dizziness) + 0.113 (frequent cough) + 0.128 (repeated sneezing) + 0.306 (dry throat) + 0.004 (nasal congestion) − 0.058 (eye irritation) + 0.002 (frequent colds) − 0.221 (skin irritation) − 0.044 (severe fatigue) + 0.045 (joint/bone pain);
  • Wearing Contact Lenses = 0.999 + 0.012 (headache) + 0.014 (nausea) − 1.138 (dizziness) − 0.016 (frequent cough) + 0.061 (repeated sneezing) + 0.254 (dry throat) + 0.936 (nasal congestion) − 0.092 (eye irritation) + 0.028 (frequent colds) − 0.107 (skin irritation) − 0.032 (severe fatigue) + 0.090 (joint/bone pain);
  • Medical Treatment = 1.976 + 0.023 (headache) + 0.135 (nausea) − 0.496 (dizziness) − 0.082 (frequent cough) + 0.544 (repeated sneezing) + 0.017 (dry throat) + 0.058 (nasal congestion) − 0.041 (eye irritation) + 0.027 (frequent colds) − 0.262 (skin irritation) − 0.008 (severe fatigue) + 0.064 (joint/bone pain);
  • Health problems = 0.871 + 0.061 (headache) + 0.061 (nausea) − 0.395 (dizziness) + 0.030 (frequent cough) + 0.131 (repeated sneezing) + 0.522 (dry throat) − 0.144 (nasal congestion) − 0.140 (eye irritation) + 0.046 (frequent colds) − 0.252 (skin irritation) − 0.081 (severe fatigue) + 0.211 (joint/bone pain).

4. Conclusions

The findings of the study revealed that the perception of employees and visitors on the quality of the microclimate inside Darvas-La Roche House is mostly good; most respondents viewed the indoor air as good (54%) or very good (23%), only a small percentage perceiving it as poor (13%) or very poor (5%). Among those who categorized the indoor microclimate as inappropriate, 37% felt discomfort throughout the indoor activity, while 11% reported discomfort at the end of the tour and 9% at the beginning of the activity. Most of the respondents symptoms disappeared after leaving the museum, but in some cases, it persisted throughout the day.
The respondents associated most of the symptoms with too high or too low temperature, dry and unventilated air, as well as a large amount of dust in suspension. All these mainly led to the appearance of migraines, severe fatigue, dizziness, frequent coughing, repeated sneezing, dry throat and eye irritation among the visitors. Most of the respondents who declared that they experienced such symptoms after spending time in the museum also indicated that they have health problems, are under medical treatment, wear contact lenses or are smokers. Statistical analyses have indicated a strong correlation between pre-existing conditions and the variables related to disease symptoms (nasal congestion, eye and skin irritations, coughs, migraines, frequent colds, etc.) and/or discomfort sensations (dry air, humidity sea, unpleasant smells, etc.) induced by the internal microclimate.
In conclusion, for most of the respondents, the indoor microclimate in Darvas-La Roche House did not pose any potential harmful effect. Of the 20% who were affected, most reported pre-existing conditions and health problems. Thus, it can be assumed that the internal microclimate is not favorable for those who face health problems, having the potential to accentuate the manifestations of pre-existing conditions.
Regarding the limitations of the present study, it does not take into account the identification of the exhibition spaces where the discomfort is more pronounced, taking into account that the influence on human health is not constant over the entire museum. At the same time, it was impossible to monitor the medium and long-term effects that the indoor microclimate has on the visitors, in respect to what extent the symptoms experienced pass after leaving the museum or not.

Author Contributions

Conceptualization, D.C.I., T.C. and G.V.H.; Methodology, A.I. and S.W.B.; Software, S.W.B. and L.B.; Validation, T.B. and F.T.; Writing: original draft preparation, A.C.P., V.G., T.H.H., B.S. and M.A.H.; Writing: review and editing, T.C., A.I. and G.V.H.; Visualization, D.C.I.; Supervision, D.C.I. and M.A.H. All authors have read and agreed to the published version of the manuscript.

Funding

This work was supported by the Deanship of Scientific Research, Vice Presidency for Graduate Studies and Scientific Research, King Faisal University, Saudi Arabia [Grant No. 3272].

Institutional Review Board Statement

Not applicable.

Informed Consent Statement

Not applicable.

Data Availability Statement

The data presented in this study may be obtained on request from the corresponding author.

Acknowledgments

The research undertaken was made possible by the equal scientific involvement of all the authors concerned.

Conflicts of Interest

The authors declare no conflict of interest.

References

  1. Aranburu, I.; Plaza, B.; Esteban, M. Sustainable Cultural Tourism in Urban Destinations: Does Space Matter? Sustain. Sci. Pract. Policy 2016, 8, 699. [Google Scholar] [CrossRef]
  2. Stoica, G.D.; Andreiana, V.-A.; Duica, M.C.; Stefan, M.-C.; Susanu, I.O.; Coman, M.D.; Iancu, D. Perspectives for the Development of Sustainable Cultural Tourism. Sustain. Sci. Pract. Policy 2022, 14, 5678. [Google Scholar] [CrossRef]
  3. To, C.M. Assessment of factors affecting spiritual cultural tourism an Giang Province, Vietnam. GeoJ. Tour. Geosites 2023, 46, 227–233. [Google Scholar] [CrossRef]
  4. Wendt, J.A.; Ersöz Tüğen, A. The art of terracotta from the perspective of cultural geography: Tavas case (Denizli/Turkey). GeoJ. Tour. Geosites 2022, 43, 1005–1012. [Google Scholar] [CrossRef]
  5. Lajçi, D.; Kuqi, B.; Fetahaj, A.; Osmanollaj, S. The values of cultural heritage in the Rugova region in promoting the development of tourism in Kosovo. GeoJ. Tour. Geosites 2022, 41, 502–508. [Google Scholar] [CrossRef]
  6. Gamal, R.; Abdelkafy, J.; Soliman, A. The atmospheric elements of the egyptian museums and their effect on the egyptians’ intentions to revisit. GeoJ. Tour. Geosites 2023, 46, 148–155. [Google Scholar] [CrossRef]
  7. Krakowiak, B. Museums in cultural tourism in Poland. Turyzm 2013, 23, 23–32. [Google Scholar] [CrossRef]
  8. Vassiliadis, C.; Belenioti, Z.-C. Museums & Cultural Heritage via Social Media: An Integrated Literature Review. Tourismos 2017, 12, 97–132. [Google Scholar] [CrossRef]
  9. Palumbo, R. Enhancing Museums’ Attractiveness through Digitization: An Investigation of Italian Medium and Large-sized Museums and Cultural Institutions. Int. J. Tour. Res. 2022, 24, 202–215. [Google Scholar] [CrossRef]
  10. Herman, G.V.; Grama, V.; Ilieș, A.; Safarov, B.; Ilieș, D.C.; Josan, I.; Buzrukova, M.; Janzakov, B.; Privitera, D.; Dehoorne, O.; et al. The Relationship between Motivation and the Role of the Night of the Museums Event: Case Study in Oradea Municipality, Romania. Sustain. Sci. Pract. Policy 2023, 15, 1738. [Google Scholar] [CrossRef]
  11. Broström, T.; Klenz Larsen, P. Climate Control in Historic Buildings; National Museum of Denmark: Copenhagen, Denmark, 2015. [Google Scholar]
  12. Ortiz, R.; Párraga, M.; Navarrete, J.; Carrasco, I.; de la Vega, E.; Ortiz, M.; Herrera, P.; Jurgens, J.A.; Held, B.W.; Blanchette, R.A. Investigations of biodeterioration by fungi in historic wooden churches of Chiloé, Chile. Microb. Ecol. 2014, 67, 568–575. [Google Scholar] [CrossRef] [PubMed]
  13. Estrada, A.R.; Torres, E.M.; Vázquez, M.A.A.; Piñero, J.L.H.; Lucio, M.A.G.; Martínez, S.M.S. Fungal spores in four catholic churches in the metropolitan area of Monterrey, Nuevo León State, Mexico–First study. Ann. Agric. Environ. Med. 2015, 22, 221–226. [Google Scholar] [CrossRef] [PubMed]
  14. Di Carlo, E.; Chisesi, R.; Barresi, G.; Barbaro, S.; Lombardo, G.; Rotolo, V.; Sebastianelli, M.; Travagliato, G.; Palla, F. Fungi and bacteria in indoor cultural heritage environments: Microbial-related risks for artworks and human health. Environ. Ecol. Res. 2016, 4, 257–264. [Google Scholar] [CrossRef]
  15. de Carvalho, H.P.; Mesquita, N.; Trovão, J.; Rodríguez, S.F.; Pinheiro, A.C.; Gomes, V.; Alcoforado, A.; Gil, F.; Portugal, A. Fungal contamination of paintings and wooden sculptures inside the storage room of a museum: Are current norms and reference values adequate? J. Cult. Herit. 2018, 34, 268–276. [Google Scholar] [CrossRef]
  16. Prihatmanti, R.; Bahauddin, A. Indoor Air Quality in Adaptively Reused Heritage Buildings at a UNESCO World Heritage Site, Penang, Malaysia. J. Constr. Dev. Ctries 2014, 19, 69. [Google Scholar]
  17. Bogdan, A.; Chambre, D.; Copolovici, D.M.; Bungau, T.; Bungau, C.C.; Copolovici, L. Heritage Building Preservation in the Process of Sustainable Urban Development: The Case of Brasov Medieval City, Romania. Sustainability 2022, 14, 6959. [Google Scholar] [CrossRef]
  18. Ferdyn-Grygierek, J.; Kaczmarczyk, J.; Blaszczok, M.; Lubina, P.; Koper, P.; Bulińska, A. Hygrothermal risk in museum buildings located in moderate climate. Energies 2020, 13, 344. [Google Scholar] [CrossRef]
  19. Leijonhufvud, G.; Broström, T. Standardizing the indoor climate in historic buildings: Opportunities, challenges and ways forward. J. Archit. Conserv. 2018, 24, 3–18. [Google Scholar] [CrossRef]
  20. Ameen, A.; Mattsson, M.; Boström, H.; Lindelöw, H. Assessment of Thermal Comfort and Air Quality in Office Rooms of a Historic Building: A Case Study in Springtime in Continental Climate. Buildings 2023, 13, 156. [Google Scholar] [CrossRef]
  21. Azmi, A.E.; Abd Rashid, A.; Abd Razak, A. An Assessment of Indoor Air Quality (IAQ) in Foundry Laboratory. In IOP Conference Series: Earth and Environmental Science; IOP Publishing: Bristol, UK, 2022; Volume 1019, p. 012046. [Google Scholar] [CrossRef]
  22. Schwab, C.J.; Straus, D.C. The roles of Penicillium and Aspergillus in sick building syndrome. Adv. Appl. Microbiol. 2004, 55, 215–240. [Google Scholar]
  23. Glevitzky, M.; Aleya, L.; Vica, M.L.; Dumitrel, G.-A.; Avram, M.; Tit, D.M.; Popa, M.; Popa, V.-C.; Behl, T.; Bungau, S. Assessing the microbiological contamination along with environmental factors of old books in the 1490-founded Bistrița Monastery, Romania. Environ. Sci. Pollut. Res. 2021, 28, 8743–8757. [Google Scholar] [CrossRef] [PubMed]
  24. Syazwan Aizat, I.; Juliana, J.; Norhafizalina, O.; Azman, Z.A.; Kamaruzaman, J. Indoor air quality and sick building syndrome in Malaysian buildings. Glob. J. Health Sci. 2009, 1, 126–136. [Google Scholar]
  25. Nur Fadilah, R.; Juliana, J. Indoor air quality (IAQ) and sick buildings syndrome (SBS) among office workers in new and old building in Universiti Putra Malaysia, Serdang. Health Environ. J. 2012, 3, 98–109. [Google Scholar]
  26. Ilies, D.C.; Safarov, B.; Caciora, T.; Ilies, A.; Grama, V.; Ilies, G.; Huniadi, A.; Zharas, B.; Hodor, N.; Sandor, M.; et al. Museal Indoor Air Quality and Public Health: An Integrated Approach for Exhibits Preservation and Ensuring Human Health. Sustainability 2022, 14, 2462. [Google Scholar] [CrossRef]
  27. Oneţ, A.; Ilieş, D.C.; Buhas, S.; Rahotă, D.; Ilieş, A.; Baias, S.; Marcu, F.; Herman, G.V. Microbial air contamination in indoor environment of University Sport Hall. J. Environ. Prot. Ecol. 2018, 19, 694–703. [Google Scholar]
  28. Žuškin, E.; Schachter, E.N.; Mustajbegović, J.; Pucarin-cvetković, J.A.S.N.A.; Doko-Jelinić, J.A.G.O.D.A.; Mučić-Pucić, B.R.A.N.K.A. Indoor air pollution and effects on human health. Period Biol. 2009, 111, 37–40. [Google Scholar]
  29. Abdel-Kareem, O. Monitoring, controlling and prevention of the fungal deterioration of textile artifacts in the museum of Jordanian heritage. Mediterr. Archaeol. Archaeom. 2010, 10, 85–96. [Google Scholar]
  30. Łukaszuk, C.R.; Krajewska-Kułak, E.; Kułak, W. Effects of fungal air pollution on human health. Prog. Health Sci. 2011, 1, 156–164. [Google Scholar]
  31. Khan, A.H.; Karuppayil, S.M. Fungal pollution of indoor environments and its management. Saudi J. Biol. Sci. 2012, 19, 405–426. [Google Scholar] [CrossRef]
  32. Méheust, D.; Le Cann, P.; Reboux, G.; Millon, L.; Gangneux, J.P. Indoor fungal contamination: Health risks and measurement methods in hospitals, homes and workplaces. Crit. Rev. Microbiol. 2014, 40, 248–260. [Google Scholar] [CrossRef]
  33. Hayleeyesus, S.F.; Manaye, A.M. Microbiological quality of indoor air in university libraries. Asian Pac. J. Trop. Biomed. 2014, 4, S312–S317. [Google Scholar] [CrossRef] [PubMed]
  34. Mousavi, B.; Hedayati, M.T.; Hedayati, N.; Ilkit, M.; Syedmousavi, S. Aspergillus species in indoor environments and their possible occupational and public health hazards. Curr. Med. Mycol. 2016, 2, 36–42. [Google Scholar] [CrossRef] [PubMed]
  35. Egbuta, M.A.; Mwanza, M.; Babalola, O.O. Health risks associated with exposure to filamentous fungi. Int. J. Environ. Res. Public Health 2017, 14, 719. [Google Scholar] [CrossRef] [PubMed]
  36. Levin, H. Indoor climate and global climate change: Exploring connections. In Proceedings of the 11th International Conference on Indoor Air Quality and Climate, Indoor Air, Copenhagen, Denmark, 17–22 August 2008. [Google Scholar]
  37. Brennan, T. Indoor Environmental Quality and Climate Change; US Environmental Protection Agency: Washington, DC, USA, 2010. Available online: https://www.epa.gov/sites/default/files/2014-08/documents/climate_change_brennan.pdf (accessed on 15 May 2023).
  38. Institute of Medicine. Climate Change, the Indoor Environment, and Health; The National Academies Press: Washington, DC, USA, 2011; pp. 1–272. [Google Scholar] [CrossRef]
  39. Nazaroff, W.W. Exploring the consequences of climate change for indoor air quality. Environ. Res. Lett. 2013, 8, 015022. [Google Scholar] [CrossRef]
  40. Bungau, C.C.; Bungau, T.; Prada, I.F.; Prada, M.F. Green Buildings as a Necessity for Sustainable Environment Development: Dilemmas and Challenges. Sustainability 2022, 14, 13121. [Google Scholar] [CrossRef]
  41. Bungau, C.C.; Bungau, C.; Toadere, M.T.; Prada-Hanga, I.F.; Bungau, T.; Popescu, D.E.; Prada, M.F. Solutions for an Ecological and Healthy Retrofitting of Buildings on the Campus of the University of Oradea, Romania, Built Starting from 1911 to 1913. Sustainability 2023, 15, 6541. [Google Scholar] [CrossRef]
  42. Ghemis, M.T.; Scurt, A.A.; Bob, C.; Bungau, C. An analysis of sustainability about rehabilitation and reconversion of an old building. Modern technologies for 3rd Millennium. In Proceedings of the 17th National Technical-Scientific Conference on Modern Technologies for the 3rd Millennium, Oradea, Romania, 22–23 March 2018; pp. 273–278. [Google Scholar]
  43. Leissner, J.; Kilian, R.; Kotova, L.; Jacob, D.; Mikolajewicz, U.; Broström, T.; Ashley-Smith, J.; Schellen, H.L.; Martens, M.; Van Schijndel, J.; et al. Climate for culture: Assessing the impact of climate change on the future indoor climate in historic buildings using simulations. Herit. Sci. 2015, 3, 38. [Google Scholar] [CrossRef]
  44. Nakicenovic, N.; Alcamo, J.; Davis, G.; Vries, B.D.; Fenhann, J.; Gaffin, S.; Zhou, D. Special Report on Emissions Scenarios. 2020. Available online: https://www.ipcc.ch/site/assets/uploads/2018/03/sres-en.pdf (accessed on 15 May 2023).
  45. Lankester, P.; Brimblecombe, P. The impact of future climate on historic interiors. Sci. Total Environ. 2012, 417–418, 248–254. [Google Scholar] [CrossRef]
  46. Muñoz González, C.M.; León Rodríguez, A.L.; Suárez Medina, R.; Ruiz Jaramillo, J. Effects of future climate change on the preservation of artworks, thermal comfort and energy consumption in historic buildings. Appl. Energy 2020, 276, 115483. [Google Scholar] [CrossRef]
  47. Vardoulakis, S.; Dimitroulopoulou, C.; Thornes, J.; Lai, K.M.; Taylor, J.; Myers, I.; Heaviside, C.; Mavrogianni, A.; Shrubsole, C.; Chalabi, Z.; et al. Impact of climate change on the domestic indoor environment and associated health risks in the UK. Environ. Int. 2015, 85, 299–313. [Google Scholar] [CrossRef]
  48. Pioppi, B.; Pigliautile, I.; Piselli, C.; Pisello, A.L. Cultural heritage microclimate change: Human-centric approach to experimentally investigate intra-urban overheating and numerically assess foreseen future scenarios impact. Sci. Total Environ. 2020, 703, 134448. [Google Scholar] [CrossRef] [PubMed]
  49. Yang, Y.; Javanroodi, K.; Nik, V.M. Climate change and energy performance of European residential building stocks—A comprehensive impact assessment using climate big data from the coordinated regional climate downscaling experiment. Appl. Energy 2021, 298, 117246. [Google Scholar] [CrossRef]
  50. Mansouri, A.; Wei, W.; Alessandrini, J.M.; Mandin, C.; Blondeau, P. Impact of Climate Change on Indoor Air Quality: A Review. Int. J. Environ. Res. Public Health 2022, 19, 15616. [Google Scholar] [CrossRef]
  51. Bandyopadhyay, B.; Banerjee, M. Decarbonization of cooling of buildings. Sol. Compass 2022, 2, 100025. [Google Scholar] [CrossRef]
  52. Ilies, D.C.; Marcu, F.; Caciora, T.; Indrie, L.; Ilies, A.; Albu, A.; Costea, M.; Burtă, L.; Baias, S.; Ilies, M.; et al. Investigations of Museum Indoor Microclimate and Air Quality. Case Study from Romania. Atmosphere 2021, 12, 286. [Google Scholar] [CrossRef]
  53. Orthel, B.D. Linking public health and heritage work. Int. J. Herit. Stud. 2022, 28, 44–58. [Google Scholar] [CrossRef]
  54. Ilieș, D.C.; Buhaș, R.; Ilieș, A.; Gaceu, O.; Oneț, A.; Buhaș, S.; Rahotă, D.; Dragoș, P.; Baias, S.; Marcu, F.; et al. Indoor air quality issues. Case study: The Multipurpose Sports Hall of the University of Oradea. Environ. Eng. Manag. J. 2018, 17, 2999–3005. [Google Scholar]
  55. Onet, A.; Ilies, D.C.; Ilies, A.; Herman, G.V.; Burta, L.; Marcu, F.; Buha, R.; Caciora, T.; Baias, S.; Indoor, C.O.; et al. Indoor air quality assessement and its perception, Case study historic wooden church, Romania. Rom. Biotechnol. Lett. 2020, 25, 1547–1553. [Google Scholar] [CrossRef]
  56. Mašková, L.; Smolík, J.; Ďurovič, M. Characterization of indoor air quality in different archives—Possible implications for books and manuscripts. Build. Environ. 2017, 120, 77–84. [Google Scholar] [CrossRef]
  57. Indrie, L.; Oana, D.; Ilieş, M.; Ilieş, D.C.; Lincu, A.; Ilieş, A.; Ștefan, B.; Herman, G.V.; Aurelia, O.; Costea, M.A.; et al. Indoor air quality of museums and conservation of textiles art works. Case study: Salacea Museum House Romania. Ind. Text. 2019, 70, 88–93. [Google Scholar]
  58. Ilies, D.C.; Onet, A.; Marcu, F.; Gaceu, O.; Timar, A.; Baias, S.; Ilies, A.; Herman, G.V.; Costea, M.; Tepelea, M.; et al. Investigations on air quality in the historic wooden church in Oradea City, Romania. Environ. Eng. Manag. J. 2018, 17, 2731–2739. [Google Scholar] [CrossRef]
  59. Saini, J.; Dutta, M.; Marques, G. Indoor air quality monitoring systems based on internet of things: A systematic review. Int. J. Environ. Res. Public Health 2020, 17, 4942. [Google Scholar] [CrossRef] [PubMed]
  60. Marcu, F.; Hodor, N.; Indrie, L.; Dejeu, P.; Ilieș, M.; Albu, A.; Sandor, M.; Sicora, C.; Costea, M.; Ilieș, D.C.; et al. Microbiological, health and comfort aspects of indoor air quality in a Romanian historical wooden church. Int. J. Environ. Res. Public Health 2021, 18, 9908. [Google Scholar] [CrossRef] [PubMed]
  61. Borrego, S.; Lavin, P.; Perdomo, I.; Gómez de Saravia, S.; Guiamet, P. Determination of indoor air quality in archives and biodeterioration of the documentary heritage. Int. Sch. Res. Not. 2012, 2012, 680598. [Google Scholar] [CrossRef] [PubMed]
  62. Gaceu, O.; Ilieș, D.C.; Baias, Ș.; Georgiță, M.; Ilieș, A.; Caciora, T.; Indrie, L.; Albu, A.; Herman, G.V.; Baidog, A.; et al. Microclimatic Characteristics and Air Quality Inside the National Archives of Bihor County, Romania. Environ. Eng. Manag. J. (EEMJ) 2021, 20, 459–466. [Google Scholar]
  63. Wysocka, M. Analysis of indoor air quality in a naturally ventilated church. E3S Web Conf. 2018, 49, 00134. [Google Scholar] [CrossRef]
  64. Cincinelli, A.; Martellini, T.; Amore, A.; Dei, L.; Marrazza, G.; Carretti, E.; Belosi, F.; Ravegnani, F.; Leva, P. Measurement of volatile organic compounds (VOCs) in libraries and archives in Florence (Italy). Sci. Total Environ. 2016, 572, 333–339. [Google Scholar] [CrossRef]
  65. Gonzalez-Martin, J.; Kraakman, N.J.R.; Perez, C.; Lebrero, R.; Munoz, R. A state–of–the-art review on indoor air pollution and strategies for indoor air pollution control. Chemosphere 2021, 262, 128376. [Google Scholar] [CrossRef]
  66. Zorpas, A.A.; Skouroupatis, A. Indoor air quality evaluation of two museums in a subtropical climate conditions. Sustain. Cities Soc. 2016, 20, 52–60. [Google Scholar] [CrossRef]
  67. Dzulkifli, S.M.; Abdullah, A.H.; Leman, A.M. Indoor Air Quality of Museum Building Environment in a Tropical Climate: Proposed Study. In Proceedings of the 3rd Scientific Conference on Occupational Safety and Health, Johor Bahru, Malaysia, 14–17 October 2014. [Google Scholar]
  68. Ilies, A.; Caciora, T.; Marcu, F.; Berdenov, Z.; Ilies, G.; Safarov, B.; Hodor, N.; Grama, V.; Shomali, M.A.A.; Ilies, D.C.; et al. Analysis of the Interior Microclimate in Art Nouveau Heritage Buildings for the Protection of Exhibits and Human Health. Int. J. Environ. Res. Public Health 2022, 19, 16599. [Google Scholar] [CrossRef]
  69. Azuma, K.; Ikeda, K.; Kagi, N.; Yanagi, U.; Osawa, H. Physicochemical risk factors for building-related symptoms in air-conditioned office buildings: Ambient particles and combined exposure to indoor air pollutants. Sci. Total Environ. 2018, 616, 1649–1655. [Google Scholar] [CrossRef] [PubMed]
  70. Baldan, M.; Manente, S.; Izzo, F.C. The role of bio-pollutants in the indoor air quality of old museum buildings: Artworks biodeterioration as preview of human diseases. Environ. Monit. Assess. 2021, 193, 787. [Google Scholar] [CrossRef] [PubMed]
  71. Sunyer, J.; Esnaola, M.; Alvarez-Pedrerol, M.; Forns, J.; Rivas, I.; López-Vicente, M.; Suades-González, E.; Foraster, M.; Garcia-Esteban, R.; Basagaña, X.; et al. Association between traffic-related air pollution in schools and cognitive development in primary school children: A prospective cohort study. PLoS Med. 2015, 12, e1001792. [Google Scholar] [CrossRef] [PubMed]
  72. Tétreault, P.; Mansour, A.; Vachon-Presseau, E.; Schnitzer, T.J.; Apkarian, A.V.; Baliki, M.N. Brain connectivity predicts placebo response across chronic pain clinical trials. PLoS Biol. 2016, 14, e1002570. [Google Scholar] [CrossRef] [PubMed]
  73. Carrion-Matta, A.; Kang, C.M.; Gaffin, J.M.; Hauptman, M.; Phipatanakul, W.; Koutrakis, P.; Gold, D.R. Classroom indoor PM2. 5 sources and exposures in inner-city schools. Environ. Int. 2019, 131, 104968. [Google Scholar] [CrossRef] [PubMed]
  74. Ali, M.U.; Lin, S.; Yousaf, B.; Abbas, Q.; Munir, M.A.M.; Rashid, A.; Zheng, C.; Kuang, X.; Wong, M.H. Pollution characteristics, mechanism of toxicity and health effects of the ultrafine particles in the indoor environment: Current status and future perspectives. Crit. Rev. Environ. Sci. Technol. 2022, 52, 436–473. [Google Scholar] [CrossRef]
  75. Wei, Y.; Jang-Jaccard, J.; Xu, W.; Sabrina, F.; Camtepe, S.; Boulic, M. Lstm-autoencoder based anomaly detection for indoor air quality time series data. IEEE Sens. J. 2023, 23, 3787–3800. [Google Scholar] [CrossRef]
  76. Arar, M.; Jung, C. Analyzing the Perception of Indoor Air Quality (IAQ) from a Survey of New Townhouse Residents in Dubai. Sustainability 2022, 14, 15042. [Google Scholar] [CrossRef]
  77. Aziz, N.; Adman, M.A.; Suhaimi, N.S.; Misbari, S.; Alias, A.R.; Abd Aziz, A.; Lee, L.F.; Khan, M.H. Indoor Air Quality (IAQ) and Related Risk Factors for Sick Building Syndrome (SBS) at the Office and Home: A Systematic Review. In IOP Conference Series: Earth and Environmental Science; IOP Publishing: Bristol, UK, 2023; Volume 1140, p. 012007. [Google Scholar] [CrossRef]
  78. Pei, J.; Qu, M.; Sun, L.; Wang, X.; Yin, Y. The relationship between indoor air quality (IAQ) and perceived air quality (PAQ)—A review and case analysis of Chinese residential environment. Energy Built Environ. 2022, in press. [CrossRef]
  79. Ilies, D.C.; Caciora, T.; Ilies, A.; Berdenov, Z.; Hossain, M.A.; Grama, V.; Dahal, R.K.; Zdrinca, M.; Hassan, T.H.; Herman, G.V.; et al. Microbial Air Quality in the Built Environment—Case Study of Darvas-La Roche Heritage Museum House, Oradea, Romania. Buildings 2023, 13, 620. [Google Scholar] [CrossRef]
Figure 1. The location of Darvas-La Roche Museum House in the Oradea Municipality.
Sustainability 15 08284 g001
Figure 2. The main facade of Darvas-La Roche Museum House.
Sustainability 15 08284 g002
Figure 3. The characteristics of the 250 respondents in terms of gender, age group and occupation.
Sustainability 15 08284 g003
Figure 4. The number of visits and the visiting time of Darvas-La Roche House ((a)—How many times have you visited Casa Darvas La Roche? (b)—Approximately how many hours did it take to visit the Darvas La Roche House?).
Sustainability 15 08284 g004
Figure 5. Evaluation of the indoor air quality by the 250 respondents ((a)—In general, how do you assess the air quality in the exhibition spaces? (b)—If you noticed problems with the air quality in the exhibition spaces, when do you think they are more pronounced?).
Sustainability 15 08284 g005
Figure 6. (a)—The symptoms induced to visitors and employees by the internal microclimate of Darvas-La Roche House; (b)—The influence of indoor air quality of Darvas-La Roche House, potentially harmful to human health.
Sustainability 15 08284 g006
Table 1. Health and bother in exhibition spaces based on coefficient.
SmokerWearing Contact LensesMedical TreatmentHealth Problem
Too high air temperature 0.0230.1830.0910.006
Too low temperature 0.6520.0480.6840.405
Dry air0.5050.8630.1880.018
High humidity0.1340.0100.4480.001
Closed air (unventilated)0.00.00.4850.0
Unpleasant odors0.9070.0750.0150.002
Dust0.0130.6440.8520.001
Visible mold0.3490.4850.00.006
Table 2. Health and discomfort in exhibition spaces based on test.
SmokerWearing Contact LensesMedical TreatmentHealth Problem
Too high air temperature0.000 < 0.050.002 < 0.050.000 < 0.050.000 < 0.05
Too low temperature
Dry air
High humidity
Closed air (unventilated)
Unpleasant odors
Dust
Visible mold
Table 3. Health and bother in exhibition spaces based on model summary.
SmokerWearing Contact LensesEdical TreatmentHealth Problem
Too high air temperatureR = 370

R-square 0.137

Adjusted R-square 0.109

DW 1.812
R = 308

R-square 0.095

Adjusted R-square 0.065

DW 2.094
R = 0.376

R-square 0.142

Adjusted R-square
0.113

DW 1.768
R = 0.520

R-square 0.271

Adjusted R-square
0.246

DW 1.139
Too low temperature
Dry air
High humidity
Closed air (unventilated)
Unpleasant odors
Dust
Visible mold
Table 4. Health and disease symptoms in exhibition spaces based on coefficient.
SmokerWearing Contact LensesMedical TreatmentHealth Problem
Headache/migraine0.00.9070.8500.536
Nausea/vomiting0.0010.8740.2160.860
Dizziness/fainting0.0220.00.0410.044
Frequent cough0.5430.9000.5830.801
Repeated sneezing0.2290.3850.00.057
Dry throat0.00.00.7840.0
Nasal congestion0.9900.00.8070.455
Eye irritation0.6330.2550.6680.074
Frequent colds0.9810.6690.7320.476
Skin irritation0.0070.0500.00.0
Severe fatigue0.6560.6250.9190.200
Joint/bone pain0.4640.0290.1970.0
Table 5. Health and disease symptoms in exhibition spaces based on AVONA test.
SmokerWearing Contact LensesMedical TreatmentHealth Problem
Headache/migraine0.00 < 0.050.00 < 0.050.00 < 0.050.00 < 0.05
Nausea/vomiting
Dizziness/fainting
Frequent cough
Repeated sneezing
Dry throat
Nasal congestion
Eye irritation
Frequent colds
Skin irritation
Severe fatigue
Joint/bone pain
Table 6. Health and disease symptoms in exhibition spaces based on model summary.
SmokerWearing Contact LensesMedical TreatmentHealth Problem
MigraineR = 0.539

R-Square 0.290

Adjusted R-Square
0.255

DW
1.679
R = 0.570

R-Square 0.324

Adjusted R-Square
0.290

DW
2.260
R = 0.431

R-Square 0.186

Adjusted R-Square
0.145

DW
1.622
R = 0.681

R-Square 0.464

Adjusted R-Square
0.437

DW
1.440
Nausea/vomiting
Dizziness/fainting
Frequent cough
Repeated sneezing
Dry throat
Nasal congestion
Eye iritation
Frequent colds
Skin iritation
Severe fatigue
Joint/bone pain
Disclaimer/Publisher’s Note: The statements, opinions and data contained in all publications are solely those of the individual author(s) and contributor(s) and not of MDPI and/or the editor(s). MDPI and/or the editor(s) disclaim responsibility for any injury to people or property resulting from any ideas, methods, instructions or products referred to in the content.

