Article

The Impact of Carbon Emission Trading Policy on Enterprise ESG Performance: Evidence from China

1
SDU-ANU Joint Science College, Shandong University, Weihai 264209, China
2
School of Business, Shandong University, Weihai 264209, China
*
Author to whom correspondence should be addressed.
Sustainability 2023, 15(10), 8279; https://doi.org/10.3390/su15108279
Submission received: 27 March 2023 / Revised: 11 May 2023 / Accepted: 17 May 2023 / Published: 19 May 2023
(This article belongs to the Special Issue Accounting, Corporate Policies and Sustainability)

Abstract

:
The carbon emission trading system profoundly impacts enterprises’ sustainable development as an important market incentive environmental regulation tool. Through data collected from Chinese A-share listed enterprises in Shanghai and Shenzhen from 2011 to 2019 and Bloomberg ESG score data, this paper empirically analyses the impact of carbon emission trading policy on enterprise ESG performance and its channel mechanism using the difference-in-difference (DID) method. Results of this study indicate that carbon emission trading policy improves enterprise ESG performance significantly, and robustness tests confirm these findings. Carbon emission trading policy can encourage enterprises to enhance their R&D investments and promote internal controls, ultimately enhancing their ESG performance. Additionally, carbon emission trading policy positively impacts ESG performance in low-carbon enterprises, enterprises where the CEO is separated from the company, enterprises with a high degree of digital transformation, and enterprises receiving high government subsidies. This paper extends our research into the economic implications of carbon emission trading policy, enriching the literature on market-based environmental regulation policies’ impact on enterprise ESG performance. With respect to governments’ use of carbon emission trading to regulate enterprises environmentally, this paper provides theoretical guidance. It has significant practical implications for improving enterprise ESG performance and sustainability.

1. Introduction

Carbon dioxide emissions and other greenhouse gases are the primary cause of global warming. With climate change caused by carbon emissions and other factors, the international community is trying to coordinate national resources through market-based mechanisms and find effective policies to reduce emissions and save energy [1]. The Kyoto Protocol entered into force in 2005, limiting greenhouse gas emissions for the first time in human history. Following the Kyoto Protocol, developing countries can sell their carbon emissions to developed countries through the Clean Development Mechanism (CDM). While promoting sustainable development and reducing the carbon emissions of developing countries, developed countries can also offset their obligation to reduce carbon emissions [2]. Carbon trading is an emerging environmental energy trading approach born under this system, and it is a market mechanism to promote global greenhouse gas emission reduction [3]. The European Union Emissions Trading Scheme (EU-ETS) is the first carbon trading system in the world. Since its launch in 2005, it has increased with the development of global carbon finance. UE-ETS covers 28 countries in the European Union, occupying the largest share of global trading volume, achieving good results in controlling carbon emissions and the greenhouse effect and protecting the ecological environment [4,5]. Approximately 30% of global carbon emissions are attributed to China, the largest emitter in the world. In addition to seriously polluting the environment, large quantities of carbon dioxide restrict the development of the Chinese economy [6]. To achieve carbon peaking and carbon neutrality, eight provinces and cities in China have established pilot markets in carbon emission trading since 2013, including Beijing, Shanghai, Tianjin, Chongqing, Guangdong, Shenzhen, Hubei, and Fujian [7]. With China’s continued rapid economic growth, carbon emissions have increased significantly, thus promoting the development of carbon financial trading. Several pilot carbon emission trading markets in China have reached 330 million tons of trading volume by April 2021, with a turnover of around 7.4 billion yuan, which has led to a significant reduction in emission levels [8].
Research on the beneficial results of carbon emission trading has steadily increased in recent years because of the environmental and economic benefits and technological innovations that can be achieved through carbon emission trading. The transition to the low carbon economy and the carbon trading system is positively correlated with environmental impacts [9]. The carbon emission trading system can significantly improve heavy polluters’ green development efficiency and promote their green transformation [10]. In a study by Chen et al., carbon emissions trading was proven to significantly reduce greenhouse gas emissions in both enterprises and provinces [11]. According to Liu and Zhang, a trading scheme for carbon emissions in China led to the rapid development of non-fossil fuel energy sources [12]. In pilot areas, the economic effects of carbon emissions trading are found to increase employment and alter employment patterns [13]. In addition, carbon emission trading can improve enterprises’ financial performance and asset-liability ratios [14,15]. As Liu et al. reported, carbon emission trading negatively impacted the stocks of most industries, but as the market developed and improved, it had a different impact on the stock prices in different industries [16]. In terms of technological innovation, Teixido et al. found that the EU-ETS was more effective in stimulating low-carbon technological innovation than in implementing low-carbon technical change [17]. Zhang et al.’s study found that carbon emission trading at this stage inhibited green technological innovation but reduced carbon emissions [18]. However, Zhou and Wang’s study reached the opposite conclusion, concluding that China’s carbon emissions trading policy had a significant effect on promoting green technology innovation in pilot cities [19].
Recently, the Chinese government has greatly emphasized environmental safeguards, emphasizing that “clear waters and green mountains are just as valuable as gold and silver mountains.” [20]. While promoting carbon emission reduction, a series of policies and regulations were introduced, requiring environmental protection, fulfilling social responsibilities, and optimizing corporate governance to ensure sustainable economic growth [21]. With the deep promotion of the concept of green development, the ESG system consisting of three elements (environment (E), society (S), and corporate governance (G)) has attracted more and more attention from market players. ESG elevates the issues in corporate social responsibility (CSR) to the areas of investor concern and measures the enterprise’s contribution to environmental, social, and corporate governance through relatively quantitative indicators. Compared with traditional investment concepts, the ESG concept has a more long-term vision, which can realize the comprehensive value maximization of the economy, environment, and society. Experts and scholars are studying the ESG performance of enterprises in greater depth [22]. In their study utilizing ESG ratings as a measure of corporate green innovation, Tan and Zhu found that the quantity and quality of green innovation can be impacted by ESG ratings [23]. Environmentally sensitive enterprises have a positive correlation between their performance on ESG indicators and their return on equity and Tobin’s value, as reported by Naeem et al. [24]. Zeng and Jiang analysed the impact mechanism of ESG from three perspectives: government, market, and enterprise, and found that higher ESG ratings are conducive to enterprise performance improvement [25]. Additionally, green financial policies and the development of green finance can also effectively enhance enterprise ESG performance [26,27]. Zhou et al. showed that the higher their enterprise ESG performance, the stronger their ability to innovate and develop sustainably [28]. Poor internal governance of an enterprise can also harm its ESG performance. For example, the equity pledge behaviour of a company’s executives can have a significant negative impact on enterprise ESG performance [29].
There is also some literature examining the relationship between carbon reduction and enterprise ESG. However, most of this literature focuses on how carbon policies affect enterprise ESG performance. Shu and Tan took the carbon intensity of enterprises as the risk of carbon control policy, developed a new method to measure carbon dioxide emissions, and studied how carbon control policy risk affects enterprise ESG performance [30]. Based on the Luo and Tang study, companies that prepare ESG reports in accordance with global reporting initiative (GRI) standards are more likely to achieve greater reductions in carbon emissions since they implement more active carbon policies and invest in green initiatives [31]. Tang et al. studied the impact of customer ESG performance on supplier ESG performance and found that the implementation of a dual carbon policy reinforced the positive spillover effect of customer ESG performance [32]. Baratta et al. explored the application of ESG-centred strategies in carbon reduction and made suggestions for how companies can integrate ESG criteria into their daily operations to achieve sustainable development [33]. Under pressure from regulators and investors, the carbon industry is likely to adopt more incentives to increase the ESG engagement of companies [34]. In the few papers that have studied carbon trading markets and corporate green governance from an ESG perspective, carbon trading policies can encourage firms to meet their ESG obligations by increasing regulatory pressure from governments and promoting enterprises’ green technology innovation [35]. Carbon emission trading markets are one of the hot topics in green finance, and we need to further expand their mechanisms of action on enterprise ESG performance.
Our analysis of Chinese A-share listed enterprises between 2011 and 2019 examines how carbon emission trading policy implementation impacts ESG performance. We use the difference-in-difference (DID) model to analyse samples. According to the study results, carbon emission trading appears to improve enterprise ESG performance. We have conducted a series of tests to verify this conclusion, such as the parallel trend test, exclude other policies, replacement fixed effect, replace the explained variables, Heckman two-stage model, subsample test, PSM-DID, and multi-phase DID, which verified the robustness of this conclusion. In addition, we demonstrate that emissions trading policy can improve enterprise ESG performance by promoting R&D investment and improving internal control levels. Based on the heterogeneity study, we find that the implementation of the carbon emission trading policy impacts ESG performance more positively in low-carbon enterprises, enterprises where the CEO is separated from the company, enterprises with a high degree of digital transformation, and enterprises receiving high government subsidies.
The research of this paper has the following three contributions: First, there is a wide range of literature on carbon emission trading policy that has been focused mainly on the environmental and economic consequences that this policy has brought, and the literature on the impact of ESG on the enterprise performance mainly discusses the influence of some command-based environmental regulation tools. Research on the impact of market-based environmental regulation tools on the quality of enterprise ESG disclosure is limited at present. Along with the continued promotion of ecological civilisations, environmental regulation tools have evolved from command to market-based. This paper uses the DID method to link the carbon emission trading policy representing the external impact with ESG performance reflecting the sustainable behaviour of enterprises, which can further enrich the literature on the impact of market-based environmental regulatory instruments on corporate non-financial disclosure and provide the latest empirical evidence for integrating ecological, environmental protection, society, and governance. Second, this paper explains how the carbon emission trading system can encourage enterprises to develop sustainable behaviours and demonstrates that carbon emission trading policy can contribute to enterprise sustainability performance by promoting R&D investment and improving internal control. Through the lens of corporate governance, this paper analyses the black box of how carbon emission trading policy impacts enterprise ESG performance. This paper also controls for control variables that influence enterprise ESG performance, such as Roa and Grow, which are indicators that indicate profitability. Larger indicators are associated with greater profitability, implying positive business conditions and wealth creation. They also have a greater focus on social reputation and ESG performance. Third, this paper analyses the impact of carbon emission trading policy on different enterprises from the perspective of their internal governance and external environmental impact, dividing them into categories such as whether they are CEO duality and the level of government subsidies they receive, and provides theoretical guidance for how the government should utilize carbon emission trading policy to regulate different enterprises and how enterprises should cope with environmental regulations at the present stage. This study extends the research on ESG influencing factors to a certain extent. It has significant theoretical and practical implications for improving enterprise ESG performance, promoting green and sustainable corporate development, and strengthening China’s carbon emission trading market.
In the remainder of this paper, the following sections are presented: Section 2 includes the literature review and hypothesis development; Section 3 includes data description and building of the model; Section 4 presents our empirical results and tests the robustness of the model; Section 5 analyses and tests the mechanism of samples; Section 6 further analyses the heterogeneity of samples; Section 7 provides a summary of the findings and policy proposals.

2. Related Research and Hypothesis Development

2.1. The Carbon Emission Trading Policy and Enterprise ESG Performance

The regulation of the environment is essential for promoting the development of green economies at the national or regional level. As a primary source of empirical evidence for the effectiveness of emission reduction, the existing literature mainly uses specific environmental regulations as exogenous effects [36,37]. Both low-carbon pilots and carbon emissions trading led to significant reductions in carbon emissions in pilot cities, according to Huang and Yi [38]. Hu et al. concluded that the implementation of a carbon emissions trading system resulted in significant improvements in both the quantity and quality of innovation [39]. Lu et al.’s study indicates that environmental regulatory policies have significant heterogeneity in their effects on carbon emissions at different levels across 30 provinces in China [40]. Environmental regulations will contribute to a greater reduction in carbon emissions with an increase in regional technological innovation [41]. One of the essential approaches to carbon pricing is the use of carbon emissions trading markets. These markets provide a market-driven tool for regulating the environment that encourages greenhouse gas emission reductions and low-carbon development [42]. Carbon emissions credits are the most closely linked to businesses in the carbon emission trading system, and the fair allocation of carbon quotas is necessary for a smooth market for carbon emissions [43,44]. In terms of ESG performance, it indicates the degree to which enterprises are concerned about their social responsibility and environmental sustainability. Due to its explicit inclusion of environmental value, social behaviour, and corporate governance aspects, the ESG indicator is one of the most closely watched indicators of sustainable development. It can serve as a reference standard for carbon quotas, allowing investors to evaluate an organization’s performance more accurately and comprehensively.
While few examples in the literature have examined the impact of carbon emissions trading markets on enterprise ESG performance, many studies have investigated the relationship between carbon markets and ESG sub-indices. In terms of environmental protection, the carbon emission trading system can stimulate enterprises’ green innovation in pilot areas and significantly increase carbon emission reduction [18,37,45]. Gu et al. combined the difference and trajectory balance methods to confirm that carbon emission trading can effectively reduce energy consumption and emissions [46]. Regarding social value, Jia used an energy-environment-economic analysis model and found that carbon emission trading policy increases employment in energy-intensive, low-carbon industries [47]. Niyommaneerat et al. demonstrated how the value of CSR projects should be considered by enterprises, such as obtaining carbon credits from greenhouse gas emission reduction to create economic value [48]. Enterprises internalize environmental problems into their costs and purchase needed carbon allowances or trade excess carbon allowances on the market for carbon emissions. It is possible to allocate resources more efficiently through carbon emission trading policy by trading carbon allowances [49]. An excellent internal governance structure will enable enterprises to respond actively to the policy calls of the carbon market and help establish the values of green development within enterprises [50]. Enterprises will improve their disclosure of information to reduce the information asymmetry effect in the market on corporate image, actively improve their market performance under the carbon emission trading system, and obtain more carbon quotas, reduce corporate financing costs, attract more institutional investors, and ultimately improve corporate value. Carbon emission trading positively impacts the environment, social value, and corporate governance. The pressure brought by a high-level of environmental regulation will encourage enterprises to actively improve their ESG disclosure, adjust their green development strategy, effectively receive the signal sent by environmental regulation, and play a synergistic role with ESG. In view of the above discussion, we propose the first hypothesis:
Hypothesis 1. 
Carbon emission trading policy can promote enterprise ESG performance in pilot areas.

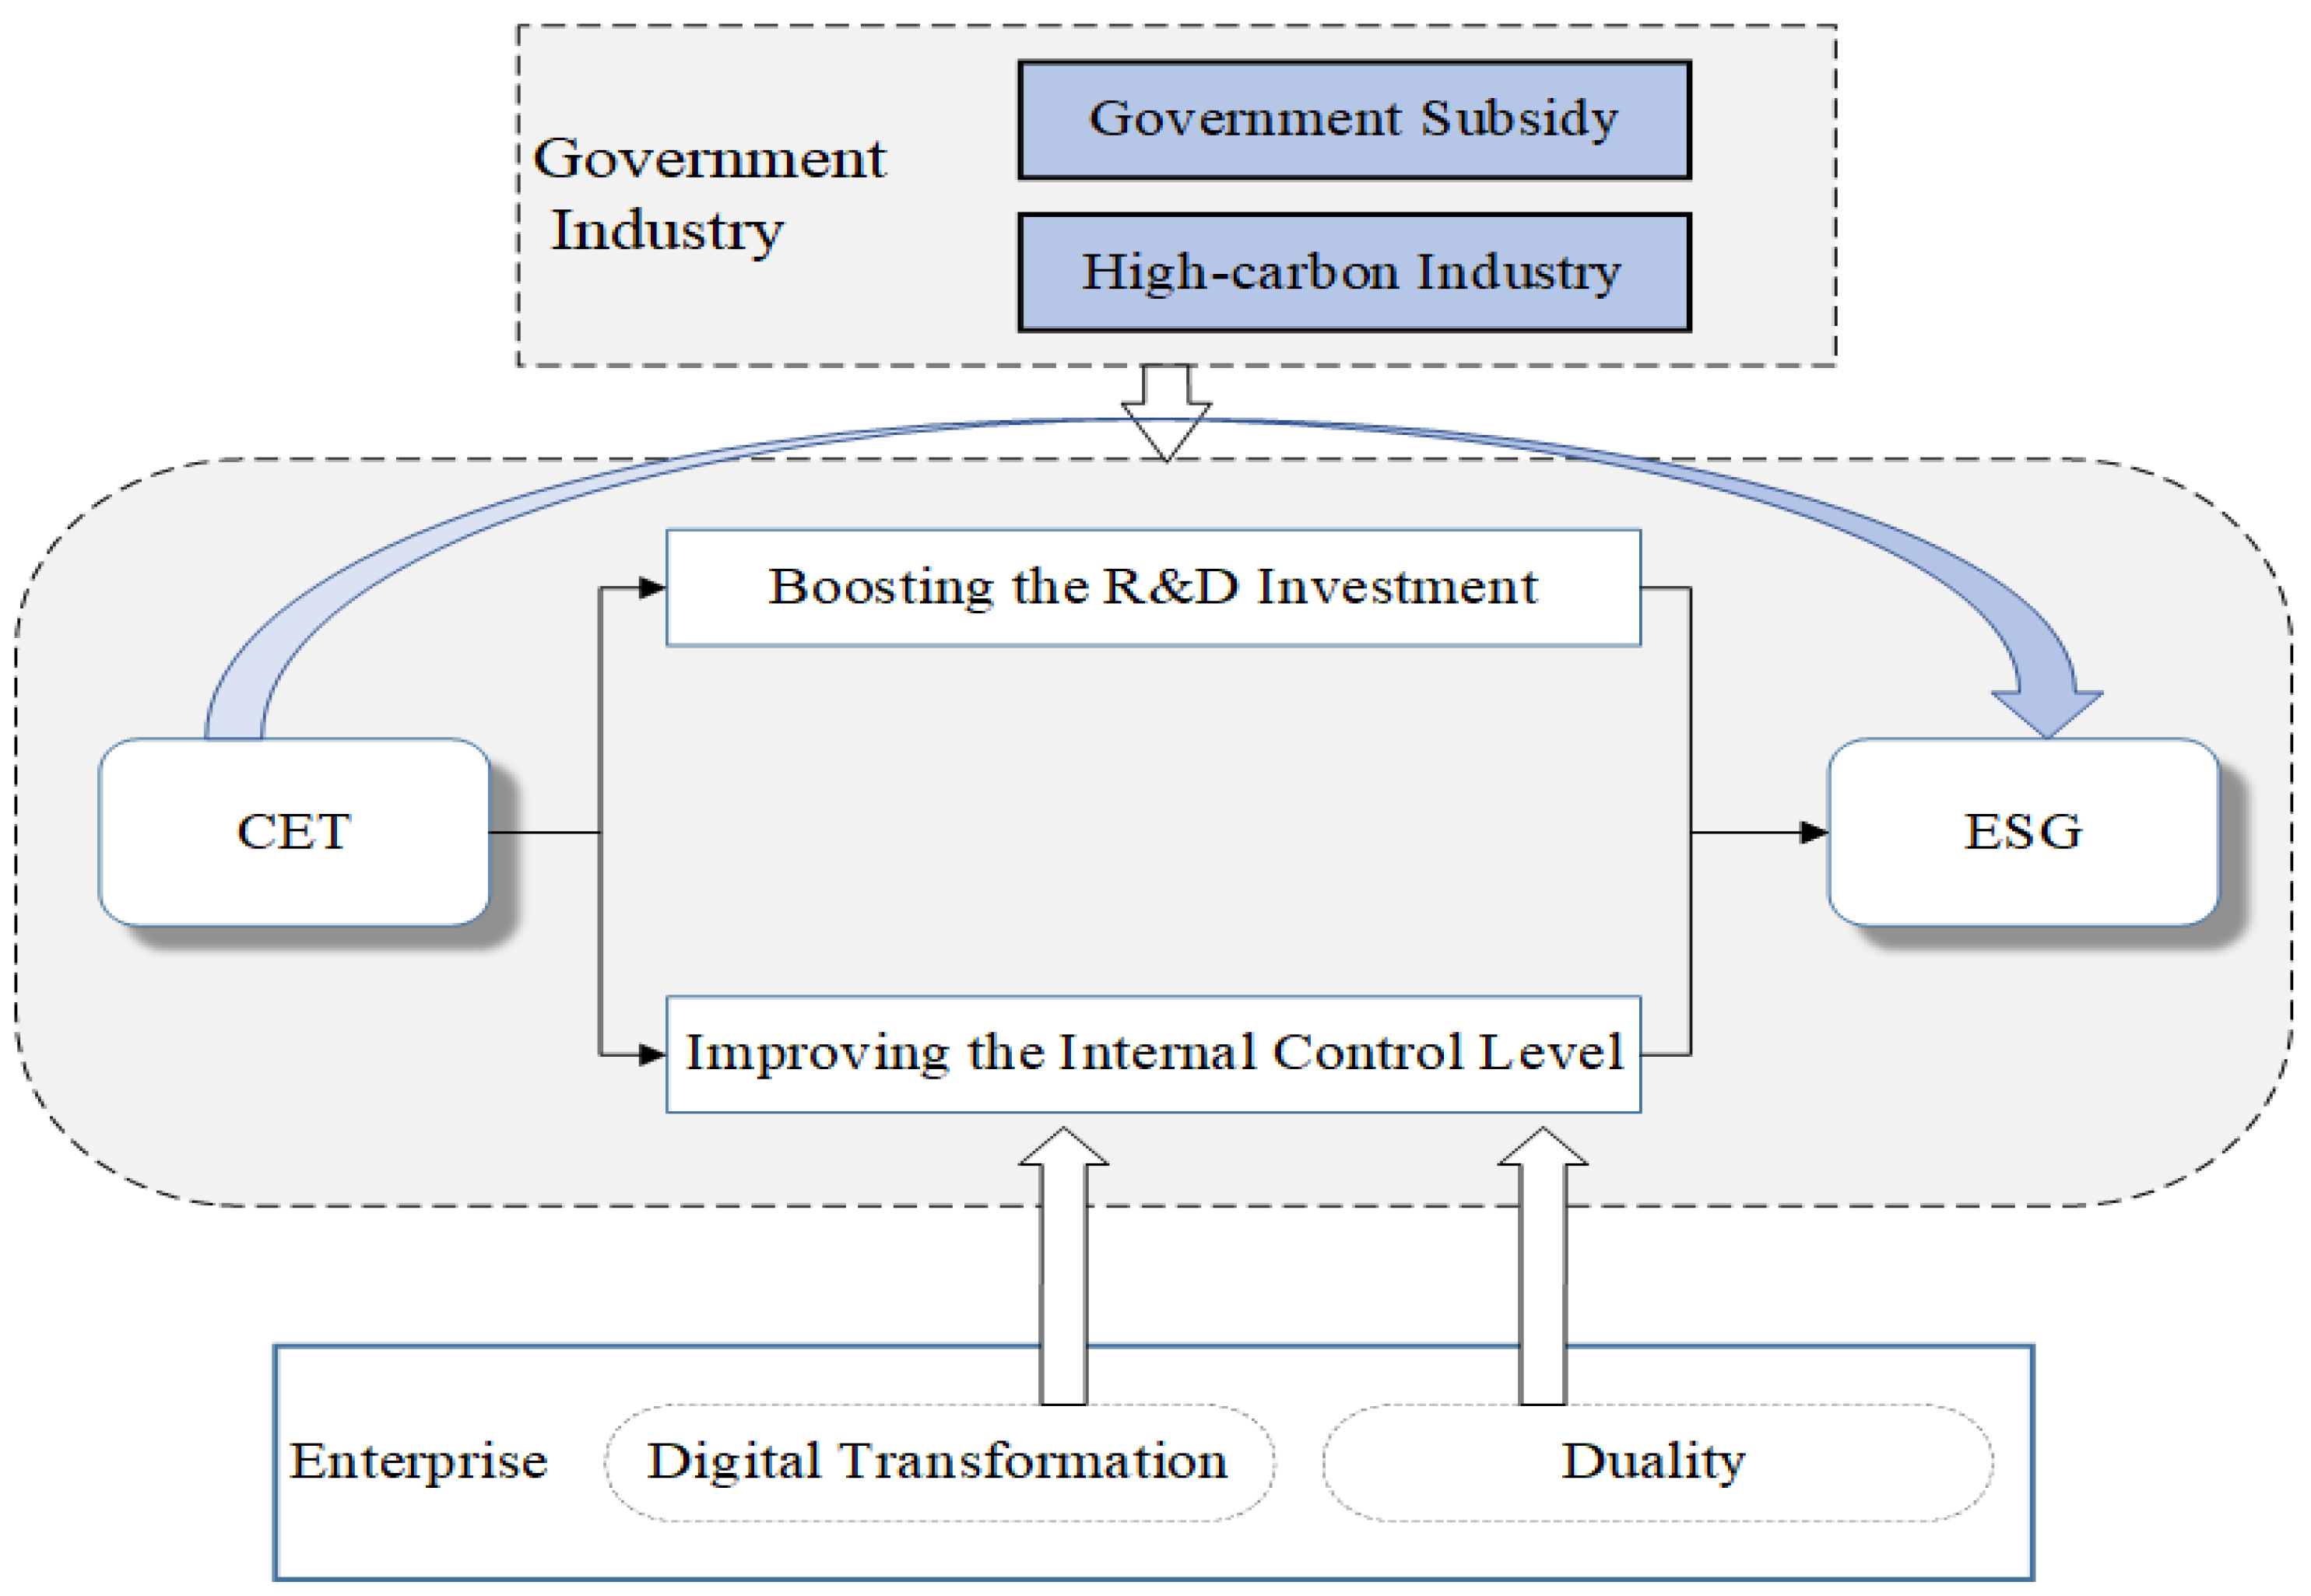
2.2. The Mechanism of Corporate R&D Investment

According to Porter’s hypothesis, stringent and adequately designed environmental regulations can increase innovation by enterprises and offset some or all of their compliance costs, thus enhancing the effectiveness of their businesses [51]. Implementing the carbon emission trading mechanism will enable enterprises to internalize the costs associated with carbon emissions, exert the cost restraint effect, and increase their motivation to pursue green innovation. There are certain constraints on organizations’ total greenhouse gas emissions under the carbon emission trading policy. To meet carbon emissions requirements, enterprises may have two behavioural choices if they continue to use their original production technology and production methods. Firstly, carbon emission rights can be purchased on the carbon emission trading market while maintaining their original production level. The second is to reduce their overall production so that the enterprise’s carbon emissions control falls within the scope of the carbon quota. These two options will greatly increase the cost of illegal emissions of pollutants and control costs, reducing profitability and market competitiveness. Through the carbon emission trading market, enterprises with surplus quotas can generate additional capital sources under the environmental regulation policy. When a company’s carbon quota is insufficient, it is encouraged to increase R&D investment, thereby improving its production process and reducing environmental costs. Following the implementation of the carbon emission trading policy, enterprises will be encouraged to invest in R&D activities to facilitate innovation [52].
The number of patent applications will increase as R&D investments grow, and the scale of innovation will expand. Continuous innovation by enterprises will enhance the value of these enterprises. There is a significant preference for ESG investments among institutional investors. The positive ESG performance of listed enterprises can encourage institutional investors to increase their shareholdings. For institutional investors to provide funds to enterprises, both economic and social expectations must be met by enterprises [53]. Therefore, subject to capital pressure, enterprises will increase their R&D investments to enhance innovation activities and ESG performance. Based on the energy and carbon emission intensity, Alam et al. empirically examined the impact of R&D investment on corporate environmental performance [54]. As a result of existing studies, enterprises can increase production efficiency and financial performance through R&D investment, in addition to strengthening the positive correlation between technology development and enterprise performance and increasing the competitiveness of companies on the carbon market by enhancing the relationship between technology development and enterprise performance [55]. Enterprises with high R&D investment have a strong ability to collect information, a more systematic internal system, and better integration and utilization of resources to achieve better ESG performance all around Given the above discussion, we propose the second hypothesis:
Hypothesis 2. 
Carbon emission trading policy can promote enterprise ESG performance by boosting the R&D investment of enterprises in pilot areas.

2.3. The Mechanism of Corporate Internal Control Levels

The concept of internal control can describe various control activities used to achieve a company’s management objectives. It measures the level of internal governance and risk control of listed companies [56]. The carbon emission trading system is a program supervised by the government [57]. Enterprises should participate actively in the carbon emission trading market, formulate the low carbon and green development strategies suitable for enterprises according to their carbon emission levels, and strengthen internal control and management, which can facilitate the achievement of the government’s environmental regulation objectives. Generally, the government assigns carbon quotas to enterprises participating in the carbon emission trading market every year. Therefore, these enterprises will be under stricter government supervision, resulting in increased pressure to improve internal control. The higher the government’s mandatory requirements for enterprises to reduce carbon emissions, the stronger the factor of this market competition mechanism and the deeper the level of government policies and institutions. Enterprises are often more motivated to reduce carbon emissions to avoid environmental risks, thus reducing unnecessary costs, improving the efficiency of the company through internal controls, and ensuring the authenticity of information communication internally and externally [58]. Implementing the carbon emission trading policy as an environmental regulation enhances government supervision in pilot areas. Enterprises must enhance their information disclosure level, resolve agency conflicts by combining external and internal supervision, and improve enterprise internal controls.
The level of internal control is an effective method for improving enterprise management performance. The improvement of the internal control level can form an excellent internal supervision system, effectively prevent adverse selection and moral hazard behaviours of management, mobilize the enthusiasm of employees through a reasonable mechanism, and improve enterprise performance. The quality of financial reporting is lower in enterprises with weaker internal controls, and management or controlling shareholders extract more rent from the company [59]. Effective internal control helps managers find problems and implement solutions in time, improving the efficiency of enterprise operations, accuracy of information, and compliance with laws [60]. Internal control can encourage enterprises to comply with relevant environmental regulations, promote green innovation, reduce opportunistic management behaviour, and provide timely and high-quality environmental information disclosure. Establishing more robust internal controls can lead to improved accounting information and earnings and assist stakeholders in accurately evaluating and monitoring the enterprise’s sustainability. It can create a conducive business environment for the enterprise and ensure that financial forecasts and decisions are made in the long term, which improves the enterprise’s environmental, social, and governance performance and assists it in achieving sustainable development [61]. In view of the above discussion, we propose the third hypothesis:
Hypothesis 3. 
Carbon emission trading policy can promote enterprise ESG performance by improving the internal control level of enterprises in the pilot area.
In summary, this paper analyses the specific impact of carbon emission trading policy on enterprise ESG performance, then investigates its mechanism of action based on mediating effects, and finally provides a heterogeneity analysis of the policy effect. Figure 1 represents the research model of this paper, showing the research pathway of carbon emission trading policy to promote enterprise ESG performance.

3. Research Design

3.1. Sample and Data

The Chinese government has implemented the carbon emission trading pilot in eight pilot provinces and cities since 2013: Shenzhen, Guangdong, Tianjin, Shanghai, Beijing, Hubei, Chongqing, and Fujian. Since COVID-19 spread nationwide after 2020, considering policy background and data availability, this study uses the panel data of Shanghai and Shenzhen A-share listed companies from 2011 to 2019 as a research sample to assess the difference in enterprise ESG performance in provinces and cities with and without the pilot carbon emission trading policy before and after its implementation. The data for ESG ratings are obtained from Bloomberg, and other corporate financial information is obtained from the CSMAR Database. The following data are processed in the meantime: (1) Eliminate the data of ST enterprises and ∗ST enterprises; (2) Eliminate the data of financial industry enterprises; (3) Eliminate data with missing data; (4) To eliminate the effects of extreme values on regression results, all continuous variables are weighted at 1% and 99%. After data processing, 8145 sample observations are obtained.

3.2. Variable Definitions

3.2.1. Dependent Variables: ESG Score (ESG)

Referring to Chen and Xie’s study, the data used in this study are taken from Bloomberg’s ESG scores as the measurement index of enterprise ESG performance, mainly considering that the data of this Bloomberg database has a more extended data window period and more abundant data volume compared with other databases [62]. The ESG approach evaluates the sustainability of business operations from three points of view: the environment, social responsibilities, and corporate governance of the business operations. The larger the ESG score, the better the company’s sustainability. Three pillars contribute to Bloomberg’s ESG score: environmental, social, and governance. Each pillar is weighted at 33%. Of these, the environmental pillar consists of seven subjects, the social pillar consists of six subjects, and the governance pillar consists of eight subjects. As shown in Appendix A, Table A1 provides a detailed breakdown of Bloomberg ESG scores and their weights. Figure 2 represents the change in the annual average ESG score and the annual average score for each pillar in the panel data. As can be seen from the graph, the G score increased significantly after 2014.

3.2.2. Independent Variables: Implementation of Carbon Trading Policy Treat_Post (Treat*Post)

According to Liu et al., in this study, enterprises registered in the pilot provinces and cities are included in the experimental group for which the Treat variable is denoted as 1, and enterprises located outside the pilot provinces and cities are considered the control group for which the Treat variable is denoted as 0 [63]. In view of the potential lag effect of carbon emission trading, considering that most pilot provinces and cities started implementing them at the end of 2013 and in the first half of 2014, it will take some time for the policy to take effect after its implementation. The first year of the carbon emission trading policy will be marked in 2014 by the implementation of this policy. Since Fujian Province began implementing the carbon emission trading policy late, its market has not yet matured. Therefore, this paper does not consider Fujian province as a pilot province. The time dummy variable Post is set according to whether the carbon emission trading policy is implemented this year. If this year is 2014 or later, Post is denoted as 1. If this year is before 2014, Post is denoted as 0. This study examines the cross-product term between Treat and Post as the core variable.

3.2.3. Control Variables

Drawing on Shu and Tan, Chen et al., and Tan and Zhu, the following variables affecting ESG performance were controlled as control variables in this paper to eliminate biased assessment and to determine the actual impact on ESG performance within an enterprise [23,30,64]. The following control variables are included in this study: Asset-liability ratio (Lev), Proportion of independent directors (Rib), Return on assets (Roa), Revenue growth rate (Grow), Fixed assets ratio (Ppe), Cash flow (Cash), Ownership concentration (Top1), Enterprise size (Size), Total assets turnover (Turnover). Table 1 contains the definitions for all variables.

3.3. Model Design

Following the previous literature, we use the difference-in-difference (DID) method to analyse the relationship between enterprise ESG and carbon emission trading policy [65,66]. In this study, the regression model (1) is used to assess whether the ESG performance of experimental and control groups differed before and after implementing a carbon emission trading program. Treat_Post is a key variable in the baseline regression. When the coefficient for this cross-product item is significantly greater than zero, this indicates that carbon emission trading can significantly impact enterprise ESG performance.
E S G i , t = β 0 + β 1 T r e a t i _ P o s t t + β 2 C o n t r o l s i , t + F i r m + Y e a r + I n d u s t r y + ε i , t
The terms i and t represent the enterprise and year, respectively, and ε i , t represents the error terms. Controls are control variables and include all corporate financial data discussed in Section 3.2.3. β 1 is the parameter that we are interested in, showing the overall influence of carbon trading policy on enterprise ESG performance. In addition, we also control the model of the firm fixed effect (Firm FE), the year fixed effect (Year FE) and the industry fixed effect (Industry FE) of regression.

3.4. Descriptive Statistics

Data from 1252 companies over nine years comprise the final panel data set for this study. Table 2 shows the descriptive statistics for the variables related to the sample. The minimum value, maximum value, and mean value of the ESG scores of enterprises are 6.198, 65.04, and 26.20, indicating significant differences in enterprise ESG performance. It is found that the mean value of Treat is 0.404, and the median value is 0, which indicates that the carbon trading policy impacts 40.4% of the samples. As for control variables, the average return on assets (Roa) is 4.6% for the sample enterprises, and the percentage of shares held by the largest shareholder (Top1) is 38.36%.

3.5. Single-Factor Analysis

To analyse the impact of carbon emission trading policy on ESG score and the financial indicators, we conduct a single factor analysis before and after it is implemented. As shown in Table 3, Column (1) indicates that 4851 observed values are not affected by carbon emission trading policy, and their average ESG score is 25.48; Column (2) indicates that there are 3294 observed values affected by carbon emission trading policy, and their average ESG score is 27.26. The experimental group’s ESG score is higher than the control group’s ESG score, demonstrating a significant difference between enterprise groups before and after implementing the policy. In this regard, the carbon emission trading policy will contribute to the improvement of enterprise ESG performance.

4. Empirical Results

4.1. Baseline Results

Table 4 illustrates the regression results for hypothesis H1 according to model (1), which examines the effects of a carbon emission trading policy on enterprise ESG performance. Those in Columns (1), (3), and (5) are regression results without control variables, while those in Columns (2), (4), and (6) are regression results with control variables. In Columns (1) and (2), the firm-fixed and year-fixed effects are controlled. In Columns (3) and (4), the year-fixed and industry-fixed effects are controlled. Columns (5) and (6) control firm fixed effect, year fixed effect, and industry fixed effect, among which Column (6) is consistent with Model (1). In all Columns of Table 4, Treat_Post is positively correlated with ESG. The coefficients of Columns (5) and (6) show a significant result at the 1% level, demonstrating that the ESG performance of enterprises in pilot provinces and cities has significantly improved since the carbon emission trading policy was introduced. The estimation results in Column (6) show that the ESG performance of enterprises in pilot provinces rises by 62.9% on average compared to enterprises not in pilot carbon trading provinces, which confirms hypothesis H1.
As for control variables, the coefficients of Size and Roa are positively significant at 1% and 5%, respectively, reflecting that enterprises with more total assets and stronger profitability have better ESG performance. Increasing Lev will result in enterprises losing their growth potential and financial expansion abilities, thus negatively affecting the ESG performance of enterprises. As a result, financing costs and difficulties increase, capital liquidity decreases, and financial crises can easily occur, which is not conducive to improving the ESG performance of enterprises. The increase of Rib can significantly promote the ESG performance of the enterprises because independent directors can balance the interests between large and small shareholders and supervise and restrain the behaviour of senior managers such as the general manager, which is conducive to the professional operation of the enterprises.

4.2. Robustness Analysis

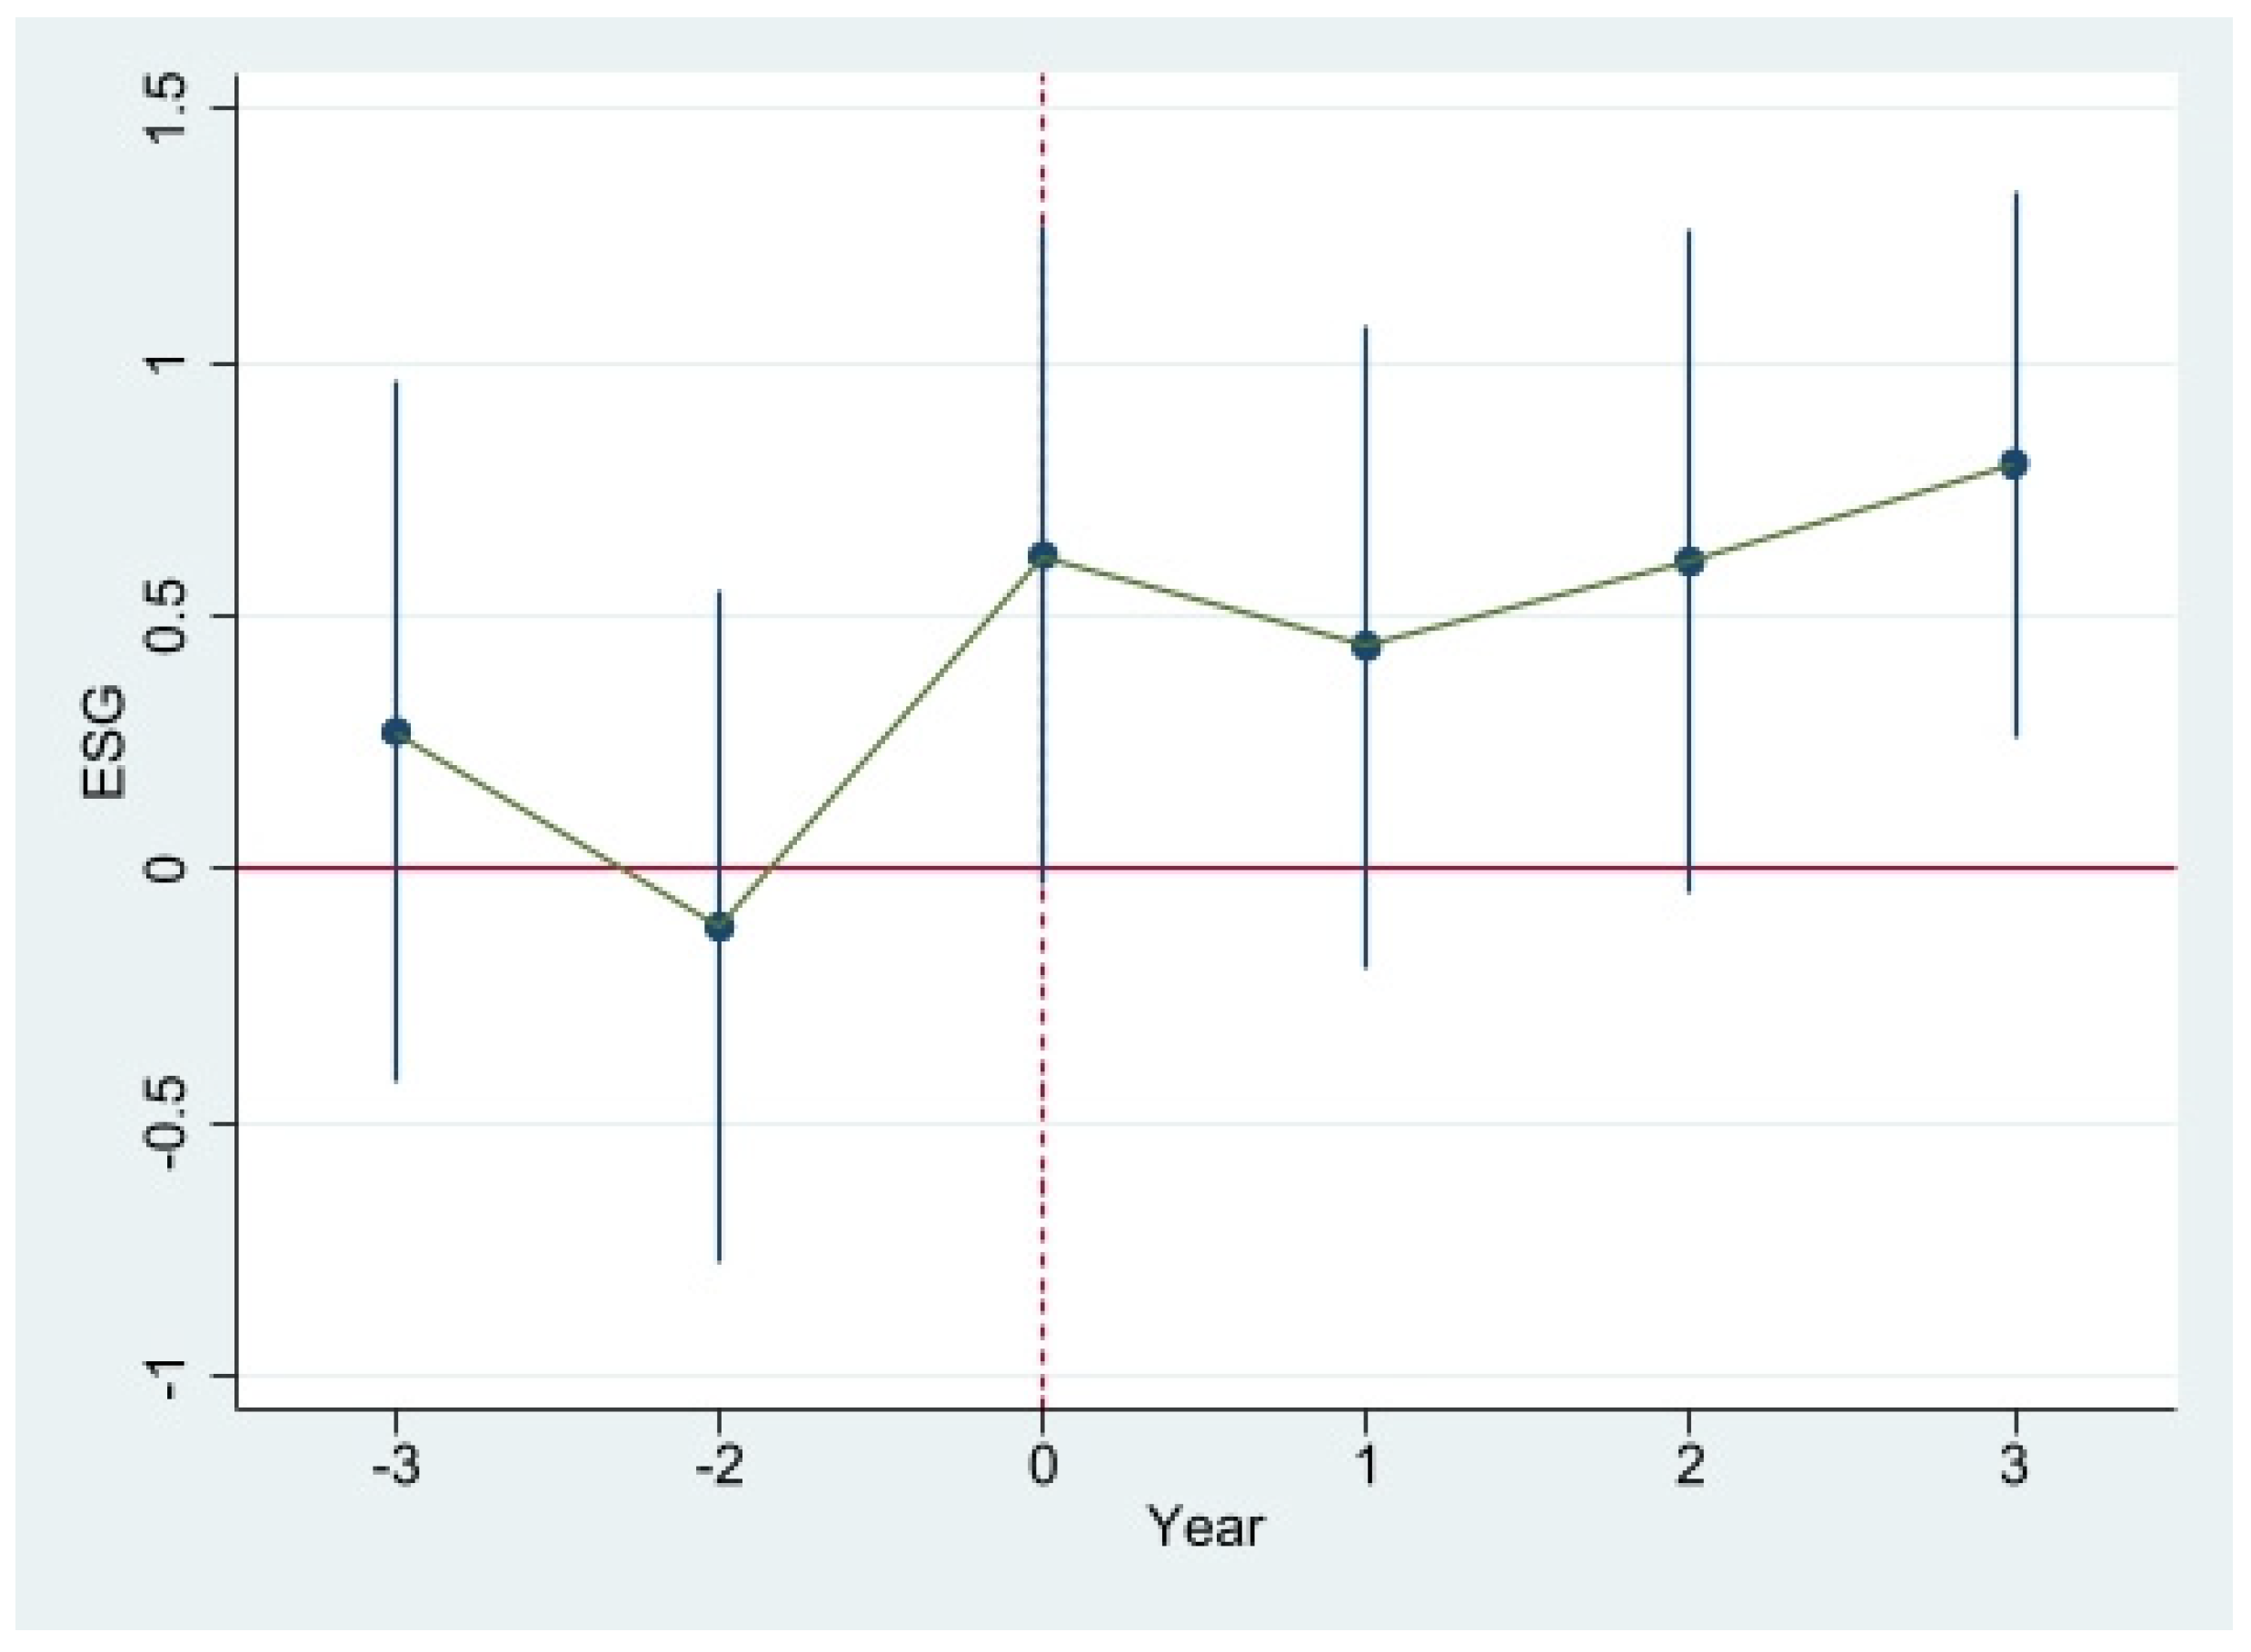
4.2.1. Parallel Trend Test

We examine the dynamic relationship between carbon emission trading policy and ESG performance in light of a preliminary study on the promotion effect of carbon emission trading policy. It is possible to prove the reliability of DID if the results confirm the hypothesis of parallel trend. Considering Yu et al.’s analysis, the carbon market has been divided into three forward cycles and three reverse cycles for testing, removing the first reverse cycle as the base period to avoid the multicollinearity problem [50]. The control variables and fixed effects are consistent with the baseline regression model. Table 5 (1) illustrates the dynamic effects of carbon emission trading policy on enterprise ESG performance. As shown in Figure 3, the regression coefficients are plotted to facilitate the visualization of the results. An analysis of the year-to-year changes in the carbon emission trading policy and enterprise performance with regard to ESG is presented in Figure 3. Considering both Table 5 and Figure 3, it is evident that the coefficients of enterprise ESG scores are not statistically significant and do not reveal any indication that they are trending upward before the implementation of the carbon emissions trading policy. In the current implementation period, enterprises have seen an immediate increase in ESG scores. In the three periods before the beginning of the carbon market, the mean values do not show any statistical significance. Therefore, the parallel trend hypothesis cannot be rejected. In the two periods following the start of the carbon market, the average value has a significant effect, indicating that this effect has persisted over time.

4.2.2. Exclude Other Policies

It is important to control for how other policies during the sample period can affect enterprise ESG performance and cause bias in the regression results. We control for a number of other environmental governance instruments by reviewing the relevant literature. In 2016, China introduced a central environmental protection inspector system to strengthen local environmental regulations enforcement [67]. The Chinese government also has some green finance policies, which will influence enterprise ESG performance. The State Council established green finance reform and innovation pilot zones in Zhejiang, Guangdong, Guizhou, and other provinces in June 2017 [20]. To avoid the interference of these policies during the implementation of the carbon emissions trading policy, we include dummy variables for these policies in the baseline regressions. Inspection indicates whether the province in which the enterprise is located belongs to the central environmental protection inspector’s inspection province. If it is an inspector province, Inspection is denoted as 1, and if it is not an inspector province, Inspection is denoted as 0. Pilot indicates whether the province in which the enterprise is located has been designated as a green finance reform and innovation pilot region in that year. If the province in which the enterprise is located is established as this region in that year, Pilot is denoted as 1, otherwise it is denoted as 0. The estimates are shown in Column (2) of Table 5 after excluding these two policy confounders, and are still significant at the 1% level after controlling for other environmental governance instruments, the same as the baseline regression results, indicating a significant contribution of carbon markets to enterprise ESG performance.

4.2.3. Replace Fixed Effect

As a result of fully considering multidimensional shocks prevalent in real-world economic events, and the heterogeneity of the responses of different individuals to these shocks, the interactive fixed effect model better reflects the reality in specific circumstances. According to Weng et al., we use interactive fixed effects to test robustness [68]. Column (1) of Table 6 controls the year-industry interaction fixed effect. Treat_Post coefficient of regression results shows a significant positive effect at the level of 1%, indicating that carbon emissions trading policy positively impacts the ESG performance of enterprises. Financial decentralisation is a way for the central government to give local governments financial and administrative powers. This is to promote effective jurisdiction management and efficient and stable regional development. The effect of fiscal spending is limited by the distribution of responsibilities between local and central governments. The level of fiscal spending power of local governments is likely to affect their willingness to reduce carbon emissions [69,70]. To avoid the impact of differences in local public expenditure on the environment on regression results, we control for regional fixed effects. Table 6 (2) shows that regression results are still significant after controlling for regional fixed effects. In addition, we continue to control for year-region interaction fixed effects, and the regression results in Column (3) of Table 6 indicate that carbon emission trading policy contributes significantly to enterprise ESG performance.

4.2.4. Heckman Two-Stage Model

Regarding financial characteristics, companies in the carbon emission trading pilot area may differ greatly from those outside the pilot area. Therefore, it is not reliable to conclude from the regression results of enterprises in the pilot program. The Heckman two-stage model resolves the endogenous problem resulting from sample selection bias. According to Chen et al.’s research method, Treat is used as the explained variable in the first step, and a probit model is used to estimate the treatment effect on the outcome [65]. After adding all control variables to the model, the inverse Mills ratio (IMR) is calculated for each observed value. IMR is added as a control variable to Equation (1) in the second step. The coefficient of Treat_Post in Table 7 (1) is 0.590, which is significant at the 1% level and in agreement with H1.

4.2.5. Replace the Explained Variables

The ESG model emphasizes the interplay between environmental protection, social responsibility, and enterprise development to achieve sustainability. In addition to the Bloomberg database, numerous influential rating agencies or providers of financial information will also evaluate the ESG performance of enterprises, and these measures effectively encourage the sustainable behaviour of enterprises [62]. In this section, we use the ESG rating data of Huazheng and the ESG scoring data of Runling Global (RKS) to replace the Bloomberg ESG scoring data used in the baseline regression model and conduct robustness tests, respectively. The control variables and fixed effects are consistent with the baseline regression model [71,72]. Table 7 illustrates the relationship between the implementation of the carbon emission trading policy and newly explained variables. Columns (2) and (3) of Table 7 present the regression results for Huazheng’s ESG rating data and Runling Global’s ESG score data, and the coefficients show significant positive results. Robustness test results confirm the conclusions of the baseline regression analysis. Therefore, carbon emission trading policy significantly promotes enterprise ESG performance.

4.2.6. Subsample Test

The robustness of the model is tested by analysing subsamples of the total sample. Column (4) of Table 7 excludes enterprises in Fujian Province from the sample. In the previous article, we suggest that the Fujian carbon emission trading market is not mature enough. Hence its impact on enterprise ESG performance is not obvious. A full analysis of the impact of the Fujian carbon emission trading market on enterprise ESG performance has been conducted after excluding the data for Fujian Province. In order to promote green economic development, the Chinese government has promoted a comprehensive transformation of economic development. The green taxation system has played a crucial policy-oriented role in helping economic transformation. The Environmental Protection Tax Law of the People’s Republic of China entered into force in January 2018. The environmental protection tax system began to be implemented as the enterprise pollution payment system was changed from an emission fee to a tax for environmental protection [73]. Since environmental protection tax reform will affect the ESG performance of enterprises, we exclude the data after 2018 and perform regression analyses on the samples. Column (5) of Table 7 presents the results. Both subsamples have significant coefficients and confirm the previous conclusion.

4.2.7. PSM-DID

A robustness test is performed using propensity score matching and difference-in-difference (PSM-DID) to solve the endogenous problem of carbon emission trading policy and enterprise ESG performance. To determine the closest group to the sample of enterprises not affected by carbon emission trading policy, refer to Li et al. and Lian et al. Using control variables that mainly represent enterprise characteristics, we conduct nearest neighbour matching and kernel matching in relation to the sample of enterprises that have not been affected by the carbon emission trading policy [74,75]. Following the generation of comparable pairs of enterprises with similar characteristics based on the estimated propensity score, we again use model (1) to test the main hypothesis. It evaluated whether the difference in ESG performance between enterprises subject to carbon emission trading policy and those not subject to carbon emission trading policy is due to differences in corporate financial data. As shown in Table 8, Columns (1) and (2) represent the estimates of the matching samples of enterprises. The carbon emission trading policy coefficient continues to be significant after controlling the selection bias, as shown in Column (6) in Table 4, which indicates that the robustness test can be satisfied. The results of this study support our view that carbon emission trading policy can enhance enterprise ESG performance.

4.2.8. Multi-Period DID

Since carbon emission trading policy is implemented at different times in different pilot provinces and cities, according to Liu et al., we adopt the multi-period DID approach to test the robustness of the baseline regression [63]. The cross-product item Treat_Post is constructed from the policy dummy variable Treat and the time dummy variable Post, representing the implementation of the carbon emission trading policy. The Treat of 1 indicates that the listed enterprises are located within the pilot area of carbon emission trading in the policy. Otherwise, the Treat of 0 indicates that they are not. If the pilot area implements the carbon emission trading market in the current year, the Post of that year and subsequent years is denoted as 1. Otherwise, it is 0. Table 8 (3) illustrates the results of the regression analysis. There is a significant positive correlation between Treat_Post and ESG performance at the level of 10%, which indicates that carbon emission trading policies can influence enterprise ESG performance, as discussed in this study.

5. Mechanism Analysis

We have studied the impact of carbon emission trading policy on enterprise ESG performance in previous chapters and tested their robustness in several ways, but we have not yet examined the black box mechanism. In this section, we examine the channel mechanism of influence between them. This paper selects two types of channels, corporate R&D investment and corporate internal control levels, and adopts a two-step approach to investigate how carbon emissions trading policy affects enterprise ESG performance.

5.1. R&D Investment

Innovation is primarily achieved through research and development. Stakeholder theory encourages enterprise investment, higher investment expenditure is associated with better corporate prospects, and managers with valuable information have inherent investment inclination. Larger enterprises tend to invest more in ESG activities due to economies of scale to better meet the needs of stakeholders [76,77]. In order to explore how carbon emission trading policy impacts the ESG performance of enterprises, we consider research and experimental development investment (R&D) as an intermediate variable. Due to the implementation of the carbon emission trading policy, enterprises have increased their investments in R&D in pilot projects, as shown in Column (1) of Table 9. Column (2) illustrates a positive relationship between R&D investment and ESG performance. The higher the R&D investment, the better the ESG performance. Consequently, the carbon emission trading policy will improve ESG performance by encouraging R&D investments among enterprises in the pilot region. Therefore, we prove hypothesis H2. The use of carbon emission trading systems allows enterprises to internalize their carbon emission costs and stimulate the motivation for technology improvement and R&D innovation through price mechanisms. Under the external supervision of carbon market environmental regulations, enterprises with excess carbon quotas can obtain additional sources of capital and increase their profits through carbon trading. When carbon quotas are insufficient, enterprises are incentivized to increase their R&D expenses, optimize and enhance the structure of their industrial operations, improve their energy efficiency, and alleviate cost pressure. Additionally, an increase in R&D investment will increase the scale of patent applications and innovation, improving the enterprise’s value. External investors tend to prefer ESG investment, obviously, and ESG performance is also an important indicator for external investors to analyse enterprises’ social value. A company can only attract external investors when it can simultaneously meet its economic and social expectations. Therefore, enterprises will actively improve ESG performance to gain the trust of external investors. Consequently, carbon emission trading policy can contribute to ESG performance by encouraging enterprises to invest in R&D in pilot projects.

5.2. Internal Control Level

It is a key factor in the operation of an enterprise that internal control is an important way of ensuring the quality of financial information. Modern enterprises are faced with an increasingly complex external development environment, which requires both good external management strength and good internal operation ability to maintain the normal operation of enterprises. In this study, we analyse the mechanism of the impact of carbon emission trading policy on enterprise ESG performance by using the enterprise internal control level as an intermediate variable. Han et al. proposed that the internal control level (ICQ) is equal to the natural logarithm of the internal control information disclosure index plus 1, where the index is derived from the DIB database [78]. As shown in Column (3) of Table 9, the carbon emission trading policy has significantly increased the ICQ of enterprises. The regression results in Column (4) indicate a significant positive correlation between ICQ and ESG. Enterprises with a higher ICQ are more likely to demonstrate high ESG performance. Based on the above analysis, carbon emission trading policy enhances enterprise ESG performance in the pilot area by improving the internal control levels of enterprises. Therefore, we prove hypothesis H3. Enterprises participating in the carbon emission trading market will be assigned a set number of carbon emission quotas, subject to government surveillance and greater pressure to improve internal controls. A carbon emission trading system with a higher policy level will require a greater reduction in carbon emissions. In order to reduce unnecessary costs and avoid risks caused by environmental problems, enterprises are often more motivated to implement corresponding low-carbon development plans according to their carbon emission level, assume the responsibility for carbon emission reduction, and strengthen the internal control level. At the same time, strict internal control can form a good internal supervision system, prompting enterprises to follow the relevant provisions of environmental regulations and ensure the reliability of financial reports. The improvement of the internal control level can effectively prevent and manage risks, safeguard the legally mandated rights and interests of investors, create a good business environment for the enterprise, timely and high-quality disclosure of environmental information, improve enterprise ESG performance, and guide enterprises to achieve sustainable development. Therefore, carbon emission trading policy promotes ESG performance by improving the internal control level of enterprises in pilot areas.

6. Heterogeneity Analysis

This section aims to examine whether carbon emission trading policy has heterogeneous effects on ESG performance in different enterprises. We divide two subsamples according to whether an enterprise’s industry is a high-carbon industry included in the carbon trading market and two subsamples according to whether the chairman and CEO of the same enterprise are the same people. In addition, we also divide the level of digital transformation of enterprises and the number of government subsidies into two equal parts for heterogeneity analysis. The bdiff tests are used to determine whether significant differences exist between the intergroup coefficients of the two subsample groups after grouping. Table 10 shows significant differences between the four groups in explanatory variables, indicating that comparisons between groups are possible. The following is the specific research process.

6.1. Industry

Carbon trading policy generates relatively obvious industry heterogeneity due to the large disparity in carbon emissions between different industries. To investigate the impact of carbon trading policy on enterprise ESG performance in different industries, this paper introduces the industry dummy variable Ind, which is denoted as 1 when an enterprise belongs to a high-carbon industry included in the carbon trading market. Otherwise Ind is denoted as 0 [79]. According to Column (1) of Table 11, the effect of carbon trading policy on ESG performance is not significant for enterprises in high carbon industries. In contrast, Column (2) shows that carbon trading policy can significantly contribute to enterprise ESG performance in industries that are not high-carbon. Possible reasons for this are that low-carbon enterprises have an advantage over high-carbon enterprises in terms of energy saving and emission reduction, low-carbon emitting enterprises are able to gain some additional benefits through carbon trading, and environmental regulation policies that reflect the government’s development philosophy will actively guide investors to invest in enterprises with good environmental performance, thus promoting the ESG investment level of low-carbon enterprises. Compared to low-carbon enterprises, high-carbon enterprises included in the carbon trading market are subject to stronger policy constraints and need to invest more money to purchase carbon quotas, increasing their production costs. Carbon trading policy can internalize the environmental costs of high carbon enterprises, creating a significant cost effect that worsens their business conditions and discourages ESG investment.

6.2. Duality

In actual enterprise management, CEO duality is a relatively common management mode. From the corporate governance perspective, the CEO duality reflects the clarity and unity of the leadership structure. It makes decision-making timely and efficient, which is more conducive to improving corporate performance. According to the principal-agent theory, independent directors play a significant role in preventing company misconduct and ensuring that duties are carried out diligently and conscientiously to maintain an enterprise’s reputation [72]. In order to examine the impact of carbon emission trading policy on enterprise ESG performance with CEO duality or separation, this paper introduces a dummy variable dual. Dual is equal to 1 when the chairman and CEO have the same title. Otherwise, it is equal to 0, and a grouping regression is conducted for the two enterprises. As shown in Column (4) of Table 11, when the chairman and CEO are separated, the carbon emission trading policy can enhance enterprise ESG performance. Column (3) shows that when the two roles are the same person, enterprise ESG performance is not significantly affected by carbon emission trading policy. Perhaps this is because the CEO, who holds the rights of management concurrently, serves as chairman, giving him or her control over the board of directors, increasing the agency’s operating costs, and reducing the efficiency of the company’s operations. Without supervision and checks and balances, the CEO may use non-financial disclosure for private gain to the detriment of shareholders and the overall interests of the business [80]. In CEO-separation enterprises, the chairman supervises and disciplines the CEO on behalf of the board of directors and shareholders [81]. Moreover, the chairman will devote more attention to sustainable development and the long-term earnings of the enterprise, in addition to acting as a supervisory manager, so that the enterprise’s corporate social responsibility can be fulfilled, the ESG performance of the enterprise can be enhanced, and the enterprise’s sustainability can be achieved.

6.3. Digital Transformation

Digital transformation is the process of continuously deepening the application of digital technologies such as cloud computing and Internet of Things. This can accelerate business optimisation and upgrading, transform traditional kinetic energy, and achieve transformation, upgrading, and innovation. The digital economy has become a key force in promoting sustainable green innovation and industrial upgrading. To explore the impact of carbon emission trading policy on enterprise ESG performance with different degrees of digital transformation, according to Zhao et al., we count the frequency of words related to four dimensions: the application of digital technology, the internet business model, the smart manufacturing approach, and the modern information system, and determine the weight of each indicator by using the entropy value method [82]. All samples are divided into two groups according to the median of digital transformation, with those with digital transformation less than the median divided into the low digital transformation group and those with digital transformation greater than the median divided into the high digital transformation group. Column (6) of Table 11 shows that carbon trading policy significantly contributes to the ESG performance of enterprises with a high degree of digital transformation. In contrast, Column (5) illustrates that carbon trading policy has an insignificant impact on the ESG performance of enterprises with low digital transformation. The possible reasons for this are that on the one hand, digital transformation can facilitate the innovation of green technologies. This can help enterprises achieve carbon transformation, provide strong technological support for enterprises to fulfil their ESG responsibilities, and enhance their contribution to environmental and sustainable development. On the other hand, digital transformation is conducive to improving enterprises’ resource allocation capacity, which can help investors obtain timely and current information regarding the reduction of carbon emissions, thus alleviating information asymmetry, which is beneficial for enterprises to improve their governance, enhance their decision-making and operational management efficiency, and strengthen their ESG practices [83].

6.4. Government Subsidy

The Chinese government hopes that by providing subsidies and other methods, enterprises will be able to improve their level of R&D and innovation so that “carbon peak” and “carbon neutrality” can be achieved quickly. Additionally, the government will actively encourage green innovation throughout society [84]. Accordingly, we analyse the government subsidy amounts for enterprises and divide all samples into two groups according to their median subsidy amounts to examine the impact of carbon emission trading policy on enterprise ESG performance. Those with more than the median government subsidy amount were divided into the high government subsidy group, while those with less than the median government subsidy amount were divided into the low government subsidy group. Column (8) of Table 11 shows that the carbon emission trading policy can enhance enterprise ESG performance by receiving high subsidies. Column (7) shows that when enterprises receive relatively low policy subsidies, the impact of carbon emission trading policy on enterprise ESG performance is not significant. The reason for the improvement of enterprise ESG performance with high government subsidies is more obvious. Government subsidies can directly provide funds for enterprises, release positive signals about enterprises to the outside world, reflect enterprises’ good development prospects and reputation, expand external financing channels of enterprises, enable the smooth process of enterprise financing, and alleviate the risks of enterprises’ ESG investment. With financial support from the government and external investors, enterprises will be more willing to improve their operating conditions and ESG performance [85].

7. Conclusions

A major environmental concern in the context of the global green and low-carbon transition is climate change caused by excessive greenhouse gas emissions. The carbon emissions trading market is a market mechanism adopted to promote global greenhouse gas emissions reduction. This article uses the institutional background of carbon emissions trading implementation and investigates the impact of carbon emissions trading policy implementation on the ESG performance of enterprises using a difference-in-difference approach based on a panel of data from Chinese A-share listed enterprises in Shanghai and Shenzhen from 2011–2019 as the research sample. Results indicate that carbon emission trading policy can significantly boost enterprise ESG performance in the pilot area.
By promoting enterprises’ R&D investments and enhancing their internal control levels, this mechanistic study finds that carbon emission trading policy can improve their ESG performance. Under the framework of these two mechanisms, we assess a series of heterogeneity analyses and conclude that carbon emission trading policy is more likely to encourage ESG performance in low-carbon enterprises, enterprises where the CEO is separated from the company, enterprises with a high degree of digital transformation, and enterprises receiving high government subsidies. This paper makes the following major contributions: First, by linking carbon emissions trading policy, which represents an external shock, to ESG performance, which reflects enterprises’ sustainable behaviour, this paper enriches the literature on the impact of market-based environmental regulatory instruments on the sustainable behaviour of enterprises and provides the latest empirical evidence on corporate governance and environmental protection. Second, this paper further opens the black box of mechanisms of action by which carbon trading systems affect enterprise ESG performance. Thirdly, this paper provides theoretical guidance on how governments can use policies to regulate different enterprises in the environment. This has a positive effect on promoting sustainable enterprise development.
In order to make better use of environmental regulatory tools such as carbon emission trading policy to achieve enterprises’ sustainable development, this paper puts forward the following suggestions: First, market-oriented regulatory frameworks should be promoted to achieve long-term economic growth and lessen the negative consequences of climate change. Pilot projects should be established to encourage enterprises to cut carbon emissions by providing a market environment for energy savings and emission reductions and transition to low-carbon energy consumption using carbon emission trading. Additionally, efforts should be made to develop a national carbon trading market, enhance the market mechanism, implement a more market-based method of allocating carbon quotas gradually, and utilize the resource allocation role of the carbon trading market. Second, in order to achieve long-term sustainable economic growth, enterprises should promote sustainable development practices. The government should improve external environmental oversight and use market-oriented environmental control measures to promote behaviours that support sustainable growth. Enterprises should be advised to encourage energy structure transformation and reduce carbon emissions, while industries and projects with excessive energy consumption and emissions need to be monitored and controlled. Energy efficiency can be increased while supporting low-carbon industries with a cross-fertilized structure between the digital and the real economies. Moreover, the government should increase financial support for small and medium businesses to increase their enthusiasm for green technology. It is also necessary to reduce mandatory policy interventions to avoid the unbalanced allocation of resources caused by the excessive investment of funds. Third, the ESG evaluation and oversight system should be improved to further sustainable development. The government should enhance the system for monitoring and evaluating ESG factors and direct businesses to make ESG more transparent. The enterprises should place a high value on the accuracy of ESG information disclosure to encourage sustainable growth. Plans for long-term development should incorporate the ESG idea, and internal control should be continually enhanced. In order to increase enterprise value and achieve benign development, enterprises must improve ESG performance and carbon information disclosure. Enterprises and other market participants can help create a sustainable future by taking a more active role in reaching the dual carbon objective.

Author Contributions

Conceptualization, Y.Z. (Yadu Zhang) and Y.Z. (Yiteng Zhang); methodology, Y.Z. (Yadu Zhang); validation, Y.Z. (Yadu Zhang) and Y.Z. (Yiteng Zhang); formal analysis, Y.Z. (Yadu Zhang); investigation, Y.Z. (Yadu Zhang); resources, Y.Z. (Yadu Zhang); data curation, Y.Z. (Yadu Zhang); writing—original draft preparation, Y.Z. (Yadu Zhang) and Y.Z. (Yiteng Zhang); writing—review and editing, Y.Z. (Yadu Zhang) and Z.S.; visualization, Y.Z. (Yiteng Zhang); supervision, Z.S. All authors have read and agreed to the published version of the manuscript.

Funding

This research was supported by the National Natural Science Foundation of China, Grant No. 71704095; Shandong Social Science Planning Research Project, Grant No. 22CJJJ24; Humanities and Social Science Project of Shandong Province, Grant No. 2021-YYJJ-09; Young Scholars Program of Shandong University, Weihai.

Institutional Review Board Statement

Not applicable.

Informed Consent Statement

Not applicable.

Data Availability Statement

The variables used in this paper were collected from the China Stock Market and Accounting Research (CSMAR) Database.

Conflicts of Interest

The authors declare no conflict of interest.

Appendix A

Table A1. Components and Weights of the Bloomberg ESG Scores.
Pillar (Weight)Subject (Weight)
Environmental (33%)Ecological and Biodiversity Impacts (4.79%)
Supply Chain (4.79%)
Water (4.79%)
Air Quality (4.78%)
Materials and Waste (4.74%)
Energy (4.73%)
Climate Change (4.70%)
Social (33%)Health and Safety (5.58%)
Ethics and Compliance (5.57%)
Human Capital (5.55%)
Supply Chain (5.54%)
Community and Customers (5.53%)
Diversity (5.49%)
Governance (33%)Independence (4.18%)
Nominations and Governance Oversight (4.18%)
Sustainability Governance (4.18%)
Tenure (4.18%)
Audit Risk and Oversight (4.17%)
Diversity (4.17%)
Board Composition (4.16%)
Compensation (4.16%)

References

  1. Tang, L.; Wu, J.; Yu, L.; Bao, Q. Carbon emissions trading scheme exploration in China: A multi-agent-based model. Energy Policy 2015, 81, 152–169. [Google Scholar] [CrossRef]
  2. Zhang, Y.-J.; Sun, Y.-F.; Huang, J. Energy efficiency, carbon emission performance, and technology gaps: Evidence from CDM project investment. Energy Policy 2018, 115, 119–130. [Google Scholar] [CrossRef]
  3. Liu, L.; Chen, C.; Zhao, Y.; Zhao, E. China’s carbon-emissions trading: Overview, challenges and future. Renew. Sustain. Energy Rev. 2015, 49, 254–266. [Google Scholar] [CrossRef]
  4. Medina, V.; Pardo, Á.; Pascual, R. The timeline of trading frictions in the European carbon market. Energy Econ. 2014, 42, 378–394. [Google Scholar] [CrossRef]
  5. Wei, Y.; Gong, P.; Zhang, J.; Wang, L. Exploring public opinions on climate change policy in “Big Data Era”—A case study of the European Union Emission Trading System (EU-ETS) based on Twitter. Energy Policy 2021, 158, 112559. [Google Scholar] [CrossRef]
  6. Lu, Y.; Gao, Y.; Zhang, Y.; Wang, J. Can the green finance policy force the green transformation of high-polluting enterprises? A quasi-natural experiment based on “Green Credit Guidelines”. Energy Econ. 2022, 114, 106265. [Google Scholar] [CrossRef]
  7. Zhao, X.-G.; Wu, L.; Li, A. Research on the efficiency of carbon trading market in China. Renew. Sustain. Energy Rev. 2017, 79, 1–8. [Google Scholar] [CrossRef]
  8. Mai, T.-K.; Foley, A.M.; McAleer, M.; Chang, C.-L. Impact of COVID-19 on returns-volatility spillovers in national and regional carbon markets in China. Renew. Sustain. Energy Rev. 2022, 169, 112861. [Google Scholar] [CrossRef]
  9. Wang, H.; Chen, Z.; Wu, X.; Nie, X. Can a carbon trading system promote the transformation of a low-carbon economy under the framework of the porter hypothesis?—Empirical analysis based on the PSM-DID method. Energy Policy 2019, 129, 930–938. [Google Scholar] [CrossRef]
  10. Xu, S.; Pan, W.; Wen, D. Do Carbon Emission Trading Schemes Promote the Green Transition of Enterprises? Evidence from China. Sustainability 2023, 15, 6333. [Google Scholar] [CrossRef]
  11. Chen, Y.; Xu, Z.; Zhang, Z.; Ye, W.; Yang, Y.; Gong, Z. Does the carbon emission trading scheme boost corporate environmental and financial performance in China? J. Clean. Prod. 2022, 368, 133151. [Google Scholar] [CrossRef]
  12. Liu, J.-Y.; Zhang, Y.-J. Has carbon emissions trading system promoted non-fossil energy development in China? Appl. Energy 2021, 302, 117613. [Google Scholar] [CrossRef]
  13. Bu, T.; Du, W.; Tang, C.; Liu, Y.; Wang, X.; Wang, Y.; Tang, D. Market-oriented environmental regulations, employment adjustment and transfer path: Quasi-experimental evidence from China’s carbon emissions trading pilot. J. Clean. Prod. 2022, 369, 133292. [Google Scholar] [CrossRef]
  14. Yu, P.; Hao, R.; Cai, Z.; Sun, Y.; Zhang, X. Does emission trading system achieve the win-win of carbon emission reduction and financial performance improvement?—Evidence from Chinese A-share listed firms in industrial sector. J. Clean. Prod. 2022, 333, 130121. [Google Scholar] [CrossRef]
  15. Liu, M.; Zhou, C.; Lu, F.; Hu, X. Impact of the implementation of carbon emission trading on corporate financial performance: Evidence from listed companies in China. PLoS ONE 2021, 16, e0253460. [Google Scholar] [CrossRef]
  16. Liu, J.; Mao, W.; Qiao, X. Dynamic and asymmetric effects between carbon emission trading, financial uncertainties, and Chinese industry stocks: Evidence from quantile-on-quantile and causality-in-quantiles analysis. N. Am. J. Econ. Financ. 2023, 65, 101883. [Google Scholar] [CrossRef]
  17. Teixidó, J.; Verde, S.F.; Nicolli, F. The impact of the EU Emissions Trading System on low-carbon technological change: The empirical evidence. Ecol. Econ. 2019, 164, 106347. [Google Scholar] [CrossRef]
  18. Zhang, W.; Li, G.; Guo, F. Does carbon emissions trading promote green technology innovation in China? Appl. Energy 2022, 315, 119012. [Google Scholar] [CrossRef]
  19. Zhou, F.; Wang, X. The carbon emissions trading scheme and green technology innovation in China: A new structural economics perspective. Econ. Anal. Policy 2022, 74, 365–381. [Google Scholar] [CrossRef]
  20. Chen, Z.; Hu, L.; He, X.; Liu, Z.; Chen, D.; Wang, W. Green Financial Reform and Corporate ESG Performance in China: Empirical Evidence from the Green Financial Reform and Innovation Pilot Zone. Int. J. Environ. Res. Public Health 2022, 19, 14981. [Google Scholar] [CrossRef]
  21. Chen, S.; Han, X.; Zhang, Z.; Zhao, X. ESG investment in China: Doing well by doing good. Pac.-Basin Financ. J. 2023, 77, 101907. [Google Scholar] [CrossRef]
  22. Liu, M.; Luo, X.; Lu, W.-Z. Public perceptions of environmental, social, and governance (ESG) based on social media data: Evidence from China. J. Clean. Prod. 2023, 387, 135840. [Google Scholar] [CrossRef]
  23. Tan, Y.; Zhu, Z. The effect of ESG rating events on corporate green innovation in China: The mediating role of financial constraints and managers’ environmental awareness. Technol. Soc. 2022, 68, 101906. [Google Scholar] [CrossRef]
  24. Naeem, N.; Cankaya, S.; Bildik, R. Does ESG performance affect the financial performance of environmentally sensitive industries? A comparison between emerging and developed markets. Borsa Istanb. Rev. 2022, 22, S128–S140. [Google Scholar] [CrossRef]
  25. Zeng, L.; Jiang, X. ESG and Corporate Performance: Evidence from Agriculture and Forestry Listed Companies. Sustainability 2023, 15, 6723. [Google Scholar] [CrossRef]
  26. Sun, X.; Zhou, C.; Gan, Z. Green Finance Policy and ESG Performance: Evidence from Chinese Manufacturing Firms. Sustainability 2023, 15, 6781. [Google Scholar] [CrossRef]
  27. Zhang, D. Does green finance really inhibit extreme hypocritical ESG risk? A greenwashing perspective exploration. Energy Econ. 2023, 121, 106688. [Google Scholar] [CrossRef]
  28. Zhou, S.; Rashid, M.H.U.; Mohd. Zobair, S.A.; Sobhani, F.A.; Siddik, A.B. Does ESG Impact Firms’ Sustainability Performance? The Mediating Effect of Innovation Performance. Sustainability 2023, 15, 5586. [Google Scholar] [CrossRef]
  29. Jang, G.-Y.; Kang, H.-G.; Kim, W. Corporate executives’ incentives and ESG performance. Financ. Res. Lett. 2022, 49, 103187. [Google Scholar] [CrossRef]
  30. Shu, H.; Tan, W. Does carbon control policy risk affect corporate ESG performance? Econ. Model. 2023, 120, 106148. [Google Scholar] [CrossRef]
  31. Luo, L.; Tang, Q. The real effects of ESG reporting and GRI standards on carbon mitigation: International evidence. In Business Strategy and the Environment; John Wiley & Sons: Hoboken, NJ, USA, 2022. [Google Scholar] [CrossRef]
  32. Tang, J.; Wang, X.; Liu, Q. The spillover effect of customers’ ESG to suppliers. Pac.-Basin Financ. J. 2023, 78, 101947. [Google Scholar] [CrossRef]
  33. Baratta, A.; Cimino, A.; Longo, F.; Solina, V.; Verteramo, S. The Impact of ESG Practices in Industry with a Focus on Carbon Emissions: Insights and Future Perspectives. Sustainability 2023, 15, 6685. [Google Scholar] [CrossRef]
  34. Xu, H.; Wu, Y. The China Trade Shock and the ESG Performances of US firms. arXiv 2022, arXiv:2201.12402. [Google Scholar] [CrossRef]
  35. Yao, R.; Fei, Y.; Wang, Z.; Yao, X.; Yang, S. The Impact of China’s ETS on Corporate Green Governance Based on the Perspective of Corporate ESG Performance. Int. J. Environ. Res. Public Health 2023, 20, 2292. [Google Scholar] [CrossRef]
  36. Zhao, X.; Tao, W.; Ma, X.; Wang, C.; Mentel, G. Exploring the role of environmental regulation on energy security: Contextual findings for sustainable development in Chinese provinces. Gondwana Res. 2023, 116, 113–124. [Google Scholar] [CrossRef]
  37. Liu, M.; Li, Y. Environmental regulation and green innovation: Evidence from China’s carbon emissions trading policy. Financ. Res. Lett. 2022, 48, 103051. [Google Scholar] [CrossRef]
  38. Huang, H.; Yi, M. Impacts and mechanisms of heterogeneous environmental regulations on carbon emissions: An empirical research based on DID method. Environ. Impact Assess. Rev. 2023, 99, 107039. [Google Scholar] [CrossRef]
  39. Hu, J.; Pan, X.; Huang, Q. Quantity or quality? The impacts of environmental regulation on firms’ innovation–Quasi-natural experiment based on China’s carbon emissions trading pilot. Technol. Forecast. Soc. Chang. 2020, 158, 120122. [Google Scholar] [CrossRef]
  40. Lu, W.; Wu, H.; Yang, S.; Tu, Y.P. Effect of environmental regulation policy synergy on carbon emissions in China under consideration of the mediating role of industrial structure. J. Environ. Manag. 2022, 322, 116053. [Google Scholar] [CrossRef]
  41. Huang, X.; Tian, P. How does heterogeneous environmental regulation affect net carbon emissions: Spatial and threshold analysis for China. J. Environ. Manag. 2023, 330, 117161. [Google Scholar] [CrossRef]
  42. Xie, L.; Zhou, Z.; Hui, S. Does environmental regulation improve the structure of power generation technology? Evidence from China’s pilot policy on the carbon emissions trading market(CETM). Technol. Forecast. Soc. Chang. 2022, 176, 121428. [Google Scholar] [CrossRef]
  43. Ning, B.; Zhang, X.; Liu, X.; Yang, C.; Li, G.; Ma, Q. Allocation of carbon quotas with local differential privacy. Appl. Energy 2022, 326, 119974. [Google Scholar] [CrossRef]
  44. Zhou, X.; Niu, A.; Lin, C. Optimizing carbon emission forecast for modelling China’s 2030 provincial carbon emission quota allocation. J. Environ. Manag. 2023, 325, 116523. [Google Scholar] [CrossRef] [PubMed]
  45. Liu, Y.; Liu, S.; Shao, X.; He, Y. Policy spillover effect and action mechanism for environmental rights trading on green innovation: Evidence from China’s carbon emissions trading policy. Renew. Sustain. Energy Rev. 2022, 153, 111779. [Google Scholar] [CrossRef]
  46. Gu, G.; Zheng, H.; Tong, L.; Dai, Y. Does carbon financial market as an environmental regulation policy tool promote regional energy conservation and emission reduction? Empirical evidence from China. Energy Policy 2022, 163, 112826. [Google Scholar] [CrossRef]
  47. Jia, Z. What kind of enterprises and residents bear more responsibilities in carbon trading? A step-by-step analysis based on the CGE model. Environ. Impact Assess. Rev. 2023, 98, 106950. [Google Scholar] [CrossRef]
  48. Niyommaneerat, W.; Suwanteep, K.; Chavalparit, O. Sustainability indicators to achieve a circular economy: A case study of renewable energy and plastic waste recycling corporate social responsibility (CSR) projects in Thailand. J. Clean. Prod. 2023, 391, 136203. [Google Scholar] [CrossRef]
  49. Clarkson, P.M.; Li, Y.; Pinnuck, M.; Richardson, G.D. The Valuation Relevance of Greenhouse Gas Emissions under the European Union Carbon Emissions Trading Scheme. Eur. Account. Rev. 2014, 24, 551–580. [Google Scholar] [CrossRef]
  50. Yu, X.; Shi, J.; Wan, K.; Chang, T. Carbon trading market policies and corporate environmental performance in China. J. Clean. Prod. 2022, 371, 133683. [Google Scholar] [CrossRef]
  51. Chen, Y.P.V.; Zhuo, Z.; Huang, Z.; Li, W. Environmental regulation and ESG of SMEs in China: Porter hypothesis re-tested. Sci. Total Environ. 2022, 850, 157967. [Google Scholar] [CrossRef]
  52. Ni, X.; Jin, Q.; Huang, K. Environmental regulation and the cost of debt: Evidence from the carbon emission trading system pilot in China. Financ. Res. Lett. 2022, 49, 103134. [Google Scholar] [CrossRef]
  53. Bai, X.; Han, J.; Ma, Y.; Zhang, W. ESG performance, institutional investors’ preference and financing constraints: Empirical evidence from China. Borsa Istanb. Rev. 2022, 22, S157–S168. [Google Scholar] [CrossRef]
  54. Alam, M.S.; Atif, M.; Chien-Chi, C.; Soytaş, U. Does corporate R&D investment affect firm environmental performance? Evidence from G-6 countries. Energy Econ. 2019, 78, 401–411. [Google Scholar] [CrossRef]
  55. Hung, K.-P.; Chou, C. The impact of open innovation on firm performance: The moderating effects of internal R&D and environmental turbulence. Technovation 2013, 33, 368–380. [Google Scholar] [CrossRef]
  56. Zhong, Q.; Han, L.; Jin, J. Do green credit guidelines impact on heavily polluting firms in rent-seeking? Financ. Res. Lett. 2022, 47, 102747. [Google Scholar] [CrossRef]
  57. He, M.; Zhu, X.; Li, H. How does carbon emissions trading scheme affect steel enterprises’ pollution control performance? A quasi natural experiment from China. Sci. Total Environ. 2023, 858, 159871. [Google Scholar] [CrossRef]
  58. Huang, P.; Jiao, Y.; Li, S. Impact of internal control quality on the information content of social responsibility reports: A study based on text similarity—Evidence from China. Int. J. Account. Inf. Syst. 2022, 45, 100558. [Google Scholar] [CrossRef]
  59. Guo, Y.; Guo, Y.; Lai Lan Mo, P.; Zhang, X. Partner-Level internal control opinion shopping and its economic consequences: Evidence from “SOX 404” in an emerging market. J. Account. Public Policy 2023, 2023, 107056. [Google Scholar] [CrossRef]
  60. Le, H.Q.; Vu, T.P.L.; Do, V.P.A.; Do, A.D. The enduring effect of formalization on firm-level corruption in Vietnam: The mediating role of internal control. Int. Rev. Econ. Financ. 2022, 82, 364–373. [Google Scholar] [CrossRef]
  61. Yang, L.; Qin, H.; Gan, Q.; Su, J. Internal Control Quality, Enterprise Environmental Protection Investment and Finance Performance: An Empirical Study of China’s A-Share Heavy Pollution Industry. Int. J. Environ. Res. Public Health 2020, 17, 6082. [Google Scholar] [CrossRef]
  62. Chen, Z.; Xie, G. ESG disclosure and financial performance: Moderating role of ESG investors. Int. Rev. Financ. Anal. 2022, 83, 102291. [Google Scholar] [CrossRef]
  63. Liu, M.; Shan, Y.; Li, Y. Study on the effect of carbon trading regulation on green innovation and heterogeneity analysis from China. Energy Policy 2022, 171, 113290. [Google Scholar] [CrossRef]
  64. Chen, Y.; Li, T.; Zeng, Q.; Zhu, B. Effect of ESG performance on the cost of equity capital: Evidence from China. Int. Rev. Econ. Financ. 2023, 83, 348–364. [Google Scholar] [CrossRef]
  65. Chen, W.; Zhang, L.; Shi, L.; Shao, Y.; Zhou, K. Carbon emissions trading system and investment efficiency: Evidence from China. J. Clean. Prod. 2022, 358, 131782. [Google Scholar] [CrossRef]
  66. Zhang, H.; Feng, C.; Zhou, X. Going carbon-neutral in China: Does the low-carbon city pilot policy improve carbon emission efficiency? Sustain. Prod. Consum. 2022, 33, 312–329. [Google Scholar] [CrossRef]
  67. Kostka, G.; Goron, C. From targets to inspections: The issue of fairness in China’s environmental policy implementation. Environ. Politics 2020, 30, 513–537. [Google Scholar] [CrossRef]
  68. Weng, Z.; Liu, T.; Wu, Y.; Cheng, C. Air quality improvement effect and future contributions of carbon trading pilot programs in China. Energy Policy 2022, 170, 113264. [Google Scholar] [CrossRef]
  69. Cheng, S.; Fan, W.; Meng, F.; Chen, J.; Liang, S.; Song, M.; Liu, G.; Casazza, M. Potential Role of Fiscal Decentralization on Interprovincial Differences in CO2 Emissions in China. Environ. Sci. Technol. 2021, 55, 813–822. [Google Scholar] [CrossRef]
  70. Cheng, S.; Wang, P.; Chen, B.; Fan, W. Decoupling and decomposition analysis of CO2 emissions from government spending in China. Energy 2022, 243, 122741. [Google Scholar] [CrossRef]
  71. Deng, X.; Li, W.; Ren, X. More sustainable, more productive: Evidence from ESG ratings and total factor productivity among listed Chinese firms. Financ. Res. Lett. 2023, 51, 103439. [Google Scholar] [CrossRef]
  72. He, F.; Du, H.; Yu, B. Corporate ESG performance and manager misconduct: Evidence from China. Int. Rev. Financ. Anal. 2022, 82, 102201. [Google Scholar] [CrossRef]
  73. He, X.; Jing, Q.-L. The Impact of Environmental Tax Reform on Total Factor Productivity of Heavy-Polluting Firms Based on a Dual Perspective of Technological Innovation and Capital Allocation. Sustainability 2022, 14, 14946. [Google Scholar] [CrossRef]
  74. Li, S.; Liu, Q.; Lu, L.; Zheng, K. Green policy and corporate social responsibility: Empirical analysis of the Green Credit Guidelines in China. J. Asian Econ. 2022, 82, 101531. [Google Scholar] [CrossRef]
  75. Lian, Y.; Ye, T.; Zhang, Y.; Zhang, L. How does corporate ESG performance affect bond credit spreads: Empirical evidence from China. Int. Rev. Econ. Financ. 2023, 85, 352–371. [Google Scholar] [CrossRef]
  76. Gu, L.; Zhang, H. Stakeholder-oriented corporate investment: A catering perspective. Financ. Res. Lett. 2022, 48, 102863. [Google Scholar] [CrossRef]
  77. Bissoondoyal-Bheenick, E.; Brooks, R.; Do, H.X. ESG and firm performance: The role of size and media channels. Econ. Model. 2023, 121, 106203. [Google Scholar] [CrossRef]
  78. Han, G.; Chen, T.; Liu, T. Digital Transformation and Enterprise Capacity Utilization: Empirical Findings from Chinese Manufacturing Enterprises. J. Financ. Econ. 2022, 48, 154–168. [Google Scholar] [CrossRef]
  79. Tang, M.; Cheng, S.; Guo, W.; Ma, W.; Hu, F. Effects of Carbon Emission Trading on Companies’ Market Value: Evidence from Listed Companies in China. Atmosphere 2022, 13, 240. [Google Scholar] [CrossRef]
  80. Khan, M.A. ESG disclosure and Firm performance: A bibliometric and meta analysis. Res. Int. Bus. Financ. 2022, 61, 101668. [Google Scholar] [CrossRef]
  81. Wang, B.Y.; Duan, M.; Liu, G. Does the power gap between a chairman and CEO matter? Evidence from corporate debt financing in China. Pac.-Basin Financ. J. 2021, 65, 101495. [Google Scholar] [CrossRef]
  82. Zhao, C.Y.; Wang, W.C.; Li, X.S. How Does Digital Transformation Affect the Total Factor Productivity of Enterprises? Financ. Trade Econ. 2021, 42, 114–129. [Google Scholar] [CrossRef]
  83. Shang, Y.; Raza, S.A.; Huo, Z.; Shahzad, U.; Zhao, X. Does enterprise digital transformation contribute to the carbon emission reduction? Micro-level evidence from China. Int. Rev. Econ. Financ. 2023, 86, 1–13. [Google Scholar] [CrossRef]
  84. Xu, R.; Shen, Y.; Liu, M.; Li, L.; Xia, X.; Luo, K. Can government subsidies improve innovation performance? Evidence from Chinese listed companies. Econ. Model. 2023, 120, 106151. [Google Scholar] [CrossRef]
  85. Zhang, D.; Kong, Q. Credit policy, uncertainty, and firm R&D investment: A quasi-natural experiment based on the Green Credit Guidelines. Pac.-Basin Financ. J. 2022, 73, 101751. [Google Scholar] [CrossRef]
Figure 1. Research model.
Sustainability 15 08279 g001
Figure 2. ESG scores and each pillar’s scores.
Sustainability 15 08279 g002
Figure 3. Parallel trend test. The blue line shows the confidence interval for the regression coefficients at the 5% significance level. The red solid line represents the 0 scale line on the vertical axis, indicating that the ESG score is 0. The red dotted line is the 0 scale line on the horizontal axis, indicating the year in which the policy is implemented.
Sustainability 15 08279 g003
Table 1. Variable definition.
VariableDefinitions
ESGBloomberg ESG score data
TreatIn the case of enterprises that are located in carbon trading pilot areas, the value is 1; otherwise, it is 0
PostIn case the year is 2014 or later, the value is 1; otherwise, it is 0
Treat_PostThe cross-product of Treat and Post
LevTotal assets divided by total liabilities
RibThe ratio of independent directors to the size of the board
RoaThe ratio of net profit to total assets
GrowThe current period’s operating income minus the previous period’s operating income divided by the previous period’s operating income
PpeFixed assets divided by total assets
CashThe ratio of net cash flow from operations to total assets
Top1The percentage of shares held by the largest shareholder
SizeThe natural logarithm of total enterprise assets
TurnoverThe ratio of operating income to total assets
Table 2. Descriptive statistics.
VariableNMeansdMinp25p50p75Max
ESG814526.207.9566.19820.3025.9530.0165.04
Treat81450.4040.49100011
Post81450.7150.45100111
Lev81450.4780.2000.05000.3240.4900.6330.894
Rib814537.515.48033.3333.3336.3641.6757.14
Roa81450.04600.0570−0.2520.01700.03900.07400.194
Grow81450.3600.943−0.701−0.03100.1230.3986.766
Ppe81450.2340.1790.002000.09000.1900.3410.696
Cash81450.05700.0690−0.1620.01600.05500.09900.243
Top1814538.3615.908.77025.6737.2650.1975.10
Size814523.101.28819.7422.1823.0023.9026.18
Turnover81450.6470.4440.07500.3470.5430.8122.525
Table 3. Single-factor analysis.
(1)
Treat = 0
(2)
Treat = 1
(1)–(2)
VariablesN1Mean1N2Mean2MeanDifft-Value
ESG485125.48329427.26−1.783−9.986 ***
Lev48510.47432940.485−0.0110−2.534 **
Rib485137.13329438.06−0.934−7.577 ***
Roa48510.045032940.0470−0.00200−1.677 *
Grow48510.32132940.418−0.0970−4.553 ***
Ppe48510.25332940.2050.048011.898 ***
Cash48510.059032940.05400.005003.032 ***
Top1485137.45329439.69−2.234−6.237 ***
Size485122.98329423.28−0.306−10.595 ***
Turnover48510.64832940.6440.004000.406
***, **, and * indicate the significance of variables at the 1%, 5%, and 10% levels, respectively.
Table 4. Baseline results.
(1)(2)(3)(4)(5)(6)
VariablesESGESGESGESGESGESG
Treat_Post0.638 ***0.615 ***1.928 ***1.362 ***0.662 ***0.629 ***
(3.580)(3.435)(11.538)(8.798)(3.697)(3.495)
Lev −1.779 *** −3.733 *** −1.791 ***
(−3.157) (−7.992) (−3.159)
Rib 0.029 ** 0.029 ** 0.030 **
(2.391) (2.507) (2.396)
Roa 2.983 ** −3.208 ** 2.975 **
(2.550) (−2.182) (2.537)
Grow −0.015 −0.063 −0.023
(−0.259) (−0.847) (−0.393)
Ppe 0.239 0.467 0.097
(0.357) (0.996) (0.143)
Cash 0.175 4.227 *** 0.073
(0.213) (3.790) (0.088)
Top1 0.017 ** −0.008 ** 0.020 **
(2.216) (−1.976) (2.514)
Size 0.518 *** 2.312 *** 0.531 ***
(3.969) (35.349) (4.011)
Turnover −0.328 1.157 *** −0.359
(−1.298) (6.876) (−1.408)
Constant25.974 ***13.117 ***25.636 ***−27.517 ***25.967 ***12.786 ***
(406.664)(4.337)(308.003)(−19.427)(405.593)(4.166)
Observations804680468144814480468046
R-squared0.8440.8450.4120.5100.8440.846
Firm FEYESYESNONOYESYES
Year FEYESYESYESYESYESYES
Industry FENONOYESYESYESYES
***, **, and * indicate the significance of variables at the 1%, 5% levels, respectively.
Table 5. Parallel trend test and exclude other policies.
(1) (2)
VariablesESGVariablesESG
Pre_30.272
(0.771)
Pre_2−0.114
(−0.334)
Current0.620 *
(1.858)
Post_10.439
(1.354)
Post_20.608 *
(1.828)
Post_30.802 ***
(2.919)
Treat_Post0.632 ***
(3.514)
Lev−1.820 ***Lev−1.751 ***
(−3.206) (−3.085)
Rib0.030 **Rib0.029 **
(2.392) (2.383)
Roa3.078 ***Roa2.948 **
(2.620) (2.514)
Grow−0.022Grow−0.023
(−0.374) (−0.403)
Ppe0.110Ppe0.079
(0.162) (0.117)
Cash0.056Cash0.064
(0.068) (0.078)
Top10.534 ***Top10.020 **
(4.033) (2.495)
Size0.020 **Size0.537 ***
(2.556) (4.056)
Turnover−0.335Turnover−0.355
(−1.313) (−1.393)
Inspection0.047
(0.296)
Pilot−0.296
(−1.594)
Constant12.669 ***Constant12.664 ***
(4.125) (4.125)
Observations8046Observations8046
R-squared0.846R−squared0.846
Firm FEYESFirm FEYES
Year FEYESYear FEYES
Industry FEYESIndustry FEYES
***, **, and * indicate the significance of variables at the 1%, 5%, and 10% levels, respectively.
Table 6. Replace the fixed effect.
(1)(2)(3)
VariablesESGESGESG
Treat_Post0.688 ***0.600 ***2.506 *
(3.735)(3.303)(1.751)
Lev−2.323 ***−1.675 ***−1.967 ***
(−4.041)(−2.910)(−3.344)
Rib0.022 *0.032 **0.041 ***
(1.803)(2.554)(3.233)
Roa2.340 **3.128 ***3.390 ***
(1.963)(2.662)(2.830)
Grow−0.038−0.020−0.044
(−0.662)(−0.351)(−0.752)
Ppe−0.1250.0650.306
(−0.183)(0.096)(0.441)
Cash0.157−0.0760.114
(0.188)(−0.092)(0.136)
Top10.019 **0.020 ***0.024 ***
(2.399)(2.584)(3.002)
Size0.650 ***0.525 ***0.581 ***
(4.837)(3.907)(4.234)
Turnover−0.279−0.343−0.240
(−1.090)(−1.343)(−0.918)
Constant22.768 ***23.218 ***20.662 ***
(5.733)(4.400)(3.872)
Observations814581458145
R-squared0.8540.8480.855
Firm FEYESYESYES
Year FEYESYESYES
Industry FEYESYESYES
Region FENOYESYES
Year-Industry FEYESNONO
Year-Region FENONOYES
***, **, and * indicate the significance of variables at the 1%, 5%, and 10% levels, respectively.
Table 7. Heckman two-stage model, replace explained variables and subsample test.
(1)(2)(3)(4)(5)
VariablesESGESGESGESGESG
Treat_Post0.590 ***0.041 *0.655 **0.555 ***0.555 ***
(3.273)(1.829)(2.068)(3.029)(3.071)
Lev−8.058 ***−0.495 ***−3.181 ***−1.843 ***−2.204 ***
(−3.855)(−8.286)(−2.957)(−3.172)(−3.434)
Rib0.293 ***−0.002−0.039 *0.030 **0.014
(3.428)(−1.382)(−1.828)(2.397)(0.993)
Roa−0.2920.800 ***0.4433.901 ***0.898
(−0.186)(6.491)(0.202)(3.229)(0.598)
Grow0.327 ***−0.016 **0.0310.0000.027
(2.592)(−2.548)(0.302)(0.005)(0.436)
Ppe−19.506 ***0.091−1.3250.0360.065
(−3.081)(1.191)(−1.088)(0.052)(0.085)
Cash−2.824 **−0.234 **1.2470.4280.410
(−2.271)(−2.470)(0.835)(0.503)(0.452)
Top10.097 ***0.002 ***−0.0060.017 **0.025 ***
(3.727)(2.624)(−0.378)(2.105)(2.744)
Size3.124 ***0.171 ***1.537 ***0.543 ***0.237
(3.705)(11.397)(5.203)(4.010)(1.492)
Turnover−0.3620.0250.024−0.531 **−0.343
(−1.421)(0.870)(0.050)(−2.016)(−1.155)
IMR26.910 ***
(3.114)
Constant−78.283 ***2.885 ***7.33712.729 ***18.231 ***
(−2.662)(8.528)(1.074)(4.054)(4.966)
Observations804620,846577676495966
R-squared0.8460.6900.8500.8480.843
Firm FEYESYESYESYESYES
Year FEYESYESYESYESYES
Industry FEYESYESYESYESYES
***, **, and * indicate the significance of variables at the 1%, 5%, and 10% levels, respectively.
Table 8. PSM-DID and multi-period DID.
(1)
1:4 Nearest Neighbor Matching
(2)
Kernel Matching
(3)
Multi-Period DID
VariablesESGESGESG
Treat_Post0.575 ***0.621 ***0.319 *
(3.056)(3.449)(1.735)
Lev−1.651 ***−1.837 ***−1.710 ***
(−2.758)(−3.226)(−3.017)
Rib0.025 *0.030 **0.030 **
(1.936)(2.437)(2.447)
Roa3.921 ***2.938 **3.009 **
(3.136)(2.505)(2.564)
Grow−0.041−0.023−0.026
(−0.685)(−0.393)(−0.451)
Ppe−0.0810.051−0.001
(−0.113)(0.075)(−0.002)
Cash0.0990.0730.019
(0.114)(0.088)(0.023)
Top10.020 **0.020 ***0.019 **
(2.435)(2.606)(2.457)
Size0.499 ***0.533 ***0.543 ***
(3.541)(4.024)(4.103)
Turnover−0.414−0.355−0.372
(−1.536)(−1.395)(−1.460)
Constant13.632 ***12.728 ***12.551 ***
(4.172)(4.147)(4.087)
Observations733080428046
R-squared0.8480.8460.845
Firm FEYESYESYES
Year FEYESYESYES
Industry FEYESYESYES
***, **, and * indicate the significance of variables at the 1%, 5%, and 10% levels, respectively.
Table 9. Mechanism analysis.
(1)(2)(3)(4)
VariablesR&DESGICQESG
Treat_Post1.197 *** 0.038 ***
(6.152) (4.312)
R&D 0.094 ***
(8.434)
ICQ 1.031 ***
(4.191)
Lev−0.248−1.733 ***−0.039−1.649 ***
(−0.406)(−3.071)(−1.410)(−2.912)
Rib−0.028 **0.034 ***0.001 **0.029 **
(−2.081)(2.739)(2.205)(2.347)
Roa2.407 *2.879 **0.0363.051 ***
(1.902)(2.464)(0.619)(2.604)
Grow−0.010−0.021−0.001−0.028
(−0.162)(−0.368)(−0.244)(−0.481)
Ppe1.196−0.0530.017−0.045
(1.635)(−0.078)(0.524)(−0.067)
Cash0.427−0.007−0.001−0.010
(0.480)(−0.009)(−0.029)(−0.012)
Top1−0.024 ***0.021 ***−0.0000.019 **
(−2.807)(2.690)(−1.063)(2.495)
Size1.479 ***0.411 ***0.0020.553 ***
(10.362)(3.102)(0.378)(4.191)
Turnover0.175−0.417−0.037 ***−0.330
(0.635)(−1.641)(−2.938)(−1.297)
Constant−29.981 ***15.307 ***3.525 ***8.719 ***
(−9.060)(4.983)(23.447)(2.739)
Observations8033803380468046
R-squared0.8140.8470.4480.846
Firm FEYESYESYESYES
Year FEYESYESYESYES
Industry FEYESYESYESYES
***, **, and * indicate the significance of variables at the 1%, 5%, and 10% levels, respectively.
Table 10. Bdiff test.
(1)(2)(3)(4)
BdiffIndustryDualityDigital TransformationGovernment Subsidy
Treat_Post1.474 ***1.162 ***−0.941 ***−1.113 ***
Lev3.997 ***−0.977 **1.918 ***0.619
Rib−0.066 ***−0.049 ***0.022 *−0.022
Roa2.176 ***−1.178 **−2.731 **−2.425 *
Grow0.0400.218 ***0.0390.088
Ppe−0.916 **3.170 ***1.0341.214
Cash1.489 ***0.578−2.994 ***−1.873 ***
Top10.035 ***−0.000−0.020 **−0.011
Size−1.132 ***−0.731 ***0.308 *0.139
Turnover−1.602 ***0.271 **0.0321.113 ***
***, **, and * indicate the significance of variables at the 1%, 5%, and 10% levels, respectively.
Table 11. Heterogeneity analysis.
IndustryDualityDigital
Transformation
Government Subsidy
(1)
Ind = 1
(2)
Ind = 0
(3)
Dual = 1
(4)
Dual = 0
(5)
Low
Samples
(6)
High Samples
(7)
Low
Samples
(8)
High Samples
VariablesESGESGESGESGESGESGESGESG
Treat_Post−0.4930.981 ***−0.6880.914 ***0.1931.135 ***−0.1440.969 ***
(−1.063)(5.042)(−1.359)(4.559)(0.793)(3.500)(−0.586)(3.411)
Lev−4.685 ***−0.688−0.509−1.486 **−0.844−2.762 ***−1.540 **−2.159 **
(−3.141)(−1.105)(−0.336)(−2.282)(−1.051)(−2.987)(−2.102)(−2.133)
Rib0.079 ***0.0130.065 *0.0150.038 **0.0150.0140.036 *
(2.849)(0.934)(1.808)(1.088)(2.046)(0.846)(0.811)(1.846)
Roa0.0232.199 *4.409 *3.232 **1.7004.432 ***1.1383.563 *
(0.008)(1.716)(1.699)(2.295)(0.987)(2.645)(0.754)(1.694)
Grow−0.062−0.022−0.247−0.0300.013−0.0260.022−0.066
(−0.318)(−0.368)(−1.472)(−0.466)(0.187)(−0.249)(0.332)(−0.552)
Ppe0.748−0.168−2.3500.820−0.105−1.138−0.029−1.244
(0.551)(−0.201)(−1.258)(1.082)(−0.117)(−0.911)(−0.033)(−1.028)
Cash−1.1870.302−0.586−0.007−0.9971.996−0.4581.415
(−0.536)(0.345)(−0.301)(−0.008)(−0.927)(1.555)(−0.456)(0.957)
Top1−0.0050.030 ***0.0140.0140.0050.025 **0.028 **0.038 ***
(−0.281)(3.403)(0.575)(1.589)(0.451)(2.091)(2.449)(2.893)
Size1.652 ***0.520 ***1.280 ***0.549 ***0.804 ***0.496 **0.644 ***0.505 **
(4.073)(3.621)(3.351)(3.533)(3.763)(2.338)(3.547)(2.049)
Turnover0.778−0.824 ***−0.472−0.201−0.329−0.3610.122−0.991 **
(1.306)(−2.861)(−0.674)(−0.681)(−0.855)(−0.934)(0.346)(−2.364)
Constant−12.17912.735 ***−5.34312.595 ***4.73116.020 ***9.371 **14.089 **
(−1.303)(3.803)(−0.601)(3.500)(0.965)(3.252)(2.283)(2.387)
Observations16736350145163273911390838583859
R-squared0.8430.8500.8520.8530.8440.8770.8460.868
Firm FEYESYESYESYESYESYESYESYES
Year FEYESYESYESYESYESYESYESYES
Industry FEYESYESYESYESYESYESYESYES
***, **, and * indicate the significance of variables at the 1%, 5%, and 10% levels, respectively.
Disclaimer/Publisher’s Note: The statements, opinions and data contained in all publications are solely those of the individual author(s) and contributor(s) and not of MDPI and/or the editor(s). MDPI and/or the editor(s) disclaim responsibility for any injury to people or property resulting from any ideas, methods, instructions or products referred to in the content.

