Article

Web of Science Scientometrics on the Energy Efficiency of Buildings to Support Sustainable Construction Policies

by
Constantin C. Bungau
1,
Francesca Ioana Hanga Prada
1,2,*,
Tudor Bungau
3,
Constantin Bungau
4,5,*,
Gabriel Bendea
6 and
Marcela Florina Prada
1
1
Department of Architecture and Constructions, Faculty of Constructions, Cadaster and Architecture, University of Oradea, 410058 Oradea, Romania
2
Doctoral School, Technical University of Cluj-Napoca, 400114 Cluj-Napoca, Romania
3
Civil, Industrial and Agricultural Constructions Program of Study, Faculty of Constructions, Cadastre and Architecture, University of Oradea, 410058 Oradea, Romania
4
Doctoral School of Engineering Sciences, University of Oradea, 410087 Oradea, Romania
5
Department of Engineering and Management, University of Oradea, 410087 Oradea, Romania
6
Department of Energy Engineering, Faculty of Energy Engineering and Industrial Management, University of Oradea, 410058 Oradea, Romania
*
Authors to whom correspondence should be addressed.
Sustainability 2023, 15(11), 8772; https://doi.org/10.3390/su15118772
Submission received: 28 April 2023 / Revised: 24 May 2023 / Accepted: 26 May 2023 / Published: 29 May 2023
(This article belongs to the Special Issue Advances in Sustainability Research from the University of Oradea)

Abstract

:
A variety of strategies intended to support environmentally friendly and resource-efficient building processes comprise sustainable construction policies. The limited number of bibliometric analyses in the field may hinder the ability to assess the efficacy and impact of research efforts, impede the potential for collaboration, and even limit the dissemination of best practices. Therefore, the present study aims to analyze the impact of published data on the topic of energy efficiency of buildings using the Web of Science core collection database. We perform a bibliometric analysis and science mapping research that assesses significant parameters for the field. A total of 28,555 papers were analyzed using the VOSviewer program. The data was divided into two periods to determine the evolution of trends in this field. The most prolific countries in this field were China, the United States, and England. Following the analysis of the collaboration maps, it was determined that there is a strong collaborative relationship between these countries in the development of papers. The most prolific papers of the first period were published in Energy Policy and Energy and Buildings, which also ranked first in the second period, followed by Energies. It was observed that the most frequent terms used in literature searches in the field differ according to the periods analyzed. In the beginning, the most frequent term was “energy efficiency and performance”, and between 2011 and 2023, the terms “applied energy” and “renewable and sustainable energy” increased considerably with technological development. The results of this research demonstrate the significant and expanding scientific interest in this area and serve as a valuable asset for researchers studying the energy efficiency of buildings.

1. Introduction

In recent years, energy demand and energy consumption have grown rapidly as a result of the ever-increasing needs of humankind in relation to the economy, industries and agriculture. Depending on the region, global warming/cooling is occurring, and the seasons are extremely variable due to climate change. These changes are leading to significant lifestyle changes, including trends towards a healthy built environment [1,2]. It is undeniably true that increases in energy consumption are driven by the intrinsic structure of the economy, and these trends in integrating the economy into the European context lead to the need to adapt the national legislation of European countries to European energy efficiency legislation and policies [3].
Existing buildings are responsible for up to 40% of final energy consumption, but especially for a significant percentage of greenhouse gas emissions of CO2 [4]. Therefore, constructions and their energy efficiency through innovative solutions [5] have become a point of interest for the European Union, focusing on current and future trends and concerns. For the period until 2050 [6], Europe will be focused on climate neutrality and the decarbonization of the construction sector. This change is of great interest, and it can be observed that a real revolution is taking place in this direction [7], in conjunction with the existing path towards digitization [8]. In this context, the approaches to planning new buildings are different compared with those for existing buildings, with the results converging towards the same objective, namely that of energy efficiency. When planning and developing sustainable buildings, numerous financial, cultural, and environmental factors are considered, as well as their influence on the adjacent ecosystem. Implementation at a practical level requires the active participatory collaboration of the most important stakeholders in the field, including governments, universities, professional organizations, and private industry [9].
In the case of new buildings, the general concern is achieving nearly zero energy buildings (NZEB), which are buildings with a high energy performance and extremely low overall energy consumption; the objective may even be to achieve zero energy buildings (ZEB) [10,11]. Moreover, buildings are frequently referred to as “consumers”, but the tendency is for them to be “prosumers” (both producers and consumers of energy from renewable sources—sun and wind) and supply generated energy to the network (the surplus of the generated energy in addition to that consumed) [12]. This can be achieved in the case of SMART constructions that aim for suitable design of buildings, ensuring that energy losses are almost zero and that appropriate equipment is installed. Such constructions have become both a necessity and a requirement of SMART cities [13,14].
The suitable design of such buildings refers to both efficient insulation and the correct approach to the building envelope in relation to the shape, surface and stratification. The envelope of the building is its enclosing surface, which delimits the interior spaces from the exterior ones, and therefore, the heated from the unheated volumes. (It is the surface that delimits the building and through which the thermal transfer takes place.) The more efficient the building envelope, the lower the heat loss [15,16].
Providing the building with high-performance equipment is mandatory for both NZEB and “prosumer” constructions. This includes, on the one hand, equipment for the provision of utilities to produce heating/cooling of the environment and domestic hot water, ventilation equipment (with heat recovery), lighting, shading equipment, and appliances, etc. On the other hand, moving to a superior design, the building is provided with equipment that, based on the technology of their design and operation, produces energy. Renewable energy is based on non-fossil sources (i.e., wind, solar, aerothermal, geothermal, hydrothermal, ocean/hydropower, biomass, waste gas/biogas, wastewater treatment) [17,18,19]. In contrast, energy from non-renewable sources is obtained from resources that are depleted by exploitation (such as energy from fossil fuels) [20]. Energy can be either consumed in real time, stored in energy storage batteries (to be thus usable long after its production), or can be supplied to the network.
Another category of equipment is that used for monitoring, control, and controlled operation of all equipment in the building for environmental comfort, security and safety. Such equipment is known as a building management system or building monitoring system (BMS) [21] and ensures efficient operation of the building, specific to SMART buildings.
In the case of existing buildings, the general concern is their thermal and energy efficiency. This is addressed by rehabilitating building envelopes using suitably arranged, thermally performant materials and working with the existing envelope elements, either maintaining them or replacing the existing elements [22]. The energy efficiency of existing buildings involves the rehabilitation of the systems adding utilities or upgrading of these systems to provide the building with new equipment in a unified efficient design, possibly with energy production equipment (preferably using renewable sources). The next step of efficiency is the monitoring and control of the existing equipment and the comfort provided (indoor climate) with monitoring and control equipment, a BMS [21].
Depending on the particular objective and nature of the study, the critical parameters in the context of the energy efficiency of buildings can vary. Architecture, insulation, and building envelope materials have an important effect on energy efficiency. Factors such as thermal efficiency and air permeability play an essential role when assessing the building’s overall energy performance [23]. The heating, ventilation, and air conditioning systems of buildings are significant energy consumers. System effectiveness, maintenance, sizing, and control practices are a few examples of factors that can have a significant impact on energy efficiency [24].
The efficacy of lighting systems has a direct effect on energy consumption. In building structures, energy efficiency is affected by illumination technologies, management systems, daylighting approaches, and illumination levels [25]. Utilizing sources of renewable energy, such as solar photovoltaic systems, can help improve energy efficiency. Important considerations include the capacity of renewable energy systems, their integration within the building’s energy infrastructure, and their general efficiency [26].
Occupant behavior, occupancy trends, and user participation in energy-efficient strategies can all have a significant impact on energy consumption. Relevant variables include occupant behavior characteristics such as inhabitant density, utilization structures, and knowledge of energy-efficiency measures [27]. For a comprehensive knowledge of energy efficiency, it is essential to consider the entire life cycle of a structure from construction to operation to eventual demolition. For a comprehensive evaluation, parameters such as embodied energy, operational electricity consumption, and end-of-life aspects are essential [28].
The main factors describing the energy consumption of a building and the energy performance indicators are summarized in Figure 1.
Analyzing the development potential of the study topic, as well as some of the current unmet needs in terms of bibliometric analysis and mapping studies focused on subfields, led to the establishment of the objectives of the present study:
  • To identify bibliographic resources in the published scientific literature in the field of energy efficiency and analyze the impact of already published data on the topic, classified according to Web of Science (WoS) domains;
  • To contribute in a new and unique way to revealing the importance of this field by centralizing the most prolific journals, collaborative networks, publications etc.;
  • To highlight and rank the most prolific/important authors, journals, and countries by time intervals to better assess scientific trends;
  • To open up new possibilities for collaboration between authors;
  • To provide a conceptual overview of the research topics and practical approaches for future authors to target different journals, topics, publications, and collaborative networks;
  • To highlight the most frequently cited articles so that the most significant data can be retrieved more rapidly and precisely;
  • To demonstrate the rapidly rising interest in energy efficiency;
  • To provide time-saving tools for researchers interested in the topic by performing a visualization and bibliometric analysis of the available research on renewable energy.
Future researchers can, therefore, approach the most prominent journals, as well as the most relevant authors in the domain of energy efficient buildings, by observing the current work. The novelty of this topical approach resides in the fact that our research topic is less focused on science mapping and analysis than such studies in other scientific areas (i.e., economics, chemical compounds, medicine). Instead, we provide a complex bibliometric analysis showing the increasing trend of studies in this field concomitant with technological development. Moreover, the present paper addresses in a distinct and targeted way, the field of energy efficiency in buildings because the field of energy efficiency in general is much broader. Therefore, the results of the present research will provide a clearer understanding of the evolution of energy efficiency within the framework of sustainable construction and considering the context of the most recent national and international energy regulations and policies.

2. Materials and Methods

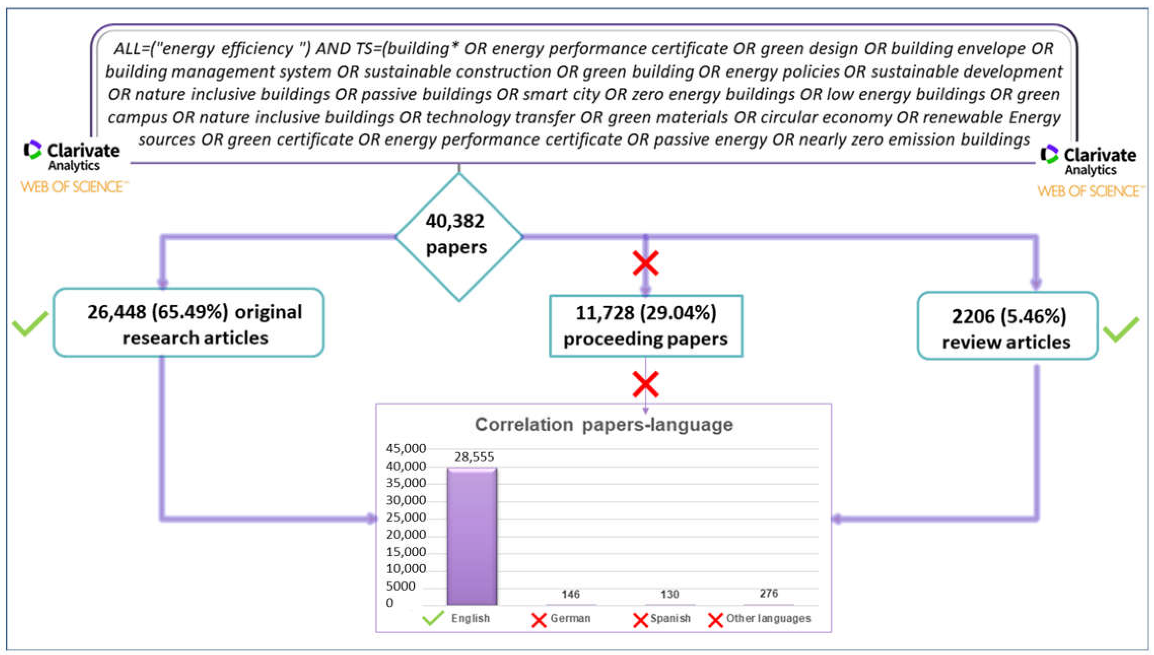
2.1. Web of Science Search and Filter Algorithm

Due to the advantages offered by WoS in terms of filtering and export possibilities, as well as the validity of the articles indexed in this database, it was selected for the present bibliometric analysis. Figure 2 shows the search algorithm in WoS, with the Boolean OR operator maximizing the number of results provided by the database. The papers that were identified were written in a total of 25 different languages, with the majority of the papers being written in English. Other languages identified in higher proportions were Spanish and German, and the rest of the languages presented fewer than 300 papers in total. The present study includes original research articles and review articles written in English, thus limiting the number of papers to 28,555.
Figure 3 depicts the classification made by WoS in terms of fields. The remaining categories were assigned fewer than 6000 papers.

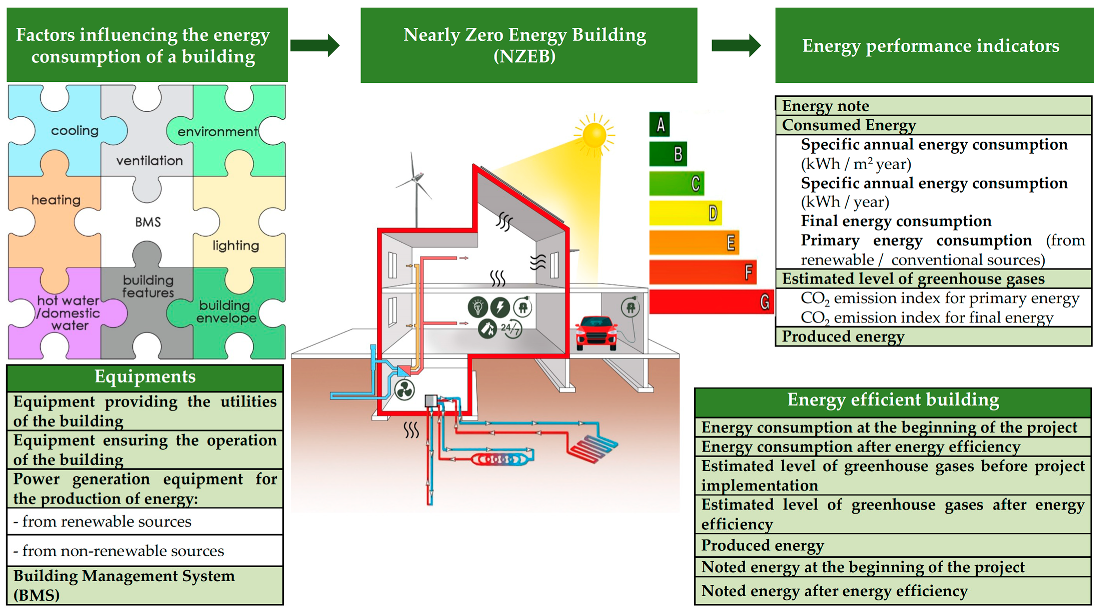
2.2. Algorithm Analysis and Explanatory Detailing of Graphical Elements

The papers required for this study were downloaded using the Export function available in the WoS interface. They were downloaded in tab-delimited file format, and the “Record count” was selected as “Full Record and Cited References”.
Dividing the analysis into two periods enables a clearer understanding the evolution of the research field over time, which is in close correlation with the development of technology. The first period covers articles from 1978 to 2010, and the second period covers data from 2011 to 2023. For each period the following datasets were analyzed: most productive charges in the field, most prolific journals, citation analysis of publication in the evaluated period, analysis of most productive organizations, and most prolific research areas. In addition to these analyses, the science mapping studies focused on co-authorship by country, the average year of publication of source and citation maps, and term maps and network maps of term co-occurrence. These were performed using VOSviewer version 1.6.19. [29].
On the network map of the co-authorship by country, the color indicates the cluster in which the respective country is located. Countries that have stronger collaborative links are represented closer together on the map. The size of the node/bubble is directly proportional to the number of articles published, and the thickness of a line connecting two bubbles/nodes is directly proportional to the degree of collaboration between the countries.
For the bubble map of the average publication year, the color of the bubble indicates the average year of publication of the articles in the respective journal. The years are represented as year.decimal, where the decimal represents a fraction of the year. In the case of the citation network maps, the size of the bubble is directly proportional to the number of papers published by the respective journal, and the color of the bubble represents the cluster in which the respective journal is distributed. Typically, journals that are in the same cluster and are closer to each other in the graphical representation contain papers that often cite each other. The thickness of a line connecting two bubbles is directly proportional to the degree of citation between the two journals.
In the bubble map of high-frequency terms, the color of the bubble is influenced by the average citation/paper and the size of the bubble is directly proportional to the number of occurrences of that word. In the case of the network map of term co-occurrence, the size of the bubble is directly proportional to the number of occurrences of the respective word, and the color of the bubble indicates the cluster in which the word is embedded; usually, words that occur more often in the same article are grouped in a cluster. The thickness of a line linking two words is directly proportional to the degree of co-occurrence of these words in an article.

3. Results

3.1. Period 1978–2010

3.1.1. Evaluation of the Most Productive Countries in the Field

Researchers from a total of 90 countries have written papers that fit the search terms presented above. Moreover, 41 (45.55%) have had at least 10 papers published. The most prolific country was the United States, with 518 (22.02%) published papers and a total of 34,422 citations. Although Canada ranks 6th in terms of the number of papers published, it stands out with a high average citation/manuscript, indicating that papers published by authors from this country had a high impact. Table 1 details the top 10 countries in terms of the number of papers published.

3.1.2. Assessment of the Most Prolific Journals in the Field

During this period, 557 journals were identified that published at least one paper in the evaluated field. Of these journals, 29 (5.20%) had at least 10 papers published. The most prolific journal was Energy Policy with 415 (17.64% of the total) papers published. This journal has an impact factor (IF) of 7576, or 7014 without self-citations, and on average, each paper had 60.59 citations, indicating that papers published in this journal have had a significant impact in this field. The second journal in terms of number of papers published was Energy and Buildings. This journal published 179 (7.61%) papers (a significant difference from Energy Policy with 415 papers published) and has an IF of 7201 or 6147 if self-citations are excluded. Table 2 details the most prolific journals in this period, and Figure 4 shows the journals with at least 10 papers published.

3.1.3. Citation Analysis of Publications in the Evaluated Period

A total of 2352 papers were published during the period under examination. The top 10 most cited papers of this period that fell within the search terms are shown in Table 3.
The first ranked article, “A review on buildings energy consumption information”, was published by Perez-Lombard in 2008 in the journal Energy and Buildings, which has an IF of 7.201. This article received the highest number of citations in this period (3701). The second article in terms of number of citations (1325), “Energy storage systems—Characteristics and comparisons”, was published by Ibrahim H. in 2008 in the journal Renewable and Sustainable Energy Reviews, which has an IF of 16,799.

3.1.4. Bibliometric Analysis of the Most Active Organizations in the Field

A total of 1623 affiliations were identified for papers published during this period. The most active organization was the United States Department of Energy with 202 published papers (8.59% of the total), followed by Lawrence Berkeley National Laboratory with 137 (5.82%) published papers, and University of California System with 132 (5.61%) published papers (Table 4).

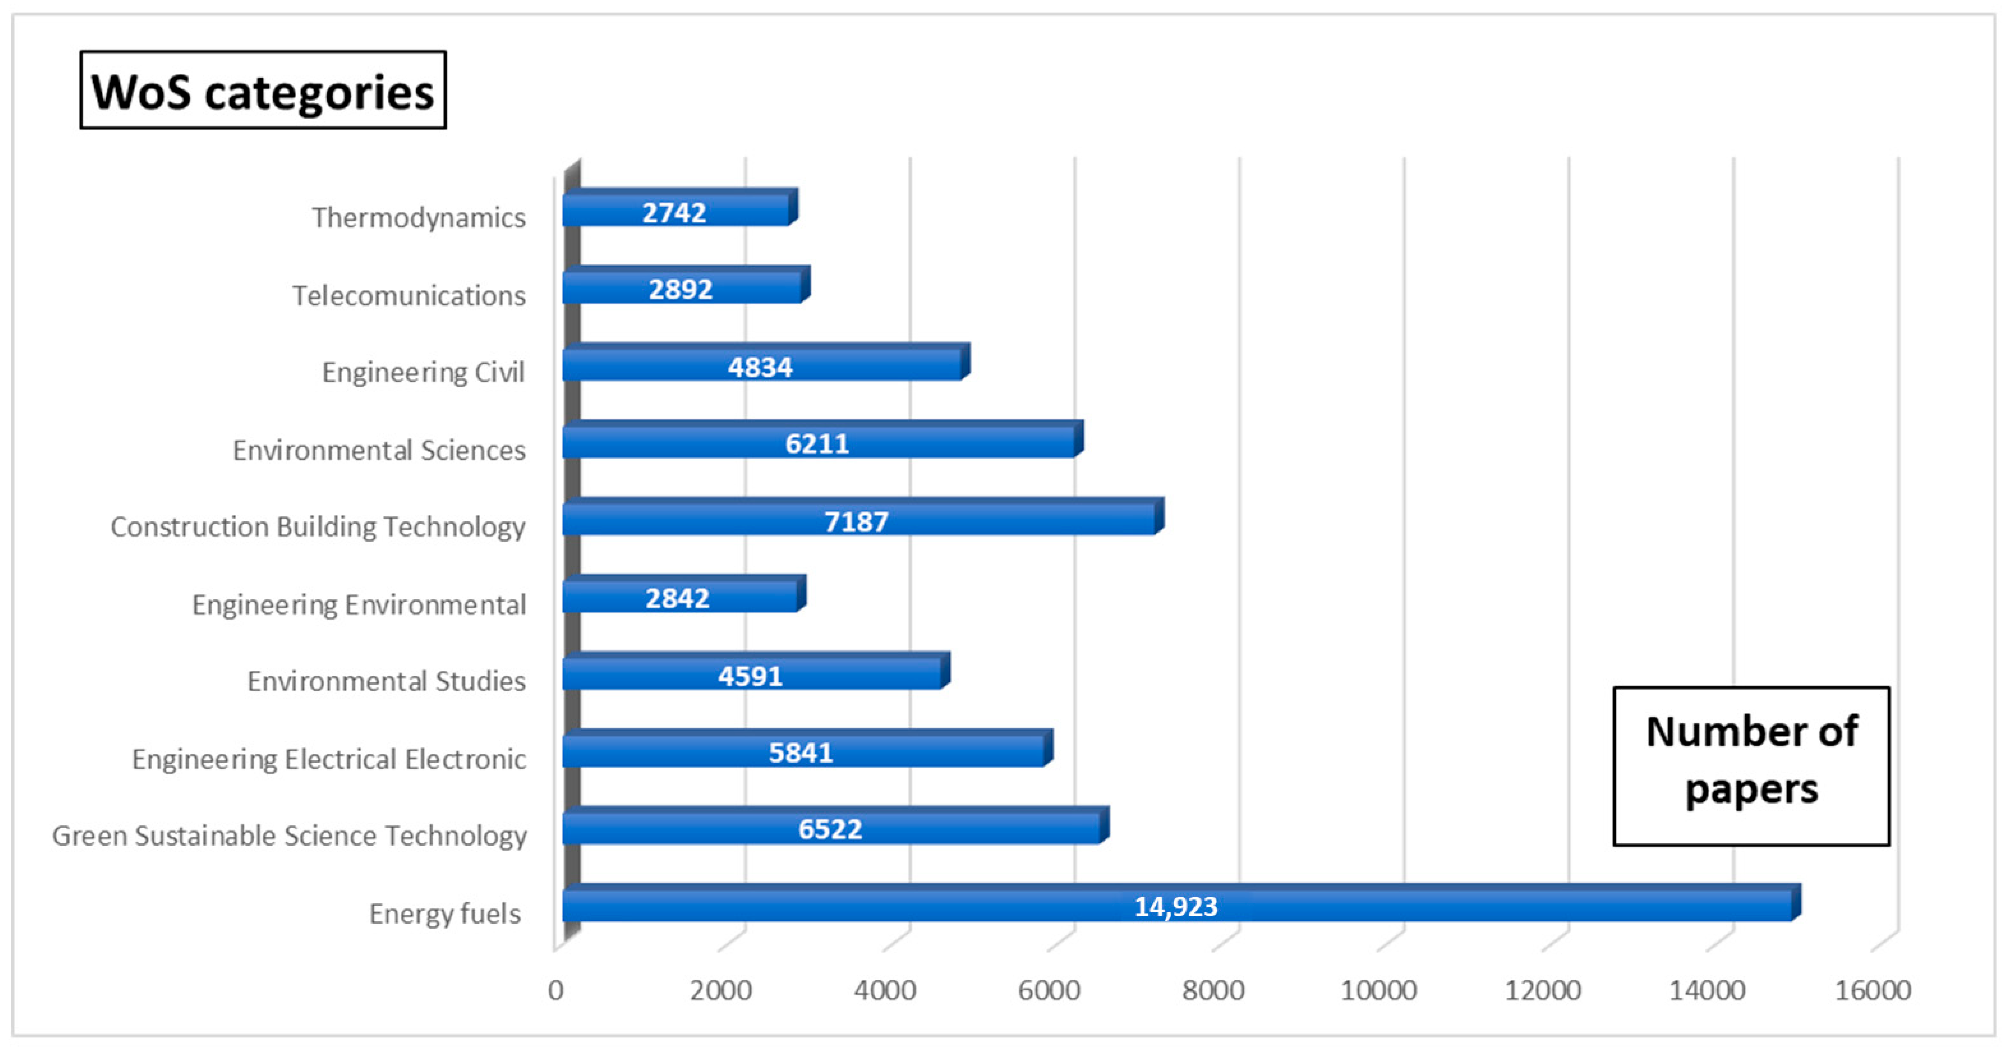
Most Prolific Research Areas

The papers were classified by WoS into 74 categories. Figure 5 shows the categories in which most of the papers were classified. The category with the most articles (1271) was “Energy Fuels”, followed by the category “Environmental Sciences Ecology” with 769 articles.

3.2. Science Mapping Analysis Tools

3.2.1. Country Co-Authorship Assessments

Figure 6 shows a map of co-authorship by country. In this figure, the countries that have at least 10 published papers (41 or 45.55%) are represented. These countries are grouped into five clusters: the red cluster contains 22 countries and is led by England (by number of articles); the green cluster includes 7 countries and is led by the United States; the blue cluster contains 5 countries and is led by Spain; the yellow cluster contains 4 countries and is led by Australia; and the purple cluster contains 2 countries and is led by Thailand. The countries that have collaborated most often are the United States and China, the United States and England, and the United States and Germany.

3.2.2. Source Average Publication Year and the Citation Network Map

Figure 7 shows the average publication years of the 29 journals that had at least 10 papers published. Energy Policy, the most prolific journal of this period with 415 papers published, had an average publication year of 2004.79. The average publication year of Energy and Buildings, the second most prolific journal, was 2005.72. Renewable Energy had an average publication year of 1999.11 and Energy, 2002.50. The journals that published the most articles towards the end of the period analyzed were Renewable and Sustainable Energy Reviews (2007.95), Journal of Green Building (2008.71), and Energy Efficiency (2008.87).
The parameters used for filtering the included journals were also used in the analysis shown in Figure 8, which depicts the citation network map between journals. According to Figure 8, the journals are grouped into three clusters. The red cluster contains 15 journals and is led by Energy and Buildings; the green cluster contains 8 journals and is led by Energy Policy; and the blue cluster contains 4 journals and is led by Climate Policy. The journals most strongly connected by frequently cited papers are Energy Policy and Energy, Energy Policy and Energy Economics, Energy Policy and Energy Efficiency, Energy and Buildings and Building and Environment, and Energy and Buildings and Energy Policy.

3.2.3. Term Map and Network Map of Term Co-Occurrence

Figure 9 shows the bubble map of high-frequency terms for the period 1978–2010. In this figure, only words with a minimum frequency of 25 are shown. The terms that had a high average citation/paper are “conservation” (47 occurrences, average citations 100.49), “consumption” (74, 90.99), and “electricity” (35, 93.66). The words with the highest occurrence, such as “energy efficiency”, have an occurrence of 732 and an average citation/paper 53.99. Other keywords including “sustainability” (53, 66.02), “renewable energy” (109, 59.58), “sustainable development” (83, 63.80), and “energy” (127, 72.22) also have a high prevalence.
The method of filtering the words included in Figure 10 was the same as in the previous assessment. This figure shows the network map of term co-occurrences. The terms are grouped into three clusters: the red cluster includes 17 terms, the green cluster includes 11 terms, and the blue cluster contains 11 terms. The following terms show an increased co-occurrence:
  • “energy efficiency” with “performance”, “energy policy”, “renewable energy”, “performance”, “buildings” and “consumption”;
  • “policy” with “energy”, “efficiency”, “consumption”, “conservation” and “renewable energy”;
  • “renewable energy” with “power”, “sustainable development”, and “energy policy”.
Figure 10. Co-occurrence network map of field related terms between 2001 and 2011.
Sustainability 15 08772 g010

3.3. Period 2011–2023

3.3.1. Evaluation of the Most Productive Countries in the Field

The total number of countries contributing to the development of papers increased to 150 from 90 in the previous period. Furthermore, 55 countries (36.66%) had more than 100 papers published. China was the country with the most published papers (6126) followed by the United States and England. In terms of the number of citations, the United States ranked first, followed by China and England, indicating that papers published by authors from the United States had a higher impact with an average citation/manuscript of 33.97. Table 5 shows in detail the top 10 countries in terms of the number of papers published.

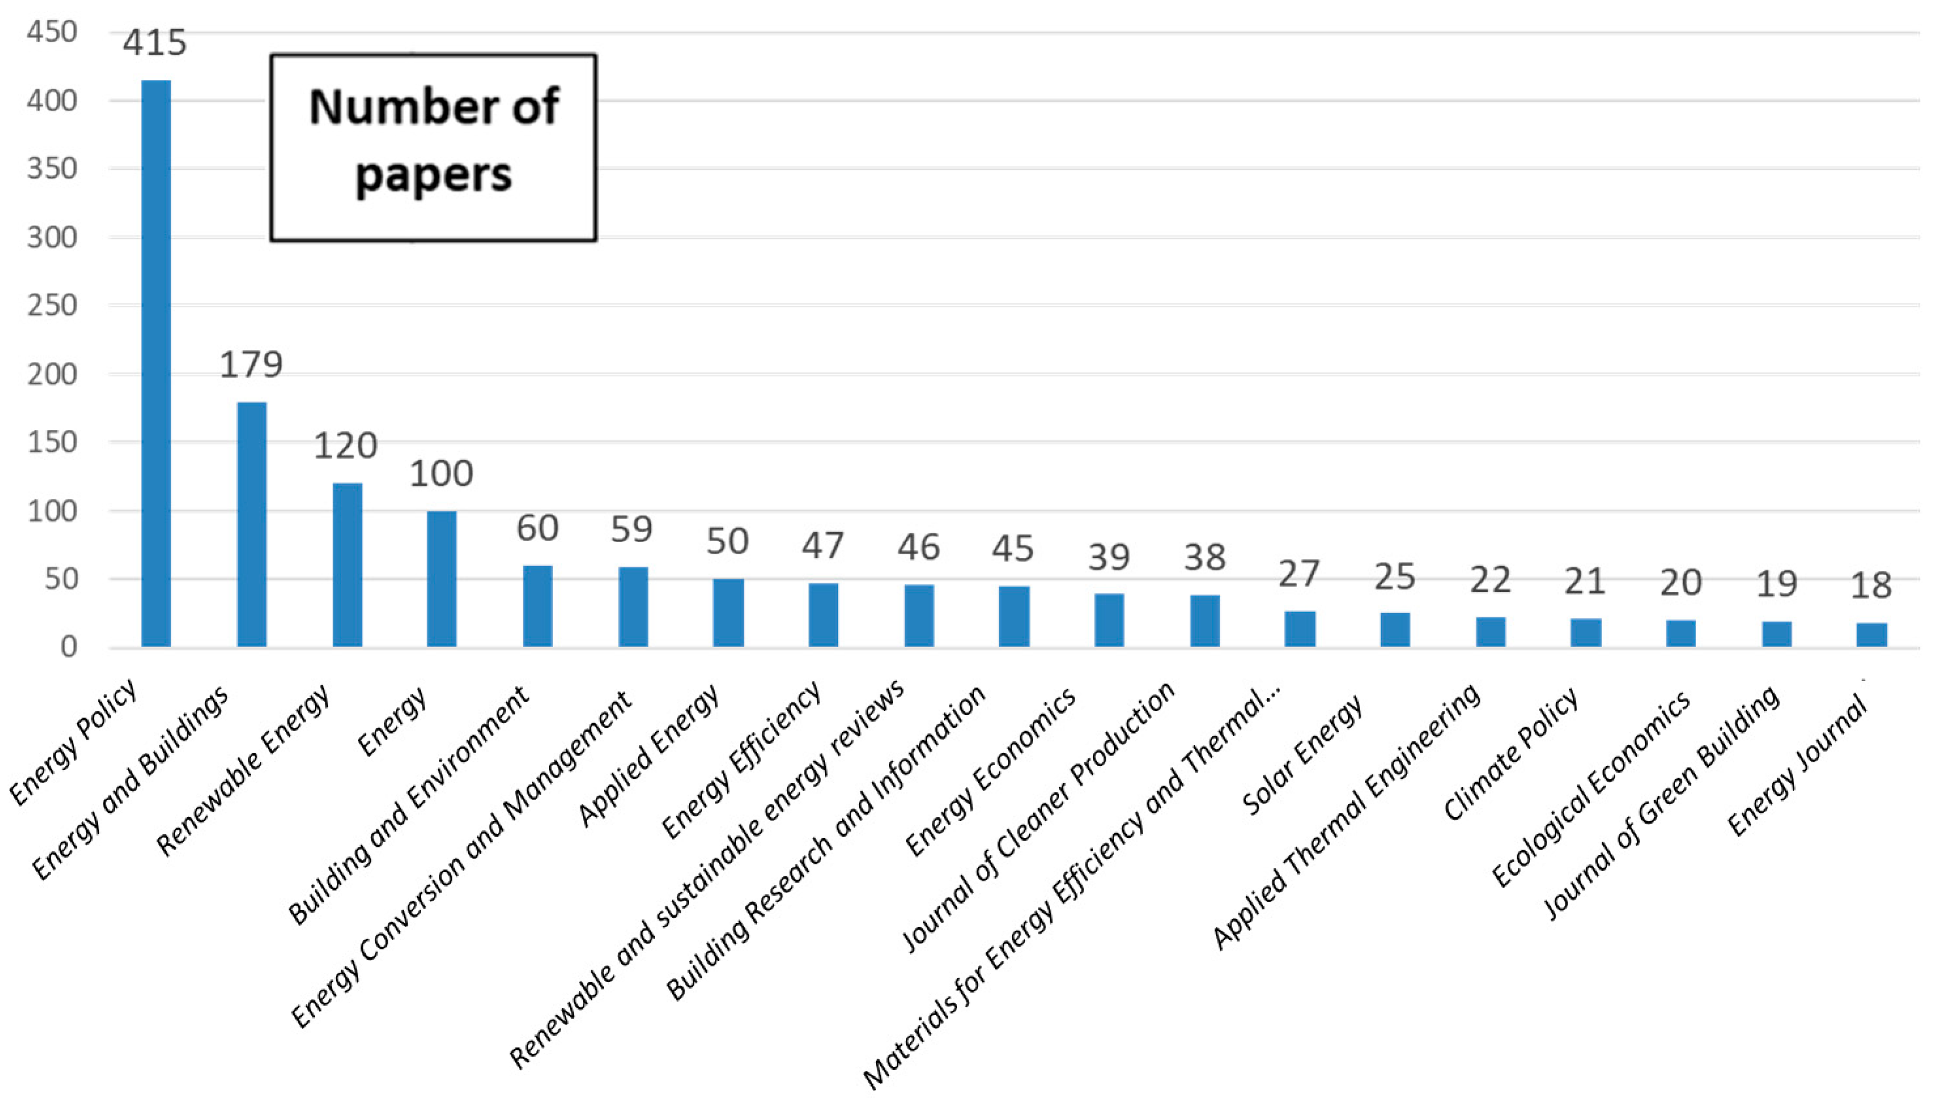
3.3.2. Assessment of the Most Prolific Journals in the Field

A total of 2888 journals were identified as having published papers in this domain, which is a significant increase from the first period (557), indicating that interest in this area has increased considerably. The number of journals that had at least 50 papers published was 60 (2.07%). The most prolific journal was Energy and Buildings with 1877 papers published (7.17% of the total output in this period). This journal has an IF of 7.201 and an IF score without self-citations of 6.147, with an average of 30.77 citations/paper. The second journal in terms of number of articles published, Energies (1358, 5.19%), has an IF of 3.252 and an IF without self-citations of 2.466. Table 6 details the top 10 journals ranked by number of papers published, and Figure 11 shows journals with at least 100 papers published.

3.3.3. Citation Analysis of Publications in the Evaluated Period

During the period under investigation, a total of 26,203 papers were published. The top 10 most cited papers of this period that fell within the search terms are shown in Table 7.
The first article, by number of citations, “Electrochemical Energy Storage for Green Grid”, was published by Yang, Z.G., in the Journal Chemical Reviews, which has an IF of 72,087; this article has gathered a total of 3600 citations. In second place is Luo, X., with the article entitled “Overview of current development in electrical energy storage technologies and the application potential in power system operation”, which was published in t Applied Energy with an IF of 11.446 and a total of 2032 citations. Due to the high number of citations gathered by these articles, they have had a significant impact in the field of sustainability.

3.3.4. Bibliometric Analysis of the Most Active Organizations in the Field

A total of 11,453 affiliations of authors publishing during the period evaluated were identified. The most active organization was the United States Department of Energy, with 1393 published documents (5.32% of the total). Furthermore, the Lawrence Berkeley National Laboratory with 606 (2.31%) published papers and the University of California System with 576 (2.20%) published papers were the next most prolific. The most active organizations in the evaluated domain are presented in Table 8.
The papers were classified by WoS into 107 categories. Figure 12 shows the categories in which most papers were classified. The category with the most articles (10,686) is “Energy Fuels” followed by “Engineering” with 10,642 articles. It is important to note that a paper can be classified into more than one WoS category.

3.4. Science Mapping Analysis Tools

3.4.1. Country Co-Authorship Assessments

Figure 13 shows the map of the co-authorship by country. In this figure shows the countries that have at least 100 published papers (55 or 36.66%). The countries are grouped into four clusters: the red cluster contains 24 countries and is led by Italy (by number of articles); the green cluster includes 17 countries and is led by China; the blue cluster contains 11 countries and is led by England; the yellow cluster is led by Spain. The countries showing a strong collaborative relationship are represented by China, the United States, Australia, Canada, and England. The United States collaborated often with Germany, Canada, South Korea, Italy, and England.

3.4.2. Source Average Publication Year and the Citation Network Map

Figure 14 shows the average years of publication for the 60 (2.07%) journals that had at least 50 papers published. The average publication year of the most prolific journal in this period, Energy and Buildings, is 2017.20; the journal Energies ranked second in terms of the number of papers published in this area and has an average publication year of 2019.83; Sustainability, which is ranked third, has an average publication year of 2019.73. The journals that published the most articles at the end of this period are Buildings (2021.00) and Energy Reports (2021.30).
The filter parameters for the journals are the same as those in the previous figure. Figure 15 shows the citation network map between journals. According to Figure 15, the journals are grouped in three clusters differentiated by color. The red cluster contains 20 journals and is led by the Journal of Cleaner Production, the green cluster contains 13 journals and is led by the most prolific journal of this period, Energy and Buildings, and the blue cluster contains 11 journals and is led by Applied Energy. The following journals are strongly connected by frequently cited papers: Energy and Buildings and Applied Energy, Renewable and Sustainable Energies and Building and Environment. Another group of journals linked by frequent citations includes Energy Policy, Journal of Cleaner Production, Energy Efficiency, Energy, and Energies.

3.4.3. Term Map and Network Map of Term Co-Occurrence

Figure 16 shows a bubble map of high-frequency terms for the period 2011–2023. In this figure, only the words with a minimum occurrence of 250 (81 terms) are shown. The terms with high average citations/paper were “office buildings” (398, 32.74), “life cycle assessment” (500, 32.67), “electricity consumption” (299, 31.95), “greenhouse gas emissions” (253, 36.66), “carbon emissions” (379, 30.04), “economic growth” (523, 29.70), and “electricity” (393, 30.49). Other keywords for the topic of interest were “renewable energy” (1390, 25.31), “residential buildings” (898, 27.60), “sustainability” (1123, 19.05), and “efficiency” (1709, 22.18).
The method of filtering the words included in Figure 17 remains unchanged from the previous figure. In this figure, the network map of term co-occurrence is shown. The terms are grouped into three clusters: the red cluster includes 34 terms, the green cluster includes 25 terms, and the blue cluster contains 22 terms. The following terms show a re-estimated co-occurrence:
-
“energy efficiency with “performance”, “consumption”, “buildings”, “design”, “optimization” and “impact”;
-
“performance” with “consumption”, “simulation”, “buildings”, “design”, “thermal comfort” and “optimization”;
-
“optimization” with “renewable energy”, “thermal comfort”, “residential buildings”, and “buildings”.
Figure 17. Co-occurrence network map of RA related terms between 2001 and 2011.
Sustainability 15 08772 g017

4. Discussion

Global scientific and economic interest has grown in recent years towards solving unmet energy consumption needs by applying sustainable green building concepts and practices or retrofitting old buildings for increasing energy efficiency [28].
In the framework of environmentally friendly growth and the efficiency of energy in buildings, policies and initiatives implemented by the government play an essential part in the process of supporting sustainable practices and setting energy-efficient transitions. The incorporation of pertinent energy policies into research not only provides useful insights into the regulatory system but also opens the way for additional investigation [50]. The assessment of the energy consumption of both existing buildings (rehabilitated/or not) and newly built buildings Is done through the energy certification of the building [51]. The certification entity must be independent of the building owner, investor, constructor, architect, and material supplier so that the entire building certification system becomes an essential tool for sustainable development [52].
In Romania, an Energy Performance Certificate (EPC) provides information on the energy consumption of a building from conventional or renewable sources to provide utilities, including heating, cooling, domestic hot water, ventilation and lighting, and the amount of CO2 emissions is also assessed. This system assigns each building to an energy class (indicated with letters between A and G) and a grade between 1 and 100. In the EPC, the auditor provides recommendations for reducing energy consumption. The EPC system is regulated by Law no. 101/1, July 2020 [53] and Law no. 37/13, December 2005 [54].
Governments frequently enact building energy codes and standards, which typically specify the minimum energy efficiency requirements for newly constructed buildings and significant renovations. These building regulations and norms can be examined in order to determine the effect that they have on the amount of energy that is consumed by buildings as well as the spread of energy-efficient technology and practices [55].
Numerous governments and enterprises that work directly together offer financial incentives, grants, and subsidies in order to encourage the construction of energy-efficient buildings, retrofits, and the incorporation of renewable energy sources. Researchers are able to study the efficacy of these incentives in promoting investments in energy efficiency and the consequent effects on lowering energy usage [56].
Green building certification systems, such as LEED (Leadership in Energy and Environmental Design) and BREEAM (Building Research Establishment Environmental Assessment Method), provide voluntary frameworks for evaluating and recognizing the sustainability performance of buildings. Evaluating the degree to which these certification systems have been adopted and how much of an impact they have had may offer perspectives on the important function that they play in advancing sustainable construction practices [57].
Modern facilities and associated tools such as the Internet of Things (IoT) and smart infrastructure have transformed the design, construction, and operation of buildings. The combined application of cutting-edge technologies and architectural principles seeks to improve energy efficiency, comfort for residents, and sustainability as a whole [58].
With IoT-enabled intelligent facilities, buildings may incorporate multiple systems, including lighting, heating/cooling, security, and energy management, allowing for centralized control and efficient administration. In this regard, sensors may track occupancy levels, humidity, temperature, and illumination conditions, optimizing the use of energy while preserving comfort. Intelligent lighting systems may adjust luminance dynamically based on natural light, occupancy, and customer preferences, thereby reducing wasteful energy consumption [59]. Furthermore, contemporary building design prioritizes the use of eco-friendly materials and construction methods. Energy-efficient building envelopes with improved insulation, efficient glazing, and adequate shade serve to reduce heat gain and loss. Green roofs, rooftop solar panels, and precipitation collection systems assist in the production of energy and the preservation of water [59,60].
Energy management in newly formed smart cities is an important area of research and practice. It attempts to maximize the efficiency of energy use, lower the amount of carbon emissions produced, and improve the overall sustainability of metropolitan environments. Smart cities work toward the goal of effective management of energy resources by incorporating emerging forms of technology, data analytics, and artificial intelligence into their infrastructure [61].
In order to obtain insights into patterns of energy usage, smart cities gather and examine large volumes of data from a variety of sources, such as sensors, smart meters, and devices connected to the IoT. Identifying energy usage patterns, locating anomalies, and developing forecasting algorithms for energy demand may all be accomplished with the help of advanced data analytics techniques such as machine learning and intelligent technology. These methods, which are driven by data, make it possible to arrive at more accurate energy management plans and decision-making procedures. The demand response solutions that are implemented in smart cities enable residents to make adjustments to the amount of energy they use depending on real-time price or demand signals [62].
The energy storage systems that are integrated into smart cities are used to store the surplus of renewable energy that is generated. This stored energy is available for use during times of intense demand or when there is a shortage of renewable generation. Battery storage systems, hydroelectric power storage, and other cutting-edge technologies are being implemented to increase the proportion of sources of clean energy while simultaneously improving the dependability and adaptability of the energy grid [63].
Every single smart city varies in terms of its innovations, regulations, and strategies, but they all use cutting-edge technology and environmentally friendly techniques to enhance the quality of life for inhabitants while reducing adverse environmental effects. There are several examples of recently developed smart urban areas around the world which demonstrate innovative technologies and environmentally responsible practices: Delhi and Stockholm [64], Singapore [65], Masdar City [60], and Barcelona [66].
The present bibliometric analysis highlights a subject that is less addressed in the literature by investigating the growing trend towards optimizing energy efficiency and sustainable development with renewable energy (in the management of sustainable buildings). In this respect, the possibilities for collaboration, setting search patterns in the scientific literature, and identifying the current state of knowledge for detecting current unmet needs and future research directions become highly important.
Overall, China has published the most papers in this field (6349), followed by the United States with 5310 published papers and England with 2179 published papers. In total, these countries published 13,838 (48.46%) of the total number of papers, indicating that sustainability is a topic of primary interest in these countries. Figure 18 shows in detail the evolution over time of the number of papers published by these countries. The number of articles published by these countries has gradually increased, and since 2010, a much faster increase can be observed in correlation with technological development. The first year in which China surpasses the United States in the number of articles published (343 vs. 325) is 2016.
Following the analysis shown in the tables highlighting the most prolific journals in the period under analysis, we can deduce that in the first period, the most prolific journals were Energy Policy, Energy and Buildings and Renewable Energy with 415, 179 and 122 papers published, respectively. In the second period, the most prolific journals were Energy and Buildings with 1877 papers, followed by Energies and then Sustainability with 1358 and 983 papers. The journal that stands out in both periods due to its high IF and high average citations per paper is Renewable and Sustainable Energy Reviews, indicating that papers published in this journal have a significant impact in this field.
Based on the analysis of the papers with the highest citation rate, it can be determined that they cover several topics in the field of energy and sustainability. The paper ranked first in the first period has the highest number of citations, but this may also be because it was published much earlier compared with the papers published in Table 2. The papers that received the most citations were published in journals such as Chemical Reviews and Nature, which highlights the impact of these journals in the field.
The analysis of the collaboration maps between countries indicates that there is an increasing trend. These maps allow us to analyze which countries collaborate frequently with each other to produce quality papers and can serve as a guide for authors who are interested in finding collaborators interested in the same topic. In both periods, there was a strong collaborative link among the top three countries in terms of the number of papers (the United States, China, and England).
In both periods, three clusters are formed around journals whose articles are frequently cited by articles in other journals. In the first period, the clusters are formed around the following journals: Energy policy, Energy and Buildings and Annual Review of Energy and the Environment. In the second period, clusters are formed around Energy and Buildings, Journal of Cleaner Production and Applied Energy.
The present paper applies bibliometric approaches to determine the most productive nations, prolific journals, highly cited publications, active organizations, collaborative networks, term co-occurrence maps, high-frequency terms, and research areas in the field. This yields significant knowledge about the research landscape and contributes to the field’s fundamental development.
The outcomes of the bibliometric analysis are equally practical and academically valuable. Moreover, policymakers and industry professionals may use the data on the most prosperous states and active organizations to pinpoint potential collaborators for international partnerships and knowledge sharing. In addition, being aware of the most prolific journals in the field enables stakeholders to keep abreast of the most recent research and developments in the field. This aids in the formulation of sustainable building regulations and the promotion of energy-efficient building approaches.
From an academic point of view, the research findings provide an overview of the existing knowledge and current developments in the field of energy efficiency of buildings from 1978 (the year of the first publication that matched the search algorithm) to the present. Furthermore, the terms co-occurrence mapping and high-frequency terms provide scientists with a conceptual overview of the research topics and practical approaches, enabling them to identify popular research areas and direct their studies accordingly. The recognition of collaborative networks and research areas facilitates multidisciplinary cooperation and the transfer of knowledge between researchers working on multiple facets of sustainable construction policies.
The paper also makes significant contributions to the field’s fundamental research. It offers an in-depth examination of the research landscape by conducting the first bibliometric analysis based on a complex sorting algorithm on the energy efficiency of buildings in the context of sustainable building policies. This evaluation offers a foundation for subsequent studies by providing an initial comprehension of the current state, key contributors, and current research trends in the field. Based on this analysis, researchers may proceed deeper into specific sub-topics, investigate integrative connections, and identify areas of investigation requiring additional study.
The results of this bibliometric evaluation can direct further study in multiple ways. Initially, researchers can concentrate on countries that have demonstrated significant productivity and collaboration potential, allowing for the formation of international research networks and the exchange of best practices. In addition, an analysis of the identified highly cited papers may offer insights into the most significant works in the field, highlighting areas where future research can build on or challenge existing theories and methodologies. In the rapidly evolving scientific landscape of the present day, scientists strive to keep abreast of the most recent developments in order to enhance their own work and contribute to the field. In addition, the term co-occurrence map and high-frequency terms emphasize emerging research areas and evolving trends in time (1978–present), which can assist researchers in identifying novel research questions and inter-disciplinary links in a way that is less time-consuming than every researcher individually searching through all the scientific literature to determine the topic of study, journals to publish in, and identify current trends, etc.
Although bibliometric analyses have certain advantages related to the method of analysis, they also have several limitations. Their most significant disadvantage related to the method of analysis itself, is that due to the large number of documents, the results cannot be manually checked, so that certain articles may be included that are not exactly on the subject being researched. Another disadvantage is that only articles written in English were included in this article; thus, quality and influential documents written in another language may be omitted.

5. Conclusions

Based on the outcomes of the bibliometric analysis, the present research paper has several significant implications. Initially, it indicates the most productive states, emphasizing the global distribution of building energy efficiency research efforts. Policymakers and funding agencies can use this knowledge to target certain nations for cooperation and the allocation of resources. Secondly, the analysis identifies the most prolific journals, which signifies the most relevant platforms for disseminating research results and facilitates the identification of the most significant publications in the field. In addition, the centralized identification of highly cited publications highlights significant contributions that have considerably influenced the energy efficiency of buildings research topic.
The present study on the energy efficiency of buildings involves bibliometric and visualization analysis in combination with specialized software applications that provide a quantitative measurement of articles and reports completed to date, bridging chronological gaps, and delivering a useful resource for academics interested in this area. Moreover, 28,555 papers were returned by the complex algorithm used in searching and sorting data over a long period of time and constituted the resource for bibliometric analysis. Most of the analyzed papers (91.76% or 26,203) were published in the second period analyzed (2011–2023), indicating that this topic has gained high interest in this latter period due to the advantages arising from technological advancement.
Scientists can make informed decisions regarding the topics they choose to research, the working partnerships they form, and the journals they publish in by considering the factors examined in this analysis and the displayed results. This aids in streamlining the research procedure, accelerating the dissemination of knowledge, and maximizing the impact of their work in the field of study.

Author Contributions

Conceptualization, C.C.B. and M.F.P.; Data curation, C.C.B. and T.B.; Formal analysis, F.I.H.P.; Investigation, C.C.B., T.B. and M.F.P.; Methodology, F.I.H.P. and G.B.; Project administration, C.B.; Resources, T.B.; Software, T.B. and G.B.; Supervision, C.B. and M.F.P.; Visualization, F.I.H.P. and M.F.P.; Writing—original draft, C.C.B., C.B. and G.B.; Writing—review and editing, F.I.H.P. and T.B. All authors have read and agreed to the published version of the manuscript.

Funding

This research was funded by the Romanian Ministry of Research, Innovation and Digitization through Program 1—Development of the National Research and Development System, Subprogram 1.2—Institutional Performance—Projects for funding the excellence in RDI, Contract No. 29 PFE/30.12.2021 with the University of Oradea.

Data Availability Statement

Information presented in this paper are supported by Web of Science data base and by the references mentioned in the text.

Conflicts of Interest

The authors declare no conflict of interest.

References

  1. Butera, F.M. Climatic change and the built environment. Adv. Build. Energy Res. 2011, 4, 45–75. [Google Scholar] [CrossRef]
  2. Bungău, C.C.; Prada, I.F.; Prada, M.; Bungău, C. Design and Operation of Constructions: A Healthy Living Environment-Parametric Studies and New Solutions. Sustainability 2019, 11, 6824. [Google Scholar] [CrossRef]
  3. Prada, M.; Popescu, D.E.; Bungau, C.; Pancu, R. Parametric Studies on European 20-20-20 Energy Policy Targets in University Environment. J. Environ. Prot. Ecol. 2017, 18, 1146–1157. [Google Scholar]
  4. Wang, W.; Zmeureanu, R.; Rivard, H. Applying multi-objective genetic algorithms in green building design optimization. Build. Environ. 2005, 40, 1512–1525. [Google Scholar] [CrossRef]
  5. Prada, M.; Prada, I.F.; Cristea, M.; Popescu, D.E.; Bungău, C.; Aleya, L.; Bungău, C.C. New solutions to reduce greenhouse gas emissions through energy efficiency of buildings of special importance—Hospitals. Sci. Total Environ. 2020, 718, 137446. [Google Scholar] [CrossRef]
  6. Energy Roadmap. 2050. Available online: https://ec.europa.eu/energy/sites/ener/files/documents/2012_energy_roadmap_2050_en_0.pdf (accessed on 13 February 2023).
  7. Prada, M.; Popescu, D.; Bungau, C. Building Education, Source of Energy Saving in Romania. In Proceedings of the 15th National Technical-Scientific Conference on Modern Technologies for the 3rd Millennium, Oradea, Romania, 27–28 November 2015; pp. 157–162. [Google Scholar]
  8. Herman, G.V.; Caciora, T.; Ilies, D.C.; Ilies, A.; Deac, A.; Sturza, A.; Sonko, S.M.; Suba, N.S.; Nistor, S. 3D Modeling of the Cultural Heritage: Between Opportunity and Necessity. J. Appl. Eng. Sci. 2020, 10, 27–30. [Google Scholar] [CrossRef]
  9. Bungau, C.C.; Bungau, T.; Prada, M.F.; Prada, I.F.; Moleriu, R.D. Sustainable development through green buildings: Updated bibliometric analysis of the literature in the field. Rom. J. Mater. 2023, 53, 82–93. [Google Scholar]
  10. Hernandez, P.; Kenny, P. From net energy to zero energy buildings: Defining life cycle zero energy buildings (LC-ZEB). Energy Build. 2010, 42, 815–821. [Google Scholar] [CrossRef]
  11. Kapsalaki, M.; Leal, V.; Santamouris, M. A methodology for economic efficient design of Net Zero Energy Buildings. Energy Build. 2012, 55, 765–778. [Google Scholar] [CrossRef]
  12. Caballero, V.; Vernet, D.; Zaballos, A. A Heuristic to Create Prosumer Community Groups in the Social Internet of Energy. Sensors 2020, 20, 3704. [Google Scholar] [CrossRef]
  13. Bhutta, F.M. Application of smart energy technologies in building sector—Future prospects. In Proceedings of the International Conference on Energy Conservation and Efficiency (ICECE), Lahore, Pakistan, 22–23 November 2017; Institute of Electrical and Electronics Engineers Inc.: Piscataway, NJ, USA, 2017; pp. 7–10. [Google Scholar]
  14. Popescu, D.E.; Bungau, C.; Prada, M.; Domuta, C.; Bungau, S.; Tit, D.M. Waste management strategy at a public university in smart city context. J. Environ. Prot. Ecol. 2016, 17, 1011–1020. [Google Scholar]
  15. Iwaro, J.; Mwasha, A. The impact of sustainable building envelope design on building sustainability using Integrated Performance Model. Int. J. Sustain. Built Environ. 2013, 2, 153–171. [Google Scholar] [CrossRef]
  16. Mwasha, A.; Williams, R.G.; Iwaro, J. Modeling the performance of residential building envelope: The role of sustainable energy performance indicators. Energy Build. 2011, 43, 2108–2117. [Google Scholar] [CrossRef]
  17. Owusu, P.A.; Asumadu-Sarkodie, S. A review of renewable energy sources, sustainability issues and climate change mitigation. Cogent Eng. 2016, 3, 1167990. [Google Scholar] [CrossRef]
  18. Panwar, N.L.; Kaushik, S.C.; Kothari, S. Solar greenhouse an option for renewable and sustainable farming. Renew. Sustain. Energy Rev. 2011, 15, 3934–3945. [Google Scholar] [CrossRef]
  19. Tiwari, G.N.; Mishra, R.K. Advanced Renewable Energy Sources; Royal Society of Chemistry: London, UK, 2012. [Google Scholar]
  20. Methodology for Calculating the Energy Performance of Buildings. Part I-Building Envelope. Code Mc 001/1-2006. Available online: https://www.mdlpa.ro/userfiles/reglementari/Domeniul_XXVII/27_11_MC_001_1_2_3_2006.pdf (accessed on 14 February 2023).
  21. Minarčík, P.; Procházka, H.; Gulan, M. Advanced Supervision of Smart Buildings Using a Novel Open-Source Control Platform. Sensors 2020, 21, 160. [Google Scholar] [CrossRef]
  22. Shahi, S.; Esnaashary Esfahani, M.; Bachmann, C.; Haas, C. A definition framework for building adaptation projects. Sustain. Cities Soc. 2020, 63, 102345. [Google Scholar] [CrossRef]
  23. Asdrubali, F.; Baldassarri, C.; Fthenakis, V. Life cycle analysis in the construction sector: Guiding the optimization of conventional Italian buildings. Energy Build. 2013, 64, 73–89. [Google Scholar] [CrossRef]
  24. Simpeh, E.K.; Pillay, J.P.G.; Ndihokubwayo, R.; Nalumu, D.J. Improving energy efficiency of HVAC systems in buildings: A review of best practices. Int. J. Build. Pathol. Adapt. 2022, 40, 165–182. [Google Scholar] [CrossRef]
  25. Al-Ghaili, A.M.; Kasim, H.; Al-Hada, N.M.; Othman, M.; Saleh, M.A. A Review: Buildings Energy Savings—Lighting Systems Performance. IEEE Access 2020, 8, 76108–76119. [Google Scholar] [CrossRef]
  26. Sailor, D.J.; Anand, J.; King, R.R. Photovoltaics in the built environment: A critical review. Energy Build. 2021, 253, 111479. [Google Scholar] [CrossRef]
  27. Schweiker, M. Understanding Occupants’ Behaviour for Energy Efficiency in Buildings. Curr. Sustain. Energy Rep. 2017, 4, 8–14. [Google Scholar] [CrossRef]
  28. Bungau, C.C.; Bungau, C.; Toadere, M.T.; Prada-Hanga, I.F.; Bungau, T.; Popescu, D.E.; Prada, M.F. Solutions for an Ecological and Healthy Retrofitting of Buildings on the Campus of the University of Oradea, Romania, Built Starting from 1911 to 1913. Sustainability 2023, 15, 6541. [Google Scholar] [CrossRef]
  29. Van Eck, N.J.; Waltman, L. Software survey: VOSviewer, a computer program for bibliometric mapping. Scientometrics 2010, 84, 523–538. [Google Scholar] [CrossRef] [PubMed]
  30. Pérez-Lombard, L.; Ortiz, J.; Pout, C. A review on buildings energy consumption information. Energy Build. 2008, 40, 394–398. [Google Scholar] [CrossRef]
  31. Ibrahim, H.; Ilinca, A.; Perron, J. Energy storage systems—Characteristics and comparisons. Renew. Sustain. Energy Rev. 2008, 12, 1221–1250. [Google Scholar] [CrossRef]
  32. Granqvist, C.G. Transparent conductors as solar energy materials: A panoramic review. Sol. Energy Mater. Sol. Cells 2007, 91, 1529–1598. [Google Scholar] [CrossRef]
  33. Swan, L.G.; Ugursal, V.I. Modeling of end-use energy consumption in the residential sector: A review of modeling techniques. Renew. Sustain. Energy Rev. 2009, 13, 1819–1835. [Google Scholar] [CrossRef]
  34. Greening, L.A.; Greene, D.L.; Difiglio, C. Energy efficiency and consumption—The rebound effect—A survey. Energy Policy 2000, 28, 389–401. [Google Scholar] [CrossRef]
  35. Song, C. Fuel processing for low-temperature and high-temperature fuel cells: Challenges, and opportunities for sustainable development in the 21st century. Catal. Today 2002, 77, 17–49. [Google Scholar] [CrossRef]
  36. Jones, A.P. Indoor air quality and health. Atmos. Environ. 1999, 33, 4535–4564. [Google Scholar] [CrossRef]
  37. Omer, A.M. Energy, environment and sustainable development. Renew. Sustain. Energy Rev. 2008, 12, 2265–2300. [Google Scholar] [CrossRef]
  38. Yu, W.; France, D.M.; Routbort, J.L.; Choi, S.U.S. Review and comparison of nanofluid thermal conductivity and heat transfer enhancements. Heat Transf. Eng. 2008, 29, 432–460. [Google Scholar] [CrossRef]
  39. Dietz, T.; Gardner, G.T.; Gilligan, J.; Stern, P.C.; Vandenbergh, M.P. Household actions can provide a behavioral wedge to rapidly reduce US carbon emissions. Proc. Natl. Acad. Sci. USA 2009, 106, 18452–18456. [Google Scholar] [CrossRef]
  40. Yang, Z.; Zhang, J.; Kintner-Meyer, M.C.W.; Lu, X.; Choi, D.; Lemmon, J.P.; Liu, J. Electrochemical energy storage for green grid. Chem. Rev. 2011, 111, 3577–3613. [Google Scholar] [CrossRef]
  41. Luo, X.; Wang, J.; Dooner, M.; Clarke, J. Overview of current development in electrical energy storage technologies and the application potential in power system operation. Appl. Energy 2015, 137, 511–536. [Google Scholar] [CrossRef]
  42. Palensky, P.; Dietrich, D. Demand side management: Demand response, intelligent energy systems, and smart loads. IEEE Trans. Ind. Inform. 2011, 7, 381–388. [Google Scholar] [CrossRef]
  43. Bocken, N.M.P.; Short, S.W.; Rana, P.; Evans, S. A literature and practice review to develop sustainable business model archetypes. J. Clean. Prod. 2014, 65, 42–56. [Google Scholar] [CrossRef]
  44. Raman, A.P.; Anoma, M.A.; Zhu, L.; Rephaeli, E.; Fan, S. Passive radiative cooling below ambient air temperature under direct sunlight. Nature 2014, 515, 540–544. [Google Scholar] [CrossRef]
  45. Gielen, D.; Boshell, F.; Saygin, D.; Bazilian, M.D.; Wagner, N.; Gorini, R. The role of renewable energy in the global energy transformation. Energy Strategy Rev. 2019, 24, 38–50. [Google Scholar] [CrossRef]
  46. Dincer, I.; Acar, C. Review and evaluation of hydrogen production methods for better sustainability. Int. J. Hydrog. Energy 2015, 40, 11094–11111. [Google Scholar] [CrossRef]
  47. Cabeza, L.F.; Castell, A.; Barreneche, C.; De Gracia, A.; Fernández, A.I. Materials used as PCM in thermal energy storage in buildings: A review. Renew. Sustain. Energy Rev. 2011, 15, 1675–1695. [Google Scholar] [CrossRef]
  48. Di Renzo, M.; Haas, H.; Ghrayeb, A.; Sugiura, S.; Hanzo, L. Spatial modulation for generalized MIMO: Challenges, opportunities, and implementation. Proc. IEEE 2014, 102, 56–103. [Google Scholar] [CrossRef]
  49. Wicklein, B.; Kocjan, A.; Salazar-Alvarez, G.; Carosio, F.; Camino, G.; Antonietti, M.; Bergström, L. Thermally insulating and fire-retardant lightweight anisotropic foams based on nanocellulose and graphene oxide. Nat. Nanotechnol. 2014, 10, 277–283. [Google Scholar] [CrossRef]
  50. Akadiri, P.O.; Chinyio, E.A.; Olomolaiye, P.O. Design of A Sustainable Building: A Conceptual Framework for Implementing Sustainability in the Building Sector. Buildings 2012, 2, 126–152. [Google Scholar] [CrossRef]
  51. Di Foggia, G. Energy efficiency measures in buildings for achieving sustainable development goals. Heliyon 2018, 4, e00953. [Google Scholar] [CrossRef]
  52. Hanga-Farcas, I.F.; Bungau, C.C.; Scurt, A.A.; Cristea, M.; Prada, M. The building certification system—A tool of sustainable development of university campuses. J. Appl. Eng. Sci. 2023, 13, 105–112. [Google Scholar]
  53. Law No. 101 of 1 July 2020 Amending and Supplementing Law No 372/2005 on Energy Performance of Buildings. Available online: https://legislatie.just.ro/Public/DetaliiDocumentAfis/227538 (accessed on 15 February 2023).
  54. Law No. 372 of 13 December 2005 (*Republished*) on the Energy Performance of Buildings. Available online: https://legislatie.just.ro/Public/DetaliiDocument/66970 (accessed on 16 February 2023).
  55. Evans, M.; Roshchanka, V.; Graham, P. An international survey of building energy codes and their implementation. J. Clean. Prod. 2017, 158, 382–389. [Google Scholar] [CrossRef]
  56. Qadir, S.A.; Al-Motairi, H.; Tahir, F.; Al-Fagih, L. Incentives and strategies for financing the renewable energy transition: A review. Energy Rep. 2021, 7, 3590–3606. [Google Scholar] [CrossRef]
  57. Grzegorzewska, M.; Kirschke, P. The Impact of Certification Systems for Architectural Solutions in Green Office Buildings in the Perspective of Occupant Well-Being. Buildings 2021, 11, 659. [Google Scholar] [CrossRef]
  58. Belli, L.; Cilfone, A.; Davoli, L.; Ferrari, G.; Adorni, P.; Di Nocera, F.; Dall’Olio, A.; Pellegrini, C.; Mordacci, M.; Bertolotti, E. IoT-Enabled Smart Sustainable Cities: Challenges and Approaches. Smart Cities 2020, 3, 1039–1071. [Google Scholar] [CrossRef]
  59. Bellini, P.; Nesi, P.; Pantaleo, G. IoT-Enabled Smart Cities: A Review of Concepts, Frameworks and Key Technologies. Appl. Sci. 2022, 12, 1607. [Google Scholar] [CrossRef]
  60. Sankaran, V.; Chopra, A. Creating Global Sustainable Smart Cities (A Case Study of Masdar City). J. Phys. Conf. Ser. 2020, 1706, 012141. [Google Scholar] [CrossRef]
  61. Calvillo, C.F.; Sánchez-Miralles, A.; Villar, J. Energy management and planning in smart cities. Renew. Sustain. Energy Rev. 2016, 55, 273–287. [Google Scholar] [CrossRef]
  62. Almihat, M.G.M.; Kahn, M.T.E.; Aboalez, K.; Almaktoof, A.M. Energy and Sustainable Development in Smart Cities: An Overview. Smart Cities 2022, 5, 1389–1408. [Google Scholar] [CrossRef]
  63. Kolokotsa, D.; Kampelis, N.; Mavrigiannaki, A.; Gentilozzi, M.; Paredes, F.; Montagnino, F.; Venezia, L. On the integration of the energy storage in smart grids: Technologies and applications. Energy Storage 2019, 1, e50. [Google Scholar] [CrossRef]
  64. Thynell, M.; Mohan, D.; Tiwari, G. Sustainable transport and the modernisation of urban transport in Delhi and Stockholm. Cities 2010, 27, 421–429. [Google Scholar] [CrossRef]
  65. Cavada, M.; Tight, M.R.; Rogers, C.D.F. A smart city case study of Singapore—Is Singapore truly smart? In Smart City Emergence. Cases from Around the World; Anthopoulos, L., Ed.; Elsevier: Amsterdam, The Netherlands, 2019; pp. 295–314. ISBN 978-0-12-816169-2. [Google Scholar]
  66. Bakıcı, T.; Almirall, E.; Wareham, J. A Smart City Initiative: The Case of Barcelona. J. Knowl. Econ. 2013, 4, 135–148. [Google Scholar] [CrossRef]
Figure 1. Main factors describing the energy consumption of a building and the energy performance indicators. A–G energy rating scale.
Sustainability 15 08772 g001
Figure 2. Flow diagram showing the search and sorting algorithm. building*, symbol used to find also the results containing the term buildings.
Sustainability 15 08772 g002
Figure 3. 3-D stacked bar chart of the top 10 WoS categories.
Sustainability 15 08772 g003
Figure 4. The most prolific journals (at least 18 published documents) among journals in the field of energy efficiency (period 1978–2010).
Sustainability 15 08772 g004
Figure 5. The most prolific research areas in the field of energy efficiency (period 1978–2010).
Sustainability 15 08772 g005
Figure 6. Network map of country co-authorship between 1978 and 2010 (VOSviewer).
Sustainability 15 08772 g006
Figure 7. Bubble map of the average publication year 1978–2010.
Sustainability 15 08772 g007
Figure 8. Source citation network map between 1978 and 2010 (VOSviewer).
Sustainability 15 08772 g008
Figure 9. Bubble map of high-frequency terms (39 terms) (1978–2010).
Sustainability 15 08772 g009
Figure 11. The most prolific journals (at least 100 published documents) in journals in the field of energy efficiency (period 2011–2023).
Sustainability 15 08772 g011
Figure 12. The most prolific research areas in the field of energy efficiency (period 2011–2023).
Sustainability 15 08772 g012
Figure 13. Network map of country co-authorship between 2011 and 2023 (VOSviewer).
Sustainability 15 08772 g013
Figure 14. Bubble map of the average publication year for the period 2011–2023.
Sustainability 15 08772 g014
Figure 15. Source citation network map between 2011 and 2023 (VOSviewer).
Sustainability 15 08772 g015
Figure 16. Bubble map of 39 high-frequency terms (1978–2010).
Sustainability 15 08772 g016
Figure 18. Evolution over time of the number of articles published by the most prolific countries.
Sustainability 15 08772 g018
Table 1. Top 10 prolific countries in the field of energy efficiency (period 1978–2010).
CountryPapersCitationsAverage Citation/
Manuscript
TLS
United States51834,42266.45147
China22311,45751.3866
England21316,14275.7883
Germany103716069.5177
Sweden93641668.9941
Canada93925999.5632
The Netherlands90450650.0747
Italy69422761.2641
France66466970.7451
TLS, total link strength value attributed by VOSviewer.
Table 2. Top 10 prolific journals in the field of energy efficiency (period 1978–2010).
SourceNo.CitationsAverage Citation/
Paper
Impact
Factor/2021
IF without
Self-Citations
Publisher
Energy Policy41525,14660.597.5767.014Elsevier
Energy and Buildings17914,25979.667.2016.147Elsevier
Renewable
Energy
122185415.208.6347.711Pergamon-Elsevier
Energy103461944.848.8577.271Pergamon-Elsevier
Building and
Environment
66343252.007.0935.741Pergamon-Elsevier
Energy
Conversion and
Management
66339551.4411.5339.932Pergamon-Elsevier
Applied
Energy
55282251.3111.44610.305Elsevier
Energy
Efficiency
46209045.433.1342.890Springer
Renewable and Sustainable Energy
Reviews
426482154.3316.79915.532Pergamon-Elsevier
Building
Research and Information
41219560.594.7994.483Routledge Journals, Taylor and Francis Ltd.
Table 3. The most influential manuscripts in the field of energy efficiency (period 1978–2010).
First Author (Year)TitleJournalImpact FactorCitationsRef.
Perez-Lombard
(2008)
A review on buildings energy consumption informationEnergy and Buildings7.2013701[30]
Ibrahim, H.
(2008)
Energy storage systems—Characteristics and comparisonsRenewable and
Sustainable Energy Reviews
16.7991325[31]
Granqvist, Claes G.
(2007)
Transparent conductors as solar energy materials: A panoramic reviewSolar Energy Materials and Solar Cells7.3051231[32]
Swan, LG
(2009)
Modeling of end-use energy consumption in the residential sector: A review of modeling techniquesRenewable and
Sustainable Energy Reviews
16.7991133[33]
Greening, LA
(2000)
Energy efficiency and consumption—the rebound effect—a surveyEnergy Policy7.5761125[34]
Song, CS
(2002)
Fuel processing for low-temperature and high-temperature fuel cells—Challenges, and opportunities for sustainable development in the 21st centuryCatalysis Today6.562950[35]
Jones, AP
(1999)
Indoor air quality and healthAtmospheric
Environment
5.755935[36]
Omer, AM
(2008)
Energy, environment and sustainable developmentRenewable and
Sustainable Energy Reviews
16.799922[37]
Yu, Wenhua
(2008)
Review and comparison of nanofluid thermal conductivity and heat transfer enhancementsHeat Transfer
Engineering
2.431858[38]
Dietz, THousehold actions can provide a behavioral wedge to rapidly reduce US carbon emissionsProceedings of the National Academy of Sciences of The United States of America12.779843[39]
Table 4. The most active organizations in the field of energy efficiency (period 1978–2010).
OrganizationPapers%
United States Department of Energy (DOE)2028.59
Lawrence Berkeley National Laboratory1375.82
University of California System1325.61
University of California Berkeley1054.46
Hong Kong Polytechnic University371.57
Tsinghua University311.32
Swiss Federal Institutes of Technology Domain291.23
Utrecht University271.15
Lund University261.10
Oak Ridge National Laboratory261.10
Chongqing University220.93
City University of Hong Kong210.89
Fraunhofer Gesellschaft210.89
University of Cambridge200.85
Table 5. Top 10 prolific countries in the field of energy efficiency (period 2011–2023).
CountryPapersCitationsAverage Citation/ManuscriptTLS
China6126152,48324.893343
United States4792162,76233.973125
England195660,58330.972271
Italy186750,17526.871409
Spain152132,19621.17999
Germany117136,55531.221461
Australia110029,85827.141183
India99516,80516.89711
South Korea86621,40824.72632
Canada82327,94233.95943
TLS, total link strength value attributed by VOSviewer.
Table 6. Top 10 prolific journals in the field of energy efficiency (period 2011–2023).
SourceNo.CitationsAverage
Citation/Paper
IF/2021IF without
Self-Citations
Publisher
Energy and Buildings187757,76330.777.2016.147Elsevier
Energies135812,1768.973.2522.466MDPI
Sustainability98383658.513.8893.008MDPI
Journal of Cleaner
Production
96234,28635.6411.0729.707Elsevier Sci Ltd.
Energy Policy95033,10134.847.5767.014Elsevier
Applied Energy87539,77045.4511.44610.305Elsevier
Energy80824,95930.898.8577.271Pergamon-Elsevier
Renewable and Sustainable
Energy Reviews
67639,63558.6316.79915.532Pergamon-Elsevier
Energy
Efficiency
606706211.653.1342.89Springer
Building and Environment48414,82830.647.0935.741Pergamon-Elsevier
Table 7. The most influential manuscripts in the field of energy efficiency in 2011–2023.
First
Author (Year)
TitleJournalIFCitationsRef.
Yang, ZG
(2011)
Electrochemical Energy Storage for Green GridChemical Reviews72.0873600[40]
Luo, X
(2015)
Overview of current development in electrical energy storage technologies and the application potential in power system operationApplied Energy11.4462032[41]
Palensky, P
(2011)
Demand Side Management: Demand Response, Intelligent Energy Systems, and Smart LoadsIEEE Transactions on
Industrial
Informatics
11.6481782[42]
Bocken, NMP
(2014)
A literature and practice review to develop sustainable business model archetypesJournal of Cleaner Production11.0721465[43]
Raman, AP
(2014)
Passive radiative cooling below ambient air temperature under direct sunlightNature69.5041334[44]
Gielen, D
(2019)
The role of renewable energy in the global energy transformationEnergy Strategy Reviews10.011224[45]
Dincer, I
(2015)
Review and evaluation of hydrogen production methods for better sustainabilityInternational Journal of Hydrogen Energy7.1391173[46]
Cabeza, LF
(2011)
Materials used as PCM in thermal energy storage in buildings: A reviewRenewable and Sustainable Energy Reviews16.7991084[47]
Di Renzo, M
(2014)
Spatial Modulation for Generalized MIMO: Challenges, Opportunities, and ImplementationProceedings of the IEEE14.911030[48]
Wicklein, B
(2015)
Thermally insulating and fire-retardant lightweight anisotropic foams based on nanocellulose and graphene oxideNature Nanotechnology40.523865[49]
Table 8. The most active organizations in the field of energy efficiency (period 2011–2023).
OrganizationPapers%
United States Department of Energy (DOE)13935.32
Lawrence Berkeley National Laboratory6062.31
University of California System5762.20
Tsinghua University4501.72
Chinese Academy of Sciences4111.57
National Renewable Energy Laboratory USA3611.38
University of California Berkeley3601.37
University of London2901.11
Swiss Federal Institutes of Technology Domain2641.01
Udice French Research Universities2570.98
Polytechnic University of Milan2540.97
Hunan University2530.97
Centre National de la Recherche Scientifique (CNRS)2510.96
Hong Kong Polytechnic University2450.94
Chongqing University2220.85
University College London2210.84
Aalto University2060.79
National University of Singapore2060.79
Norwegian University of Science Technology (NTNU)2020.77
City University of Hong Kong2000.76
Tianjin University2000.76
Disclaimer/Publisher’s Note: The statements, opinions and data contained in all publications are solely those of the individual author(s) and contributor(s) and not of MDPI and/or the editor(s). MDPI and/or the editor(s) disclaim responsibility for any injury to people or property resulting from any ideas, methods, instructions or products referred to in the content.

