Article

Spatio-Temporal Assessment of Manganese Contamination in Relation to River Morphology: A Study of the Boac and Mogpog Rivers in Marinduque, Philippines

by
Cris Edward F. Monjardin
1,2,3,
Christopher Power
2 and
Delia B. Senoro
1,3,*
1
School of Civil, Environmental and Geological Engineering, Mapua University, 658 Muralla St., Intramuros, Manila 1002, Philippines
2
Department of Civil and Environmental Engineering, Western University, 1151 Richmond St., London, ON N6A 3K7, Canada
3
Resiliency and Sustainable Development Center, Yuchengco Innovation Center, Mapua University, 658 Muralla St., Intramuros, Manila 1002, Philippines
*
Author to whom correspondence should be addressed.
Sustainability 2023, 15(10), 8276; https://doi.org/10.3390/su15108276
Submission received: 20 April 2023 / Revised: 10 May 2023 / Accepted: 15 May 2023 / Published: 19 May 2023

Abstract

:
This study investigates the contribution of river morphology towards the occurrence of manganese (Mn) in both sediment and surface water (SW), considering the temporal climatic and spatial conditions. The Boac and Mogpog rivers on the island province of Marinduque, Philippines, were examined in this study. These rivers are downstream of the two abandoned open mine pits at San Antonio and Tapian, where mining disasters occurred in 1993 and 1996, respectively. Field sampling programs were conducted in 2019, 2021 and 2022 to measure the Mn concentrations in sediment and SW, and the physicochemical parameters in SW during the same sampling event. Geographic Information System (GIS) tools were employed to characterize the morphology of each river, specifically river slope, river bends, sinuosity, and channel width and length. The Boac and Mogpog rivers were divided into 22 and 15 river segments, respectively, to account for spatial heterogeneity of all parameters. Correlation (r) analysis on the average Mn concentration and river morphology within each segment was performed and indicated that river bends (Boac r = 0.421, Mogpog r = 0.356) and sinuosity (Boac r = 0.403, Mogpog r = 0.352) had the highest correlation with Mn concentrations in sediment. While river slope (Boac r = 0.716, Mogpog r = 0.282) and sinuosity (Boac r = 0.505, Mogpog r = 0.257) were the highest for Mn in SW. This confirmed that the planform of the river affected the accumulation of Mn due to its effect on sediment deposition along the river and its potential to adsorb and/or desorb metals. Furthermore, the pH of SW also directly correlated with sediment Mn (r = 0.293), and inversely correlated with SW Mn (r = −0.465), which was expected as acidic water promotes the release of metals from sediments to SW. The results from this study will aid local government, environmental engineers and managers in their mitigation program through identification of the areas and segments in the river that contain the highest and the least contamination. This is to optimize financial and human resources during river system remediation and monitoring. Data and information extracted from this study are useful in other areas of similar condition.

1. Introduction

Acid mine drainage (AMD) is a common form of environmental pollution in areas where mining activities has occurred. The interaction of water and oxygen with rocks containing sulfur-bearing minerals results in sulfuric acid, which can then leach heavy metals such as manganese (Mn), iron (Fe), and aluminum (Al), cadmium (Cd), Zinc (Zn) and copper (Cu) from rocks it comes in contact with. When released into the environment, this highly toxic, acidic leachate rich in heavy metals can mix with surface water (SW), soil and groundwater and have severely harmful effects on humans, animals and plants. Among the various heavy metals that are being released to the environment by the AMD, Mn, by which the central nervous system as its toxicity target organ, has not been given attention; hence, the focus of this paper.
Marinduque is an island province in the Philippines that is rich in mineral resources has attracted many mining companies. For example, a copper mining operations were carried out in Marinduque since 1969 [1]. Unfortunately, two of the worst mining and environmental disasters in Philippine history (and worldwide) occurred in 1993 and 1996 at the San Antonio and Tapian mine pits, respectively [1]. On 6 December 1993, the Maguilaguila siltation dam collapsed and released toxic mine tailings into Mogpog river [2], flooding the barangays along the river, including the town of Mogpog. On 24 March 1996, a drainage tunnel in the Taipan pit burst, spilling 1.6 million cubic meters of tailings deposits into Boac river [2] that flooded barangays and killed livestock, aquatic life, and crops.
These mine tailings deposits in Mogpog and Boac river have remained a long-term source of acid and elevated concentrations of metals. Significant amounts of soluble salts have built up due to oxidation of sulfides in the tailings [3]. These salts retain acids and metals in a solid state that is easily soluble until the next rainfall. The cycle of salt formation and dissolution can be repeated each dry and wet season [4]. As a result, severe environmental contamination remains within Mogpog and Boac rivers and neighboring municipalities [5], with studies between 1998 [3] and 2019 [4] indicating that metal concentrations continued to accumulate faster and worsen over time. Elevated manganese concentrations were even found in crustaceans (603.5 mg/kg), tilapia (121.1 mg/kg) [6] string beans (26.235 mg/kg), sweet potato (5.511 mg/kg), bitter melon (24.4 mg/kg), eggplant (3.248 mg/kg) [7], vegetables (27.35 mg/kg), turmeric root crops (634.43 mg/kg) and rice (11.955 mg/kg) [8] that people consumed. Accumulation of metal in the downstream area of rivers are perceived to be on going and might continue to worsen in the next number of years.
Mn is a potentially toxic metal depending on the route and level of exposure and it had one of the highest concentration increases in sediments, from 1060 ppm in 1998, to 68,169 ppm in 2019. According to Rovetta et al. [9], USEPA [10], and WHO [11], too much uptake of Mn by humans can severely affect the central nervous system, and the liver, immune, reproductive, and cardiovascular systems. Sediments and SW contaminated by Mn could form human exposure pathways via dermal adsorption and/or accidental ingestion [12]. Communities in the vicinity of Mogpog and Boac rivers may not be aware of these severe health risks, with adults and children known to still bathe in the rivers [13]. A study conducted by the municipal health officer of Mogpog found evidence of metal toxicity in its residents particularly lead, arsenic, mercury, cadmium, copper and chromium [14].
While it is known that the mining disasters and abandoned mine pits caused the elevation of Mn within the Mogpog and Boac rivers and municipalities [15,16,17,18], it is not yet known how fast it is being transported from the source to downstream, and/or how the morphology of the rivers affect its accumulation. Mn transport along the river can occur through sediment [19,20,21,22] and SW [23,24,25], which is strongly affected by changes in cross-section and planform that can lead to specific patterns of Mn accumulation [26,27], particularly if the point source is at the upstream of the river. Huang et al. [26] demonstrated how river sinuosity affects contaminant distribution, with lighter contaminant concentrates more on the inner bend apex region of the river with higher sinuosity, while heavier pollutant such as metals accumulating at a depth close to the riverbed but still on the inner side bend apex region. Using a test model, Xiao et al. [27] showed that the concave bank of the river bend section accumulates more contaminant than the convex bank. They also showed that the concave bank can be an efficient contaminant treatment zone for future remediation plans in rivers.
Adsorption-desorption also plays a very important role in the transport of metals in rivers, with metals being adsorbed and desorbed in the sediments and water [28,29]. Due to their small particle size and higher surface area, sediments can adsorb higher concentrations of heavy metals [30], meaning metals elevation can be correlated to the amount of sediment present in the river. Therefore, if river morphology causes higher amounts of sediment in certain zones, then higher accumulation of metals can also occur [31]. Climate change can also play a role in metal accumulation in rivers, with extreme rainfall events and higher flooding resulting in higher flow rates, more overland flow and runoff, and morphological changes in the river [17]. Despite the relationships identified between sediments and metal contamination [22], and sediments and river morphology [32], a more extensive study is needed to assess the correlation between Mn accumulation and river morphology.
The objective of this study was to assess the contribution of river morphology to the spatio-temporal variability of Mn contamination. This study involves a multi-year field investigation of Mogpog and Boac rivers on Marinduque island in the Philippines. The rivers are downstream of two abandoned open mine pits and are historically known receptors of mine tailings that have accidently discharged from the open pits. Based on field sampling programs performed in 2019, 2021 and 2022, this study aims to (i) analyze Mn concentrations in the water and sediment along the rivers, (ii) identify river morphology parameters that affect the accumulation of Mn concentrations, and (iii) calculate contamination factors (CF) to determine the temporal changes in the degree of river contamination.

2. Materials and Methods

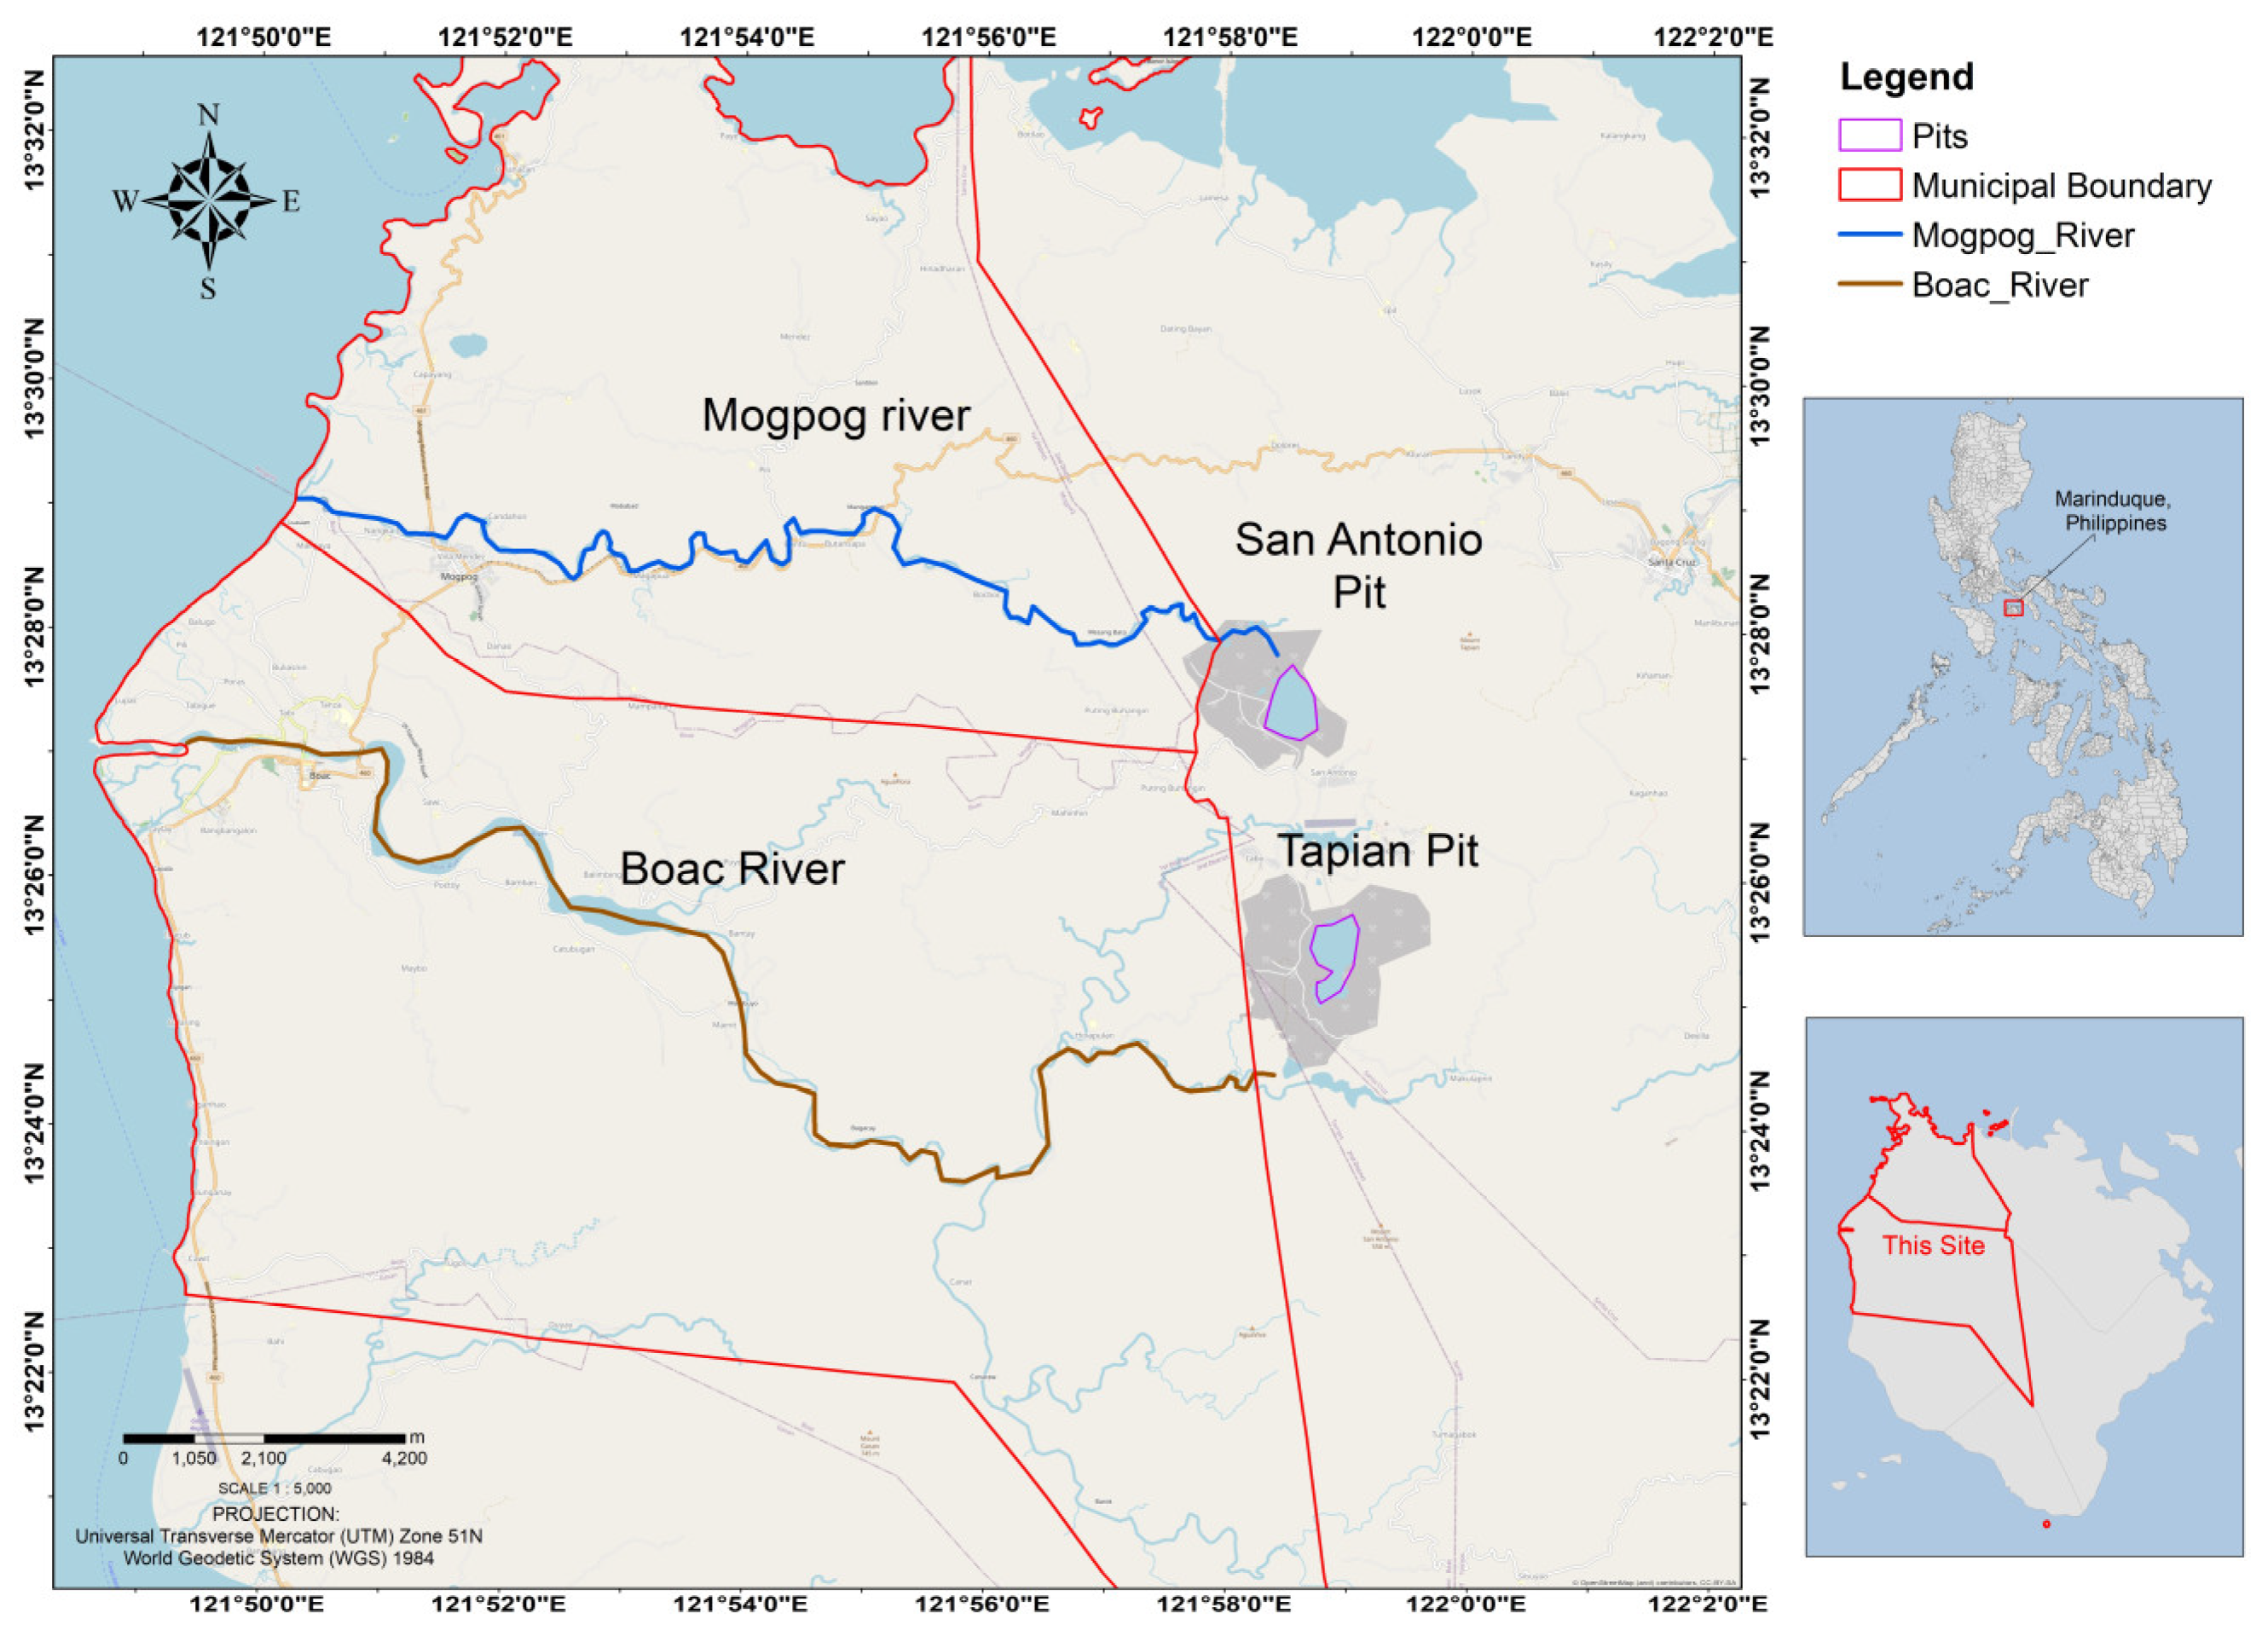
2.1. Study Site Description

Marinduque is an island rich in minerals in the Philippines (see Figure 1) that attracted many mining companies. A mining company operated in the island from 1975 until the two disaster happened. An earth dam was constructed at the San Antonio pit to prevent silt from being discharged to the downstream Mogpog river. However, the dam collapsed in 1993 and significant contaminated the 23 km long Mogpog river. Highly toxic sediments flowed downstream, and not only severely impacted water quality, but also towns, rice fields, vegetation, livestock and aquatic life. The 1996 disaster at the Tapian pit was even worse [33]. It involved the collapsed of Tapian pit, releasing approximately 180,000 to 260,000 m3 of mine waste tailings into the 27 km long Boac river. Following these disasters, mining operations were ceased in 1997 and the open mine pits were abandoned. The only controlling parameters of the water flow were the landcover, topography, and soil types, as well as sub-surface media type for water overflow and subsurface flow, respectively.
In addition to being released during the disasters, toxic mine tailings continue to periodically overflow from the open pits. This has led to the elevation of heavy metal concentrations in the downstream Mogpog and Boac rivers [17]. The surrounding Mogpog and Boac municipalities, which have populations of 34,516 and 57,283, respectively [34], are now categorized as having high potential ecological risk [7]. A comprehensive investigation of metal accumulation in the rivers over time will be extremely beneficial to optimize proposed mitigation strategies. Of the various toxic metals, Mn had the highest increase in concentration between 1998 and 2019, increasing from 1060 ppm to 68,169 ppm [3,4], and is the key contaminant investigated in this study.

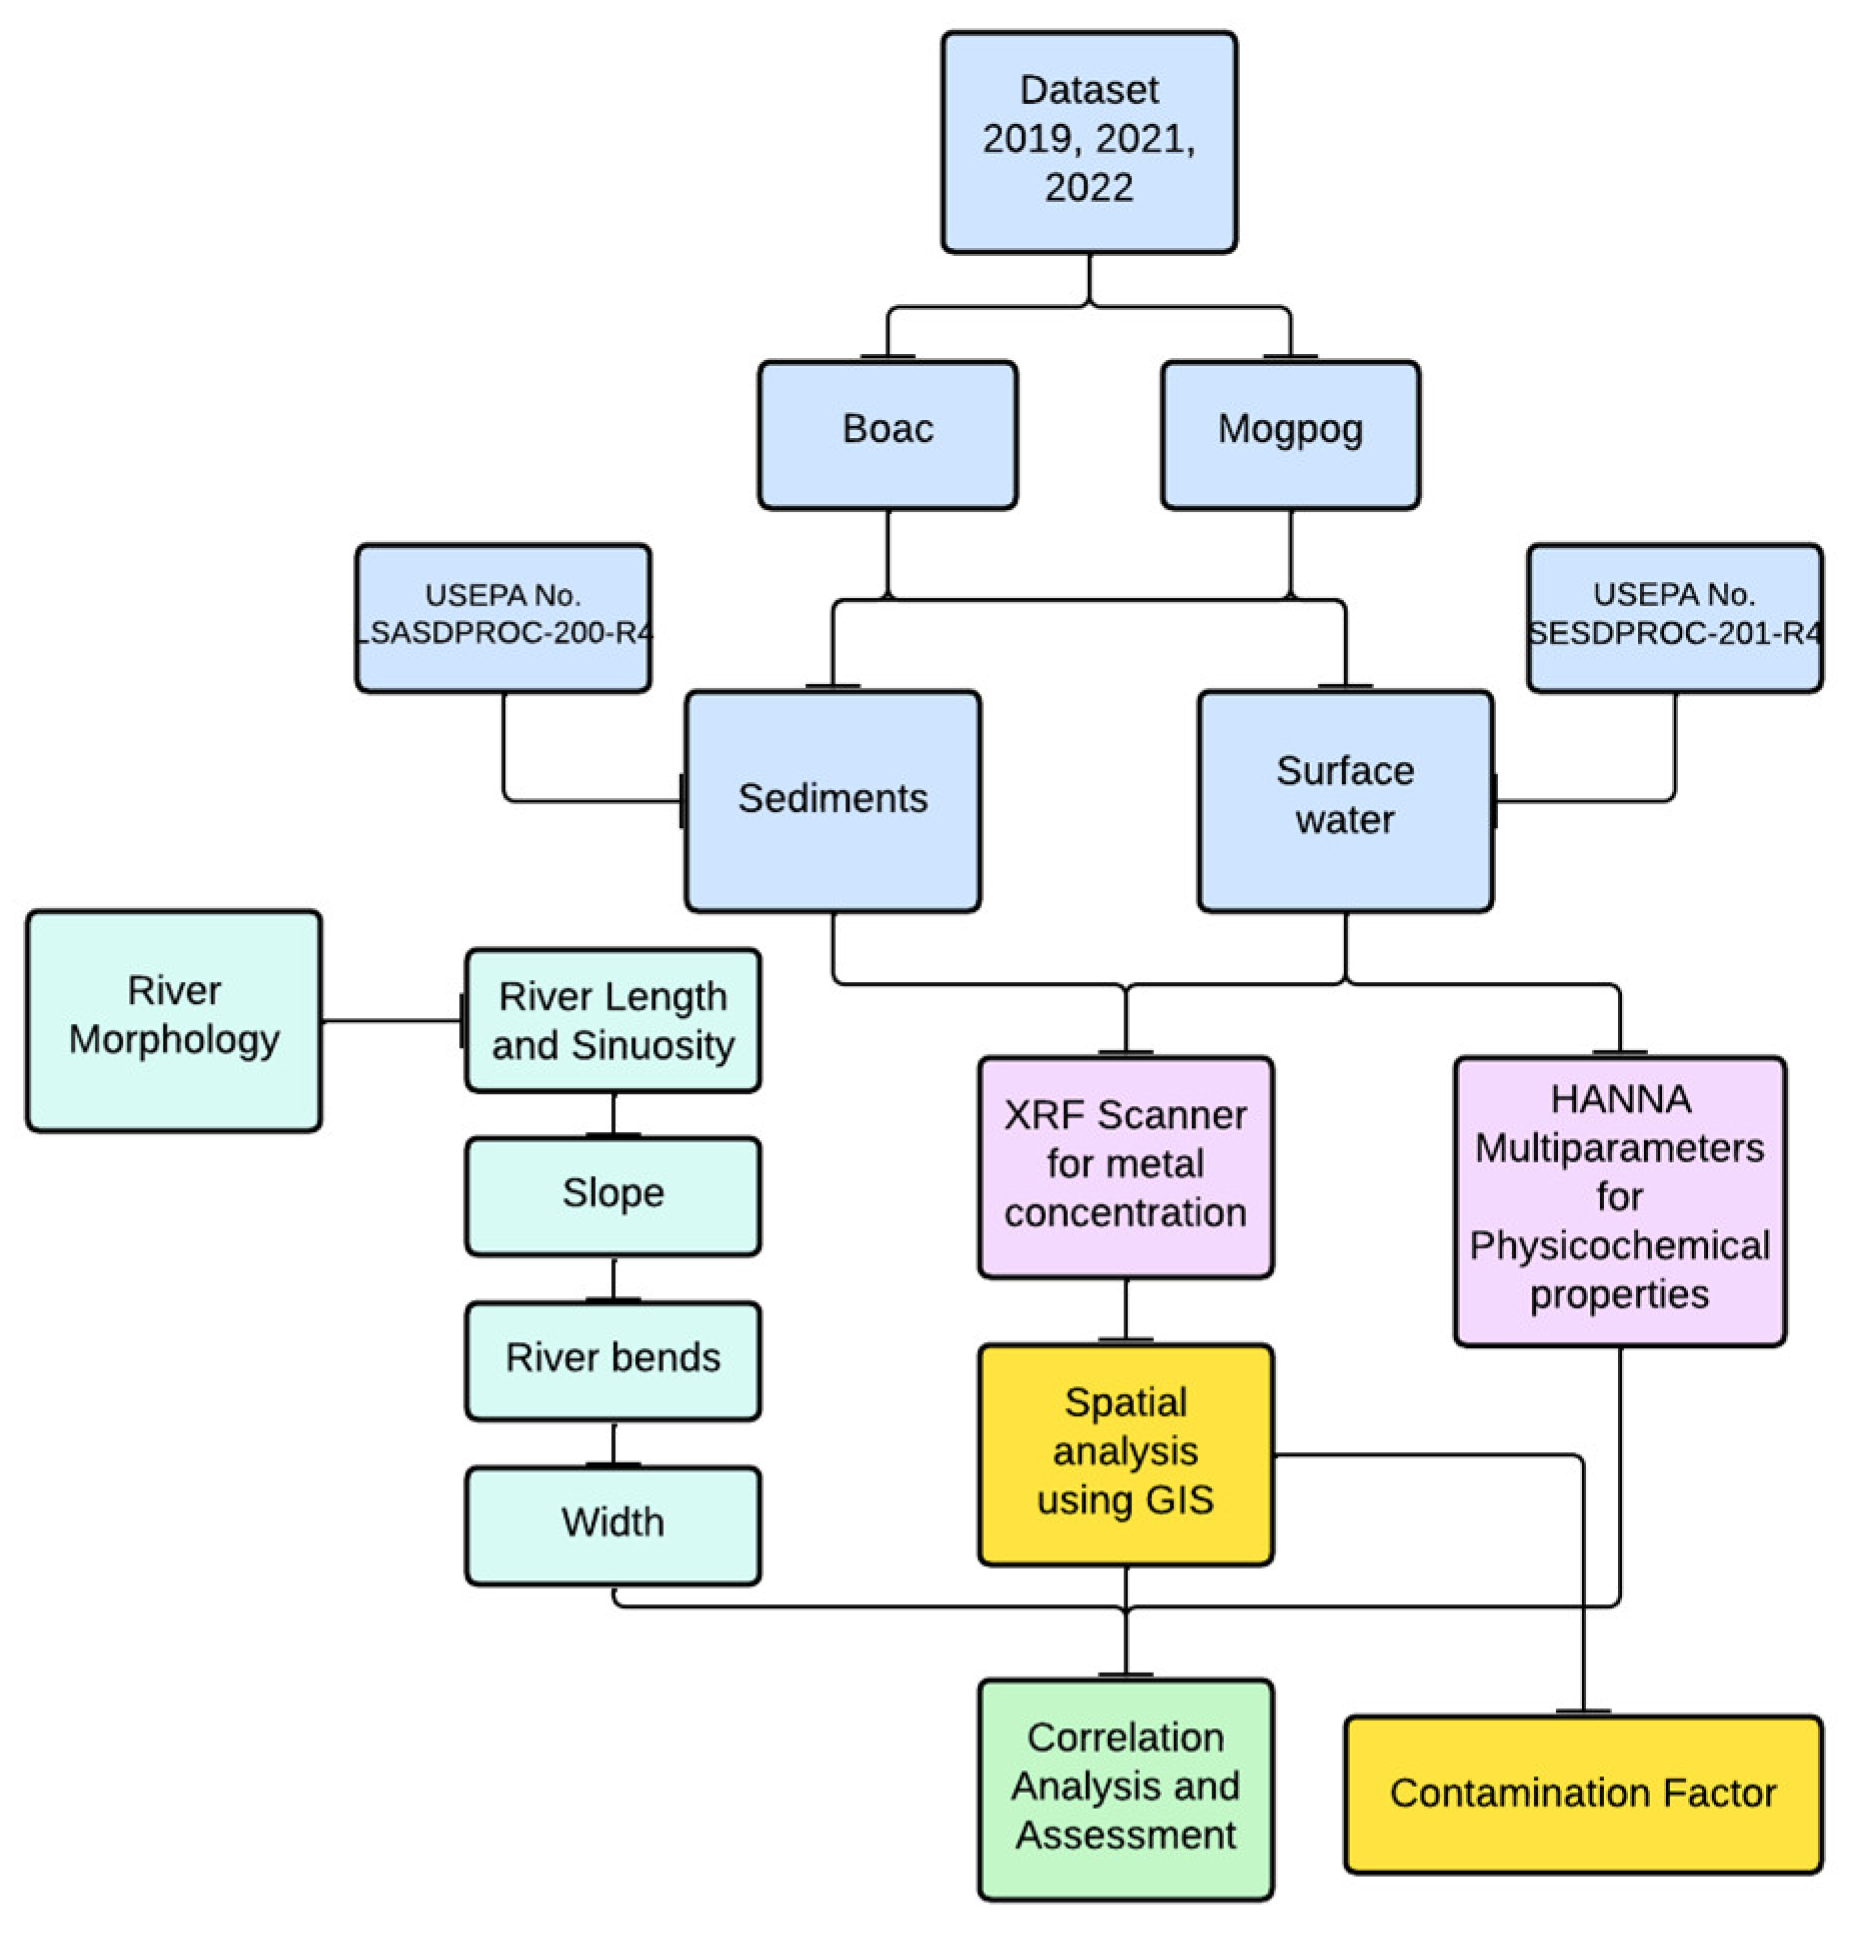
2.2. Spatio-Temporal Assessment Framework

A framework was developed to assess the spatio-temporal variation of Mn in Mogpog and Boac river, and how it is influenced by river morphology, as shown in Figure 2. SW and sediment samples were collected along the rivers and then analyzed for Mn concentration using an XRF scanner, while a multi-parameter meter was used to measure the physicochemical properties of the SW. Results from the sparse sampling locations were interpolated with a geographic information system (GIS) to obtain continuous data along both rivers. River morphology parameters were also extracted using GIS. The morphological parameters, sediment and SW metal concentrations, and SW physicochemical properties were incorporated into correlation analysis to determine the degree of correlation between each other, and if river morphology affects the accumulation of Mn in the two rivers. The CF was also calculated to determine the degree of contamination along the rivers.

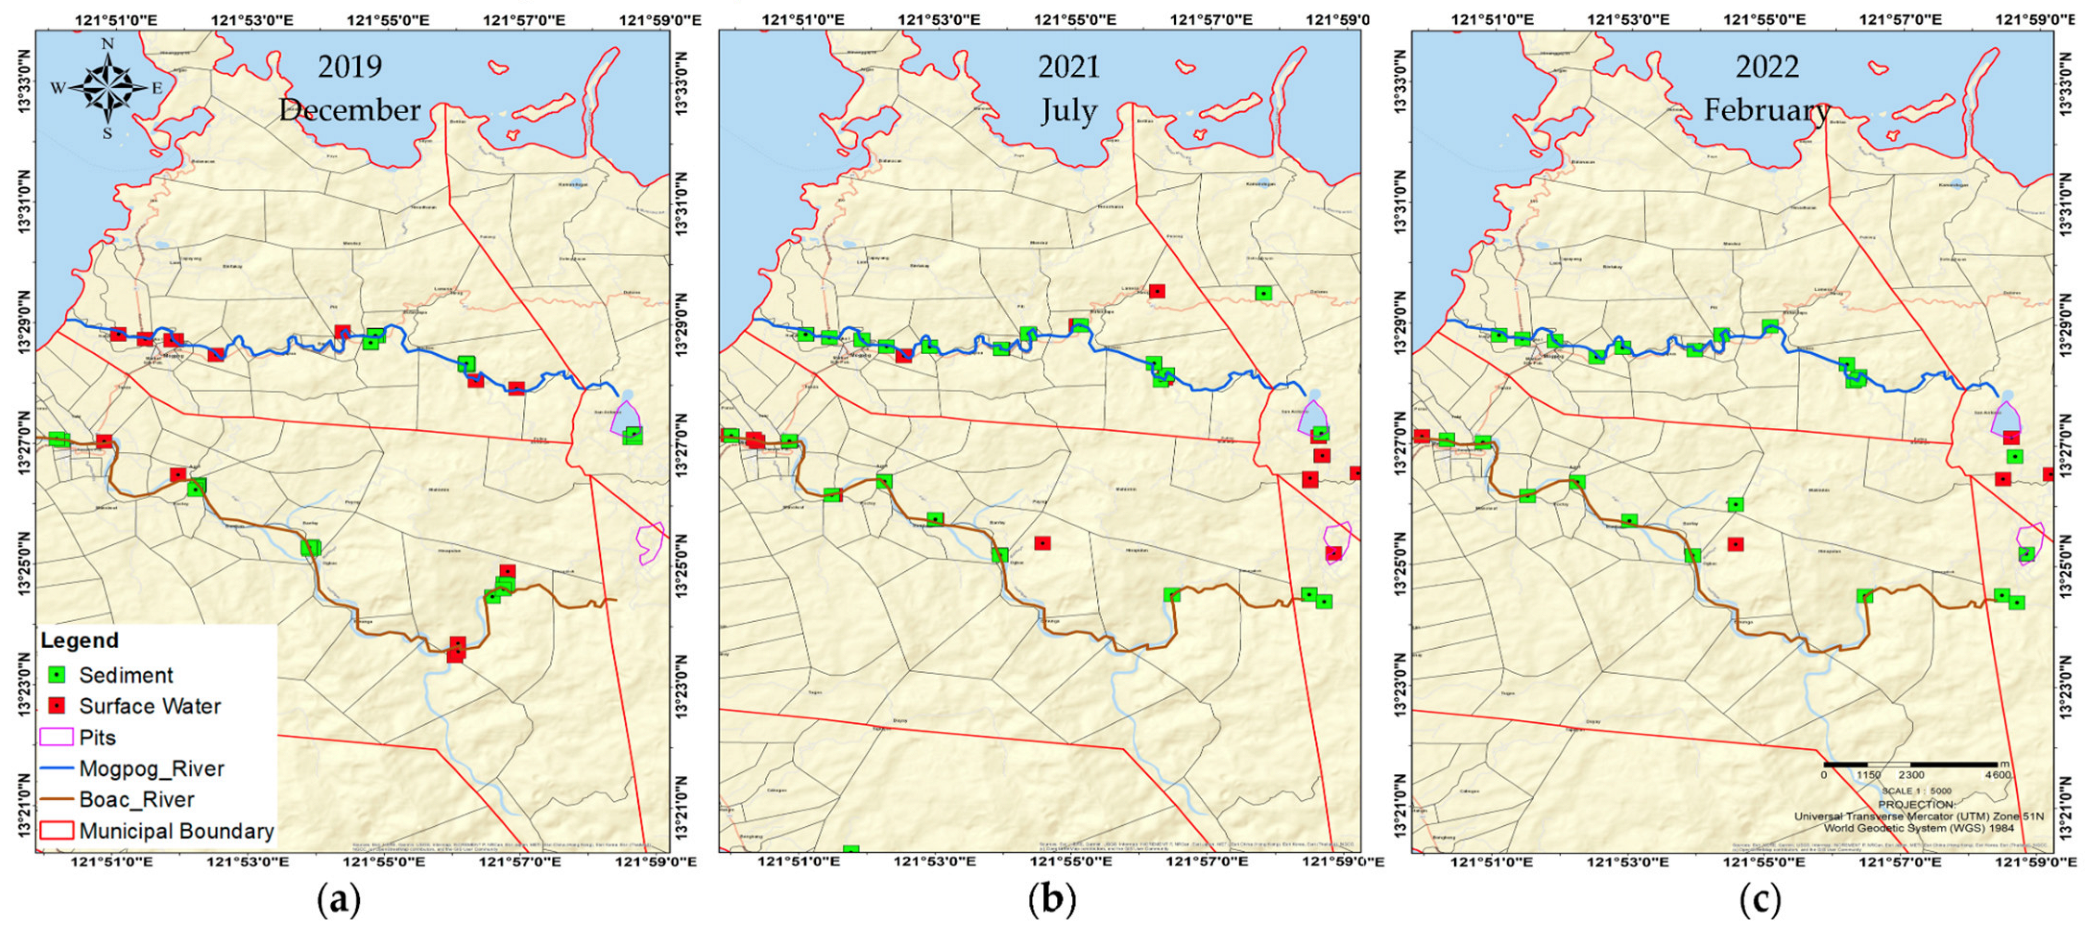
2.2.1. Field Sampling

Field sampling programs were conducted in December 2019, July 2021, and February 2022. These sampling times were selected as they were considered wet months in Marinduque, where frequent sheet flow is expected due to the open mine pits [17]. As indicated in Figure 3, a total of 80 sediment samples and 74 SW samples were collected at various locations along the flow path of Mogpog and Boac rivers. Table 1 shows the distribution of samples collected over all three years. The sediment sampling followed the procedure by USEPA LSASDPROC-200-R4 [35], while the SW samples were collected following the guidelines by USEPA LSASDPROC-201-R5 [36].

2.2.2. Surface Water and Sediment Analysis

The Mn concentrations in collected SW samples were detected by the Optima 8000 Inductively Coupled Plasma Optical Emission Spectrometry (ICP-OES) (PerkinElmer, Waltham, MA, USA) following the Standard Methods for the Examination of Water and Wastewater, APHA 22nd edition, 2012. The detection limit of the ICP-OES for Mn is 0.5 ppm (mg/L). The Mn concentrations in sediment was measured using the Vanta X-ray fluorescence (XRF) analyzer (Olympus, Center Valley, PA, USA), which is a portable handheld device used to measure elements in various media [37,38]. The detection limit of the Vanta XRF analyzer for Mn is 5 ppm (mg/L). Additional samples of the sediment were collected and were analyzed for Mn by the ICP-OES following the acid digestion method in USEPA Method 3050B. With the aid of the manufacturer, the XRF was calibrated with the ICP-OES results (R2 = 0.99) and using the Olympus Vanta blank in zipper plastic #2. Furthermore, previous published studies have demonstrated the reliability and comparability of the XRF device to traditional approaches like the ICP-OES [4,6,7,8,17,18,39,40,41,42,43,44,45,46]. The motivation for using the XRF stems from its portability for environmental monitoring at remote sites where laboratories are not readily available [47,48].
The HI9811-5 is a compact, rugged, portable multi-parameter meter (HANNA, Winsorquit, RI, USA) that was used to measure the physicochemical characteristics of the SW. These physicochemical parameters of SW were determined during the same SW sampling event. The meter, which included the HI1285-5 probe and accompanying calibration and cleaning solutions (e.g., HI70007, HI70031, HI70032, HI700661), was used to measure pH, temperature (T), electric conductivity (EC) and total dissolved solids (TDS).

2.2.3. GIS Spatial Analysis

Spatial analysis with GIS is widely used as it can greatly enhance sparsely distributed data and generate continuous spatial information for improved site analysis. It is very useful for environmental studies where sampling may be limited to sparse locations and/or conducted in heterogeneous environments with high uncertainty between locations [49,50,51,52,53,54].
In this study, the inverse distance weighting (IDW) method was employed. As shown in Equations (1) and (2), IDW assumes that properties of unsampled locations are the weighted average of known data points in the area, and the weights are considered to be inversely correlated to the distances between predicted points and sampled points. IDW was used to interpolate Mn concentrations in unsampled (or inaccessible) areas of the river, thereby generating full continuous Mn data along the full stretch of both Boac and Mogpog rivers.
C p = a i = 1 N o W i C i
W i = 1 d i a i = 1 N o 1 d i
where Cp denotes unknown concentration, Ci is known concentration, N is the number of measured samples, Wi is the weighting of individual stations, and lastly di is the distance from every station to the unknown point.

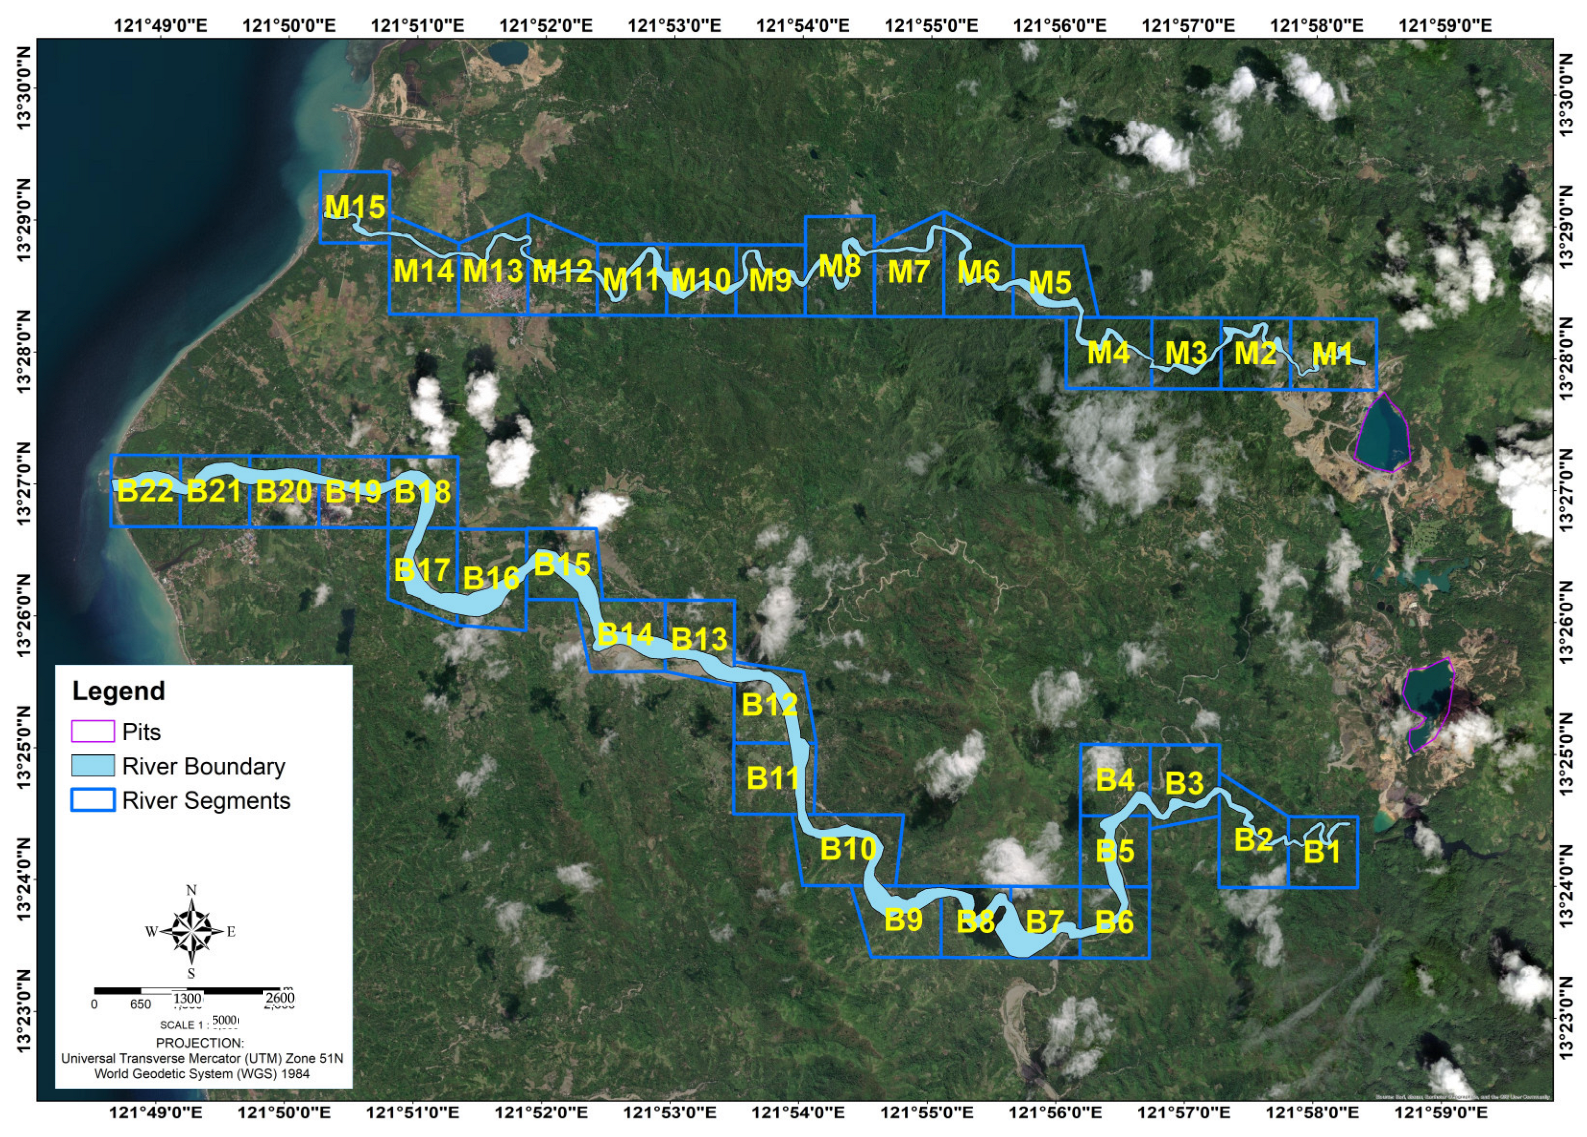
2.2.4. River Segmentation

The Grid Index is a geospatial tool in GIS that was used to divide Mogpog and Boac rivers into segments with 1 km horizontal distances, starting from the pit and moving downstream. Mogpog river consisted of 15 segments, while Boac river had 22 segments, as indicated in Figure 4. The Zonal Statistics tool was then used on sampled data to get the average value of each parameter enclosed within each segment.
Due to the number of factors that can affect contaminant and river properties that often differ along the river stretch, providing data for each individual river segment ensures more effective environmental quality assessments [55].

2.2.5. Assessment of River Morphology

River morphology provides information about changes in river planform due to processes like sedimentation and erosion. Since sediments greatly affect metal transport in rivers by adsorption [22], it is really important to consider how river morphology is attributed to the increase of metal accumulation in rivers. From the literature, the river morphology factors that most strongly affect metal transport in rivers were identified as follows: slope [56], river bends [57], channel width, length and sinuosity [26,27]. River slope has a direct correlation with river velocity, thereby affecting the flow of water and sediment transport, while river bends represents the meandering of the river channel that also affects the deposition of sediments. Channel width and length pertains to the actual size of the river which can play an important role in the hydrodynamic processes in the river, and therefore affect the dispersion of metals [58].
River morphology was assessed with GIS to extract key properties within segments along each river. The slope, which is the change in elevation with respect to distance, was calculated in GIS using the available digital elevation model (DEM), specifically Interferometric Synthetic Aperture Radar (IfSAR) with a pixel size of 5 m × 5 m. River bends were determined by counting the number of bends in each river segment, while channel width and length were measured with the spatial measurement tool in GIS. Sinuosity was then computed using the following Equation (3) [27]:
S = L T L 0
where LT is the total length of the river, and L0 is the straight-line distance from the upstream end point to the downstream end point. A higher sinuosity value represents a change in planform [59], which basically indicates meandering channel patterns along the stretch of the river.
Transport assessment was also carried out using MIKE Eco Lab (DHI Water and Environment, Ltd., Auckland, New Zealand) to simulate how metal concentration in surface water and sediments accumulating and dispersing along the river stretch.

2.2.6. Correlation Analysis

Correlation (r) analysis was performed to identify and/or understand any relationship between parameters [60]. Equation (4) presents the equation used to compute the correlation, r:
r = i = 1 N y 1 y 1 ¯ y 2 y 2 ¯ i = 1 N ( y 1 y 1 ¯ ) 2 ( y 2 y 2 ¯ ) 2
where N is the total sets of data, y 1 is the dataset for one parameter, y 2 is the dataset for another parameter, and y 1 ¯ and y 2 ¯ are the respective computed mean values.
For this study, the following parameters were included in the correlation analysis to identify how river morphology is affecting metal accumulation along Mogpog and Boac rivers: (i) Mn concentration in sediment, (ii) Mn concentration in SW, (iii) river bends, (iv) channel width, (v) river slope, (vi) river length, (vii) sinuosity, and (viii) EC, TDS, pH and temperature of SW. Correlation coefficients range from −1 to +1, with negative values indicating inverse correlation and positive values indicating direct correlation. In terms of the degree of the relationship, values of 0.90–1.00 indicates a very strong correlation; 0.70–0.89 is a strong correlation; 0.40–0.69 is a moderate correlation; 0.10–0.39 is a weak correlation; and 0.00–0.10 indicates no correlation [61].

2.2.7. Contamination Factor

The degree of contamination was determined from the CF which was computed using Equation (5):
C F = M C B C
where Mc is the measured concentration, and Bc is the background concentration (i.e., concentration prior to anthropogenic activities) [62]. Equation (4) is very simple yet effective to identify how contamination progresses relative to natural conditions [63]. The CF value corresponds to a certain level of contamination, specifically: low (CF < 1); moderate (1 ≤ CF < 3); high (3 ≤ CF < 6); very high (CF > 6). It has been used in various studies to assess the degree of contamination for specific metals in rivers [64], soils [65], sediments [66], and abandoned mines [67].

3. Results

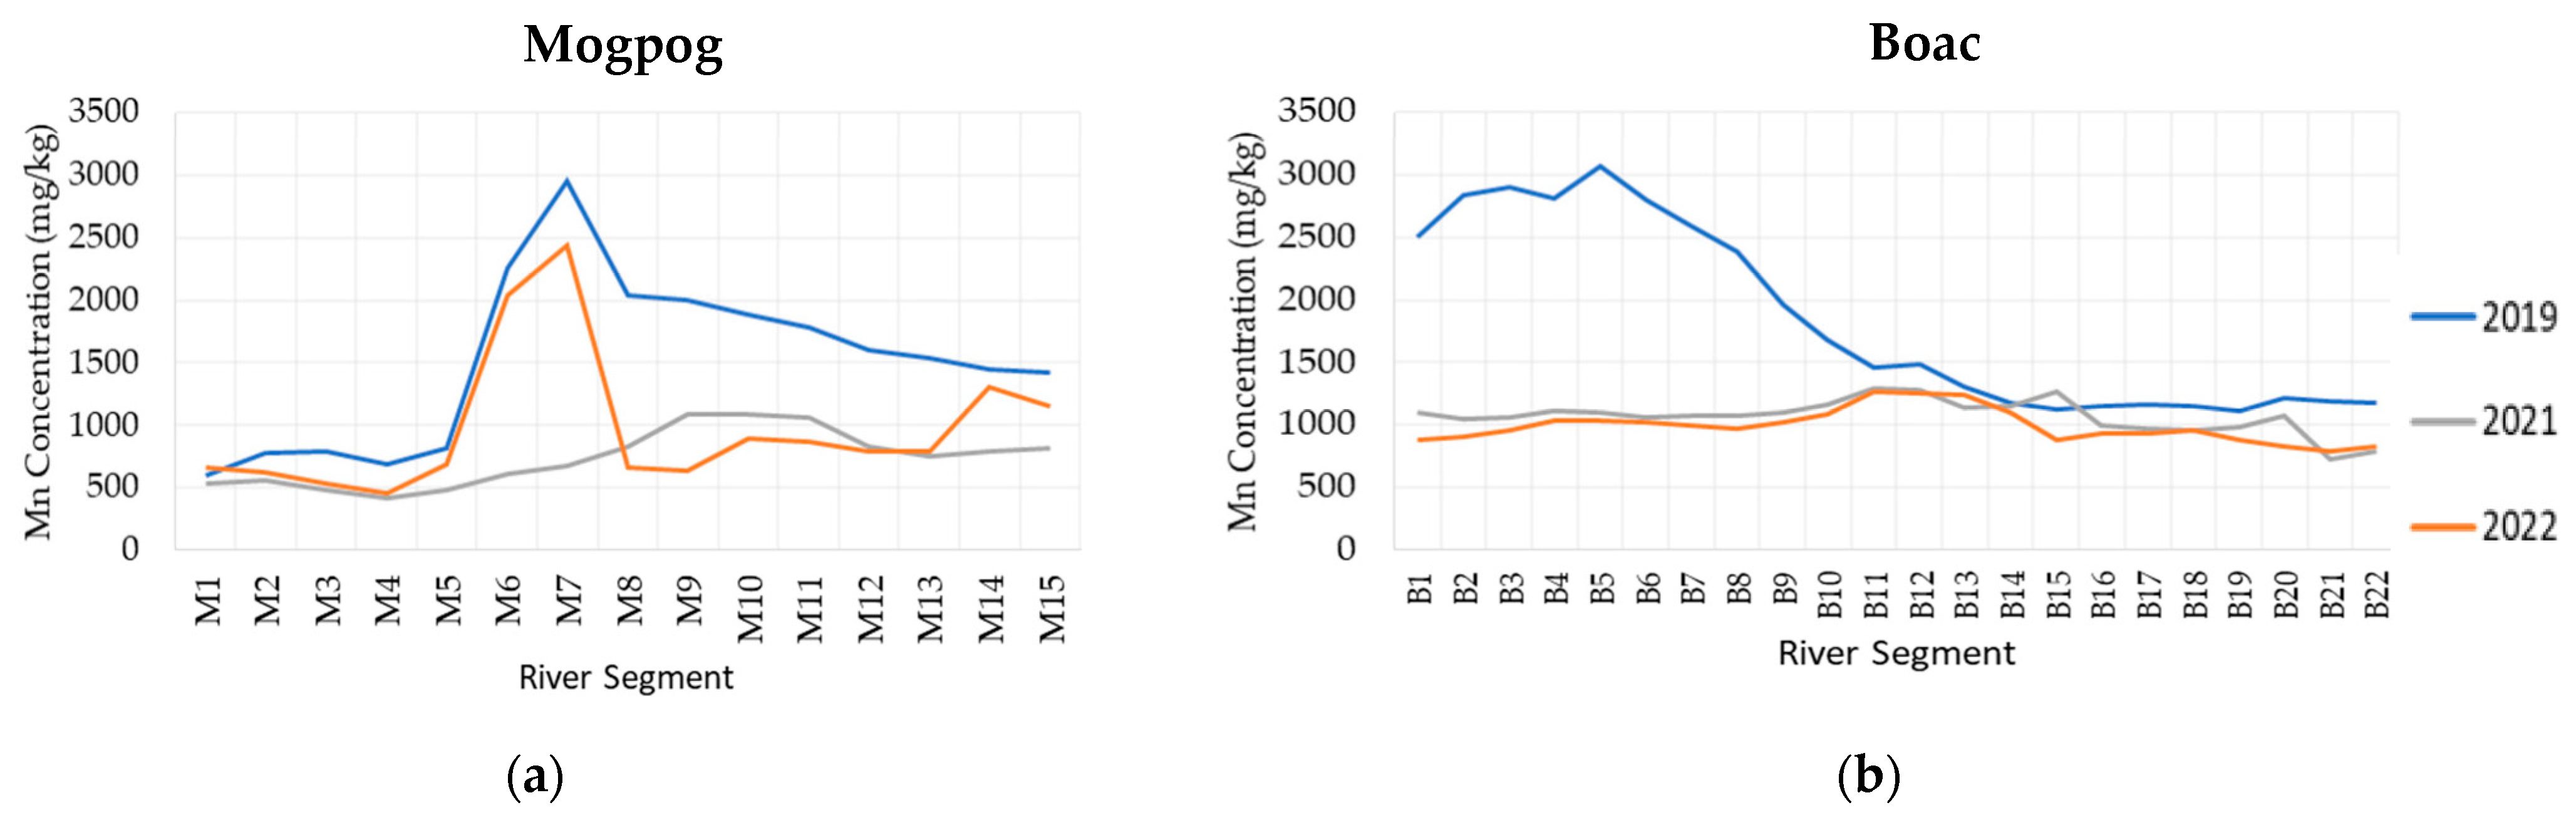
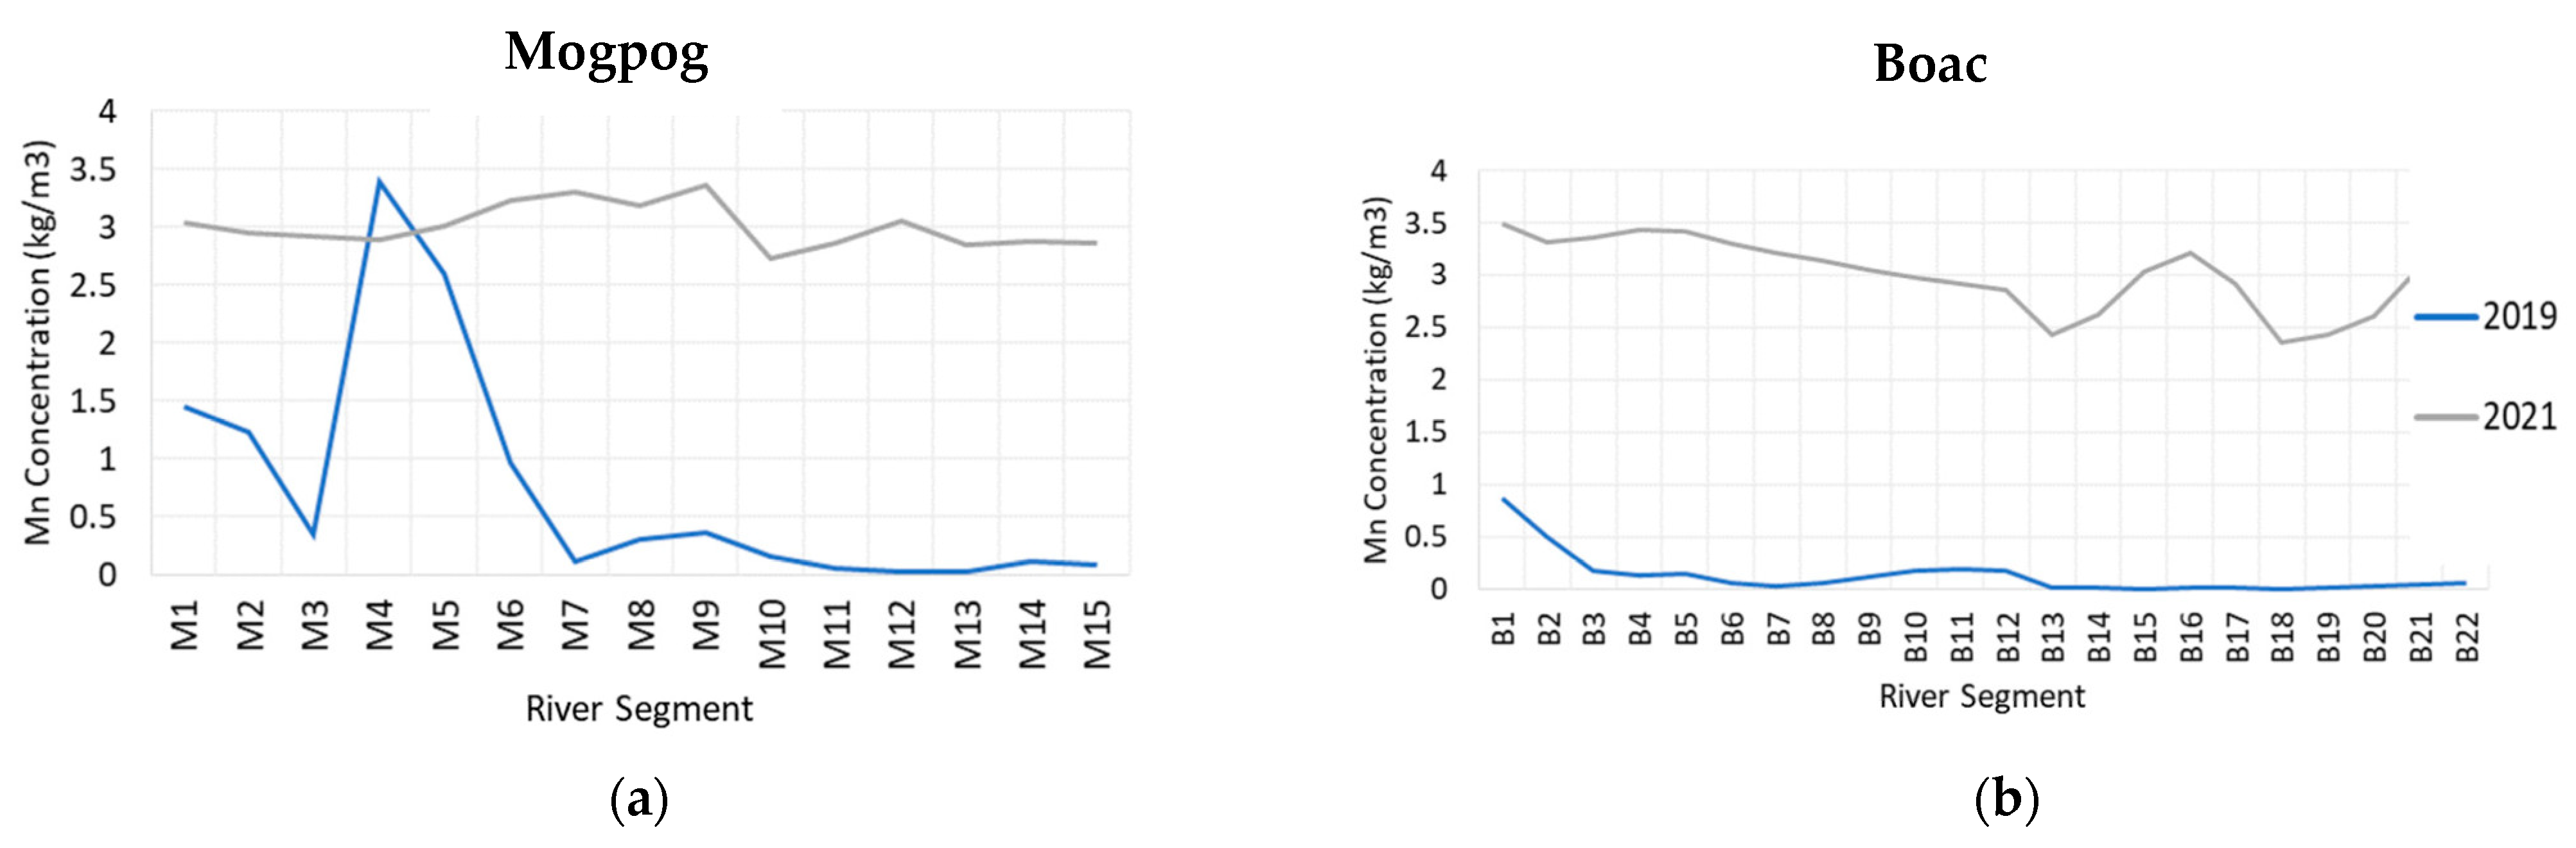
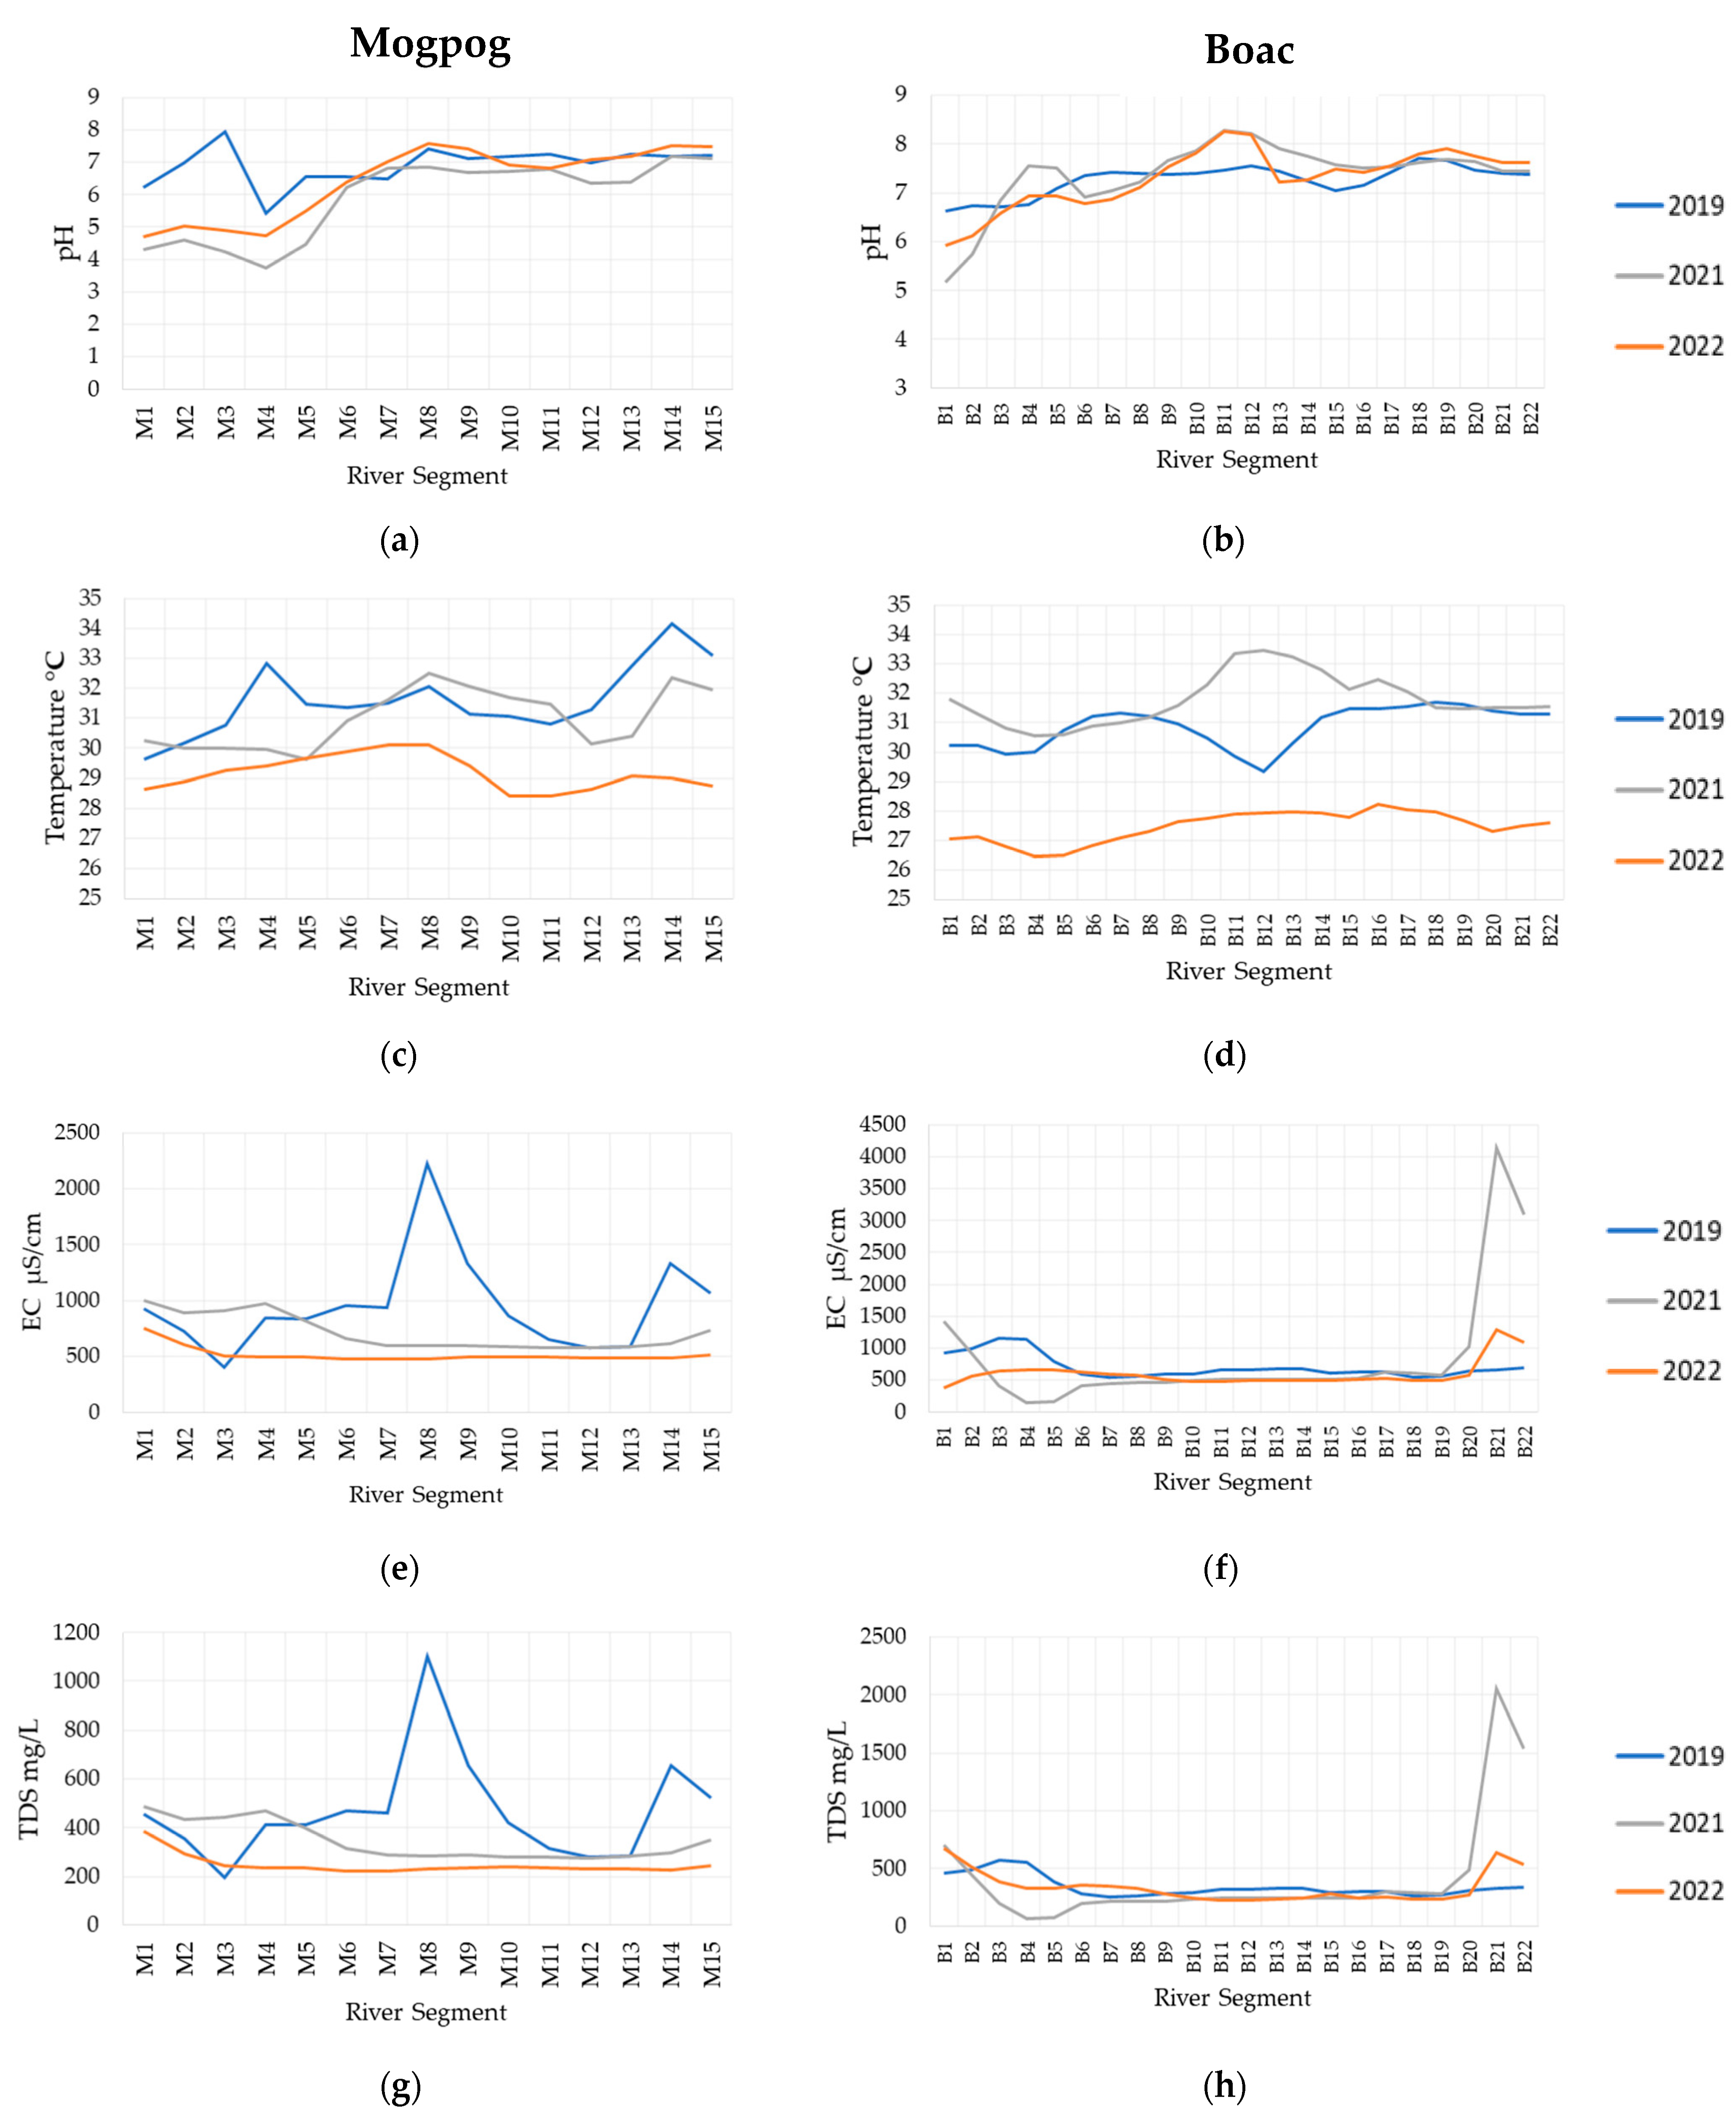
3.1. Sediment and Surface Water Quality

The various parameters measured in sediment and SW samples collected along the rivers in 2019, 2021 and 2022 were assigned to their corresponding river segment. Figure 5 plots the sediment Mn concentration for each year within the 15 and 22 segments along Mogpog and Boac rivers, respectively. Figure 5a presents the Mn concentration in sediment along Mogpog river. In 2019 (blue), Mn is highest in the mid-section of the river (M6-M8) that is likely due to accumulation of contaminated sediments at the most meandering portion of the river. Diminished flow velocities and dead zones in these portions can cause high hydraulic retention and sediment deposition [68]. In 2021 (grey), sediment Mn declined throughout the length of the river, with highest concentrations now further downstream at M9-M11. This suggests bulk movement of contaminated sediments during the extreme precipitation (2901 mm) and high flow events that occurred in 2020 (see precipitation records in Appendix B). The background concentration of Mn in sediment was 450 mg/kg at Boac.
Figure 5b shows that in 2019, sediment Mn concentrations were elevated within the upstream segments of Boac river (B1–B5), before gradually declining through downstream segments. The upstream sediments were likely affected by sheet flow from the Tapian pit. In 2021, sediment Mn decreased significantly in all upstream segments, with small decreases in the downstream segments that had already low concentrations. Similar to Mogpog river, this suggests the movement of the contaminated upstream sediments during high river flows between 2019 and 2021. According to Philippine Atmospheric Geophysical and Astronomical Services Administration (PAGASA), the total rainfall in the province in 2019, 2020 and 2021 was 2330.40 mm, 4496.30 mm, and 3570.90 mm, respectively. The rainfall volumes in 2020 and 2021 were significantly larger than 2019. In 2020, the area received almost double the amount of rainfall than 2019. In 2021, the area received over 1000 mm more. As a result, much higher flow velocity occurred in the rivers in 2020 which promoted sediment movement [31,69]. This relationship between increased sediment loading and movement induced by increased precipitation was previously observed by Shi et al. [70].
Figure 6 presents the Mn concentration in SW along Mogpog and Boac rivers. In 2019 (blue), SW concentrations are highest in the most upstream segments of both rivers (i.e., M1–M5; B1–B3) before decreasing further downstream due to increased dispersion and adsorption by sediments [71] and river morphology [72]. In direct contrast to sediment Mn, SW Mn increased significantly in 2021. This supports the idea that during the extreme precipitation events between 2019 and 2021, high flows in the river lead to desorption of Mn in sediments, thereby contaminating the SW. In 2019, the average pH in the two rivers was 6.91, with an average pH of 5.42 at the most upstream ends due to the proximity to the mine pits. The higher precipitation in 2021 resulted in higher overflow from the two abandoned open pits, which affected the pH in the rivers that now had an average pH of 5.9, with values as low as 3.74. This low acidity in the rivers in 2021 caused desorption of sediments [28,73] and led to increased SW Mn concentration. Hence, the SW contamination was attributed to the lowering of pH in SW, and the potential desorption of Mn on river sediments. Furthermore, overflow from the open pits during high precipitation likely provided additional Mn to SW. The background concentration of Mn in SW recorded LOD (Limit of Detection)
Figure 7 presents the average pH, temperature, EC and TDS in SW within each segment along Mogpog and Boac rivers in 2019, 2021, and 2022. In 2019, the pH is lowest (and below WHO limits) in the uppermost portions of both rivers (M1–M6; B1–B2), nearest the open pits. The pH tends to gradually increase with increasing distance downstream in both rivers, corresponding to decreased Mn in SW. Between 2019 and 2021, the pH became lower within most segments in Mogpog and Boac river, which can be attributed to low pH water discharged into the rivers from pit overflow. The decrease in pH corresponds to the increase in SW Mn shown in Figure 6, as expected. According to Bondu et al. [74] and Homoncik et al. [75], Mn in water is inversely proportional with pH as it can form precipitates in the presence of oxygen and/or carbonates.
Figure 7c,d present the SW temperature along the river. In both rivers, temperature readings tend to increase with increasing distance downstream, which may be due to a number of reasons unrelated to Mn concentration, such as anthropogenic activities [76] and/or climate change [77]. Figure 7e–h presents the EC and TDS for the SW in both rivers, which are shown to follow the patterns in space and time, which is expected as TDS was empirically derived from EC. In 2019, EC/TDS were low in all segments of both rivers except the two most central segments in Mogpog river (M8–M9). EC/TDS generally decreased from 2019 to 2021, while also becoming a lot more uniform, except for the most upstream segments (affected by pit overflow) and downstream segments (affected by salt-water intrusion) [78].
Plan-view spatial maps of sediment and SW Mn concentrations for 2019, 2021, and 2022 are presented in Figure A1 and Figure A2 in Appendix A, while maps of pH, temperature, EC, and TDS are presented in Figure A3, Figure A4, Figure A5 and Figure A6. These spatial maps illustrate the relationship between Mn concentration and river planform, with higher concentrations of Mn at river bends. Furthermore, it shows the relationship between Mn accumulation and the physicochemical properties of SW, such as pH. Table A1 and Table A2 summarize the statistics of the measured parameters for each year in Mogpog and Boac rivers.

3.2. River Morphology

Table 2 shows the average, standard deviation, and range of values for each morphological parameter (river slope, river bends, channel width, river length, sinuosity) within the segments of Mogpog and Boac rivers. Mogpog river has 15 segments with an average slope of 9.87° with a standard deviation (SD) of 6.28, while Boac river has 22 segments with an average slope of 6.22° and SD of 5.4. The high SD is due to the high slopes upstream and very low slopes downstream in both rivers. Despite Mogpog river (23 km) being shorter than Boac river (27 km), it has higher average slopes which indicate that flow velocity and momentum is faster [79].
Mogpog river contains more river bends (2.87 ± 0.72) than the Boac river (1.32 ± 0.70), promoting more movement and accumulation of sediments in different portions of the river. As shown in Figure 5a, sediment Mn in 2019 is not at its highest at the very upstream of Mogpog river, but is located midstream. Furthermore, after extreme flows had taken place between 2019 and 2021, sediment Mn shifted from midstream accumulation to downstream. The average channel width was 81.5 m and 179.6 m for Mogpog and Boac rivers, respectively. Larger channel widths have higher capacity to carry flow, which can be associated with sediment and SW transport. The 15 segments in Mogpog river have average channel lengths of 1.47 km, while the 22 segments in Boac river have 1.27 km.
The sinuosity in Mogpog and Boac was 1.43 and 1.27, respectively, indicating that Mogpog river has more bends and curvature along its channel, making it accumulate Mn faster and higher than Boac [27]. In addition to these morphological parameters, Mogpog river may be more contaminated than Boac river due to the associated mine pit disaster occurred three years earlier (i.e., 1993 vs. 1996), meaning more mine waste exposure to Mogpog river. These findings were also confirmed by the MIKE Eco Lab model that higher concentrations occurred in bends and portion of river with high sinuosity.

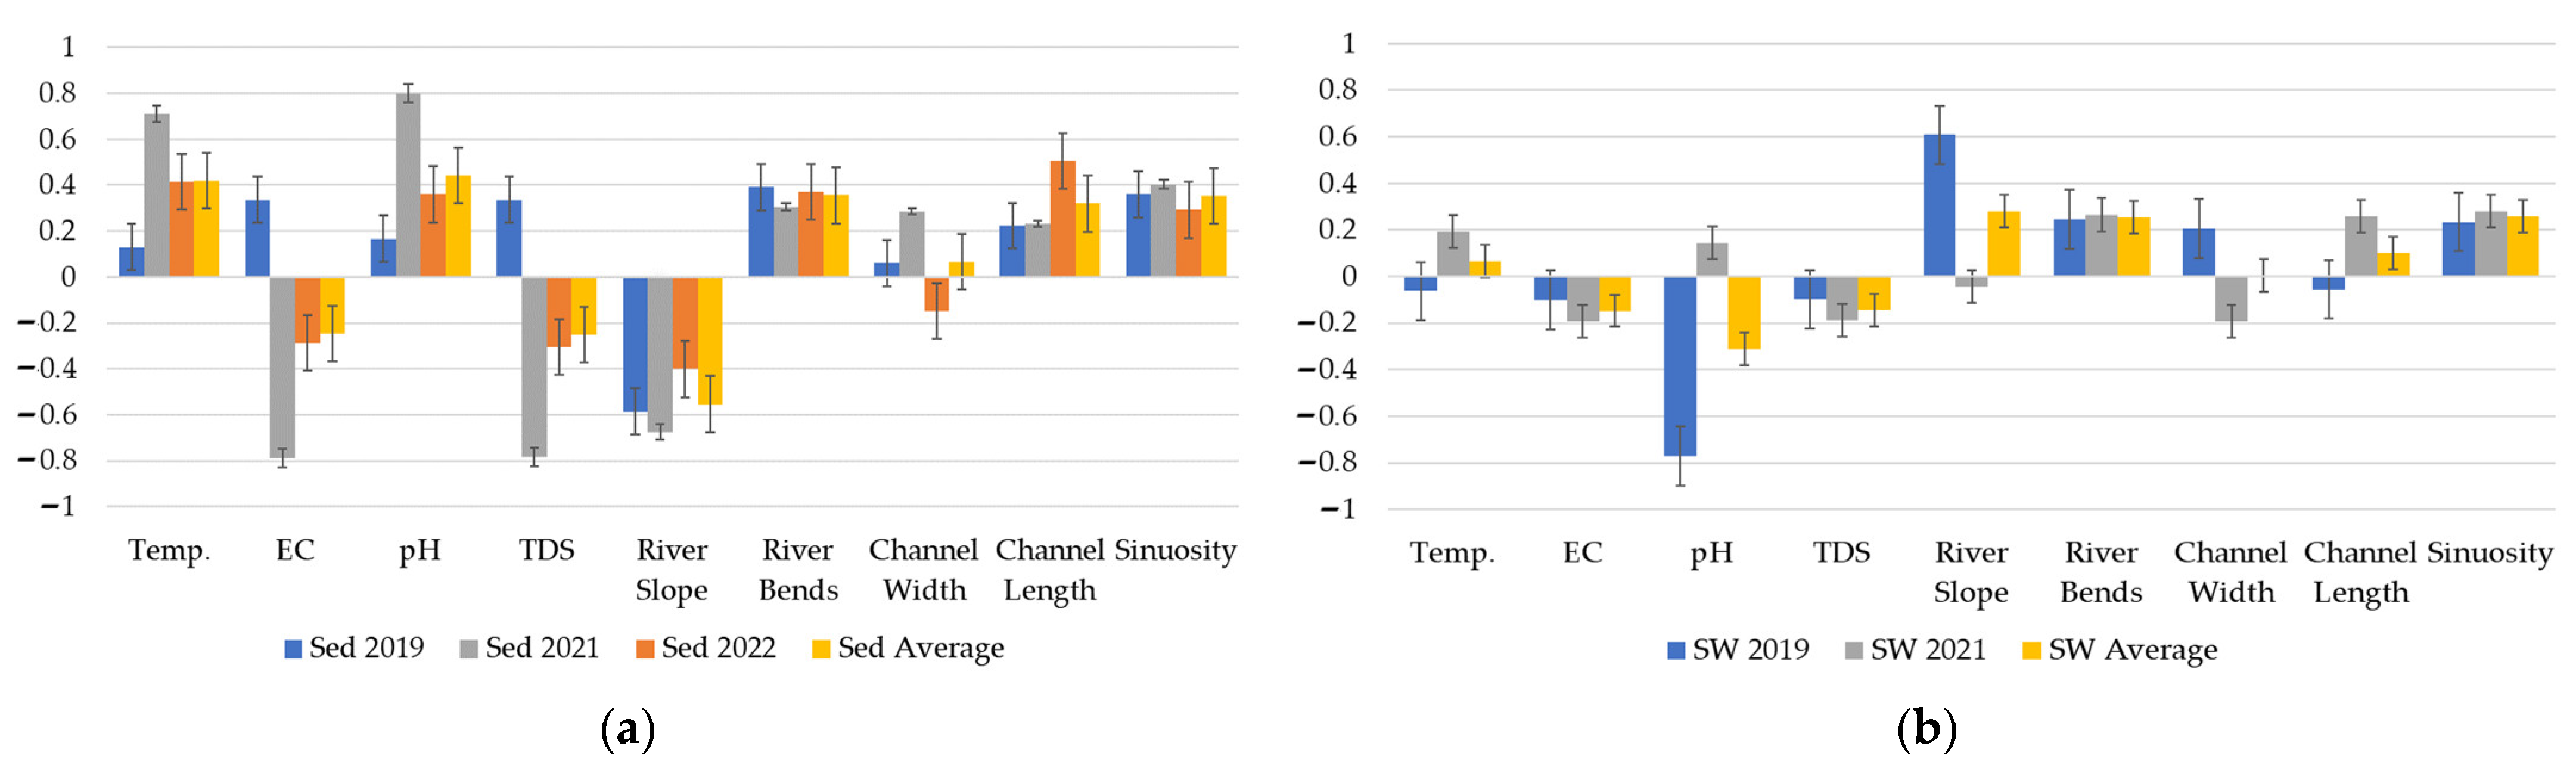
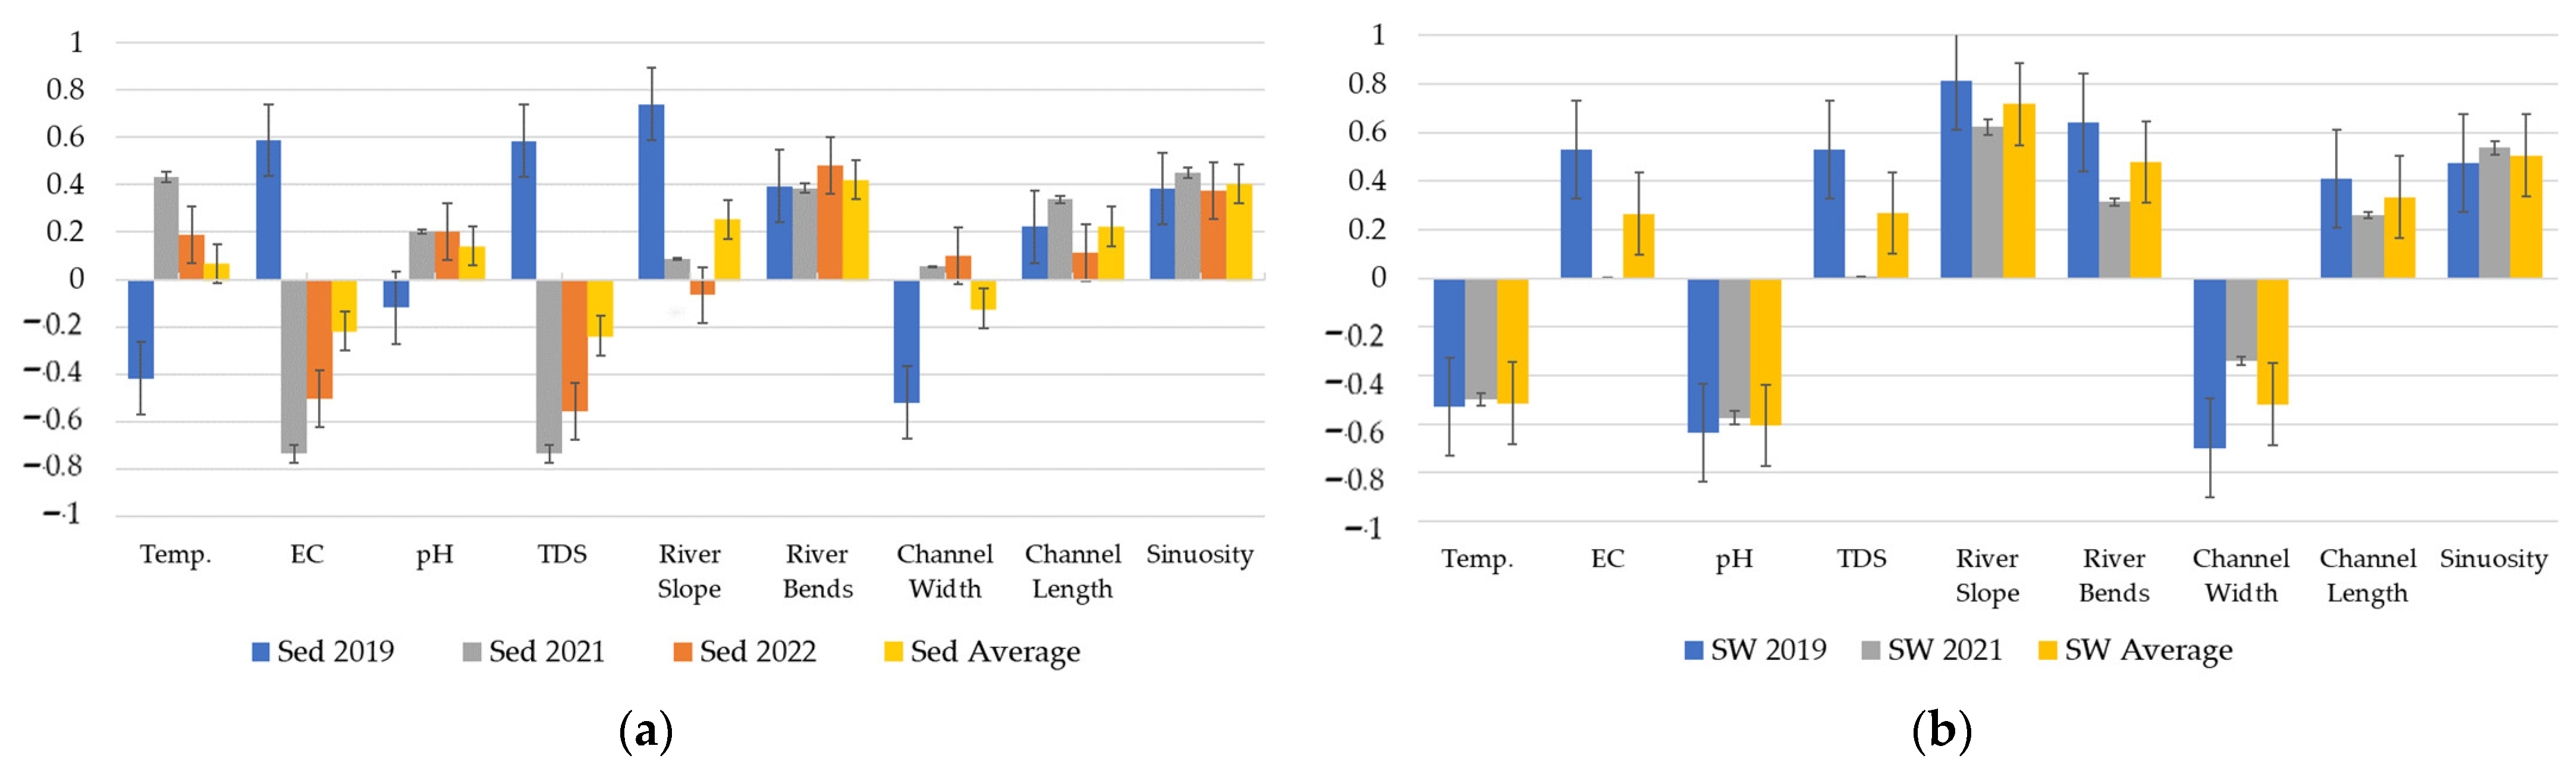
3.3. Degree of Correlation between Mn, pH, EC, TDS and River Morphology

Figure 8 presents the correlation coefficients between sediment Mn and SW Mn concentration with SW physicochemical parameters and river morphological parameters. For sediment Mn and physicochemical parameters, the highest average correlation is with pH (r = 0.443, moderate correlation) and temperature (r = 0.420, moderate), while for river morphology, sediment Mn has the highest correlation with river bends (r = 0.356), followed by sinuosity (r = 0.352), and river length (r = 0.320). Sediment Mn is negatively correlated with river slope (r = −0.554) as lower slope reduces flow in different parts of the river.
In SW, Mn shows negative correlation to pH (r = −0.313) due to metals being more soluble in acidic water. River slope has the highest correlation (r = 0.282) among river morphological parameters, followed by sinuosity (r = 0.257), river bends (r = 0.255), river length (r = 0.102), and width (r = 0.006). Even with weak level correlation between morphological parameters and SW Mn contamination, it still confirms some association.
Figure 9 presents the correlation coefficients computed for Boac river. Considering all years, sediment Mn is correlated to pH, EC and TDS of SW, providing similar results to Ekissi et al. [80] and Ustaoğlu et al. [81]. In some instances the correlation shifted from negative to positive, such as with pH where it shifted from r = −0.119 in 2019 to r = 0.202 in 2021 and r = 0.201 in 2022. Results could be affected by the deposition of sediments along the river that may also have undergone adsorption and/or desorption [82], especially after the extreme rainfall in 2020 [83,84]. The average correlation for all three years of temperature, pH, EC and TDS to sediment Mn is 0.067, 0.142, −0.217, and −0.236, respectively. Ekissi et al. [80] also had negative correlations between metal concentration and EC and TDS, and positive correlations with pH.
In terms of river morphology, sediment Mn has the highest correlation to river bends (r = 0.421, moderate), followed by sinuosity (r = 0.403, moderate). This matches the observations by Xiao et al. [27] who attributed the increase of Mn in sediments to sinuosity. River length and river slope have weak correlations with r = 0.225 and r = 0.254, respectively. Lastly, river width exhibits an inverse correlation to sediment Mn with r = −0.121.
In contrast to sediment Mn, Mn in SW is correlated to pH (r = −0.606) and temperature (r = −0.514). This again suggests that rivers with lower pH tend to be highly contaminated with Mn, as water with low pH increases the solubility of metals [85]. For river morphology, unlike in sediments, river slope has the highest correlation (r = 0.716) to Mn, followed by sinuosity (r = 0.505), river bends (r = 0.478), river length (r = 0.334), and river slope (r = −0.519). This demonstrates that river morphology greatly impacts Mn accumulation in SW along Boac river.
The correlation results for both rivers indicate that river morphology significantly affects metal, in this case Mn, contamination in different portions of the river. River bends and sinuosity are the leading parameters that have the highest correlation with sediment and SW contamination in both rivers. Physical features of the river could inform how, and possibly where, heavy metal contamination could take place. Complete correlation results are presented in Appendix A, Table A3 and Table A4.

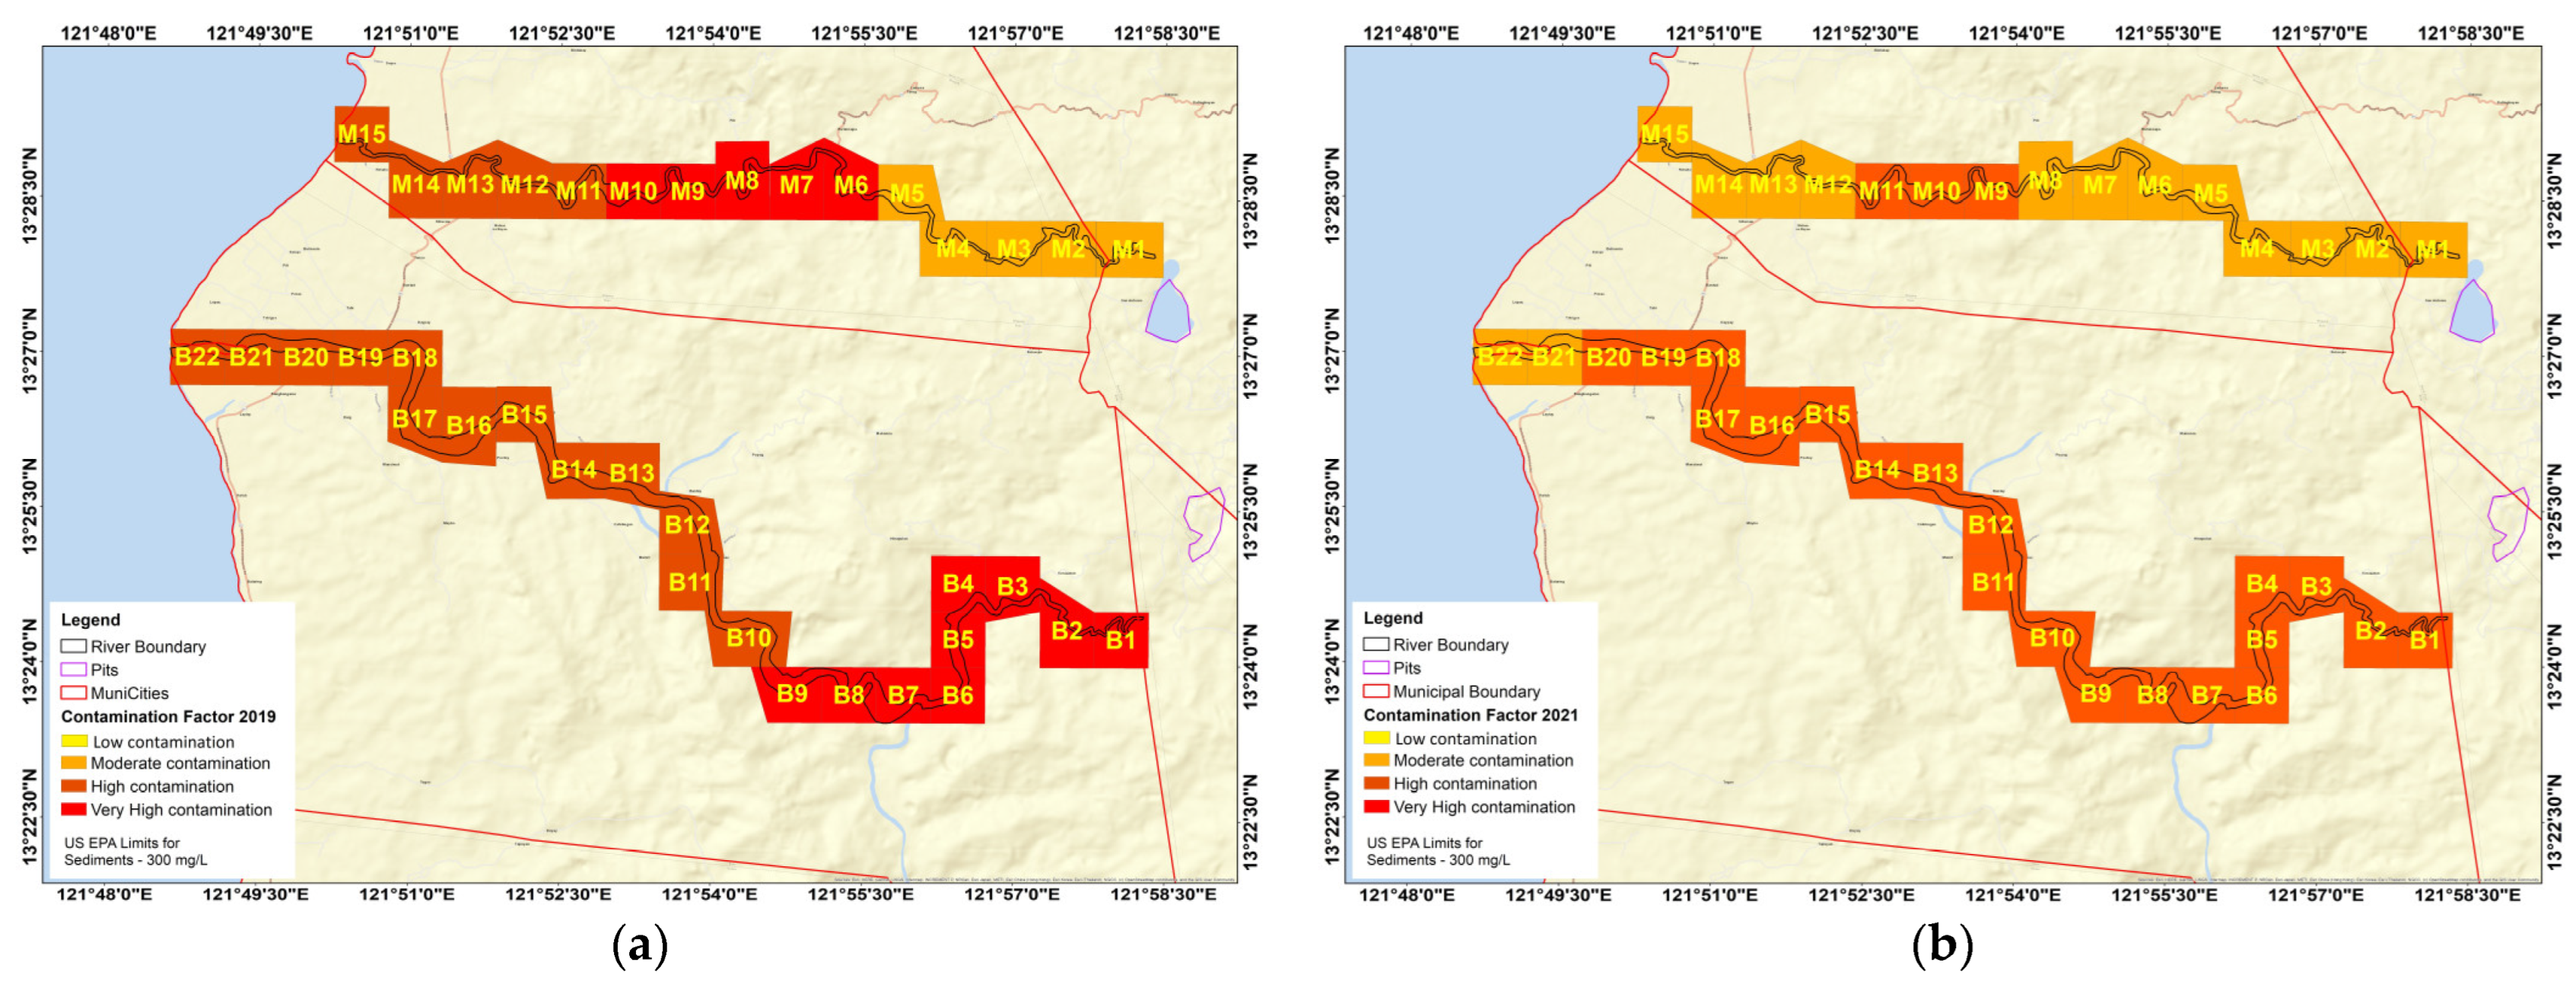
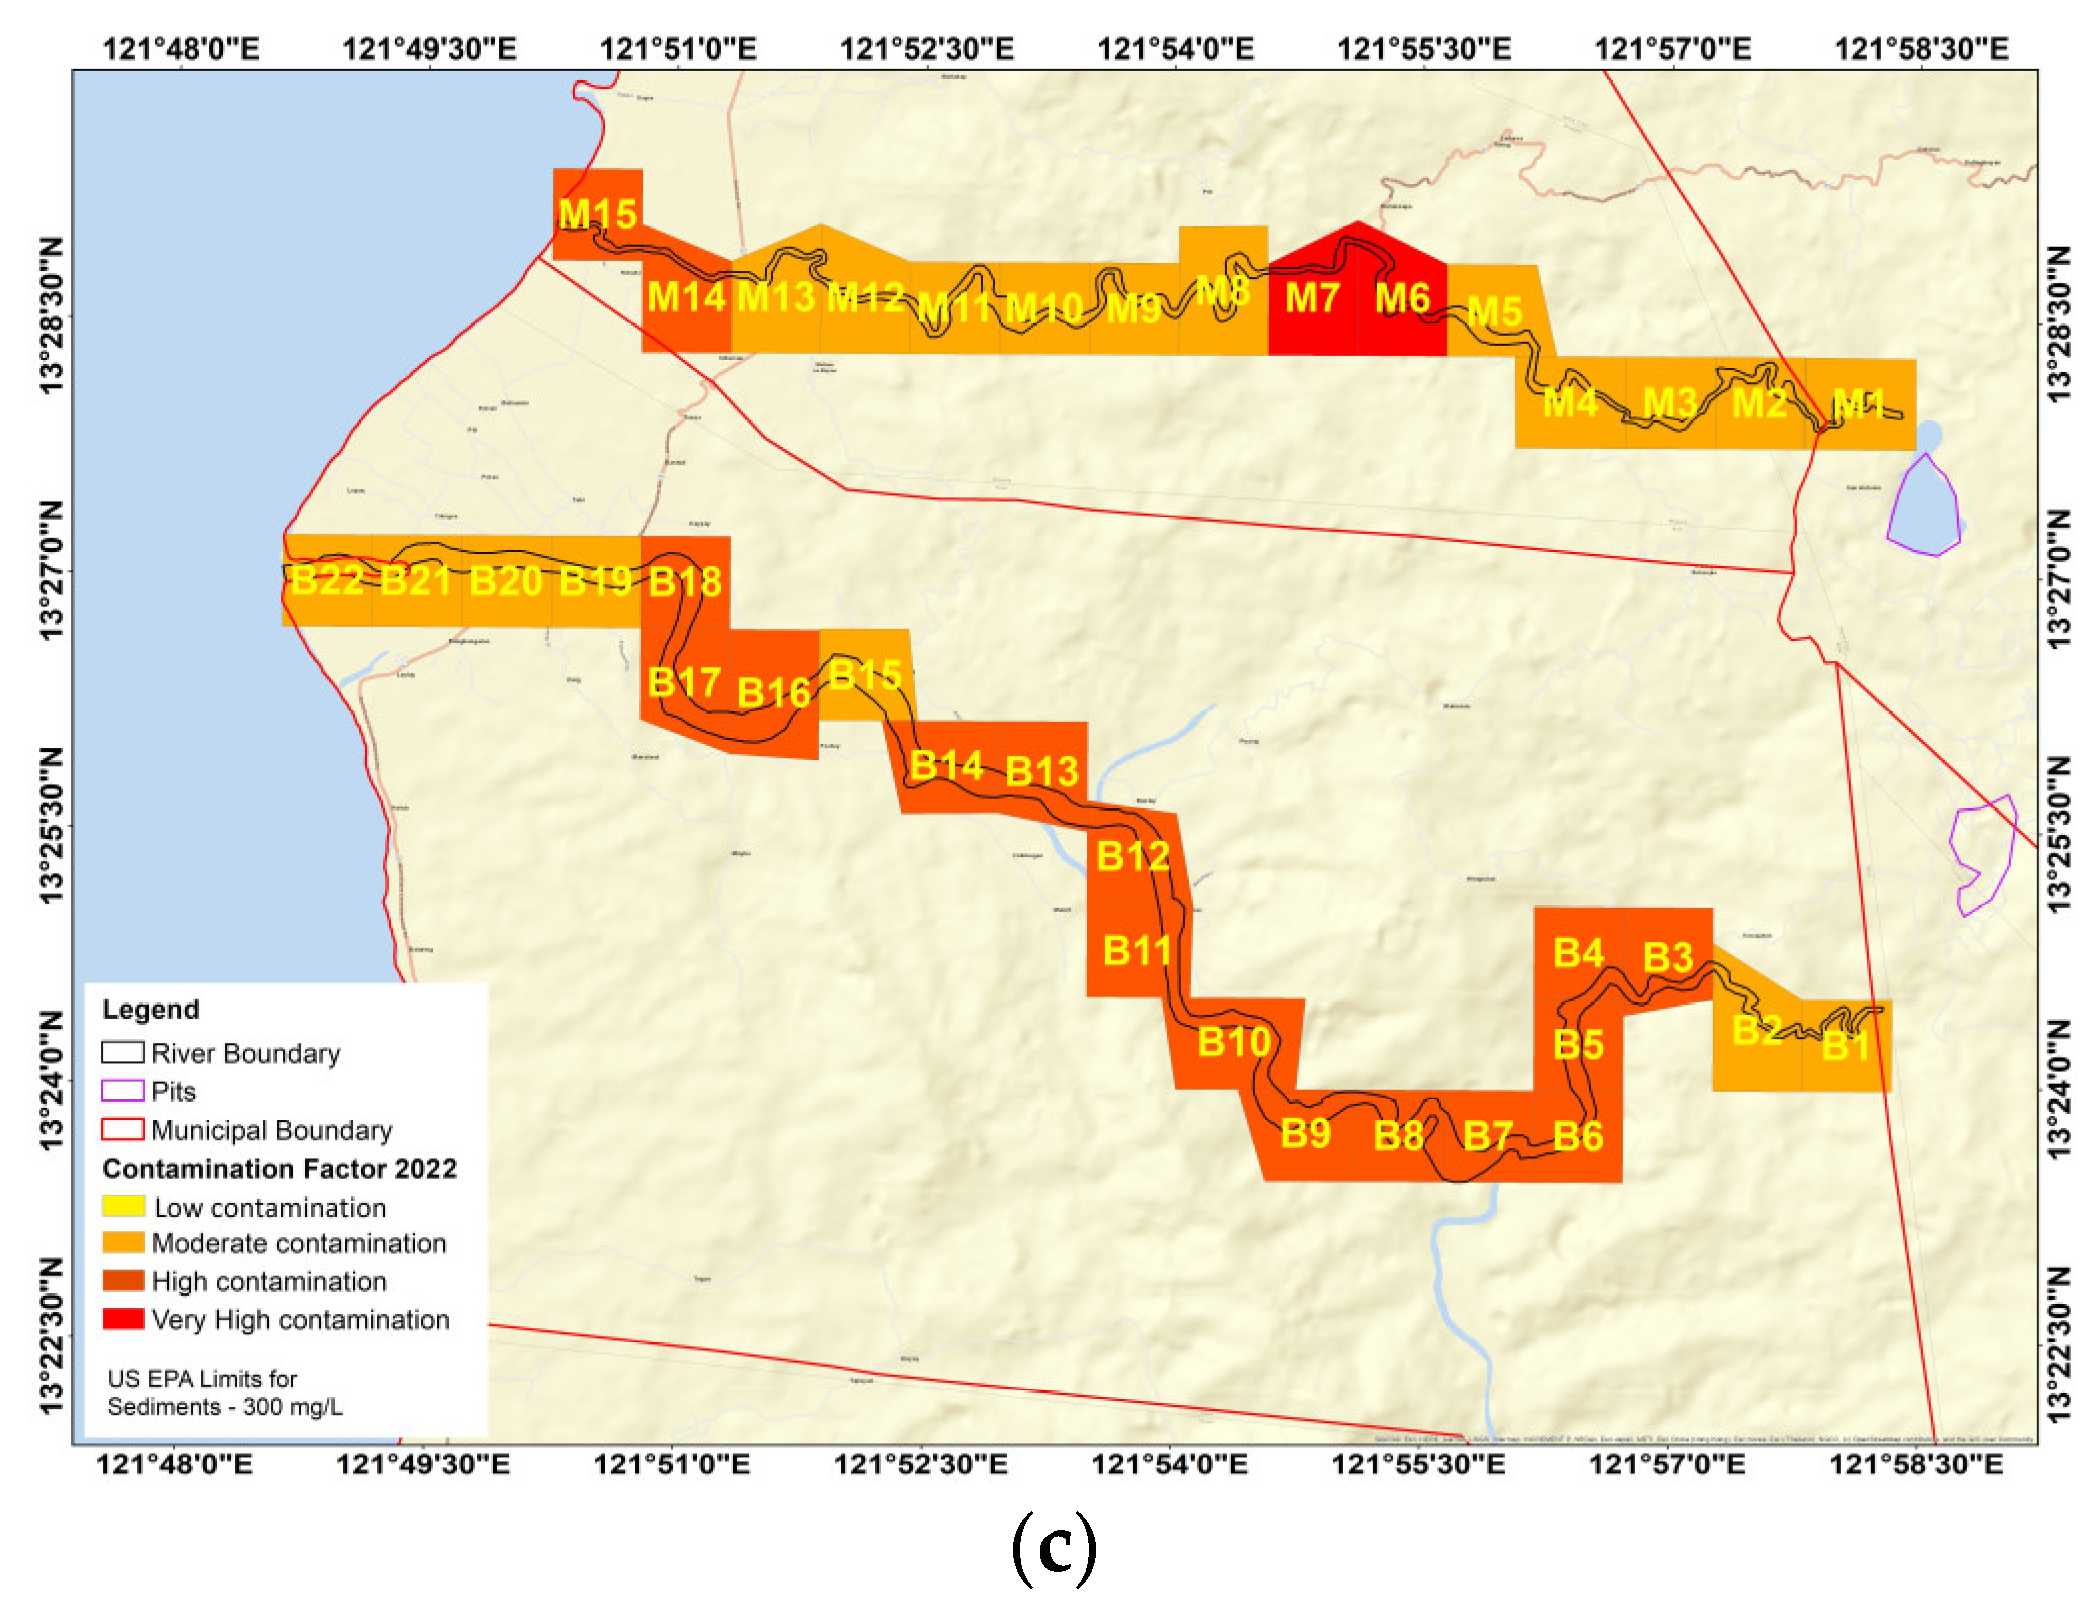
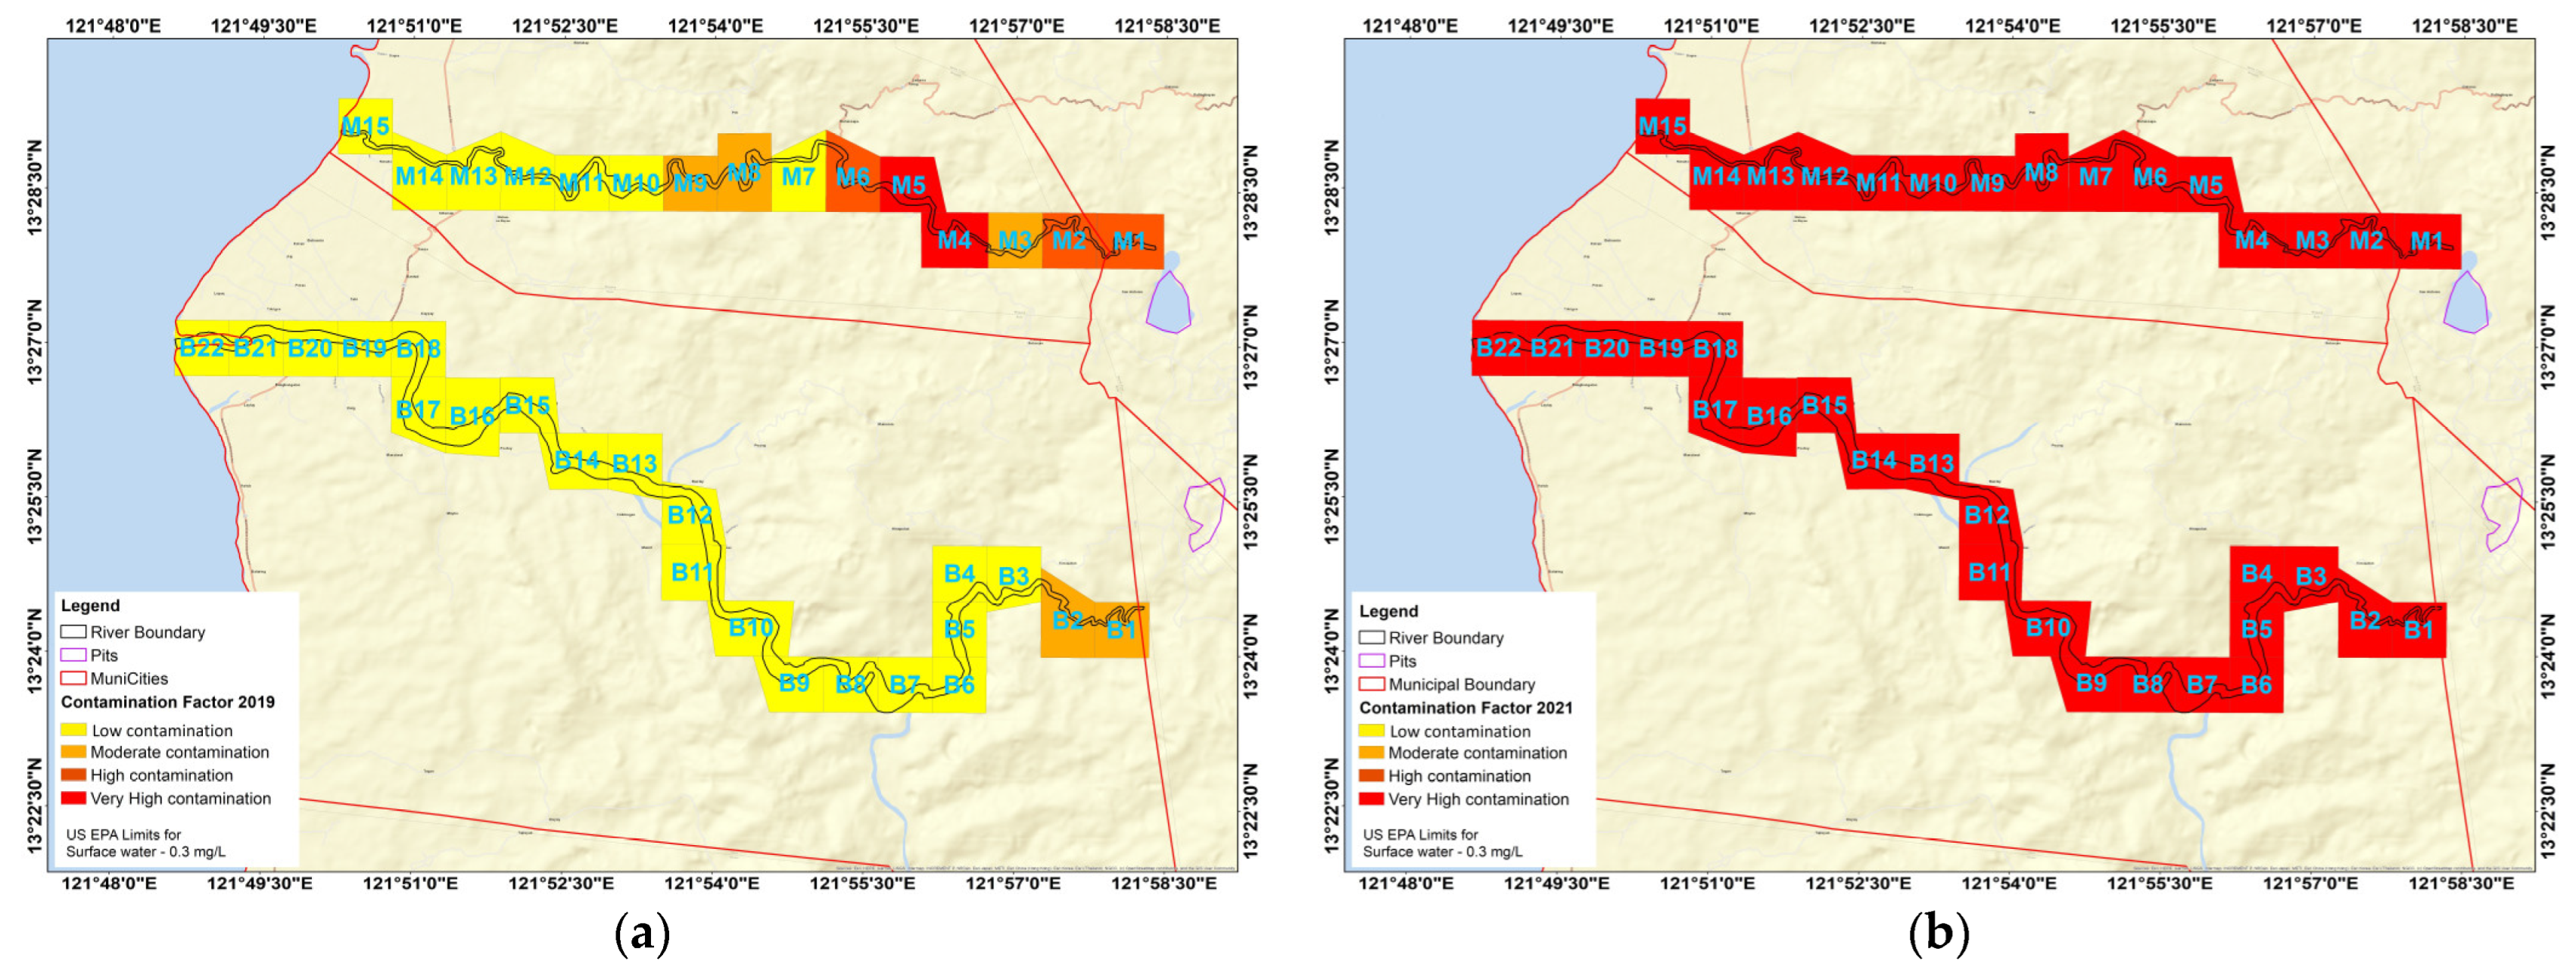
3.4. Contamination Factor

Figure 10 illustrates the calculated CF for sediment Mn within each river segment in Mogpog and Boac rivers. The 2019 CF in Mogpog river indicates that 5/15 segments (M1–M5) are moderately contaminated, 5/15 (M11–M15) are highly contaminated, and 5/15 (M6–M10) have very high contamination. The very high contamination occurs at mid-stream where many bends exist. The Boac river exhibits high contamination at 13/22 segments (B10–B22), while 9/22 (B1–B9) exhibit very high contamination, which are the most upstream segments that also coincide with a number of large bends.
The 2021 sediment Mn CF levels decreased in both rivers due to the extreme rainfall in 2020 that may have desorbed and transported the sediments. In Mogpog river, all segments now have moderate contamination, aside from the highly contaminated segments with some of the largest river bends (M9–M11). Boac river experienced a decrease in CF level in the upstream segments (B1–B9), from very high to high contamination, and the two most downstream segments (B21–B22) from high to moderate contamination. In 2022, sediment Mn in 11/15 segments in Mogpog river exhibit moderate contamination, with high contamination occurring downstream (M14–M15), which could be the result of extreme rainfall events that pushed contaminated sediments downstream. The midstream segments M6 and M7 exhibit very high contamination, which is correlated to the number of bends. The 2022 CF in Boac river continued to decrease, now having 7/22 (B1–B2, B15, B19–B22) having moderate contamination, compared to 0/22 in 2019.
The maps in Figure 8 again indicate that spatial and temporal sediment Mn accumulation is affected by the planform and/or river morphology. Even in 2021, following high flows in 2020, high Mn levels remain in portions of the river with many bends. Furthermore, even after 25+ years since the mining disasters, sediment Mn has remained high in both rivers.
Figure 11 shows the CF for SW Mn for each river segment in 2019 and 2021. In 2019, the majority of river segments exhibited low contamination, particularly in Boac river with 20/22 segments. Boac river has lower sinuosity and river bends than Mogpog river, likely causing this relatively lower contamination. In 2021, a dramatic increase in CF levels occurred, with all segments in both rivers now exhibiting very high contamination. This is evidence of the impacts of high rainfall events and mine pit overflow, and possibly discharge of contaminated groundwater from the underlying aquifer. The highest CF values were found in M6 and M7 along Mogpog and B1 to B6 along Boac, with Mn accumulation correlated to river morphology within these segments.

4. Discussion

In this study, extensive data were collected and analyzed to determine the relationship of elevated Mn with river morphology. Mn concentrations measured in the rivers are significantly greater than the limits permitted by WHO and can adversely impact water quality and aquatic life [86] and provide significant risk to human health. For example, direct contact to open wounds [87] or water consumption can put children at risk of Mn-induced neurotoxicity [88].
Very high concentrations of Mn in sediment were measured in Mogpog and Boac in 2019, with highest Mn at midstream in Mogpog (2948.61 mg/kg) and at the most upstream in Boac (3068.79 mg/kg). High Mn concentrations can be retained in river sediments due to their small particle size and corresponding high surface area that can adsorb metal concentration [30]. In 2021 and 2022, sediment Mn concentrations decreased along both rivers, with highest concentrations shifted to downstream (Mogpog) and midstream (Boac), suggesting sediment movement. This is supported by the occurrence of extremely high precipitation events and high river flows between 2019 and 2021.
While Mn concentrations in sediment decreased from 2019 to 2021, Mn concentrations in SW significantly increased. Miranda et al. [28] and Haimann et al. [29] showed that dissolved metals such as Mn do not only adsorb to sediments but also desorb. Adsorption and desorption greatly affects contaminant transport in rivers, and likely the cause of changes in Mn over time, shifting between sediment and SW. Furthermore, pH values as low as 3.7 was observed in the rivers, and it is known that lower pH can generate higher rates of sediment desorption and the release of metals in water [73,85,89].
This study has shown that Mn accumulation in rivers is not only governed by chemical reaction, but also by the hydrodynamics of the river, where river morphology can affect metal transport and/or change the zones of sediment deposition over time [90]. River length, slope, width, bends, and sinuosity were the key morphological parameters that were compared with Mn accumulation over time in Mogpog and Boac rivers. The highest correlation with sediment Mn accumulation were river bends (r = 0.389) and sinuosity (r = 0.378), with these parameters directly impacting sediment deposition. The highest correlation with Mn accumulation in SW were river slope (r = 0.500) and sinuosity (r = 0.381). River slope directly affects flow velocity, and as metals are basically suspended or dissolved in water [91], they are being carried along with this flow. In terms of sinuosity, sediment deposits are usually higher in sinuous sections compared to straight reaches, thereby causing higher contamination, as shown in the study of Ciszewski et al. [92].
Adequate characterization of river morphology does not require excessive effort or expensive equipment, and it can be highly beneficial in the development and implementation of mitigation strategies. In terms of future morphological changes that may occur along rivers, the effects by climate change should be considered. Temperatures rise and severe flooding occurring in rivers [93,94] can induce morphological changes and alter the associated stimulation of Mn accumulation [17]. In a river exposed to an identified pollutant source such as the mine pit that continuously discharges toxic waste to the environment, it is important to identify how and where these pollutants will accumulate. The toxic waste flows downstream from the mine pit and its distribution will be greatly affected by river morphology, and by the adsorption-desorption processes within sediments. Knowledge on this relationship of metal accumulation and river morphology would help the local government to design and implement effective mitigation strategies at the river. Further, conduct of a separate study that focuses on the bioavailability of Mn and other heavy metals could be useful in understanding the relationship of metals concentrations, its biodegradation rate, and possible risks to human and environment.

5. Conclusions

This study shows that river morphology can control sediment deposition and strongly influence Mn accumulation in sediments and SW. Overflow from the mine pits is a direct contributor of Mn as it will quickly contaminate the adjacent rivers. Mn absorbed to the sediments is also a big contributor to Mn in SW through adsorption-desorption processes, especially as it is not dependent on rainfall events unlike pit overflow. As river morphology affects the deposition and accumulation of sediments along the river, it also affects Mn concentration in sediments, and consequently Mn in SW. This possible interchange of Mn between sediment and SW was shown in this study with the highest sediment Mn in Mogpog and Boac rivers measured in 2019, followed by the lowest sediment Mn in 2021. In direct contrast, Mn in the SW of Mogpog and Boac was lowest in 2019 and highest in 2021. It should be noted that even when sediment Mn and SW Mn were at their lowest in 2021 and 2019, respectively, they still exceeded the limits of WHO for safe human consumption. In terms of river morphology, sediment Mn has the highest correlation to sinuosity (Mogpog r = 0.352, Boac r = 0.403) and river bends (Mogpog r = 0.356, Boac r = 0.421). On other hand, SW Mn had the highest correlation to river slope (Mogpog r = 0.282, Boac r = 0.716) and sinuosity (Mogpog r = 0.257, Boac r = 0.505). In 2019, the CF levels for sediment Mn were highest along river segments with the highest number of bends, specifically midstream in Mogpog and upstream in Boac. In 2021 and 2022, the highest CF levels shifted to downstream segments in both rivers, suggesting that contaminated sediments were transported downstream during the extreme precipitation events that occurred between 2019 and 2021. The highest retention of Mn occurred at river segments with the most bends, with the lowest retention along straight flow paths. The CF levels for SW Mn indicated low contamination in 2019, followed by high contamination in 2021. This was supported by the corresponding average pH levels in 2019 (6.91) and 2021 (5.9), with acidic water dissolving more metals in water and promoting desorption in sediments. This contributed to the Mn increase in SW from 0.024 mg/L in 2019 to 3.01 mg/L in 2021, and Mn decrease in sediment due to desorption from 1504.67 mg/kg in 2019 to 733.63 mg/kg in 2021. It should be noted that the increases of Mn concentration in SW would also be associated with overflow from the mine pits, as higher Mn concentrations in 2021 occurred after extreme rainfall in 2020 and 2021.
Overall, this study demonstrated the correlation between spatial and temporal variability of Mn to river morphology. Even though river morphology can be relatively easy to characterize (e.g., can be done remotely with GIS), the identification of portions along a river that have the most potential to accumulate high concentrations of Mn, or other metals, can be highly beneficial to develop effective mitigation strategies.

Author Contributions

Conceptualization, D.B.S. and C.E.F.M.; methodology, D.B.S. and C.E.F.M.; software, C.E.F.M. and D.B.S.; validation, C.E.F.M., C.P. and D.B.S.; formal analysis, C.E.F.M., C.P. and D.B.S.; investigation, C.E.F.M. and D.B.S.; resources, D.B.S.; data curation, C.E.F.M., C.P. and D.B.S.; writing—original draft preparation, C.E.F.M.; writing—review and editing, C.E.F.M., C.P. and D.B.S.; visualization, C.E.F.M.; supervision, C.P. and D.B.S.; project administration, D.B.S.; funding acquisition, D.B.S. All authors have read and agreed to the published version of the manuscript.

Funding

This research was funded by the Department of Science and Technology-Philippine Council for Health Research and Development (DOST-PCHRD), D-HIVE 4B Capital Research Project.

Data Availability Statement

All data are contained in the manuscript.

Acknowledgments

This is to acknowledge the in-kind support of Mapua University during the course of D-HIVE 4B Capital research project, the cooperation of the local government unit of province of Marinduque, the Western University Ontario and Canada-ASEAN Scholarships and Educational Exchanges for Development (SEED) for the financial support of the part of dissertation works and mobility of Cris Edward F. Monjardin, the DHI Water and Environment, Ltd., Auckland 0622, New Zealand for providing MIKE 2023 software, version 2023, used to create transport model that aided in data validation.

Conflicts of Interest

The authors declare no conflict of interest.

Appendix A

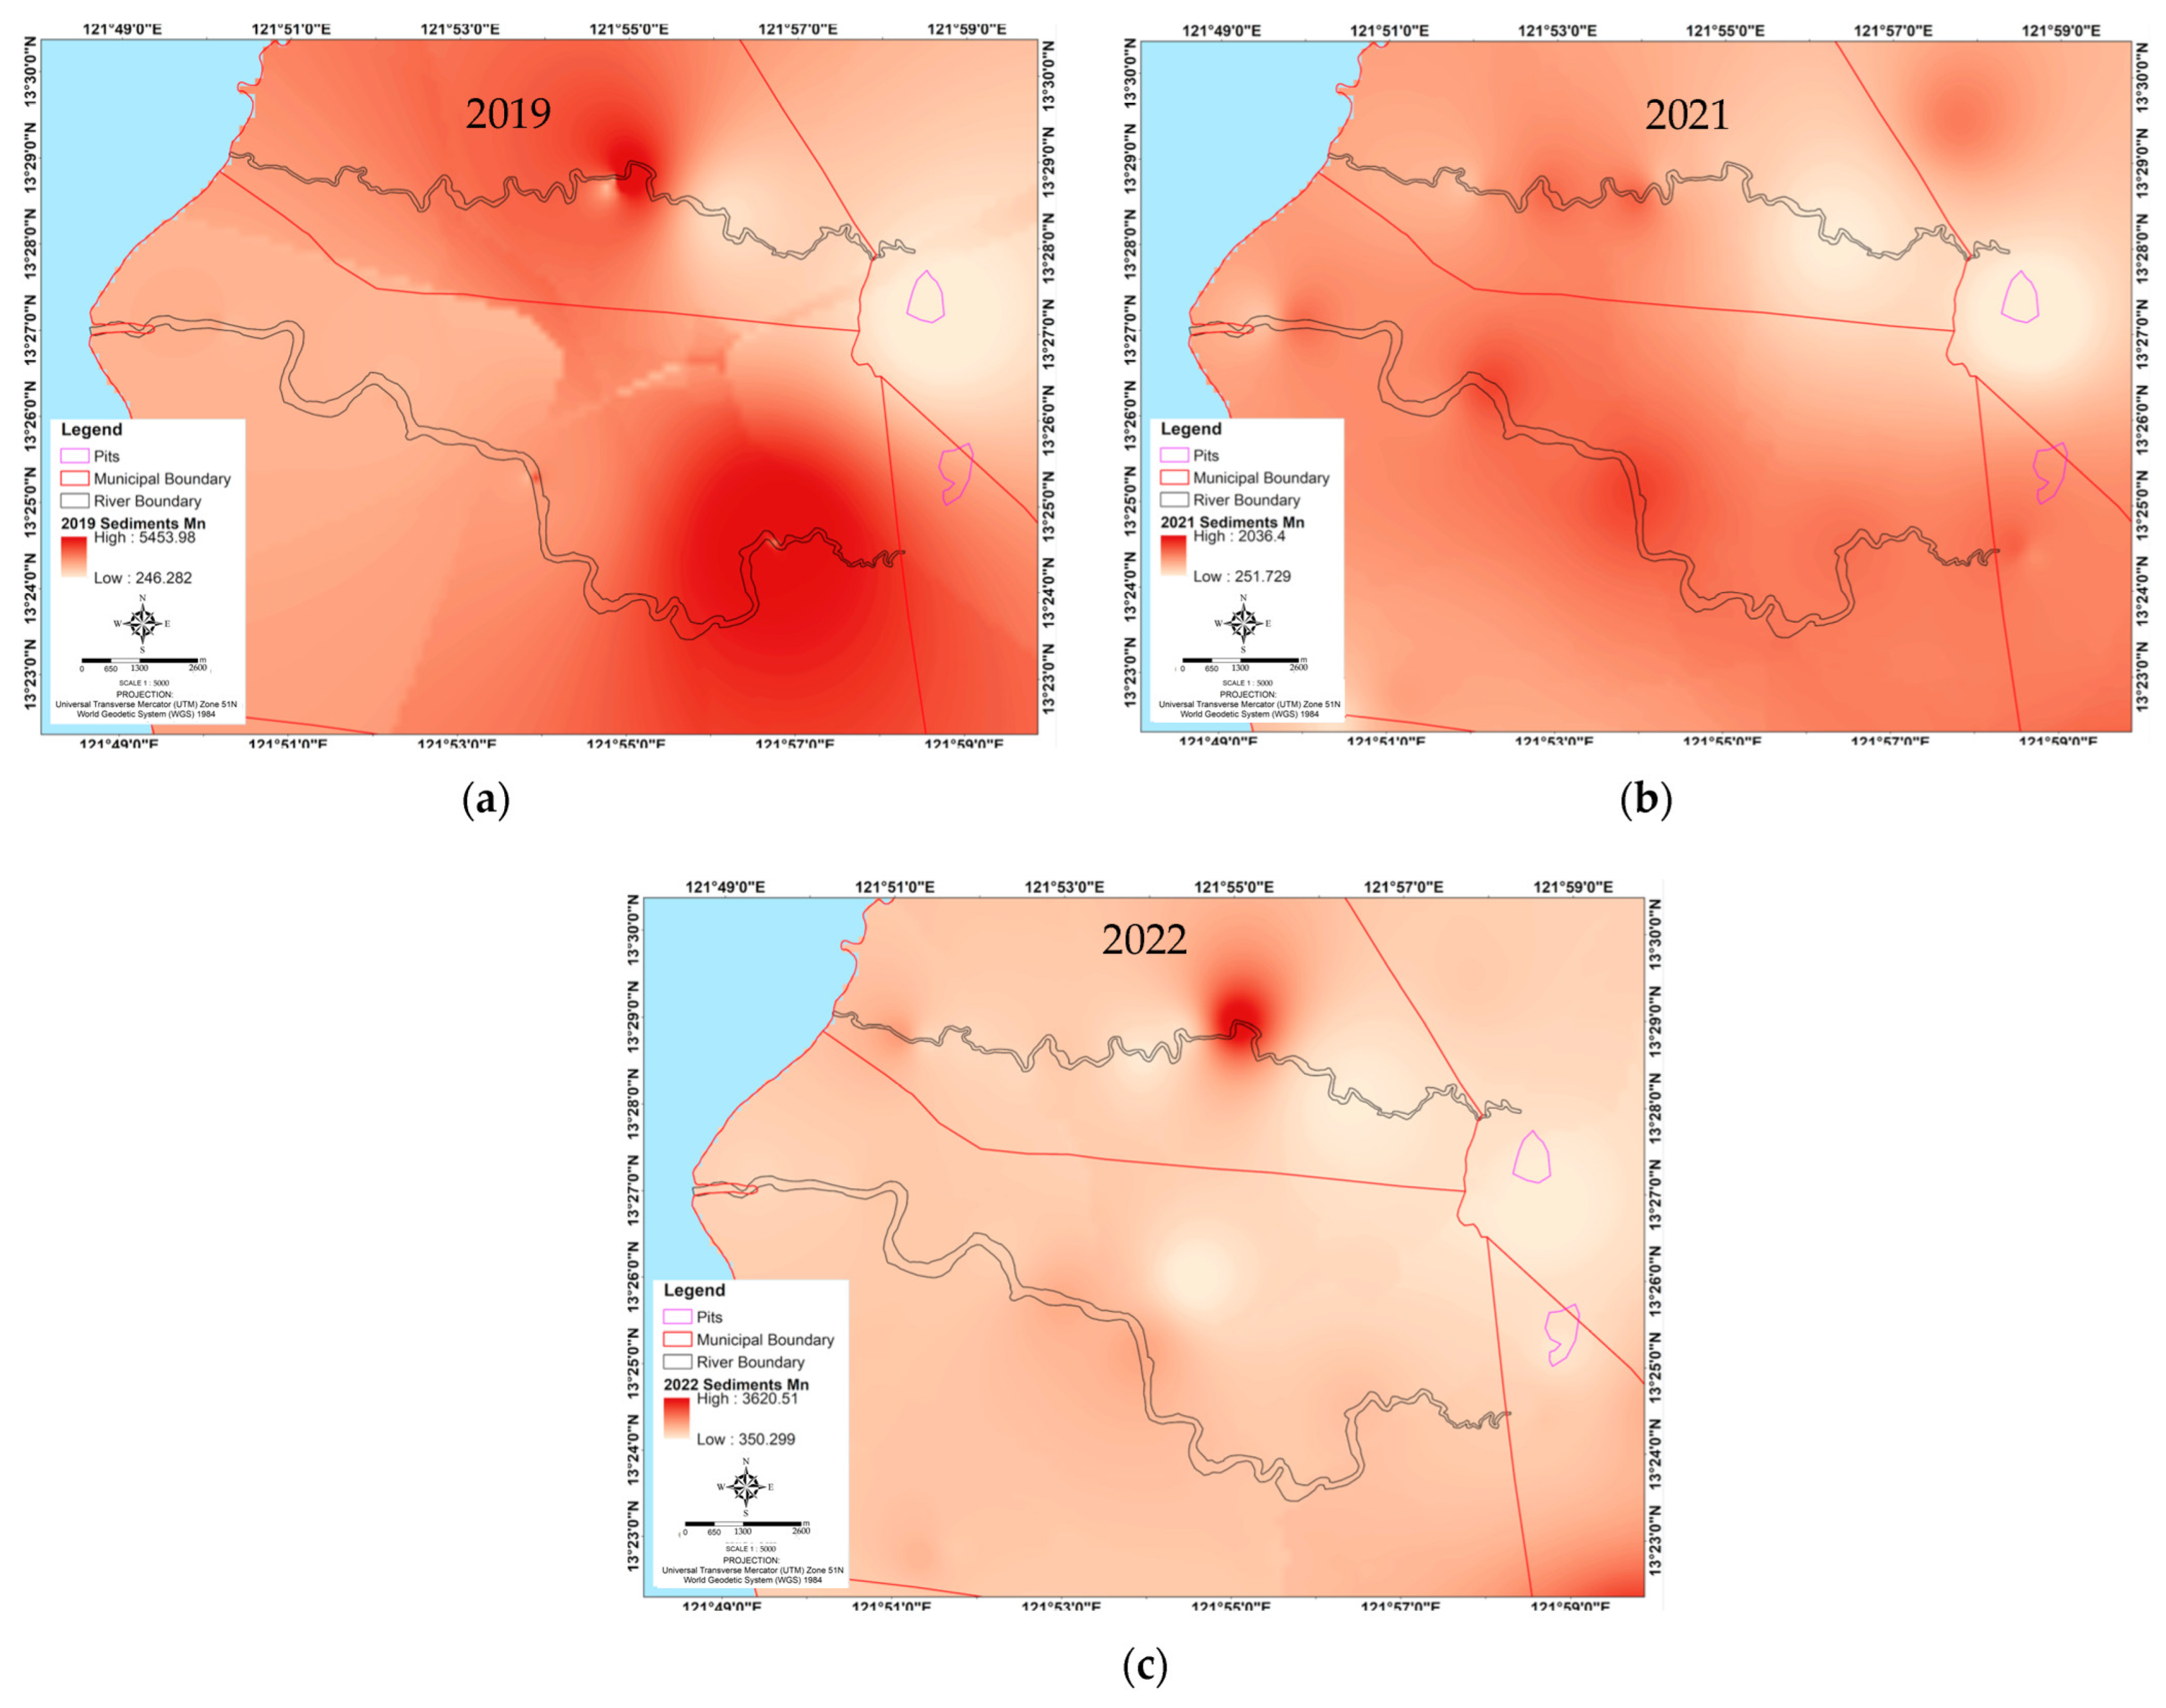
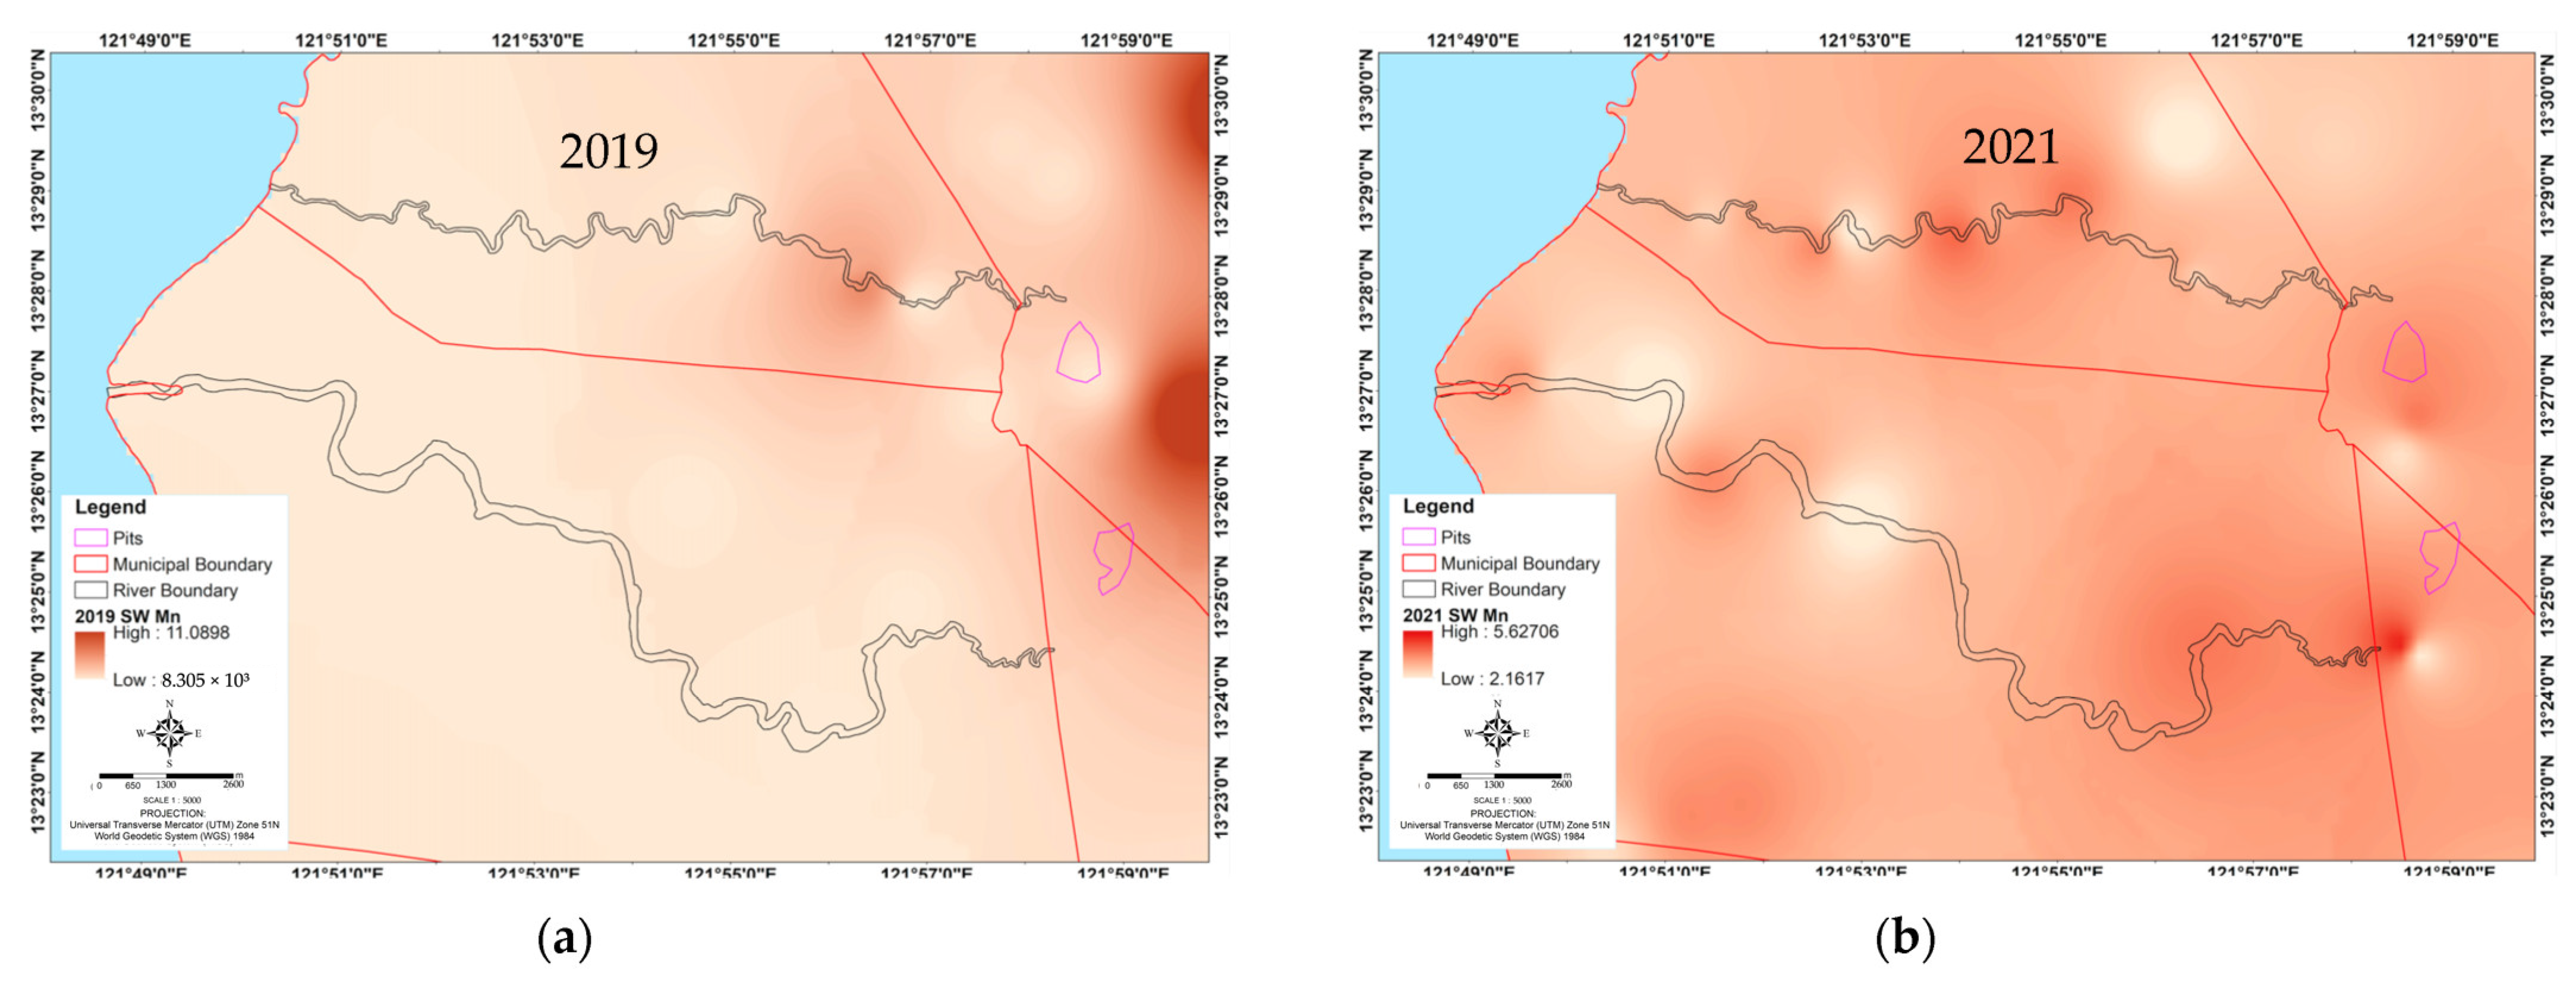
Appendix A.1. Spatial Mapping of Manganese

Plan-view spatial maps of Mn concentrations measured in both sediment and SW for 2019, 2021, and 2022 are presented in Figure A1 and Figure A2. As shown in the spatial maps, higher levels of Mn are concentrated on the bends in the river, especially Mogpog, which supports the relationship between Mn concentration and river planform. It is also evident that the physicochemical properties of SW, such as pH, are related to Mn accumulation.
Figure A1. Plan-view spatial maps of Mn in sediments around Mogpog and Boac rivers for (a) 2019, (b) 2021, and (c) 2022.
Sustainability 15 08276 g0a1
Figure A2. Plan-view spatial maps of Mn in surface water around Mogpog and Boac rivers for (a) 2019, and (b) 2021.
Sustainability 15 08276 g0a2

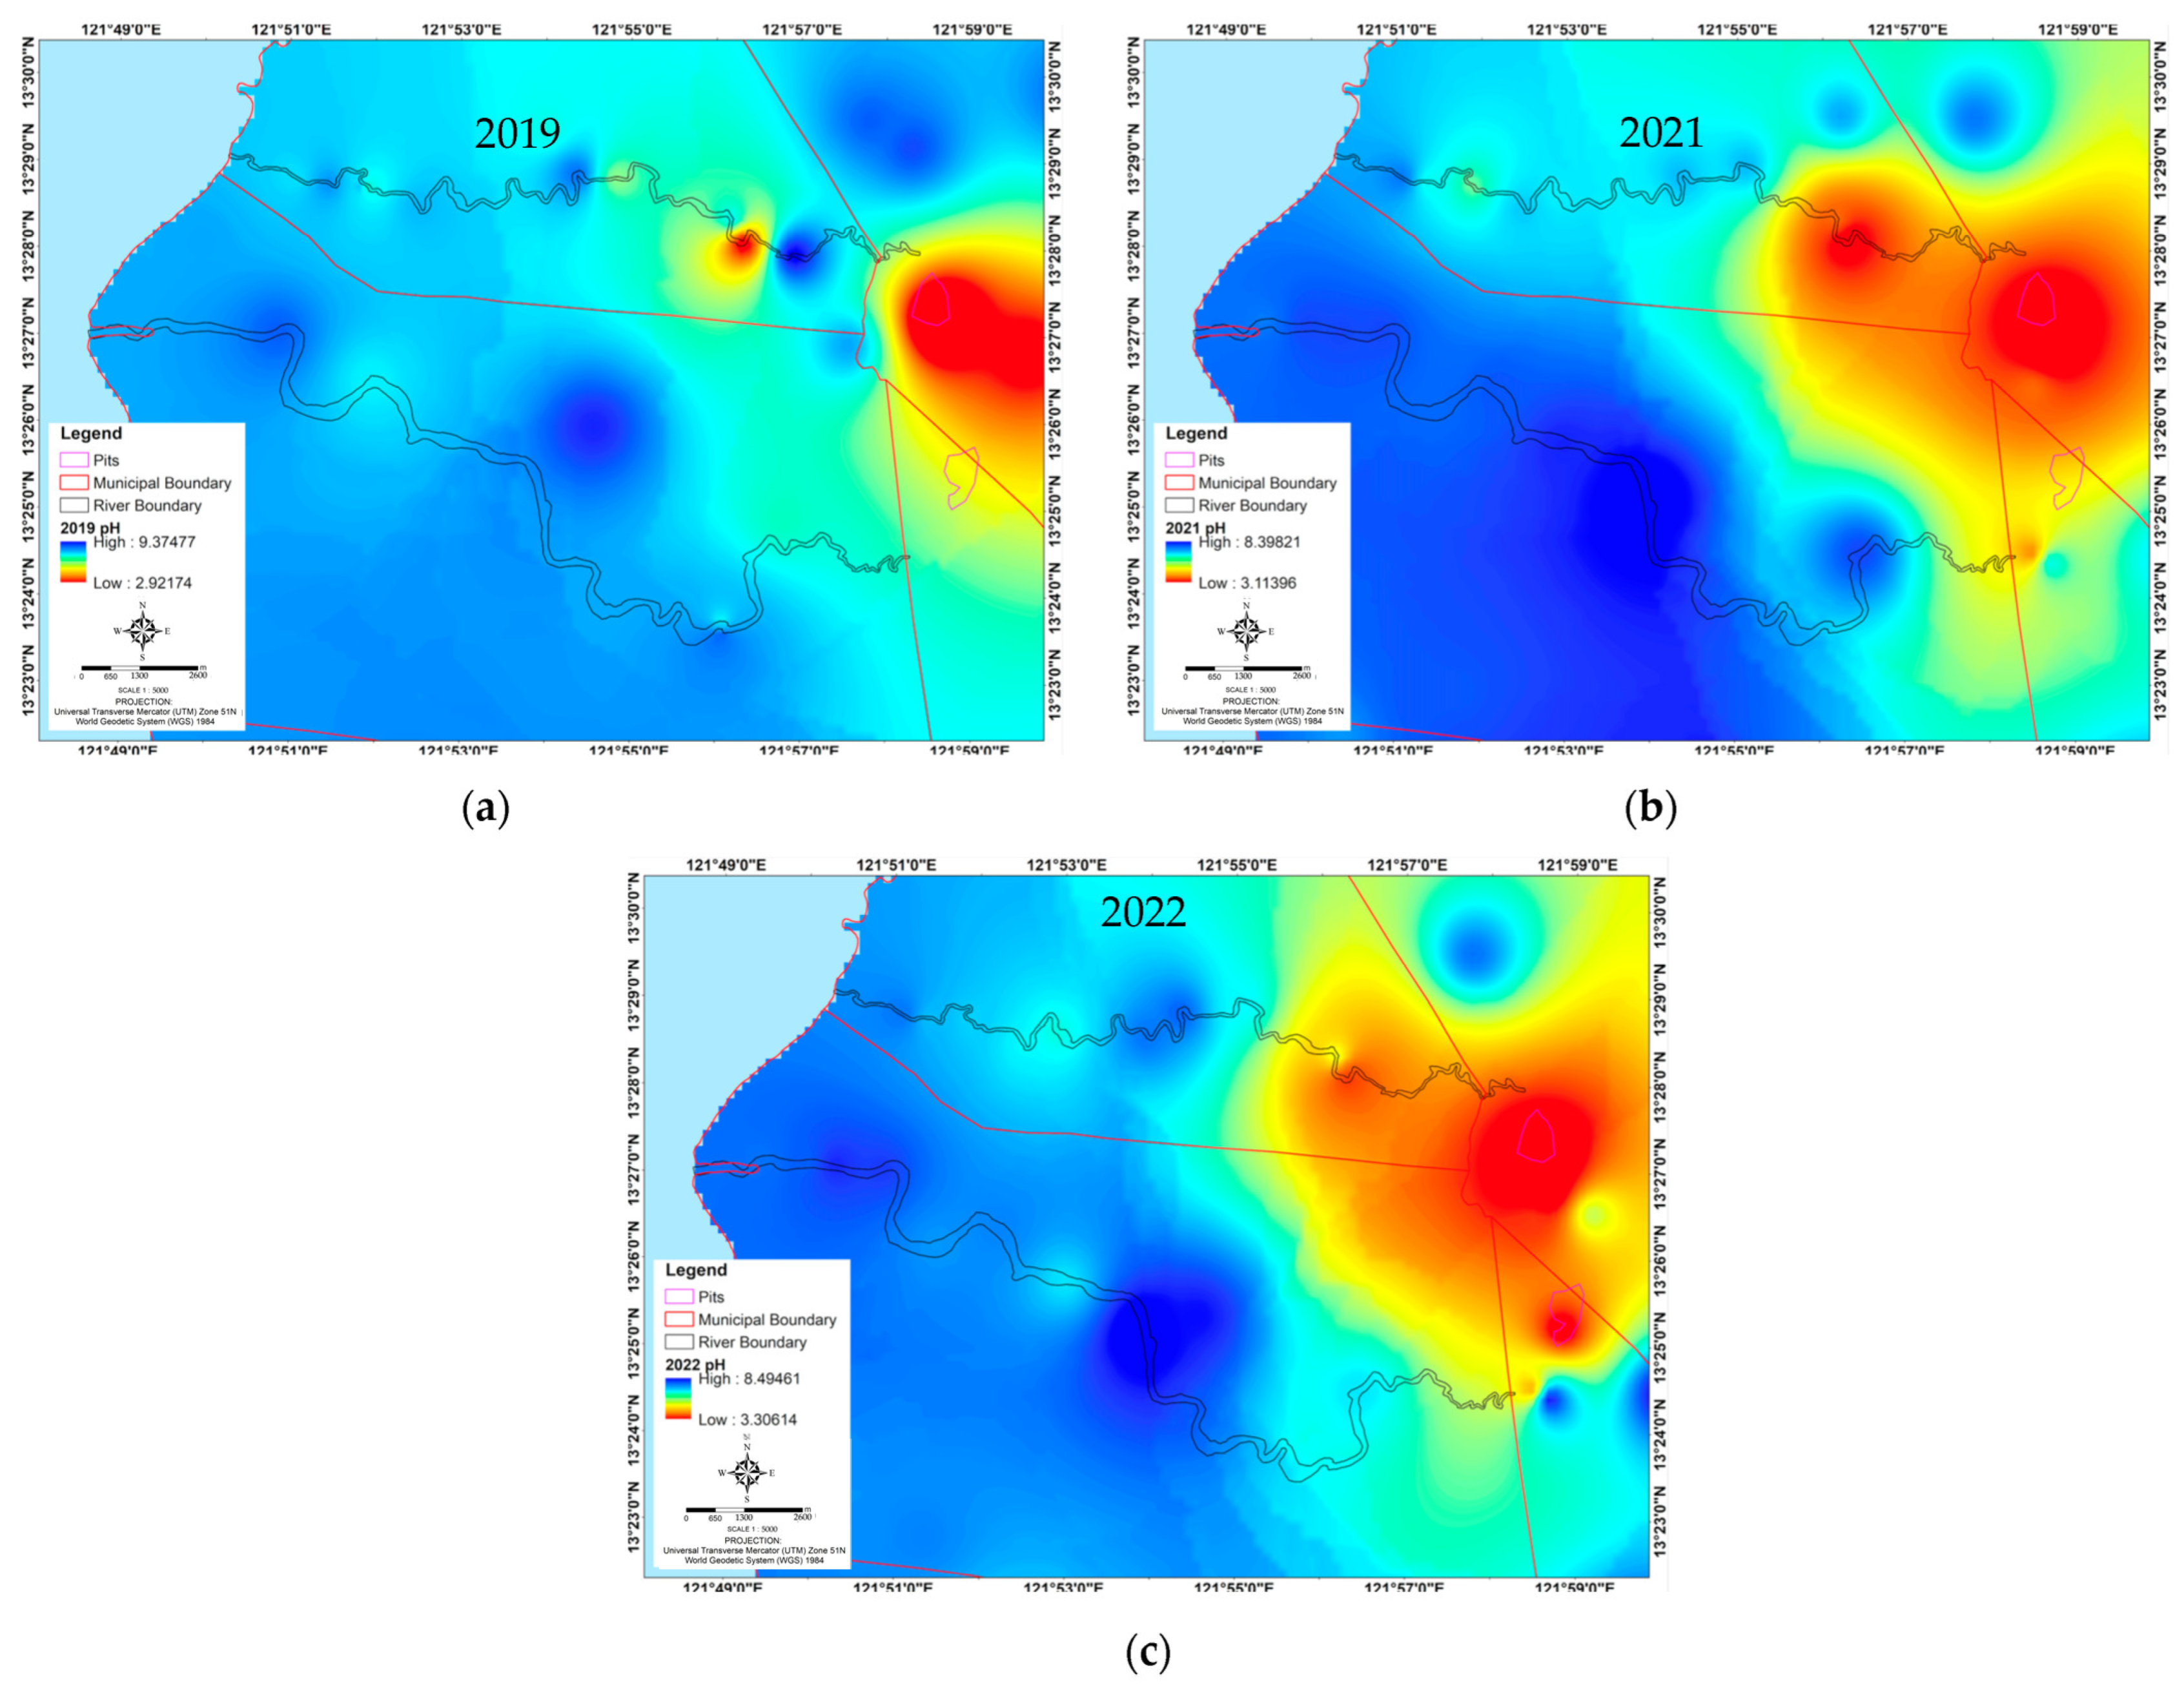
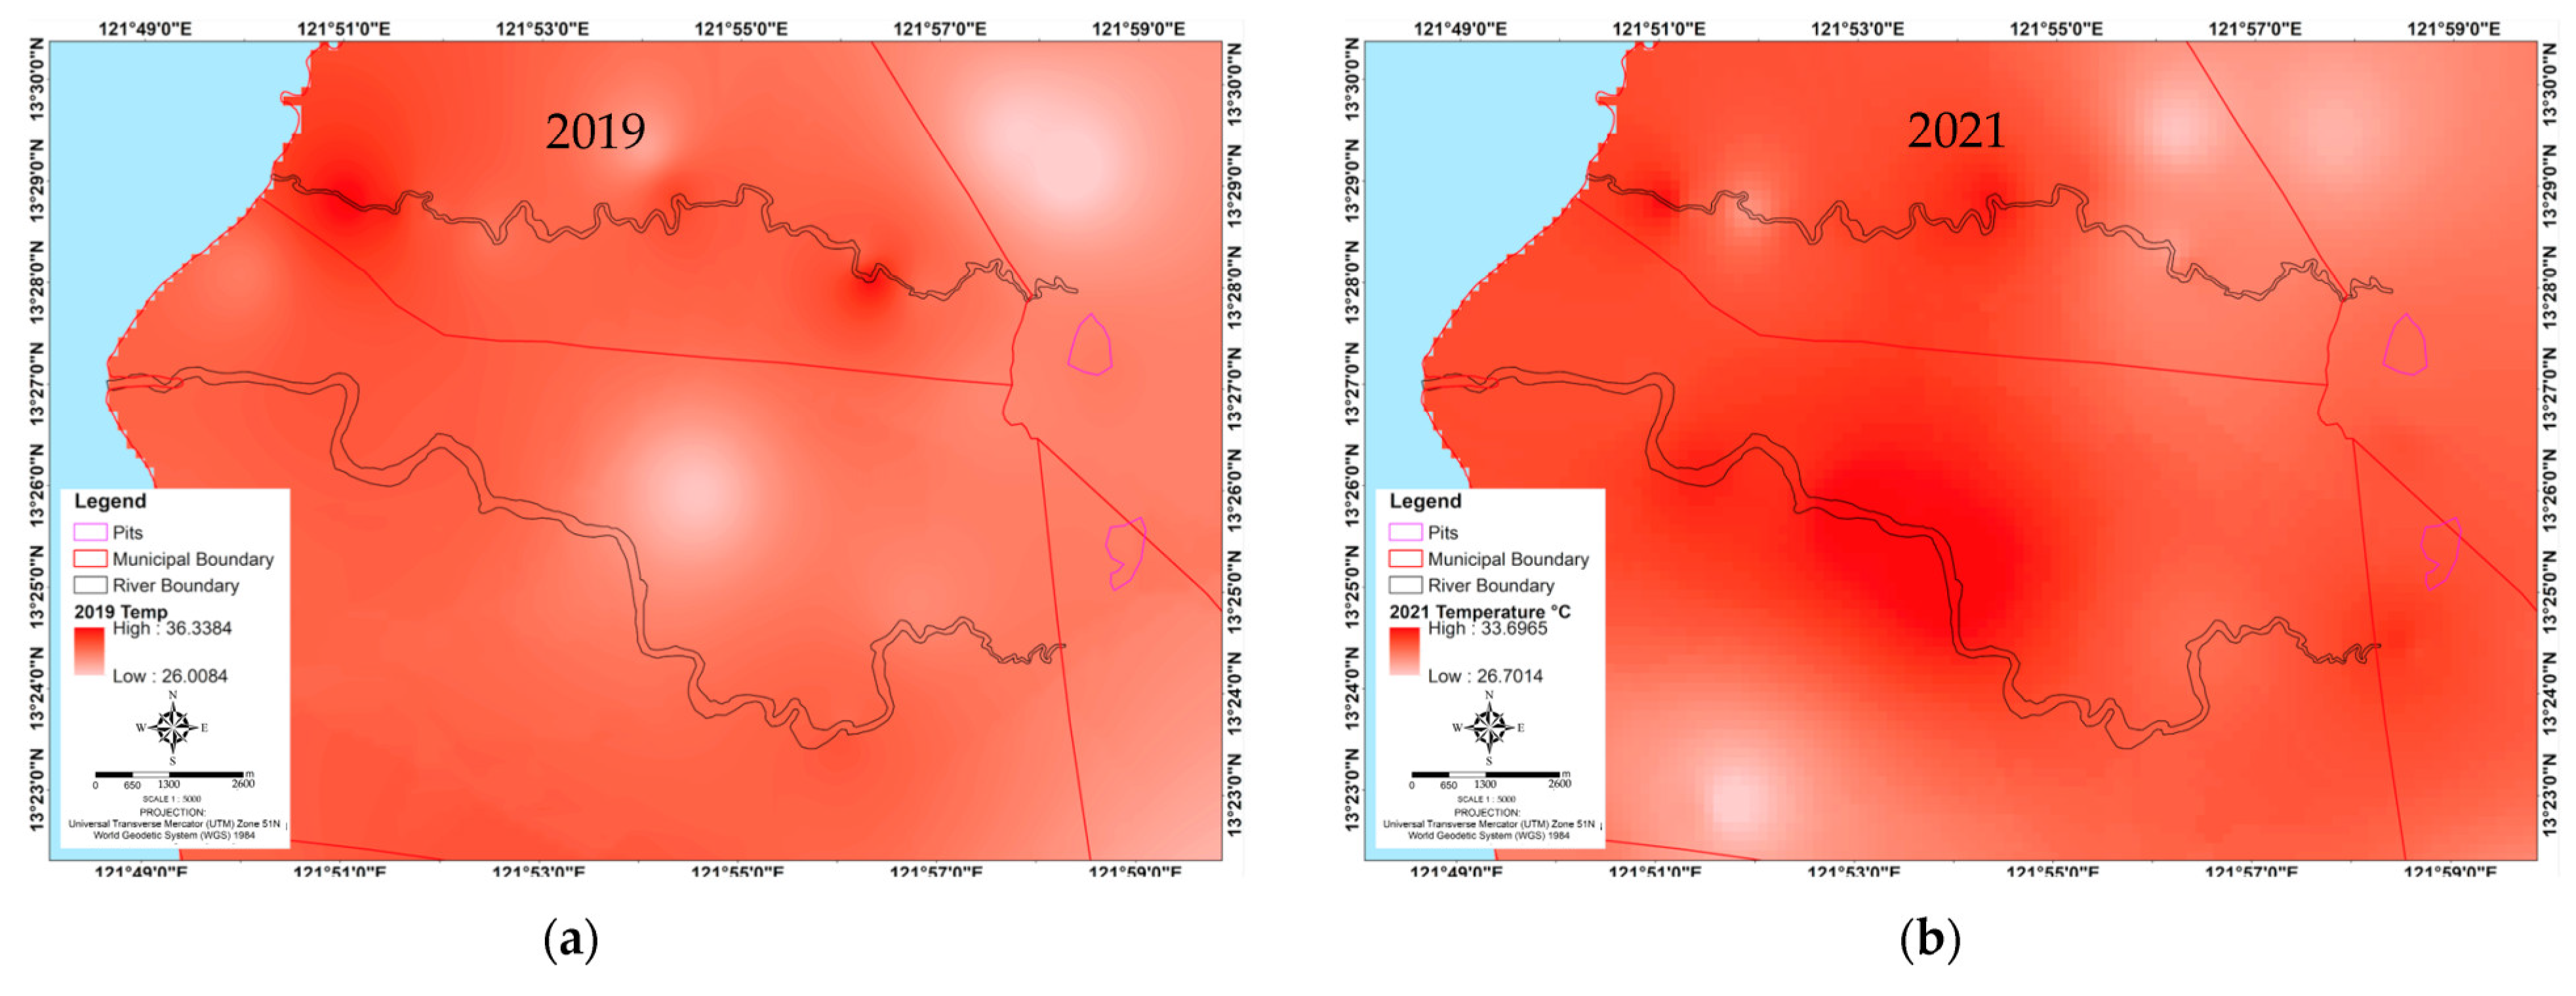
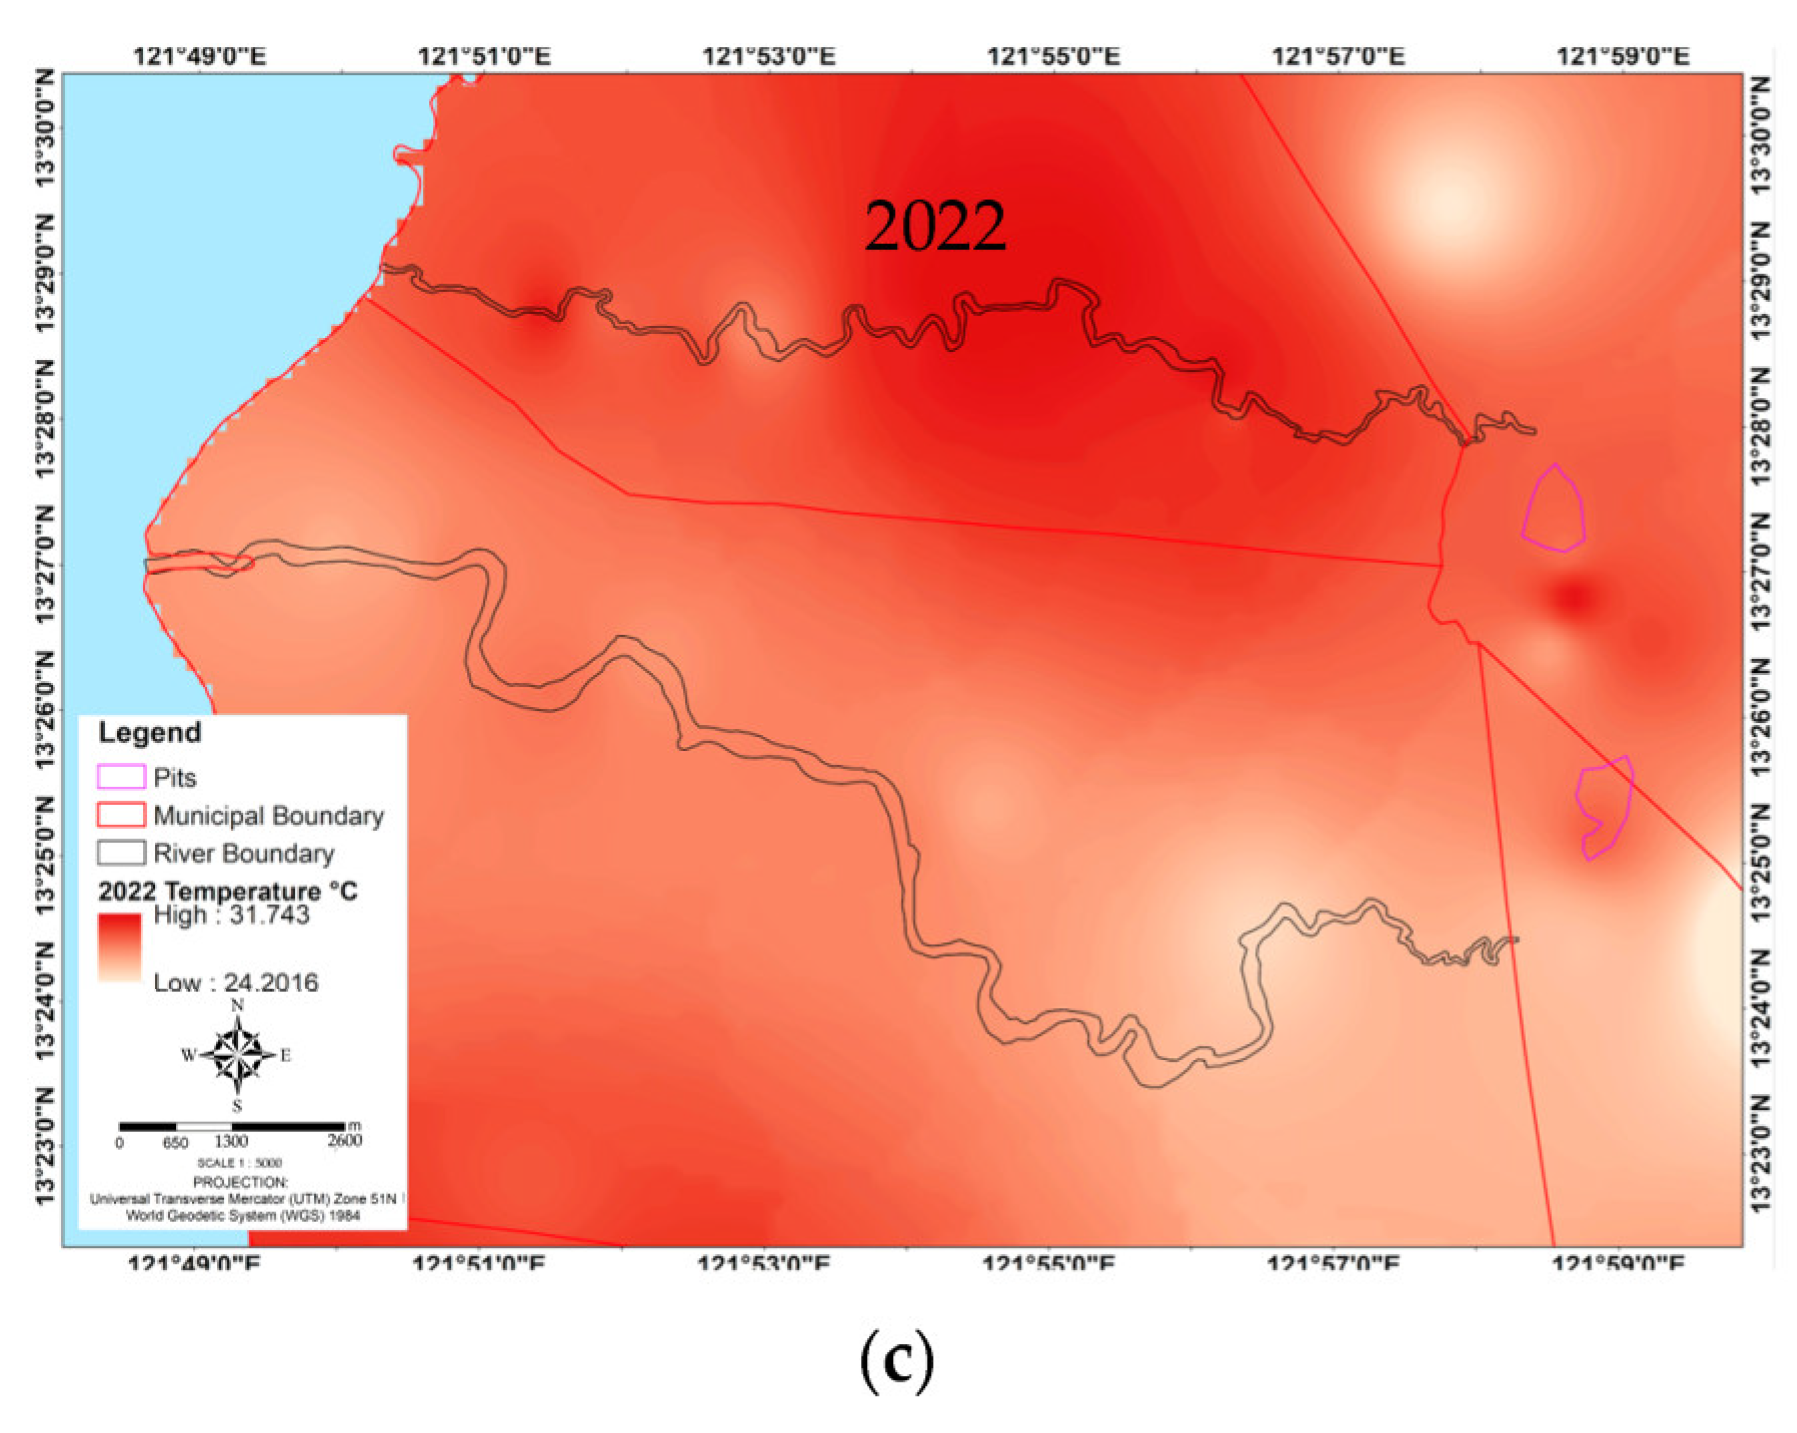
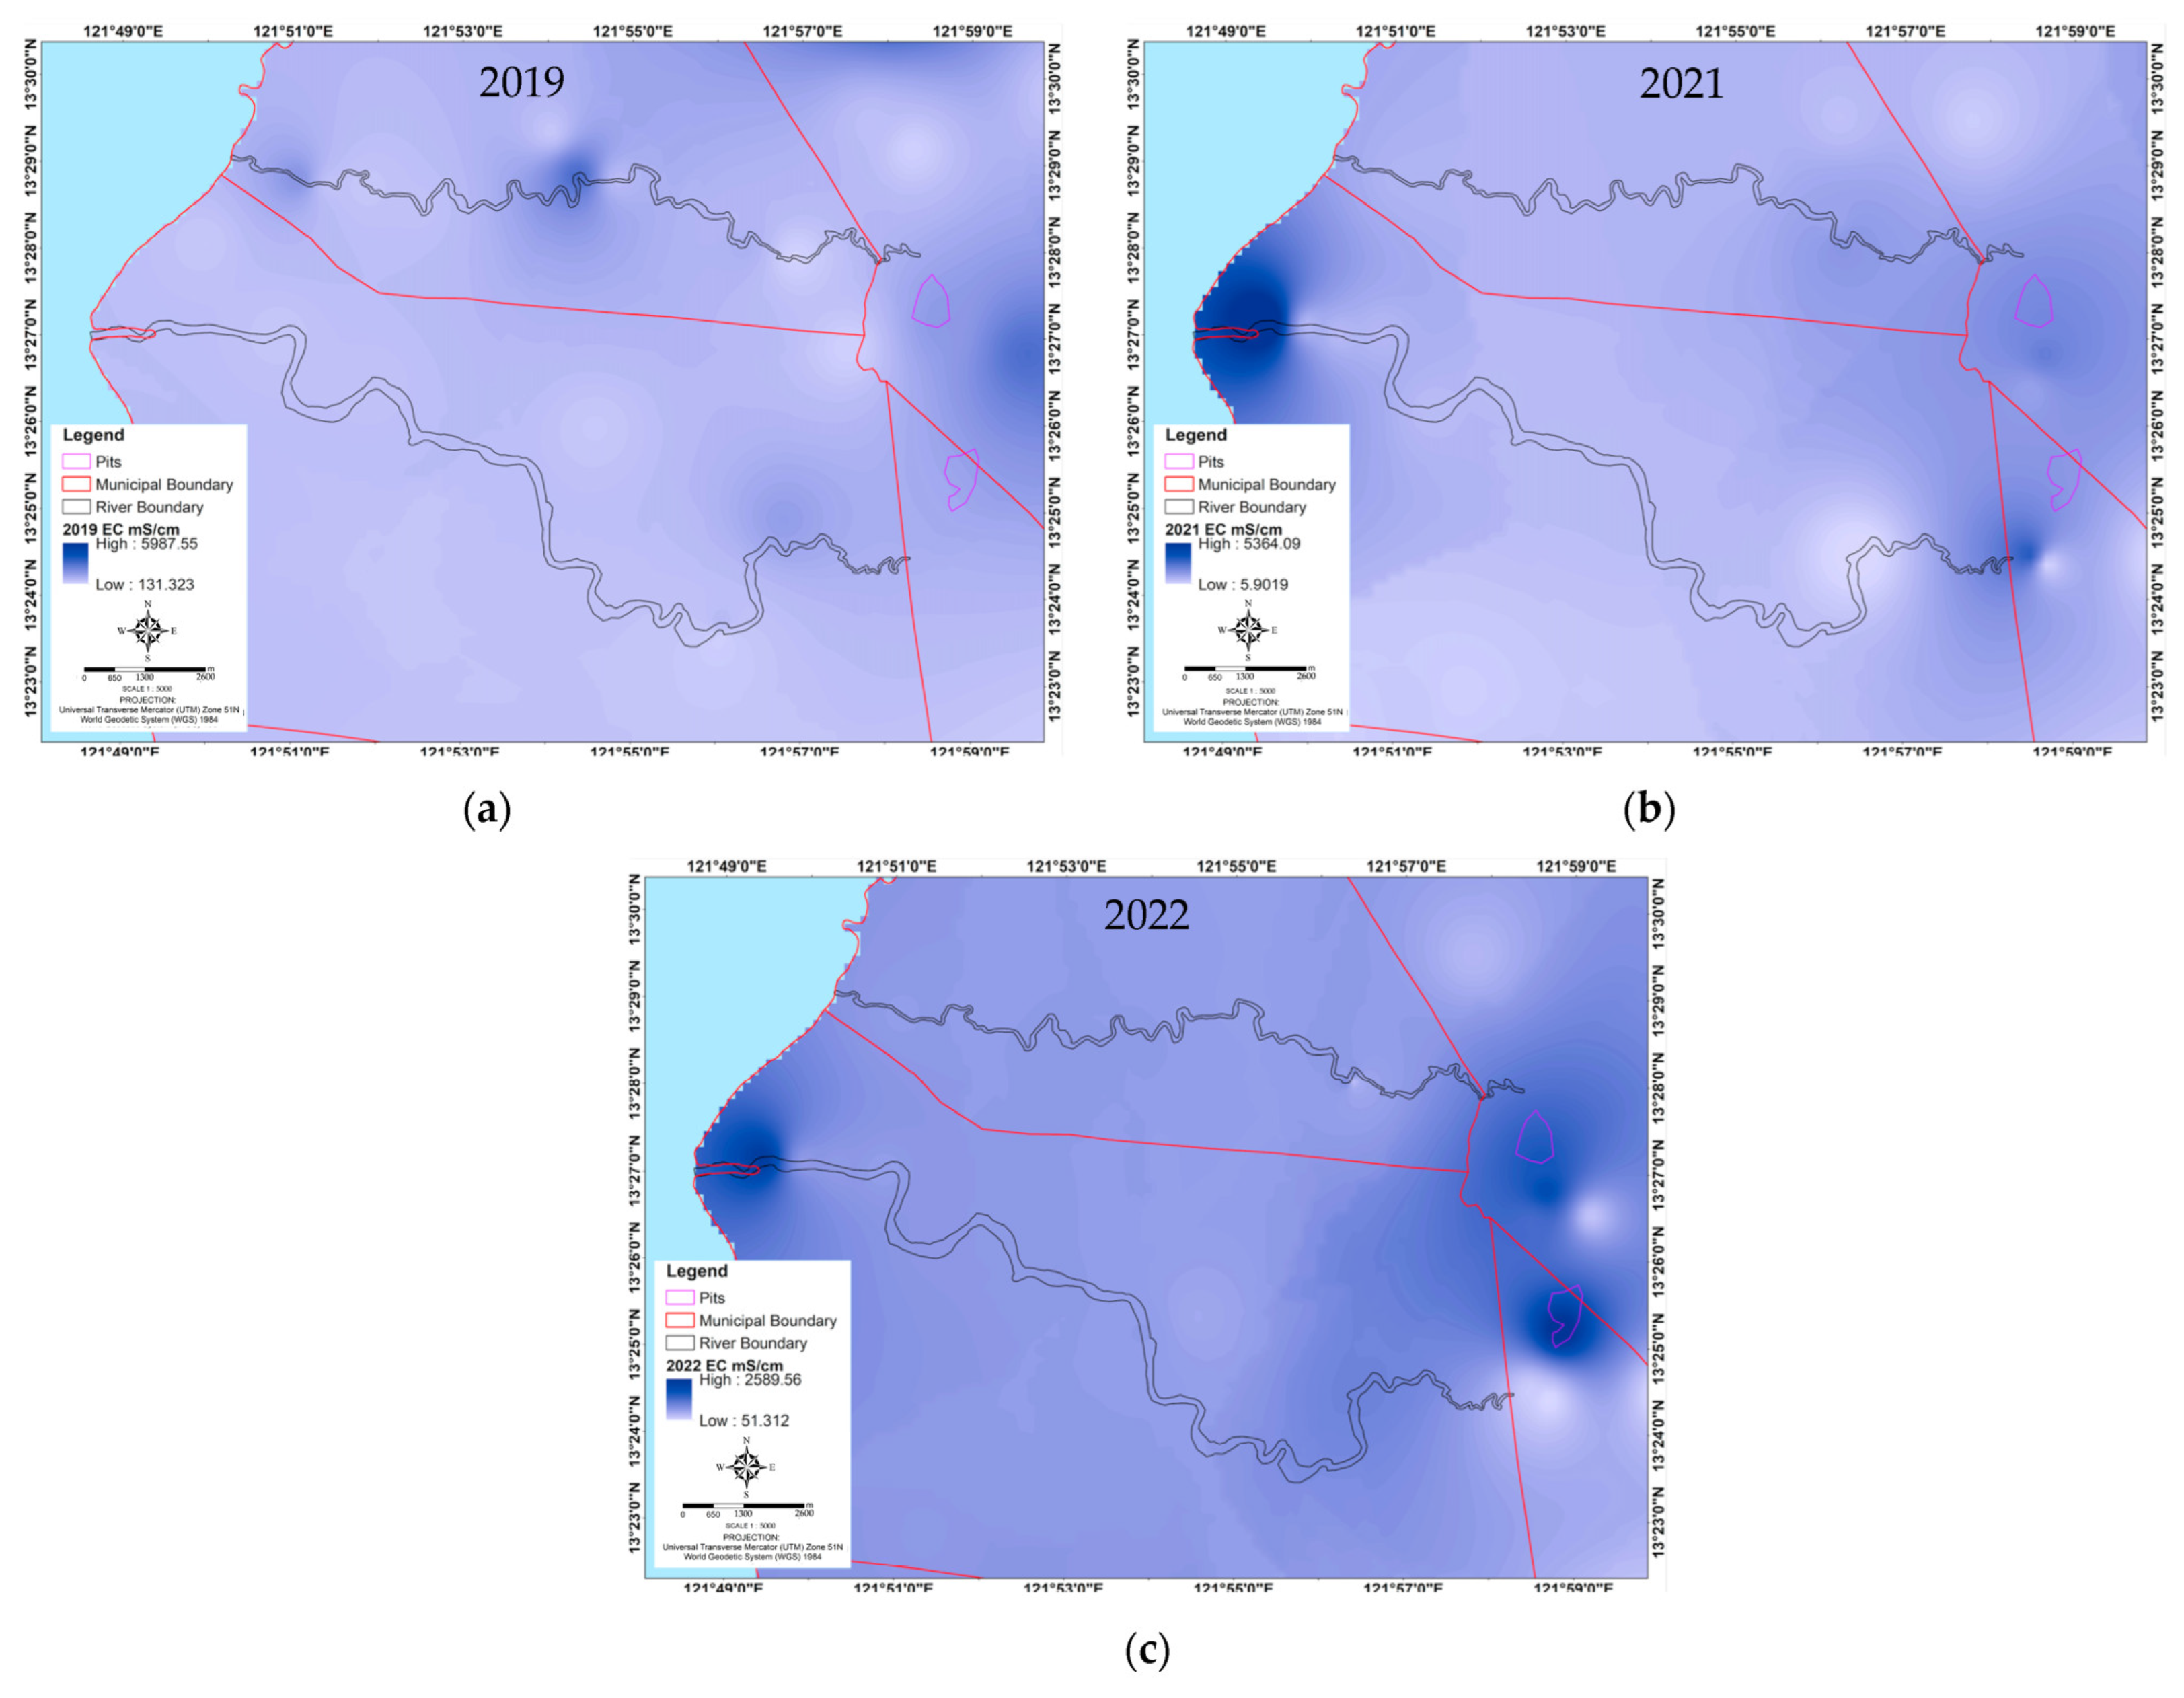
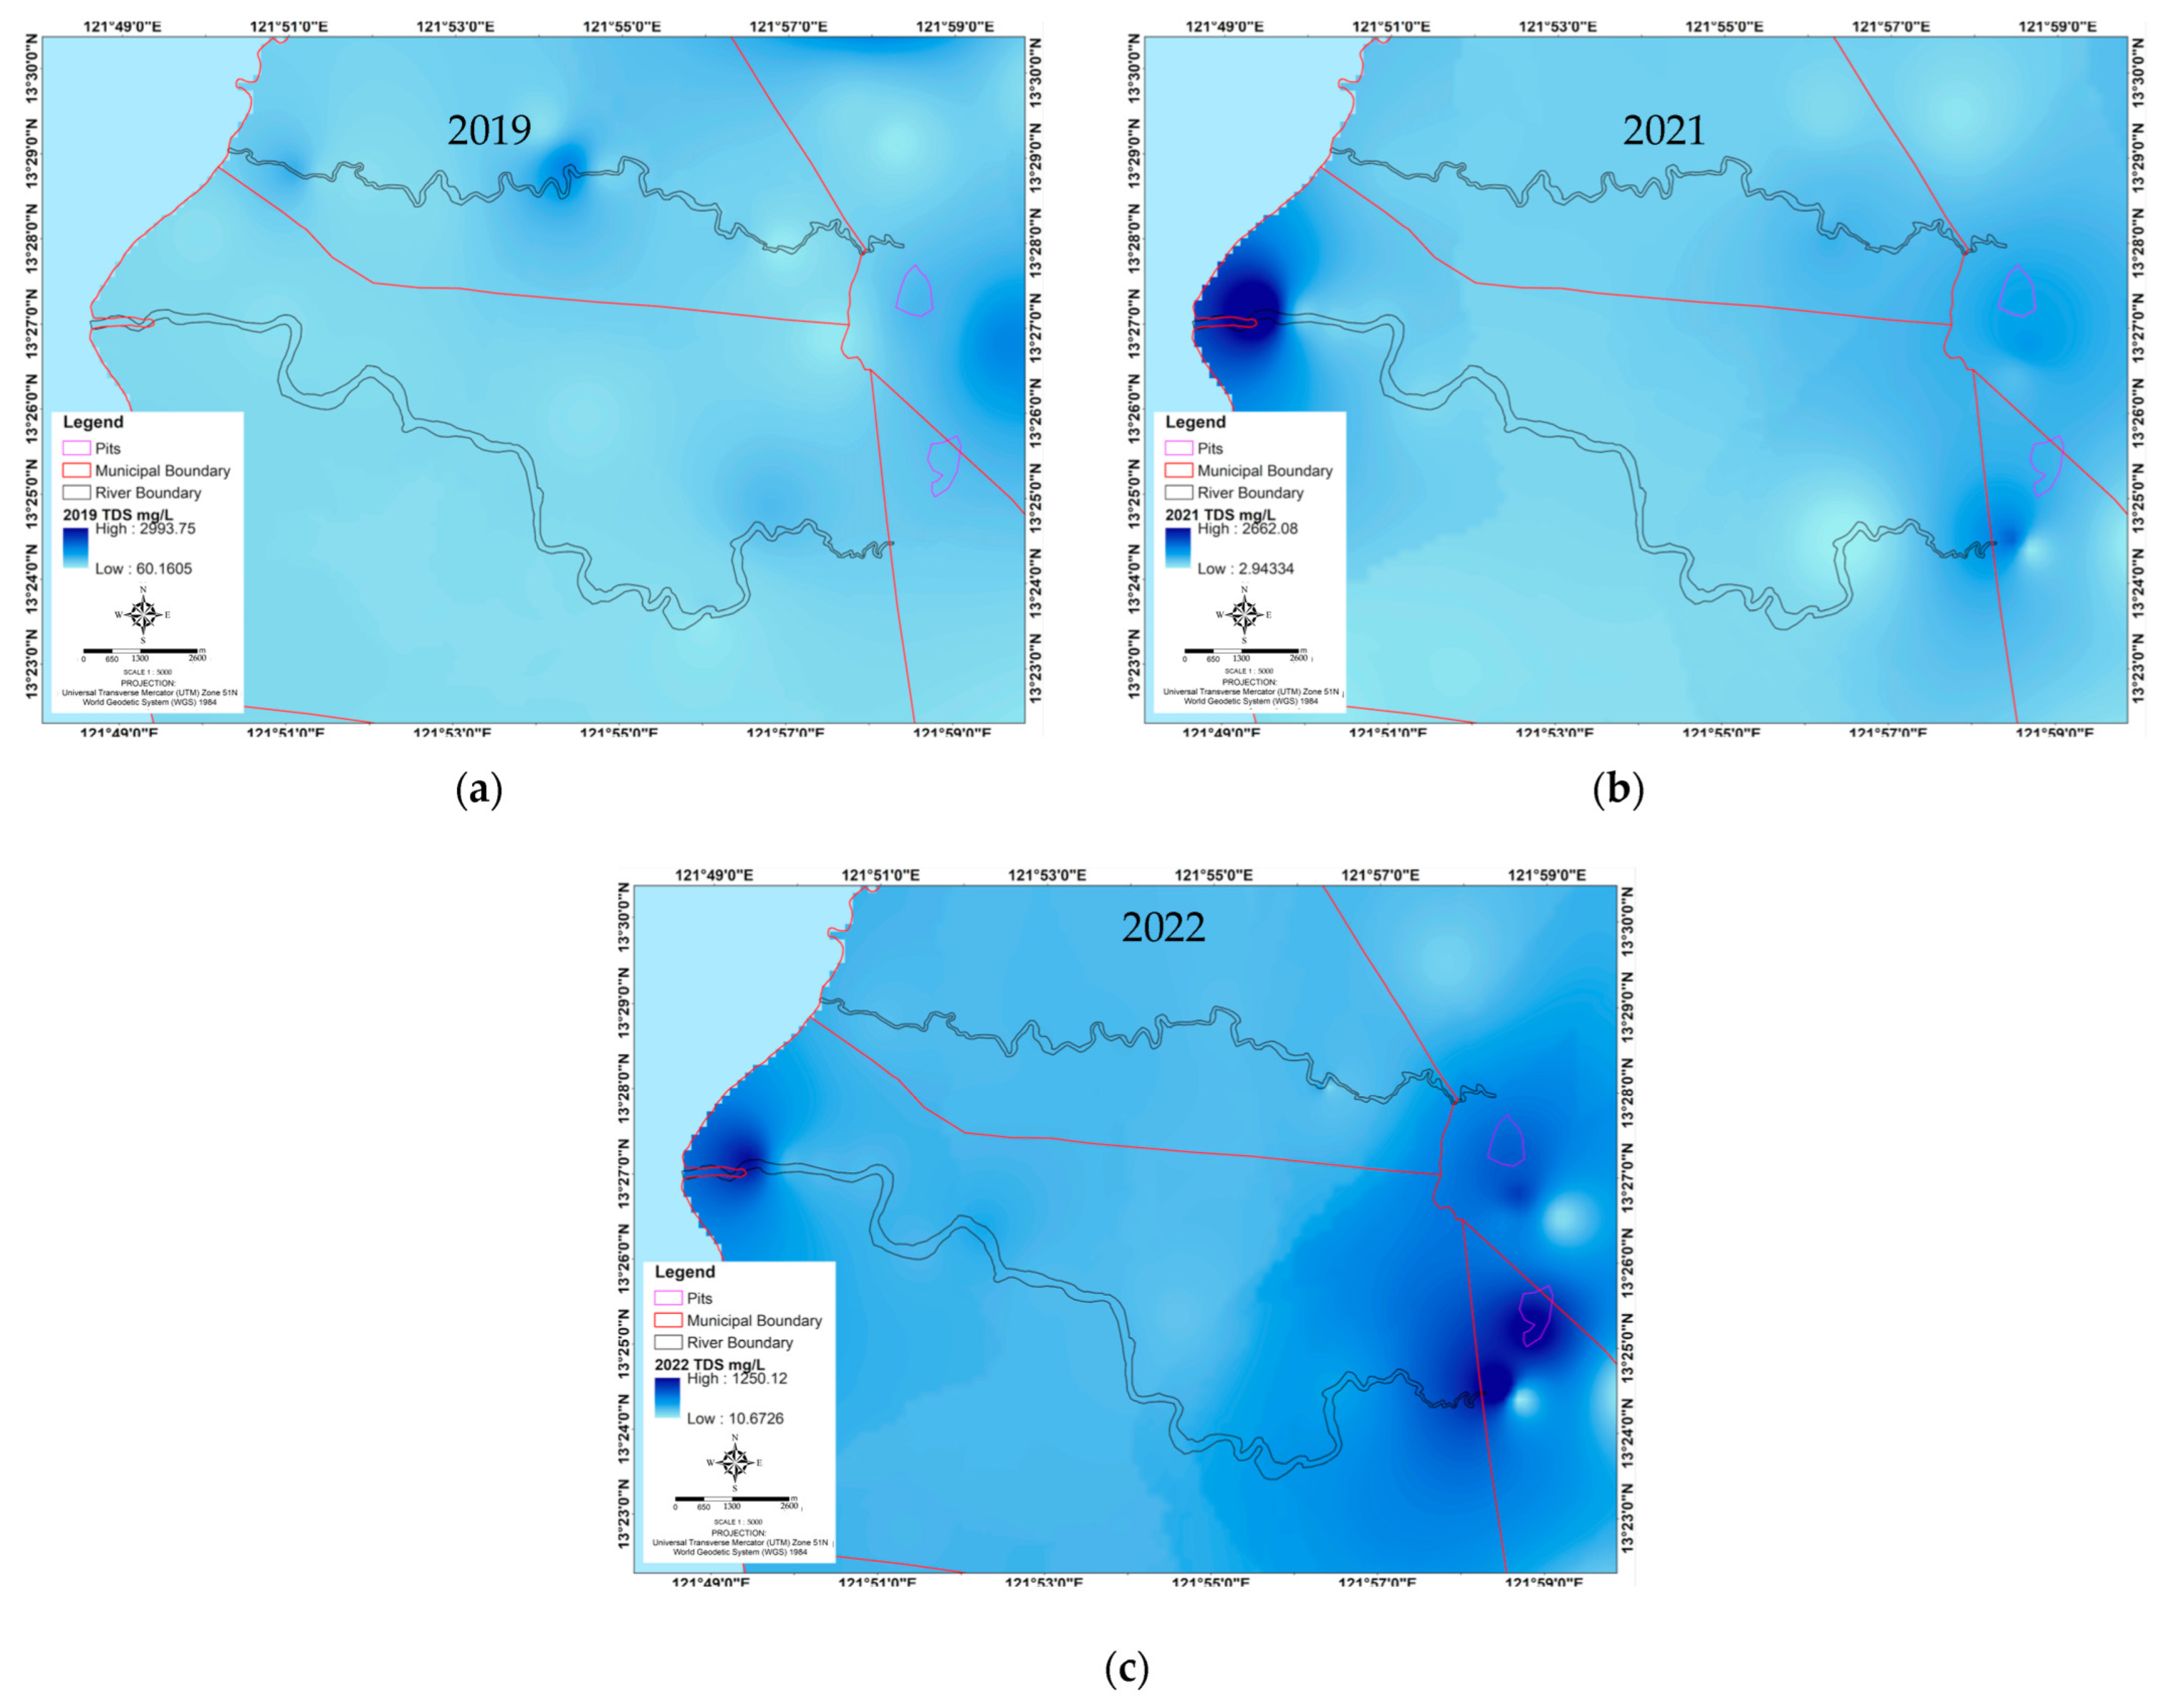
Appendix A.2. Spatial Mapping of pH, Temperature, EC and TDS

Plan-view spatial maps of pH, temperature, EC, and TDS are presented in Figure A3, Figure A4, Figure A5 and Figure A6.
Figure A3. Plan-view spatial maps of pH in SW for (a) 2019, (b) 2021, and (c) 2022.
Sustainability 15 08276 g0a3
Figure A4. Plan-view spatial maps of temperature in SW for (a) 2019, (b) 2021, and (c) 2022.
Sustainability 15 08276 g0a4aSustainability 15 08276 g0a4b
Figure A5. Plan-view spatial maps of EC in SW for (a) 2019, (b) 2021, and (c) 2022.
Sustainability 15 08276 g0a5
Figure A6. Plan-view spatial maps of TDS in SW for (a) 2019, (b) 2021, and (c) 2022.
Sustainability 15 08276 g0a6

Appendix A.3. Summary of Statistics for Sediment and Surface Water Parameters

Table A1 and Table A2 presents the statistics of the measured parameters for each year in Mogpog and Boac rivers, respectively, for sediment Mn, SW Mn, and the pH, temperature, EC and TDS of SW. Mogpog river exhibited the highest average reading of sediment Mn (1504.67 mg/kg) in 2019, while it had the highest average SW Mn (3.01 mg/L) in 2021. Similarly, Boac river had its highest average sediment Mn of 1830.04 mg/kg in 2019, with the highest average SW Mn of 3.00 mg/L in 2021. The USEPA limit for sediment Mn and SW Mn is 300 mg/L and 0.05–0.3 mg/L, respectively. Therefore, it is evident that the 2019 sediment Mn and 2021 SW Mn for both Mogpog and Boac were almost 10 times greater the limit, highlighting the scale of the problem.
Table A1. Summary of the statistics for the sample results from Mogpog river.
Year Mn in Sediments (mg/kg)Mn in
SW (mg/L)
pHTemperature
°C
EC
(mS/cm)
TDS
(mg/L)
2019Max2948.613.407.9434.162222.81102.05
Min590.000.0245.4229.63398.45193.60
Mean1504.670.7526.9131.61949.13466.18
2021Max1091.063.377.1732.491004.7489.32
Min409.722.743.7429.62573.94274.02
Mean733.633.015.9031.00713.5345.08
2022Max2438.96-7.5730.12751.06383.81
Min452.854.6828.42471.3223.30
Mean967.266.4129.17513.9247.18
Table A2. Summary of the statistics for the sample results from Boac river.
Year Mn in Sediments (mg/kg)Mn in
SW (mg/L)
pHTemperature
°C
EC
(mS/cm)
TDS
(mg/L)
2019Max3068.780.8757.7031.681160.98570.27
Min1107.040.0076.6329.95539.15258.00
Mean1830.040.1347.2730.85705.94342.28
2021Max1287.083.498.2733.454134.192052.22
Min726.472.365.1730.55140.7465.03
Mean1067.543.007.3731.78840.07409.24
2022Max1270.80-8.2728.221283.63671.59
Min792.035.9126.48373.57228.71
Mean990.407.3127.48595.88338.08
The lowest pH readings were detected in 2021 (3.74) and 2022 (4.68) in Mogpog, which were also below WHO limits. Low pH readings were also detected in both abandoned mine pits.
In Mogpog river, average termperatures measured for 2019, 2021 and 2022 were 31.61 °C, 31.00 °C and 29.17 °C, respectively, while in Boac river it was 30.85 °C, 31.78 °C, and 27.48 °C, respectively. The average EC in Mogpog river was 949.13 mS/cm, 713.50 mS/cm, and 513.9 mS/cm for 2019, 2021 and 2022, respectively, while in Boac River, it was 705.94 mS/cm, 840.07 mS/cm, and 595.88 mS/cm, respectively. These average EC readings were below the WHO limits of 1500 mS/cm, though some segments were above the limits such as 4134.19 mS/cm in Boac river in 2021, and 2222.80 mS/cm in Mogpog river in 2019. The average TDS along Mogpog river had an average reading of 466.18 mg/L, 345.08 mg/L, and 247.18 mg/L for 2019, 2021, and 2022, respectively, while the average TDS along Boac river was 342.28 mg/L, 409.24 mg/L, and 338.08 mg/L, respectively. The WHO limit for TDS is 1200 mg/L, so all TDS readings in both rivers are acceptable, except for a single segment in Boac river in 2021.
Table A3. Correlation coefficients between sediment Mn and SW Mn and SW pH/temperature/EC/TDS and morphology in Mogpog river.
Temp.ECpHTDSRiver SlopeRiver BendsChannel WidthChannel LengthSinuosity
Sed20190.1310.3360.1660.337−0.5850.3920.0600.2230.361
20210.712−0.7890.801−0.784−0.6750.3060.2850.2320.404
20220.415−0.2870.360−0.305−0.4010.370−0.1470.5050.293
Average0.420−0.2470.443−0.251−0.5540.3560.0660.3200.352
SW2019−0.063−0.100−0.771−0.0980.6080.2450.207−0.0550.234
20210.193−0.1940.144−0.190−0.0440.265−0.1940.2580.281
Average0.065−0.147−0.313−0.1440.2820.2550.0060.1020.257
Table A4. Correlation coefficients between sediment Mn and SW Mn to pH/temperature/EC/TDS and morphology in Boac river.
Temp.ECpHTDSRiver SlopeRiver BendsChannel WidthChannel LengthSinuosity
Sed2019−0.4170.588−0.1190.5850.7410.395−0.5190.2230.385
20210.432−0.7350.202−0.7350.0860.3850.0540.3380.450
20220.187−0.5050.201−0.557−0.0660.4820.1020.1140.374
Average0.067−0.2170.142−0.2360.2540.421−0.1210.2250.403
SW2019−0.5300.528−0.6370.5280.8110.641−0.6980.4110.475
2021−0.4980.003−0.5740.0070.6220.314−0.3410.2580.536
Average−0.5140.266−0.6060.2680.7160.478−0.5190.3340.505

Appendix B

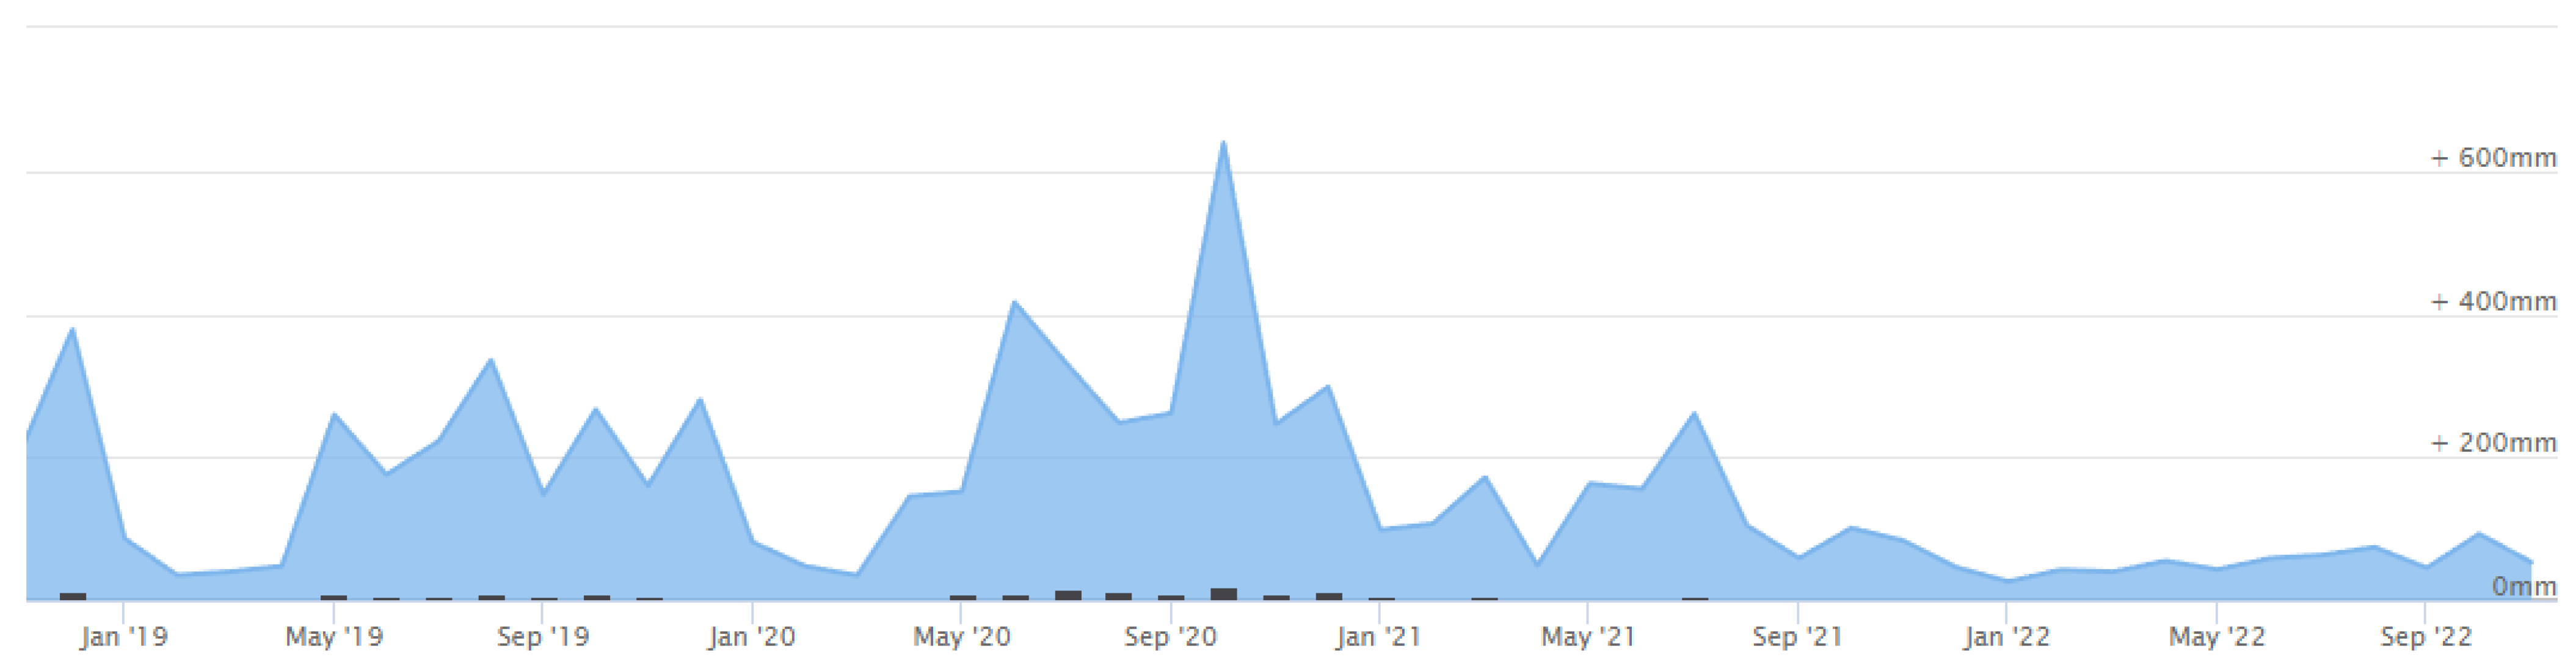
Appendix B.1. Precipitation Records

Figure A7 plots the rainfall amount from 2019 to 2022.
Figure A7. Average rainfall (mm) from 2019 to 2022 (source: https://www.worldweatheronline.com/mogpog-weather-averages/marinduque/ph.aspx (accessed on 15 January 2023) [95].
Sustainability 15 08276 g0a7

References

  1. The Marcopper Toxic Mine Disaster-Philippines’ Biggest Industrial Accident. Available online: https://twn.my/title/toxic-ch.htm (accessed on 22 November 2022).
  2. The Marcopper Mine Spill and the Unending Wait for Justice. Available online: https://news.abs-cbn.com/news/04/02/19/the-marcopper-mine-spill-and-the-unending-wait-for-justice (accessed on 22 November 2022).
  3. David, C. Heavy metal concentrations in marine sediments impacted by a mine-tailings spill, Marinduque Island, Philippines. Environ. Geol. 2002, 42, 955–965. [Google Scholar]
  4. Senoro, D.B.; de Jesus, K.L.M.; Yanuaria, C.A.; Bonifacio, P.B.; Manuel, M.T.; Wang, B.N.; Kao, C.C.; Wu, T.N.; Ney, F.P.; Natal, P. Rapid site assessment in a small island of the Philippines contaminated with mine tailings using ground and areal technique: The environmental quality after twenty years. In IOP Conferences Series: Earth and Environmental Science; IOP Publishing: Bristol, UK, 2019; Volume 351, p. 012022. [Google Scholar]
  5. Environmental Justice Case in the Philippines. Available online: https://websites.umich.edu/~snre492/Jones/marcopper.htm (accessed on 25 November 2022).
  6. Agarin, C.J.M.; Mascareñas, D.R.; Nolos, R.; Chan, E.; Senoro, D.B. Transition Metals in Freshwater Crustaceans, Tilapia, and Inland Water: Hazardous to the Population of the Small Island Province. Toxics 2021, 9, 71. [Google Scholar] [CrossRef] [PubMed]
  7. Nolos, R.C.; Agarin, C.J.M.; Domino, M.Y.R.; Bonifacio, P.B.; Chan, E.B.; Mascareñas, D.R.; Senoro, D.B. Health Risks Due to Metal Concentrations in Soil and Vegetables from the Six Municipalities of the Island Province in the Philippines. Int. J. Environ. Res. Public Health 2022, 19, 1587. [Google Scholar] [CrossRef] [PubMed]
  8. Senoro, D.B.; Bonifacio, P.B.; Mascareñas, D.R.; Tabelin, C.B.; Ney, F.P.; Lamac, M.R.L.; Tan, F.J. Spatial distribution of agricultural yields with elevated metal concentration of the island exposed to acid mine drainage. J. Degrad. Min. Lands Manag. 2020, 8, 2551–2558. [Google Scholar] [CrossRef]
  9. Rovetta, F.; Catalani, S.; Steimberg, N.; Boniotti, J.; Gilberti, M.E.; Mariggio, M.A.; Mazzoleni, G. Organ-specific manganese toxicity: A comparative in vitro study on five cellular models exposed to MnCl2. Toxicol. In Vitro 2007, 21, 284–292. [Google Scholar] [CrossRef]
  10. Health Effects Support Document for Manganese. Available online: https://www.epa.gov/sites/default/files/2014-09/documents/support_cc1_magnese_healtheffects_0.pdf (accessed on 22 November 2002).
  11. Manganese. Available online: https://www.euro.who.int/__data/assets/pdf_file/0003/123078/AQG2ndEd_6_8Manganese.pdf (accessed on 22 November 2002).
  12. Islam, N.; Huq, E.M.; Islam, N.; Islam, A.; Ali, R.; Khatun, R.; Haque, N.; Islam, R.; Akhter, S.N. Human Health Risk Assessment for Inhabitants of Four Towns of Rajshahi, Bangladesh due to Arsenic, Cadmium and Lead Exposure. EnvironmentAsia 2018, 11, 168–182. [Google Scholar]
  13. Gigantone, C.B.; Sobremisana, M.J.; Trinidad, L.C.; Migo, V.P. Impact of Abandoned Mining Facility Wastes on the Aquatic Ecosystem of the Mogpog River, Marinduque, Philippines. J. Health Pollut. 2020, 10, 200611. [Google Scholar] [CrossRef]
  14. The Marcopper Disaster: A Tragedy That Continues in People’s Veins. Available online: https://miningwatch.ca/news/2019/4/3/marcopper-disaster-tragedy-continues-people-s-veins (accessed on 25 November 2022).
  15. Sihag, P.; Keshavarzi, A.; Kumar, V. Comparison of different approaches for modeling of heavy metal estimations. SN Appl. Sci. 2019, 1, 780. [Google Scholar] [CrossRef]
  16. Carr, R.S.; Nipper, M.; Plumlee, G.S. A Preliminary Survey of Marine Contamination from Mining-Related Activities on Marinduque Island, Philippines: Porewater Toxicity and Chemistry Results from a Field Trip, 14–19 October 2000; No. 2001-441; US Geological Survey: Reston, VA, USA, 2001. [Google Scholar]
  17. Monjardin, C.E.F.; Senoro, D.B.; Magbanlac, J.J.M.; de Jesus, K.L.M.; Tabelin, C.B.; Natal, P.M. Geo-Accumulation Index of Manganese in Soils Due to Flooding in Boac and Mogpog Rivers, Marinduque, Philippines with Mining Disaster Exposure. Appl. Sci. 2022, 12, 3527. [Google Scholar] [CrossRef]
  18. De Jesus, K.L.M.; Senoro, D.B.; Natal, P.; Bonifacio, P. Groundwater Heavy Metal Contamination and Pollution Index in Marinduque Island, Philippines using Empirical Bayesian Kriging Method. J. Method Eng. 2021, 10, 119–141. [Google Scholar]
  19. Herrero, A.; Vila, J.; Eljarrat, E.; Ginebreda, A.; Sabater, S.; Batalla, R.J.; Barceló, D. Transport of sediment borne contaminants in a Mediterranean river during a high flow event. Sci. Total Environ. 2018, 633, 1392–1402. [Google Scholar] [CrossRef] [PubMed]
  20. Lick, W. Sediment and Contaminant Transport in Surface Waters; CRC Press: Boca Raton, FL, USA, 2008; pp. 103–175. [Google Scholar]
  21. Debnath, A.; Singh, P.K.; Sharma, Y.C. Metallic contamination of global river sediments and latest developments for their remediation. J. Environ. Manag. 2021, 298, 113378. [Google Scholar] [CrossRef] [PubMed]
  22. Sojka, M.; Jaskuła, J. Heavy Metals in River Sediments: Contamination, Toxicity, and Source Identification—A Case Study from Poland. Int. J. Environ. Res. Public Health 2022, 19, 10502. [Google Scholar] [CrossRef] [PubMed]
  23. Bhuyan, M.S.; Bakar, M.A.; Akhtar, A.; Hossain, M.B.; Ali, M.M.; Islam, M.S. Heavy metal contamination in surface water and sediment of the Meghna River, Bangladesh. Env. Nanotechnol. Monit. Manag. 2017, 8, 273–279. [Google Scholar] [CrossRef]
  24. Singh, A.; Sharma, A.; Verma, R.K.; Chopade, R.L.; Pandit, P.P.; Nagar, V.; Aseri, V.; Choudhary, S.K.; Awasthi, G.; Sankhla, M.S. Heavy Metal Contamination of Water and Their Toxic Effect on Living Organisms. Toxic. Environ. Pollut. 2022. [Google Scholar] [CrossRef]
  25. Withanachchi, S.S.; Ghambashidze, G.; Kunchulia, I.; Urushadze, T.; Ploeger, A. Water Quality in Surface Water: A Preliminary Assessment of Heavy Metal Contamination of the Mashavera River, Georgia. Int. J. Environ. Res. Public Health 2018, 15, 621. [Google Scholar] [CrossRef]
  26. Huang, H.; Chen, G.; Zhang, Q.F. Influence of river sinuosity on the distribution of conservative pollutants. J. Hydrol. Eng. 2012, 17, 1296–1301. [Google Scholar] [CrossRef]
  27. Xiao, C.; Chen, J.; Yuan, X.; Chen, R.; Song, X. Model Test of the Effect of River Sinuosity on Nitrogen Purification Efficiency. Water 2020, 12, 1677. [Google Scholar] [CrossRef]
  28. Miranda, L.S.; Ayoko, G.A.; Egodawatta, P.; Goonetilleke, A. Adsorption-desorption behavior of heavy metals in aquatic environments: Influence of sediment, water and metal ionic properties. J. Hazard. Mater. 2022, 421, 126743. [Google Scholar] [CrossRef]
  29. Haimann, M.; Hauer, C.; Tritthart, M.; Prenner, D.; Leitner, P.; Moog, O.; Habersack, H. Monitoring and modelling concept for ecological optimized harbour dredging and fine sediment disposal in large rivers. Hydrobiologia 2018, 814, 89–107. [Google Scholar] [CrossRef]
  30. Das, H.; Deka, J.; Singh, A.; Barman, P. Study of adsorption of copper, lead, and zinc in their various chemical forms from the sediments of the Brahmaputra river, Assam, India. Environ. Qual. Manag. 2022, 31, 67–78. [Google Scholar] [CrossRef]
  31. Monjardin, C.E.F.; Gomez, R.A.; Cruz, M.N.G.D.; Capili, D.L.R.; Tan, F.J.; Uy, F.A.A. Sediment Transport and water quality analyses of Naic River, Cavite, Philippines. In Proceedings of the 2021 IEEE Conference on Technologies for Sustainability (SusTech), Irvine, CA, USA, 22–24 April 2021; pp. 1–8. [Google Scholar]
  32. Mueller, E.R.; Pitlick, J. Sediment supply and channel morphology in mountain river systems: 1. Relative importance of lithology, topography, and climate. J. Geophys. Res. Earth Surf. 2013, 118, 2325–2342. [Google Scholar] [CrossRef]
  33. Fatalla, J.M. The 1996 Marcopper Mining Disaster in Marinduque: Five decades of social injustice and neglect. CSS Pap. 2019, 2, 11–22. [Google Scholar]
  34. Boac Province of Marinduque. Available online: https://www.philatlas.com/luzon/mimaropa/marinduque/boac.html (accessed on 1 December 2022).
  35. Sediment Sampling Operating Procedure. Available online: https://www.epa.gov/sites/default/files/2015-06/documents/Sediment-Sampling.pdf (accessed on 1 December 2022).
  36. Surface Water Sampling Operating Procedure. Available online: https://www.epa.gov/sites/default/files/2017-07/documents/surface_water_sampling201_af.r4.pdf (accessed on 1 December 2022).
  37. Lemiere, B.; Laperche, V.; Haouche, L.; Auger, P. Portable XRF and wet materials: Application to dredged contaminated sediments from waterways. Geochem. Explor. Environ. Anal. 2014, 14, 257–264. [Google Scholar] [CrossRef]
  38. Zhou, S.; Yuan, Z.; Cheng, Q.; Zhang, Z.; Yang, J. Rapid in situ determination of heavy metal concentrations in polluted water via portable XRF: Using Cu and Pb as example. Environ. Pollut. 2018, 243, 1325–1333. [Google Scholar] [CrossRef]
  39. Al Maliki, A.; Al-lami, A.K.; Hussain, H.M.; Al-Ansari, N. Comparison between inductively coupled plasma and X-ray fluorescence performance for Pb analysis in environmental soil samples. Environ. Earth Sci. 2017, 76, 433. [Google Scholar] [CrossRef]
  40. Spearman, S.; Bartrem, C.; Sharshenova, A.A.; Salymbekova, K.S.; Isirailov, M.B.; Gaynazarov, S.A.; Gilmanov, R.; von Lindern, I.H.; von Braun, M.; Möller, G. Comparison of X-ray Fluorescence (XRF) and Atomic Absorption Spectrometry (AAS) Results for an Environmental Assessment at a Mercury Site in Kyrgyzstan. Appl. Sci. 2022, 12, 1943. [Google Scholar] [CrossRef]
  41. Huang, F.; Peng, S.; Yang, H.; Cao, H.; Ma, N.; Ma, L. Development of a novel and fast XRF instrument for large area heavy metal detection integrated with UAV. Environ. Res. 2022, 214, 113841. [Google Scholar] [CrossRef]
  42. Paltseva, A.; Slukovskaya, M.; Romzaykina, O.; Sarzhanov, D.; Drogobuzhskaya, S.; Dvornikov, Y.; Vasenev, V. Proximal sensing of soil pollution by heavy metals using a portable X-ray fluorescence analyzer in Subarctic industrial barren: Limitations and perspectives. In Soils in Urban Ecosystem; Springer: Singapore, 2022; pp. 243–254. [Google Scholar]
  43. De Jesus, K.L.M.; Senoro, D.B.; Dela Cruz, J.C.; Chan, E.B. A Hybrid Neural Network-Particle Swarm Optimization Informed Spatial Intermpolation Technique for Groundwater Quality in a Small Island Province of the Philippines. Toxics 2021, 9, 273. [Google Scholar] [CrossRef]
  44. De Jesus, K.L.M.; Senoro, D.B.; Dela Cruz, J.C.; Chan, E.B. Neuro-Particle Swarm Optimization Based In-Situ Prediction Model for Heavy Metals Concentration in Groundwater and Surface Water. Toxics 2022, 10, 95. [Google Scholar] [CrossRef]
  45. Senoro, D.B.; de Jesus, K.L.M.; Nolos, R.C.; Lamac, M.R.L.; Deseo, K.M.; Tabelin, C.B. In Situ Measurements of Domestic Water Quality and Health Risks by Elevated Concentration of Heavy Metals and Metalloids Using Monte Carlo and MLGI Methods. Toxics 2022, 10, 342. [Google Scholar] [CrossRef] [PubMed]
  46. Senoro, D.B.; Monjardin, C.E.F.; Fetalvero, E.G.; Benjamin, Z.E.C.; Gorospe, A.F.B.; de Jesus, K.L.M.; Ical, M.L.G.; Wong, J.P. Quantitative Assessment and Spatial Analysis of Metals and Metalloids in Soil Using the Geo-Accumulation Index in the Capital Town of Romblon Province, Philippines. Toxics 2022, 10, 633. [Google Scholar] [CrossRef] [PubMed]
  47. Park, J.; Kwon, E.; Chung, E.; Kim, H.; Battogtokh, B.; Woo, N.C. Environmental Sustainability of Open-Pit Coal Mining Practices at Baganuur, Mongolia. Sustainability 2020, 12, 248. [Google Scholar] [CrossRef]
  48. Marguí, E.; Queralt, I.; Almeida, E. X-ray fluorescence spectrometry for environmental analysis: Basic principles, instrumentation, applications and recent trends. Chemosphere 2022, 135006. [Google Scholar] [CrossRef]
  49. Hou, S.; Zhao, X.; Liu, Y.; Tillotson, M.R.; Weng, S.; Wang, H.; Li, Y.; Liu, B.; Feng, K.; Zhang, N. Spatial analysis connects excess water pollution discharge, industrial production, and consumption at the sectoral level. NPJ Clean Water 2022, 5, 4. [Google Scholar] [CrossRef]
  50. Gacu, J.G.; Monjardin, C.E.F.; Senoro, D.B.; Tan, F.J. Flood Risk Assessment Using GIS-Based Analytical Hierarchy Process in the Municipality of Odiongan, Romblon, Philippines. Appl. Sci. 2022, 12, 9456. [Google Scholar] [CrossRef]
  51. Miranda, M.L.; Edwards, S.E. Use of spatial analysis to support environmental health research and practice. North Carol. Med. J. 2011, 72, 132–135. [Google Scholar] [CrossRef]
  52. Khouni, I.; Louhichi, G.; Ghrabi, A. Use of GIS based Inverse Distance Weighted interpolation to assess surface water quality: Case of Wadi El Bey, Tunisia. Environ. Technol. Innov. 2021, 24, 101892. [Google Scholar] [CrossRef]
  53. Bernstein, J.; Kemp, K. The Role of Spatial Science in Environmental Case Studies: A Special Collection from the University of Southern California. Case Studies in the Environment. Case Stud. Environ. 2020, 4, 1–5. [Google Scholar] [CrossRef]
  54. Monjardin, C.E.F.; Tan, F.J.; Uy, F.A.A.; Bale, F.J.P.; Voluntad, E.O.; Batac, R.M.N. Assessment of the existing drainage system in Infanta, Quezon province for flood hazard management using analytical hierarchy process. In Proceedings of the 2020 IEEE Conference on Technologies for Sustainability (SusTech), Santa Ana, CA, USA, 23–25 April 2020; IEEE: Piscataway, NJ, USA; pp. 1–7. [Google Scholar]
  55. Ahmad, W.; Alharthy, R.D.; Zubair, M.; Ahmed, M.; Hameed, A.; Rafique, S. Toxic and heavy metals contamination assessment in soil and water to evaluate human health risk. Sci. Rep. 2021, 11, 1–12. [Google Scholar] [CrossRef]
  56. Zegers, G.; Navarro-Valdivia, L.; Lagos-Zuñiga, M.; Navarrete-Calvo, A.; Caraballo, M.A.; Niño, Y.; Mcphee, J.; Montserrat, S. An integrated modeling approach for mineral and metal transport in acidic rivers at high mountainous porphyry Cu systems. J. Hydrol. 2021, 602, 126718. [Google Scholar] [CrossRef]
  57. Szalai, Z.; Balogh, J.; Jakab, G. Riverbank erosion in Hungary-with an outlook on environmental consequences. Hung. Geogr. Bull. 2013, 62, 233–245. [Google Scholar]
  58. Mali, M.; Malcangio, D.; Dell’Anna, M.M.; Damiani, L.; Mastrorilli, P. Influence of hydrodynamic features in the transport and fate of hazard contaminants within touristic ports. Case study: Torre a Mare (Italy). Heliyon 2018, 4, e00494. [Google Scholar] [CrossRef] [PubMed]
  59. Sinuosity Index. Available online: https://www.ipl.org/essay/Sinuosity-Index-FCAZ4Y5TTG (accessed on 6 December 2022).
  60. Sun, L.; Zhang, G.; Zhao, D.; Ji, L.; Gu, H.; Sun, L.; Li, X. Explore the Correlation between Environmental Factors and the Spatial Distribution of Property Crime. ISPRS Int. J. Geo-Inf. 2022, 11, 428. [Google Scholar] [CrossRef]
  61. Schober, P.; Boer, C.; Schwarte, L.A. Correlation coefficients: Appropriate use and interpretation. Anesth. Analg. 2018, 126, 1763–1768. [Google Scholar] [CrossRef]
  62. Petrosyan, V.; Pirumyan, G.; Perikhanyan, Y. Determination of heavy metal background concentration in bottom sediment and risk assessment of sediment pollution by heavy metals in the Hrazdan River (Armenia). App. Water Sci. 2019, 9, 102. [Google Scholar] [CrossRef]
  63. Kowalska, J.B.; Mazurek, R.; Gąsiorek, M.; Zaleski, T. Pollution indices as useful tools for the comprehensive evaluation of the degree of soil contamination–A review. Environ. Geochem. Health 2018, 40, 2395–2420. [Google Scholar] [CrossRef]
  64. Shen, F.; Mao, L.; Sun, R.; Du, J.; Tan, Z.; Ding, M. Contamination Evaluation and Source Identification of Heavy Metals in the Sediments from the Lishui River Watershed, Southern China. Int. J. Environ. Res. Public Health 2019, 16, 336. [Google Scholar] [CrossRef]
  65. Jimoh, A.; Agbaji, E.B.; Ajibola, V.O.; Funtua, M.A. Application of pollution load indices, enrichment factors, contamination factor and health risk assessment of heavy metals pollution of soils of welding workshops at old Panteka Market, Kaduna-Nigeria. Open J. Anal. Bioanal. Chem. 2020, 4, 11–19. [Google Scholar]
  66. Onjefu, S.A.; Kgabi, N.A.; Taole, S.H. Heavy metal seasonal distribution in shore sediment samples along the coastline of Erongo Region, western Namibia. Eur. J. Sci. Res. 2016, 139, 49–63. [Google Scholar]
  67. Esshaimi, M.; Ouazzani, N.; Avila, M.; Perez, G.; Valiente, M.; Mandi, L. Heavy metal contamination of soils and water resources Kettara abandoned mine. Am. J. Environ. Sci. 2012, 8, 253–261. [Google Scholar]
  68. Gualtieri, C.; Shao, D.; Angeloudis, A. Advances in Environmental Hydraulics. Water 2021, 13, 1192. [Google Scholar] [CrossRef]
  69. Stern, M.A.; Flint, L.E.; Flint, A.L.; Knowles, N.; Wright, S.A. The future of sediment transport and streamflow under a changing climate and the implications for long-term resilience of the San Francisco Bay-Delta. Water Resour. Res. 2020, 56, e2019WR026245. [Google Scholar] [CrossRef]
  70. Shi, X.; Zhang, F.; Lu, X.; Zhang, Y.; Zheng, Y.; Wang, G.; Wang, L.; Jagirani, M.D.; Wang, T.; Piao, S. The response of the suspended sediment load of the headwaters of the Brahmaputra River to climate change: Quantitative attribution to the effects of hydrological, cryospheric and vegetation controls. Glob. Planet. Change 2022, 210, 103753. [Google Scholar] [CrossRef]
  71. Acero, P.; Mandado, J.; Gomez, J.; Gimeno, M.; Auque, L.; Torrijo, F. Environmental impact of heavy-metal dispersion in the Huerva River (Iberian Range, NE Spain). Environ. Geol. 2003, 43, 950–956. [Google Scholar] [CrossRef]
  72. Huang, G.; Xue, H.; Liu, H.; Ekkawatpanit, C.; Sukhapunnapha, T. Duality of Seasonal Effect and River Bend in Relation to Water Quality in the Chao Phraya River. Water 2019, 11, 656. [Google Scholar] [CrossRef]
  73. Zhang, Y.; Zhang, H.; Zhang, Z.; Liu, C.; Sun, C.; Zhang, W.; Marhaba, T. pH effect on heavy metal release from a polluted sediment. J. Chem. 2018, 2018, 7. [Google Scholar] [CrossRef]
  74. Bondu, R.; Cloutier, V.; Rosa, E.; Roy, M. An exploratory data analysis approach for assessing the sources and distribution of naturally occurring contaminants (F, Ba, Mn, As) in groundwater from southern Quebec (Canada ). Appl. Geochem. 2020, 114, 104500. [Google Scholar] [CrossRef]
  75. Homoncik, S.C.; MacDonald, A.M.; Heal, K.V.; Dochartaigh, B.É.Ó.; Ngwenya, B.T. Manganese concentrations in Scottish groundwater. Sci. Total Environ. 2010, 408, 2467–2473. [Google Scholar] [CrossRef]
  76. Kinouchi, T.; Yagi, H.; Miyamoto, M. Increase in stream temperature related to anthropogenic heat input from urban wastewater. J. Hydrol. 2007, 335, 78–88. [Google Scholar] [CrossRef]
  77. Rajesh, M.; Rehana, S. Impact of climate change on river water temperature and dissolved oxygen: Indian riverine thermal regimes. Sci. Rep. 2022, 12, 1–12. [Google Scholar] [CrossRef] [PubMed]
  78. Sylus, K.J.; Ramesh, H. The study of sea water intrusion in coastal aquifer by electrical conductivity and total dissolved solid method in Gurpur and Netravathi River basin. Aquat. Procedia 2015, 4, 57–64. [Google Scholar] [CrossRef]
  79. Powell, D.M. Flow resistance in gravel-bed rivers: Progress in research. Earth-Sci. Rev. 2014, 136, 301–338. [Google Scholar] [CrossRef]
  80. Ekissi, D.; Kinimo, K.C.; Kamelan, T.M.; Kouamelan, E.P. Physicochemical Characteristics and Heavy Metals Contamination Assessment in Water and Sediment in a Tropical Hydroelectric Dam of Sassandra River, Côte d’Ivoire. J. Environ. Pollut. Hum. Health 2021, 9, 27–35. [Google Scholar] [CrossRef]
  81. Ustaoğlu, F.; Yalçin, T. Water quality and sediment contamination assessment of Pazarsuyu Stream, Turkey using multivariate statistical methods and pollution indicators. Int. Soil Water Conserv. Res. 2019, 7, 47–56. [Google Scholar] [CrossRef]
  82. Heavy Metal. Mike Eco Lab Template. Available online: https://manuals.mikepoweredbydhi.help/2019/General/HeavyMetal.pdf (accessed on 10 December 2022).
  83. Boac Annual Weather Average. Available online: https://www.worldweatheronline.com/boac-weather-averages/marinduque/ph.aspx (accessed on 13 December 2022).
  84. Corada-Fernández, C.; Candela, L.; Torres-Fuentes, N.; Pintado-Herrera, M.G.; Paniw, M.; González-Mazo, E. Effects of extreme rainfall events on the distribution of selected emerging contaminants in surface and groundwater: The Guadalete River basin (SW, Spain). Sci. Total Environ. 2017, 605, 770–783. [Google Scholar] [CrossRef]
  85. Król, A.; Mizerna, K.; Bożym, M. An assessment of pH-dependent release and mobility of heavy metals from metallurgical slag. J. Hazard. Mater. 2020, 384, 121502. [Google Scholar] [CrossRef]
  86. Gheorghe, S.; Stoica, C.; Vasile, G.G.; Nita-Lazar, M.; Stanescu, E.; Lucaciu, I.E. Metals toxic effects in aquatic ecosystems: Modulators of water quality. Water Qual. 2017, 60–89. [Google Scholar] [CrossRef]
  87. Jones, E.M.; Cochrane, C.A.; Percival, S.L. The effect of pH on the extracellular matrix and biofilms. Adv. Wound Care 2015, 4, 431–439. [Google Scholar] [CrossRef]
  88. Wasserman, G.A.; Liu, X.; Parvez, F.; Ahsan, H.; Levy, D.; Factor-Litvak, P.; Kline, J.; van Geen, A.; Slavkovich, V.; Lolacono, N.J.; et al. Water manganese exposure and children’s intellectual function in Araihazar, Bangladesh. Environ. Health Perspect. 2006, 114, 124–129. [Google Scholar] [CrossRef]
  89. Saalidong, B.M.; Aram, S.A.; Otu, S.; Lartey, P.O. Examining the dynamics of the relationship between water pH and other water quality parameters in ground and surface water systems. PLoS ONE 2022, 17, e0262117. [Google Scholar] [CrossRef] [PubMed]
  90. Richman, L.A.; Dreier, S.I. Sediment contamination in the St. Lawrence River along the Cornwall, Ontario waterfront. J. Great Lakes Res. 2001, 27, 60–83. [Google Scholar] [CrossRef]
  91. Nasrabadi, T.; Ruegner, H.; Schwientek, M.; Bennett, J.; Fazel Valipour, S.; Grathwohl, P. Bulk metal concentrations versus total suspended solids in rivers: Time-invariant & catchment-specific relationships. PLoS ONE 2018, 13, e0191314. [Google Scholar]
  92. Ciszewski, D.; Grygar, T.M. A review of flood-related storage and remobilization of heavy metal pollutants in river systems. Water Air Soil Pollut. 2016, 227, 239. [Google Scholar] [CrossRef]
  93. Monjardin, C.E.; Cabundocan, C.; Ignacio, C.; Tesnado, C.J. Impact of climate change on the frequency and severity of floods in the Pasig-Marikina river basin. E3S Web Conf. 2019, 117, 00005. [Google Scholar] [CrossRef]
  94. Monjardin, C.E.F.; Bacuel, A.C.; Rubin, N.K.; Tiongson, M.A.J.; Valdecanas, G.; Yamat, R.U. (2018, December). Effect of climate change to Ambuklao reservoir, simulation of El Niño and La Niña. AIP Conf. Proc. 2018, 2045, 020064. [Google Scholar]
  95. World Weather Online. Available online: https://www.worldweatheronline.com/mogpog-weather-averages/marinduque/ph.aspx (accessed on 15 January 2023).
Figure 1. Site map of Marinduque, Philippines, indicating the two abandoned mine pits (San Antonio) and (Tapian), along with their respective downstream rivers Mogpog and Boac.
Sustainability 15 08276 g001
Figure 2. A schematic of the framework developed to assess the spatio-temporal variation of Mn and how it relates to river morphology.
Sustainability 15 08276 g002
Figure 3. Sediment and SW sampling locations during the (a) 2019, (b) 2021, and (c) 2022 field sampling programs.
Sustainability 15 08276 g003
Figure 4. Site map indicating the 15 and 22 segments along Mogpog and Boac rivers, respectively.
Sustainability 15 08276 g004
Figure 5. Concentration of Mn in sediments along the (a) Mogpog, and (b) Boac rivers in 2019, 2021, and 2022.
Sustainability 15 08276 g005
Figure 6. Concentration of Mn in SW along the (a) Mogpog and (b) Boac rivers in 2019 and 2021.
Sustainability 15 08276 g006
Figure 7. Plots of the physicochemical parameters in SW: (a,b) pH, (c,d) temperature, (e,f) EC, and (g,h) TDS. Note that the range of concentration values on the y-axes for Mogpog and Boac rivers are different.
Sustainability 15 08276 g007
Figure 8. Correlation coefficients between sediment Mn (a) and SW Mn (b) and SW pH/temperature/EC/TDS and morphology in Mogpog river.
Sustainability 15 08276 g008
Figure 9. Correlation coefficients between sediment Mn (a) and SW Mn (b) and SW pH/temperature/EC/TDS and morphology in Boac river.
Sustainability 15 08276 g009
Figure 10. Contaminant factor (CF) for sediment Mn within each segment in Mogpog and Boac rivers for (a) 2019, (b) 2021, and (c) 2022.
Sustainability 15 08276 g010aSustainability 15 08276 g010b
Figure 11. Contaminant factor (CF) for SW Mn within each segment in Mogpog and Boac rivers for (a) 2019, and (b) 2021.
Sustainability 15 08276 g011
Table 1. Number and type of sample collected during each sampling program.
Year (Month)Number of Sediment SampleNumber of Surface Water Sample
2019 (December)3122
2021 (July)2326
2022 (February)2626
Table 2. Summary of statistics for river morphology parameters in Mogpog and Boac rivers.
RiverParameterRiver Slope
[Degrees]
River BendsChannel Width
[m]
Channel Length
[km]
Sinuosity
MogpogAverage9.872.8781.501.471.43
SD6.280.7220.610.290.27
Min–Max0–23.892–460.5–131.251.07–1.991.06–1.92
BoacAverage6.221.32179.601.271.27
SD5.400.7055.920.300.21
Min–Max0.79–20.550–357.21–261.750.57–1.931–1.79
Disclaimer/Publisher’s Note: The statements, opinions and data contained in all publications are solely those of the individual author(s) and contributor(s) and not of MDPI and/or the editor(s). MDPI and/or the editor(s) disclaim responsibility for any injury to people or property resulting from any ideas, methods, instructions or products referred to in the content.

