Article

Analysis of Dynamic Deformation Response of Closely Spaced Square Footings on Geogrid-Reinforced Sand under Cyclic Loading

1
College of Civil and Architectural Engineering, Guangxi University of Science and Technology, Liuzhou 545006, China
2
Guangxi Zhuang Autonomous Region Engineering Research Center of Geotechnical Disaster and Ecological Control, Liuzhou 545006, China
*
Author to whom correspondence should be addressed.
Sustainability 2023, 15(1), 438; https://doi.org/10.3390/su15010438
Submission received: 7 December 2022 / Revised: 22 December 2022 / Accepted: 26 December 2022 / Published: 27 December 2022

Abstract

:
In order to obtain the optimal spacing of closely spaced footings under cyclic dynamic loading, dynamic model tests of closely spaced footings were carried out on unreinforced and reinforced sand foundations. The influence of the center point spacing (S) of closely spaced footings on the bearing capacity of the foundation under cyclic dynamic load is discussed. The test results show the following: (1) The dynamic load peak of the unreinforced and reinforced sand foundation is the largest when S/B = 2.0 (B is the width of footing), and the ultimate bearing capacity of the reinforced sand foundation is 20% higher than that of unreinforced sand foundation. (2) The vertical soil pressure at different positions of closely spaced footings with different spacing ratios (S/B) on the reinforced sand foundation is lower than that of unreinforced sand foundation, and the vertical soil pressure at different buried depths (‘1-3’, ‘2-3’, ‘3-3’ positions) at the center of closely spaced footings are smaller than that below the footings (‘1-2’, ‘2-2’, ‘3-2’ positions). (3) When S/B = 2.0, the strain of geogrid and the peak acceleration at the center of the closely spaced footings are the smallest, indicating that the sand foundation has little transient change under this spacing. From the aspects of ultimate bearing capacity design and engineering economic benefits, it is suggested that the spacing between closely spaced footings should be arranged according to two times the width of the footing (S/B = 2.0).

1. Introduction

Owing to the acceleration of urbanization and population growth, buildings and structures are both very close to each other, and the footings of the same building or adjacent buildings are usually very close [1]. At the same time, highways, railways and other fields have also ushered in rapid development, and the traffic load density is also increasing. Owing to the influence of space, the distance between highways and railways is often small, and the interaction between adjacent highways and railways is large [2]. If the influence between closely spaced footings is ignored, it is likely to cause traffic safety hazards. Therefore, it is necessary to study the behavior between closely spaced footings and provide recommendations for practical engineers.
At present, the bearing capacity and failure mode of the foundation under the action of closely spaced footings are studied. First, Stuart (1962) theoretically and experimentally studied the interference effect of two closely spaced strip footings on a homogeneous sand bed and concluded that the ultimate bearing capacity of two closely spaced strip footings increased compared with that of a single footing [3,4]. Subsequently, some scholars have carried out many experimental and analytical studies on the interference effects of the closely spaced strip and square footings (Graham et al. [5] (1984), Das et al. [6] (1993), Kumar et al. [7,8] (2007, 2009), Ghazavi et al. [9] (2008), Ghosh et al. [10] (2011), Lavasan et al. [11] (2012), Saha et al. [1] (2019), Roy et al. [12] (2020)). From the research of these scholars, it can be seen that the bearing capacity of the closely spaced footing first increases and then decreases with the increase in the S/B ratio (S is the spacing between the closely spaced footing center points or the spacing between the closely spaced footing edges; B is the width of footing). When S = 0.5B–2.14B, the ultimate bearing capacity of closely spaced footings is significantly improved compared with that of a single footing. As the value of S/B further increases, the interference effect between closely spaced footings will be significantly weakened. Each footing is independent of the other, just like a single footing. It is concluded that the optimum buried depth of single-layer geogrid is u = 1/3B (B is the width of footing) in closely spaced footing reinforced foundation, which is independent of the aspect ratio of footing. In addition, scholars Naderi et al. [13] (2014) and Dehkordi et al. [14] (2019) studied the interference effect of closely spaced circular footings and found that when S/D = 1 (S is the distance between the center points of closely spaced circular footings; D is the diameter of the circular footing), the ultimate bearing capacity of closely spaced circular footings is the largest. With the increase in the S/D ratio, the ultimate bearing capacity of closely spaced circular footings will decrease accordingly, which indicates that the interference effect between closely spaced footings is related to the shape of the footing. The above scholars were limited to the study of the behavior of closely spaced footings under static load. In practical engineering, the closely spaced footings are not only subjected to static load but also subjected to cyclic dynamic load.
In addition, there is a lack of research on closely spaced footings subjected to cyclic loading. For example, Vivek et al. [15] used model tests to study the dynamic interaction of closely spaced footings on homogeneous sand and applied sinusoidal loads on one of the footings. The results show that the settlement is the smallest when the distance between closely spaced footings is twice the width of the footing. Swain et al. [2] studied the dynamic interaction effect of the closely spaced square footings under machine vibration through field tests. It is concluded that under different S/B ratios (S is the distance between the spaced square footing edges; B is the width of footing), the response of the active footing remains almost unchanged. The above scholars applied dynamic load on only one footing and applied static load on another footing, but the research on applying cyclic dynamic load on two closely spaced footings has not been reported. With the development of the economy and society, the traffic load density of highways and railways is further increased. Therefore, it is necessary to explore the dynamic characteristics of closely spaced footings under cyclic loading, so as to provide a reference for the design of closely spaced footings under cyclic loading.
Therefore, this paper intends to discusses the influence of closely spaced footing spacing on the bearing capacity of a foundation under cyclic load, which was conducted on the DJM-500 biaxial vibration electrohydraulic servo-loading system to apply a cyclic dynamic load. In addition, the settlement curves, the distribution of soil pressure and the geogrid strain and soil acceleration of unreinforced and reinforced foundations under cyclic dynamic load are analyzed. The research results have crucial reference value and practical engineering significance for the arrangement of closely spaced footings under cyclic loading.

2. Experimental

2.1. Test Materials

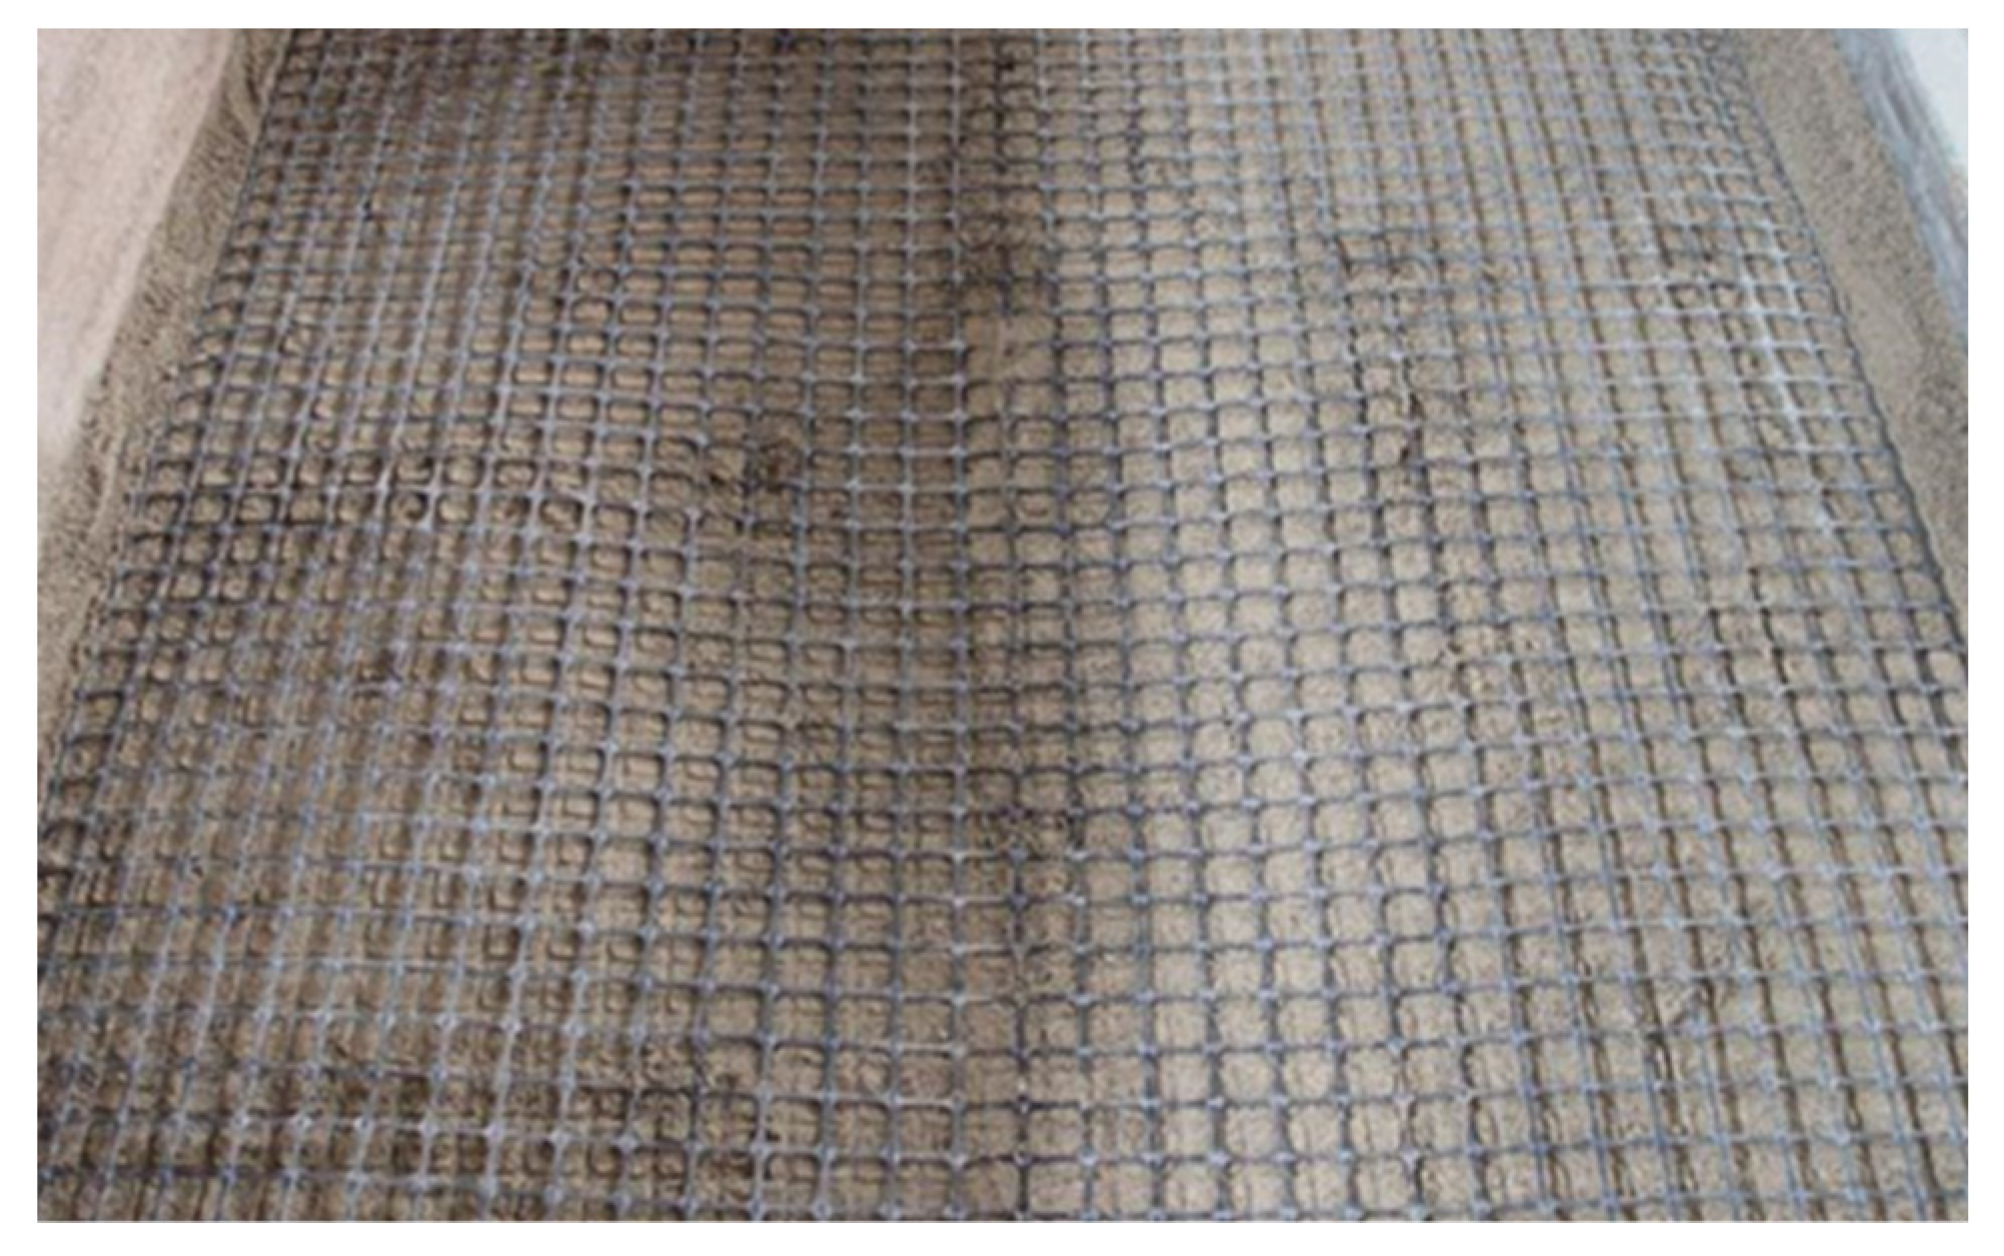
The filler of this test is a kind of river sand used in Liuzhou City engineering construction. The grain gradation curve of the sand is shown in Figure 1. According to the Unified Soil Classification System (ASTM D2487-17, 2017) [16], the soil is classified as well-graded sand (SW). In addition, the specific gravity and the moist density of sand are 2.65 and 1.81 g/cm3, respectively. The moisture content of the sand under natural conditions is 6.9%. In the reinforced sand foundation, a biaxial geogrid made of high-density polyethylene (HDPE) is used as reinforcement material, as shown in Figure 2. The specific physical and mechanical properties of the geogrid were determined, which are shown in Table 1.

2.2. Test Device

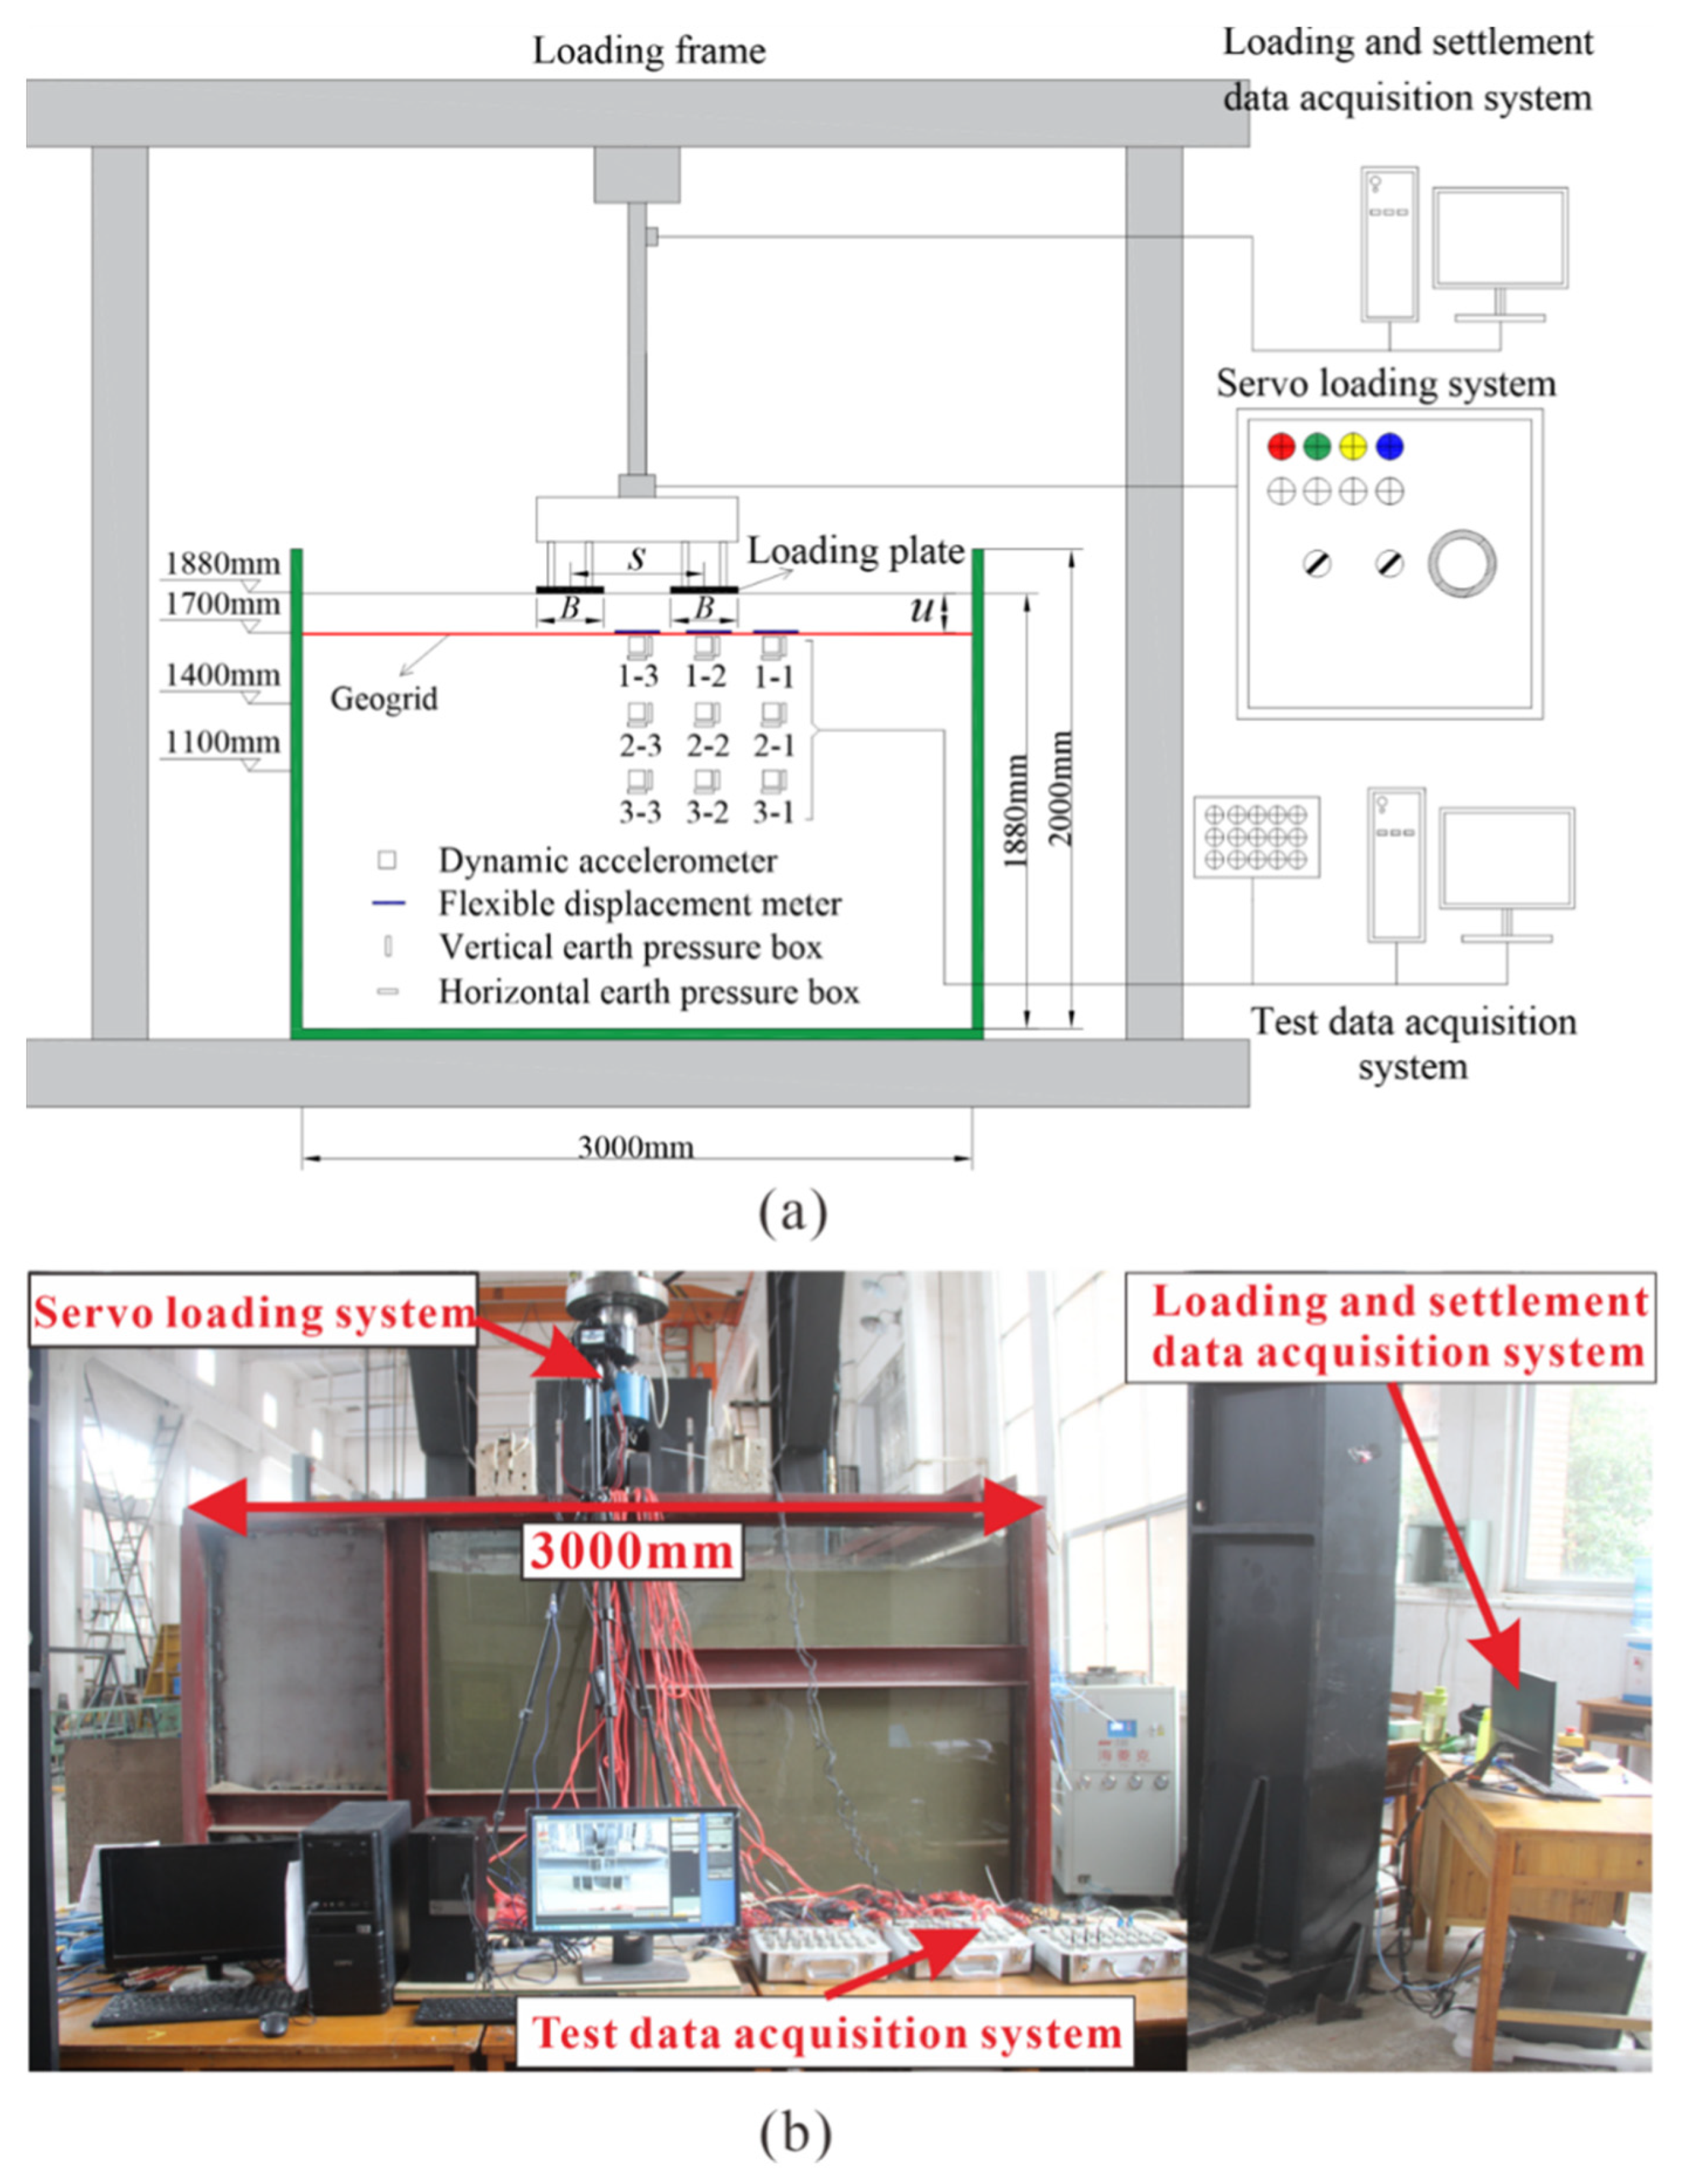
The test device includes four parts: a large model test box, a closely spaced footing, loading equipment and a test data acquisition system, as shown in Figure 3.
(1) The frame of the large model test box is welded by multichannel steel, and the internal size is 3.0 m × 1.6 m × 2.0 m (length × width × height). One side of the model box is a double-layer tempered glass with scale, which makes it easy to fill and compact; the opposite side of the model box is a 10 mm thick steel plate and multichannel steel welding; the remaining left and right sides of the model box are made of four movable steel plates with a thickness of 10 mm. In order to improve the stiffness of the model box and prevent the deformation of the model box during the test-loading process, multiple beams are welded on each side and top of the model box.
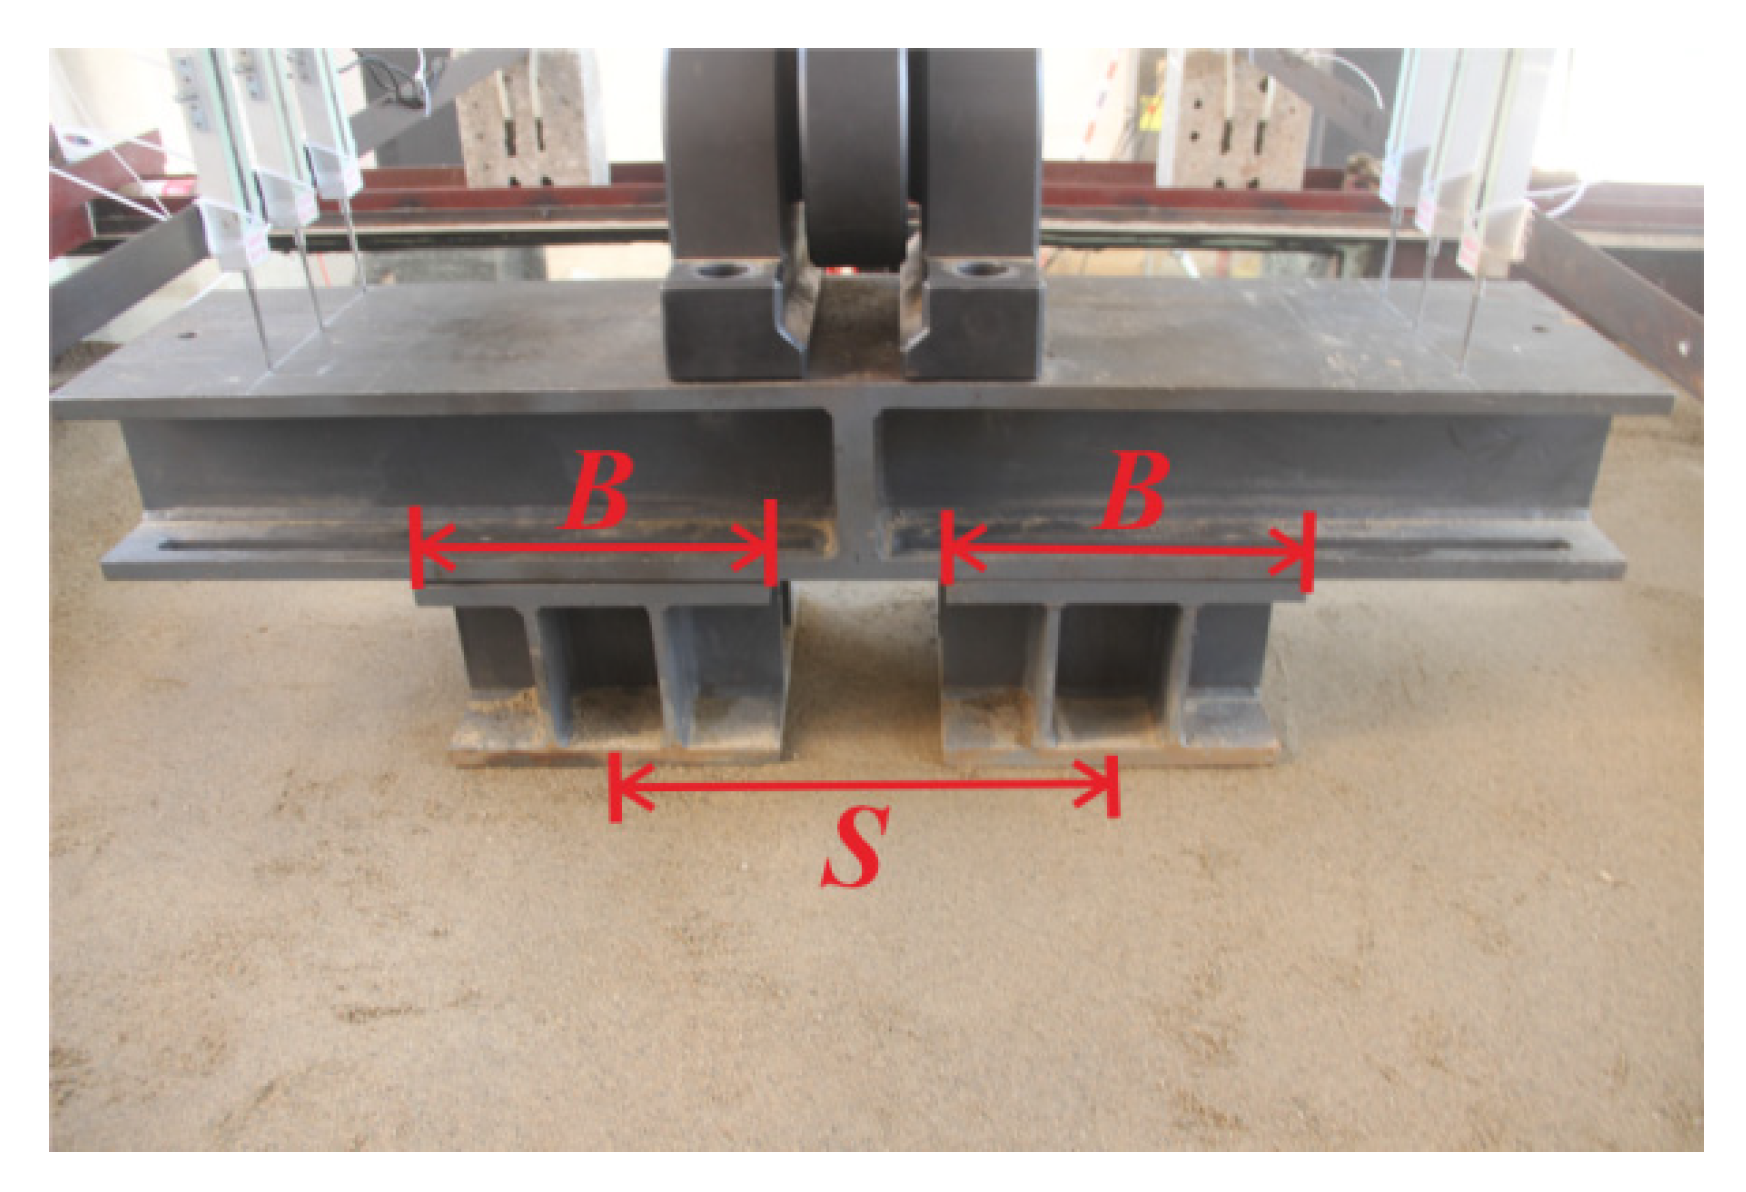
(2) The closely spaced footing used in the test is made of low-carbon steel, which prevents the deformation of the footing during the loading process. In order to avoid the influence of the size effect, each footing size is designed to be 30 cm × 30 cm, according to the size of the model box, as shown in Figure 4.
(3) All experiments were conducted on the DJM-500 biaxial vibration electrohydraulic servo-loading system, including steel reaction frame, oil cooler, the servo-loading system, software and the data-processing system. It applies mainly cyclic dynamic loads to closely spaced footings and monitors its settlement displacement.
(4) The test data acquisition system includes a dynamic data acquisition instrument (collecting the values of under cyclic dynamic loads) and a JMZX-32A-integrated acquisition module. The dynamic data acquisition instrument includes displacement sensors, earth pressure boxes, accelerometers and other components. The JMZX-32A-integrated acquisition module collects the values of flexible displacement meters for a subsequent analysis of the strain of geogrid under cyclic dynamic loads.
In addition, the displacement sensor is arranged on the closely spaced footing beam to measure the settlement of the footing. The bearing capacity of the foundation can be monitored by the DJM-500 biaxial vibration electrohydraulic servo-loading system. The soil pressure distribution, acceleration response and geogrid strain inside the foundation can be measured by the earth pressure box, accelerometer and flexible displacement meter, respectively.

2.3. Test Scheme

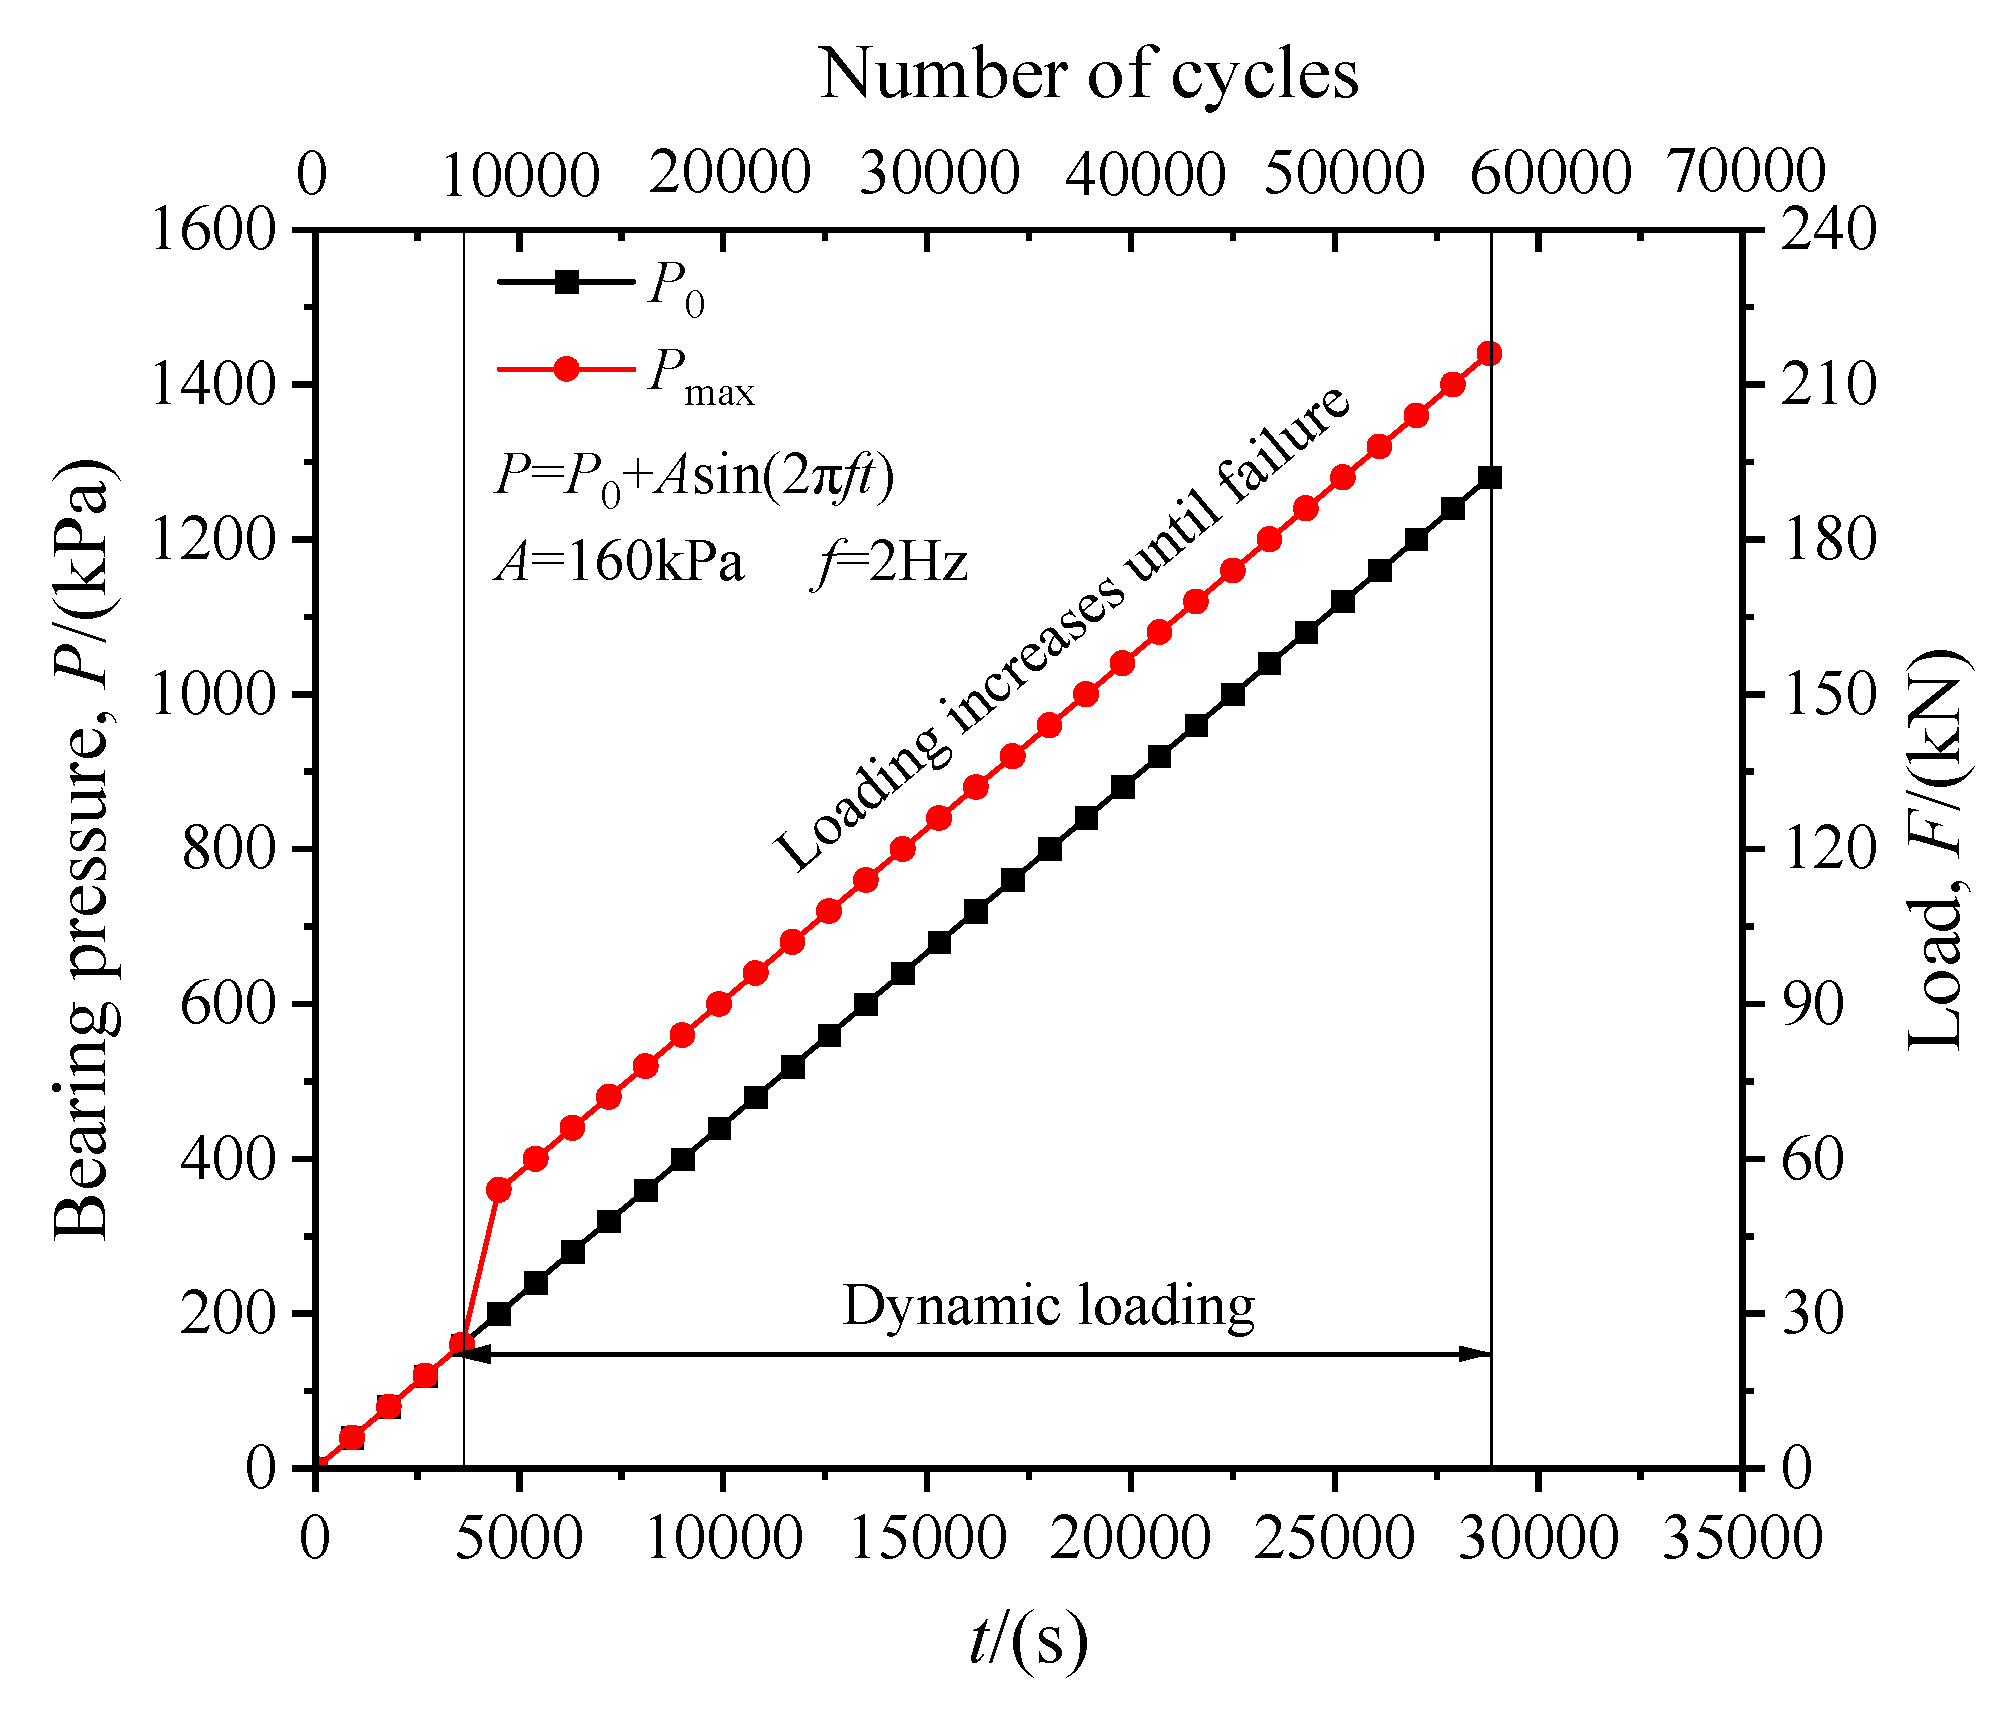
The cyclic loading method was adopted in this test is multistage loading method, which refers to the suggestion of the Engineering Geology Manual [17] and scholar Wang et al. [18,19]. The loading waveform is a sine wave, whose frequency, center value and amplitude are 2 Hz, 200 kPa and 160 kPa, respectively. The sinusoidal load function P is given as:
P = P 0 + A sin ( 2 π f t )
where P0 is the center value of dynamic load (kPa), P0 = 200 kPa; A is the amplitude of the dynamic load (kPa), A = 160 kPa; f is the frequency of dynamic loading (Hz), f = 2 Hz; and t is the time (s). In the tests, the center value of the dynamic load is adjusted to allow progressive loading at a given amplitude and frequency.
Test termination conditions refer to the relevant provisions of the Engineering Geological Manual [17] and the Code for Design of Building Foundations (GB50007-2011) [20]: (1) The settlement sharply increases, and the load-settlement curve looks like a steep drop. (2) The soil around the bearing plate obviously shows lateral extrusion.
This paper studies mainly the bearing characteristics and dynamic deformation response law of the closely spaced footing under cyclic dynamic load. Eight sets of test conditions were designed for the two factors of foundation type and closely spaced footing spacing. The specific test conditions are shown in Table 2, where B is the width of a single footing; S is the distance between the two footing centers; N is the number of geogrid layers; L is the length of geogrid-reinforced; and u is the buried depth of the first layer of geogrid.

2.4. Test Procedure

The test procedure includes mainly sand filling, instrument embedding, geogrid laying and applied dynamic load.
(1) Sand filling: first, the model box is cleaned, and the scale marked on the tempered glass surface of the model box is filled in layers. Each filling height is 0.15 m, and a total of 12 layers are filled. In the process of filling, in order to ensure the consistency of sand compaction in each test, the quality of sand filled in each test is the same, and then the sand is vibrated until dense and smooth by using a flat compactor and a 20 kg weight.
(2) Instrument embedding: the measuring elements are embedded in three layers, and the embedding heights are 1.1 m, 1.4 m and 1.7 m, respectively (see Figure 3). The filling sand reaches the predetermined position of the test instrument and embeds each element in turn. After each layer of measuring element has been buried, it is necessary to debug on the computer port and confirm that the next layer can be buried after normal operation.
(3) Geogrid laying: when the sand has been filled to the embedded depth of the geogrid, it is flatly laid in the soil. At this time, three flexible displacement meters are installed on the laid geogrid, as shown in Figure 3. In order to reduce the influence of different initial consolidation degrees caused by different filling times on the test, each filling is consolidated for 15 h and then loaded. After the consolidation has been completed, the collected data are cleared; all the measurement components are guaranteed to work normally; and the load is applied according to Formula (1).
(4) Dynamic load applied: first, the static load is applied to the closely spaced footing from 0 kPa to 160 kPa, and then the DJM-500 biaxial vibration electrohydraulic servo-loading system (P0 = 200 kPa, A = 160 kPa, f = 2 Hz) is adjusted to turn it into a dynamic load state and to start loading until the foundation is in an unstable failure state. The specific loading diagram is shown in Figure 5.

3. Test Results and Analysis

3.1. Loading Settlement Response

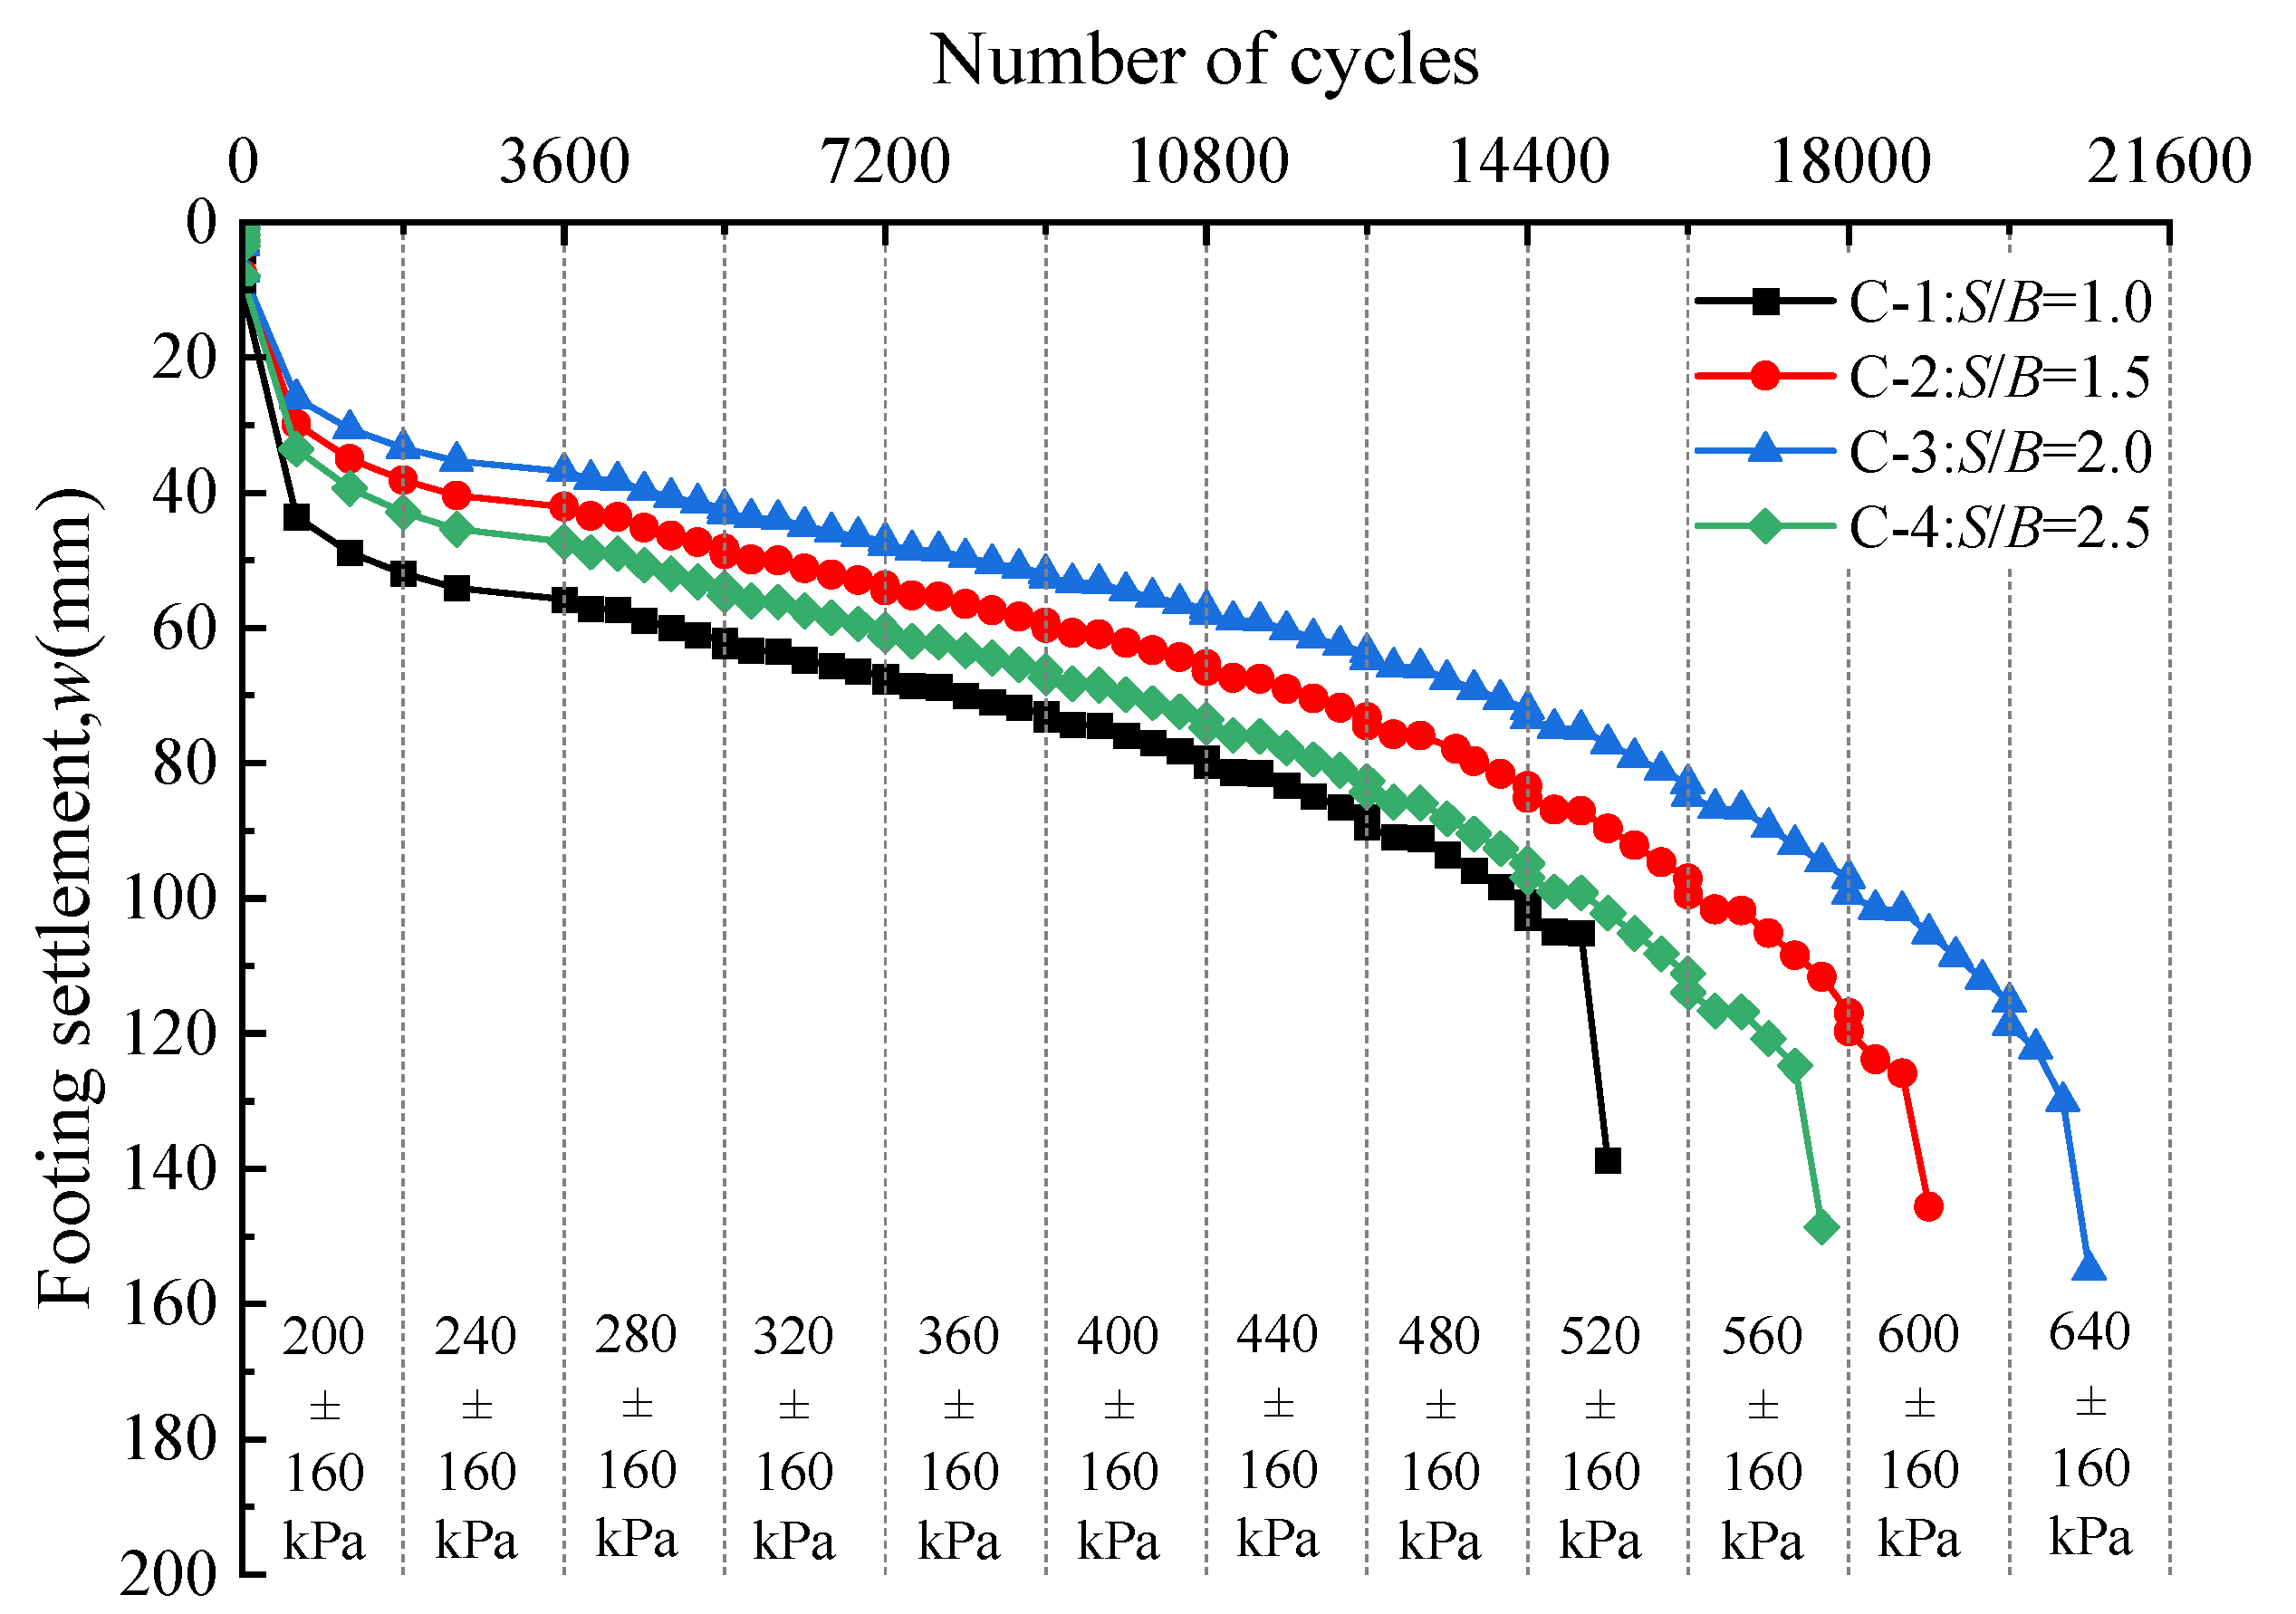
Figure 6 shows the curves of the relationship between the number of cycles and the footing settlement of the unreinforced sand foundations under closely spaced footings with different spacing ratios (S/B). It can be seen from Figure 6 that when the static load preloading stage ends, the footing settlement sharply increases in the first stage of cyclic dynamic load. When the first stage of cyclic dynamic load ends, the footing settlement slowly increases with the increase in the number of dynamic load cycles. This is because the dynamic load peak (360 kPa) of the first stage is much larger than the static load value (160 kPa) in the compaction stage, and the dynamic load cycle time is short (similar to the impact load), so that the foundation sand stress sharply increases in a short time, and the settlement also greatly increases.
In addition, it is not difficult to find from Figure 6 that the footing settlement (w) increases with the increase in the center value of cyclic dynamic load (P0) and the number of cycles (n). Under the same cyclic dynamic load, the footing settlement (w) increases with the increase in the number of cycles (n), and the ultimate load of the closely spaced footing under the failure of the unreinforced sand foundation is as follows: Pmax(S/B=1.0) = 680 kPa < Pmax(S/B=2.5) = 720 kPa < Pmax(S/B=1.5) = 760 kPa < Pmax(S/B=2.0) = 800 kPa. When S/B = 2.0, the cyclic dynamic load applied that is destroyed is the largest in the unreinforced sand foundation; that is, the ultimate bearing capacity is the largest, and the value is 800 kPa.
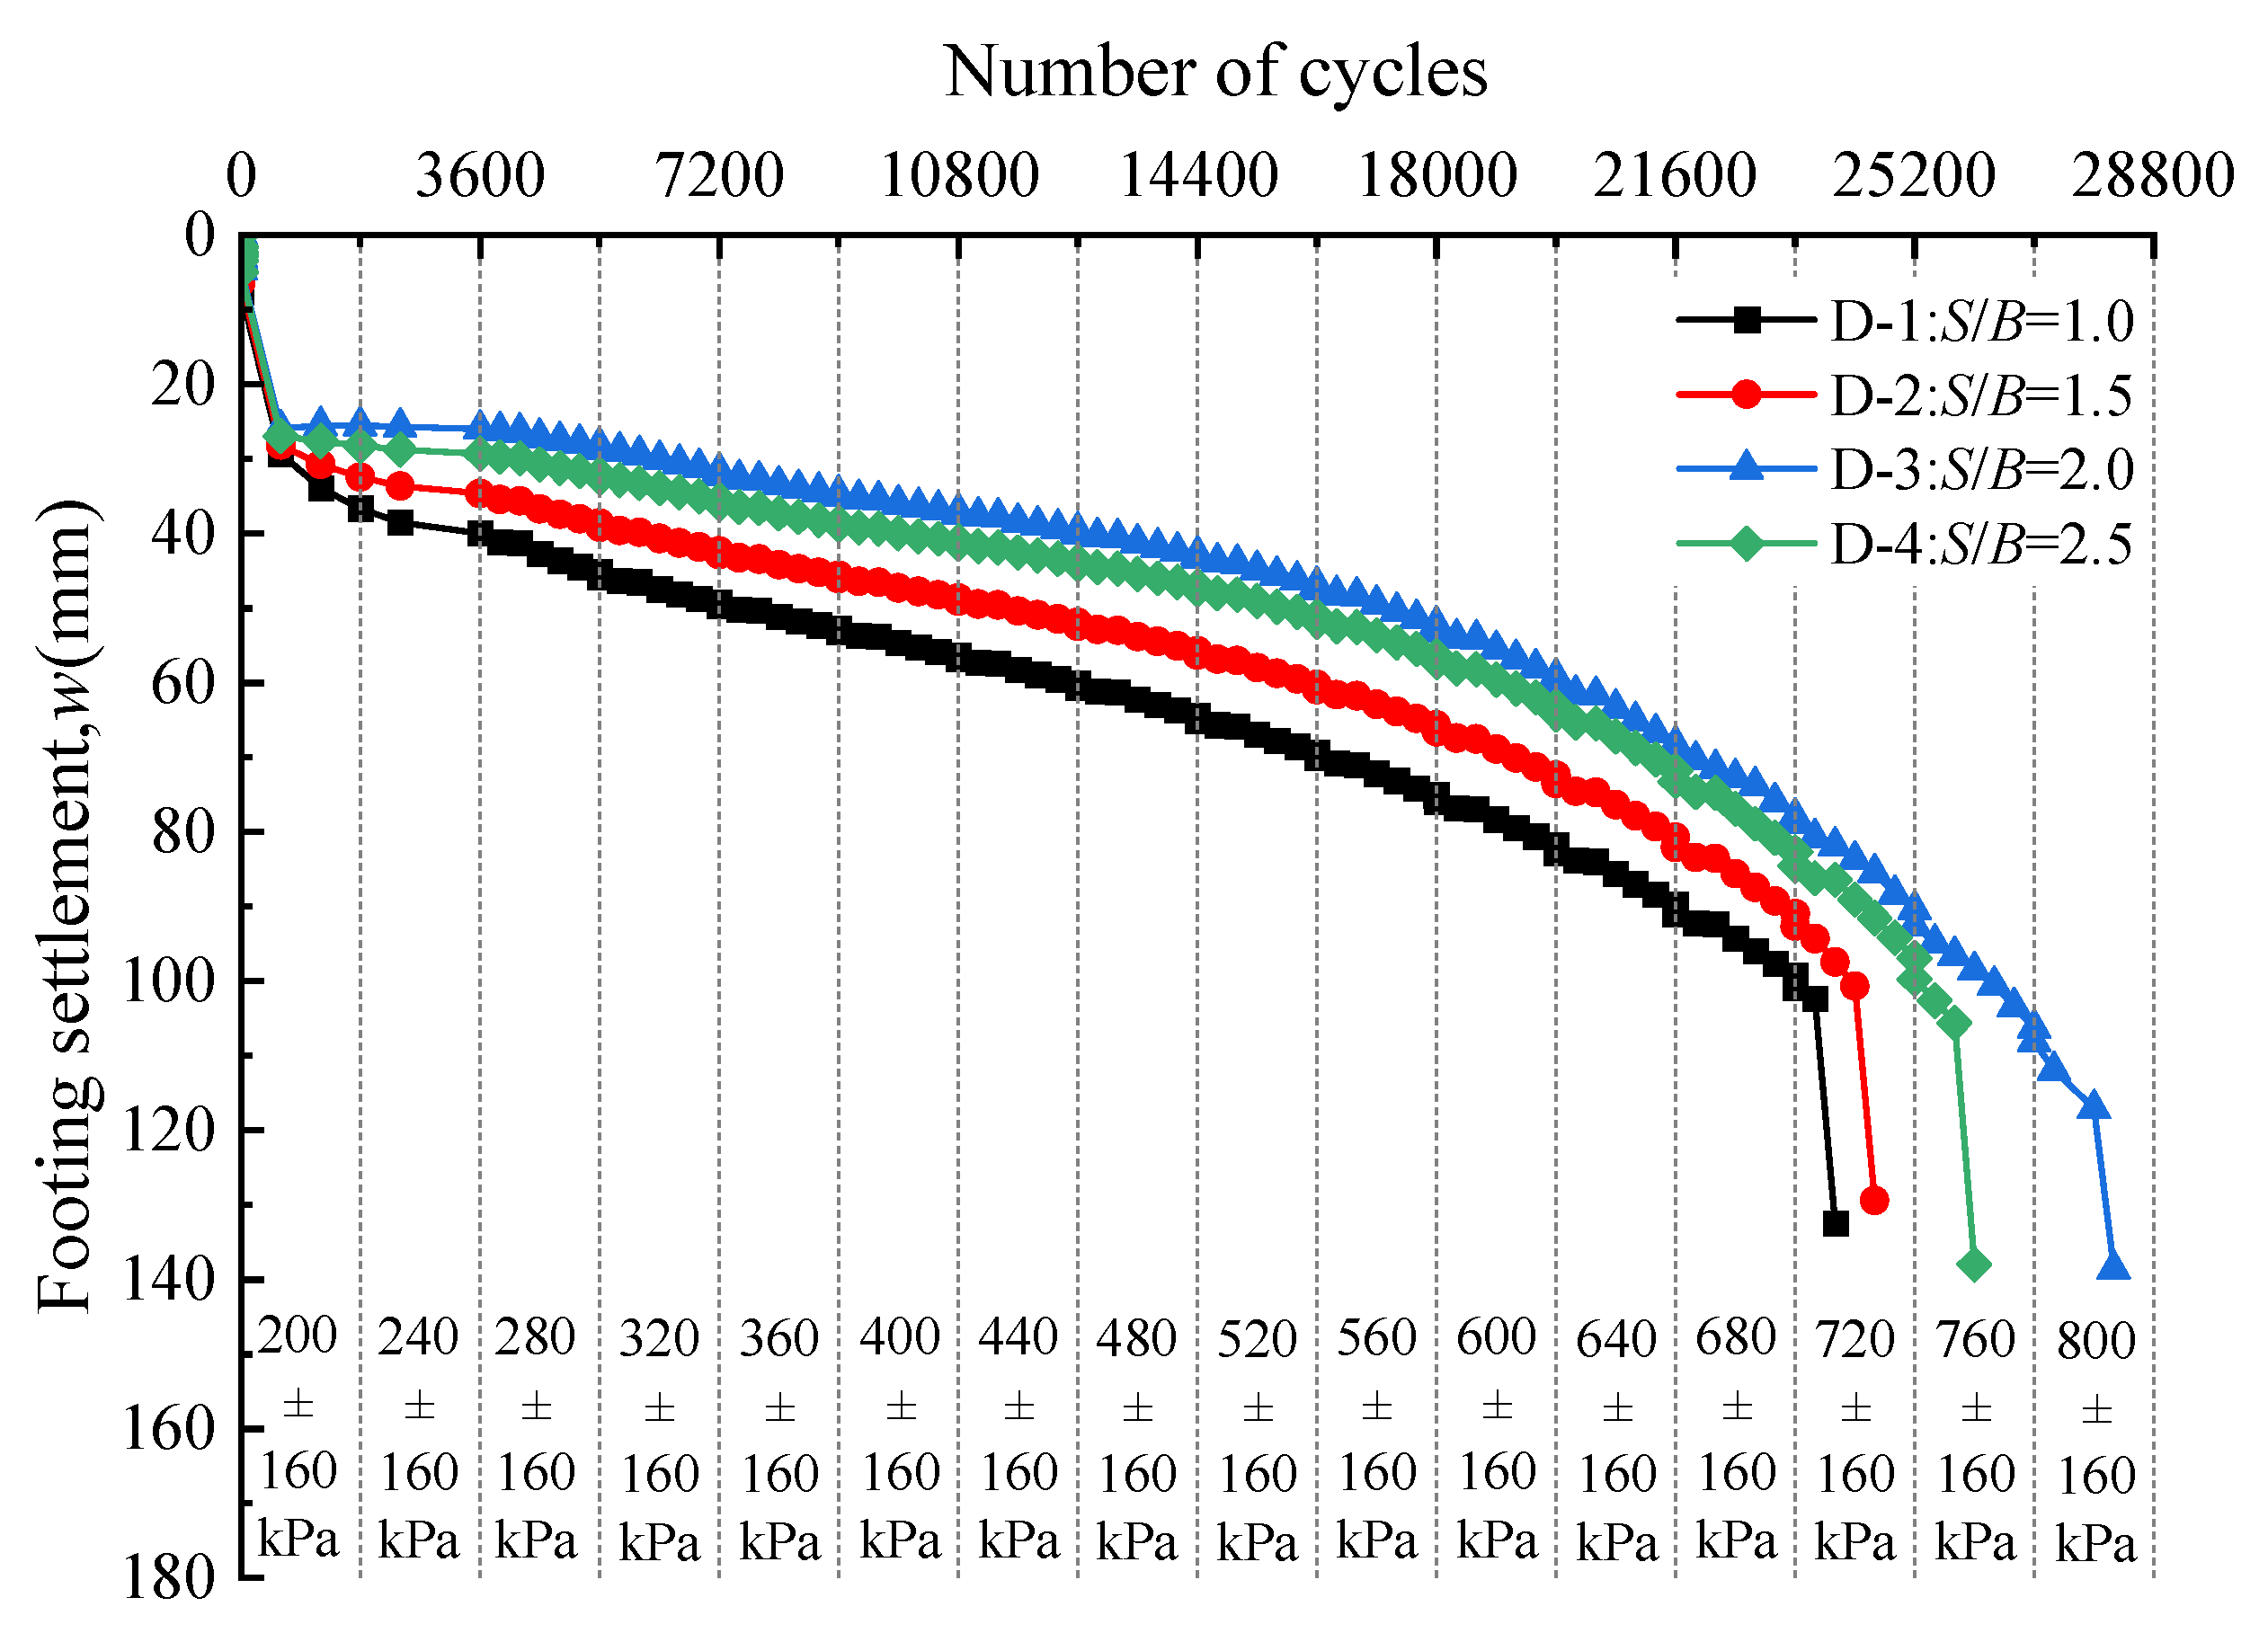
As shown in Figure 7, the number of cycles–footing settlement relationship curve of closely spaced footings with different spacing ratios (S/B) on the reinforced sand foundation is basically the same as that of unreinforced sand foundation (see Figure 6). From Figure 7, it can be seen that the ultimate bearing capacity of reinforced sand foundation under cyclic dynamic load first increases and then decreases with the increase in spacing ratios (S/B). When S/B = 2.0, the ultimate bearing capacity of the reinforced sand foundation reaches the maximum value of 960 kPa. The ultimate load of the closely spaced footing under the failure of the reinforced sand foundation is as follows: Pmax(S/B=1.0) = 880 kPa = Pmax(S/B=1.5) = 880 kPa < Pmax(S/B=2.5) = 920 kPa < Pmax(S/B=2.0) = 960 kPa.
Compared with unreinforced sand foundation (see Figure 6), the ultimate bearing capacity of reinforced sand foundation is larger than that of the unreinforced sand foundation, and the ultimate bearing capacity of reinforced sand foundation at S/B = 1.0, 1.5, 2.0, 2.5 is 1.29, 1.16, 1.20 and 1.27 times of that of the unreinforced sand foundation, respectively. In addition, by comparing Figure 6 and Figure 7, it can be seen that the relationship curves between the number of cycles and the footing settlement of the reinforced sand foundation under the same spacing ratios (S/B) is gentler. It indicates that the settlement speed of the reinforced sand foundation under cyclic dynamic load is slowed down and that the cumulative settlement is reduced. This is due to the friction between the longitudinal and transverse ribs of the geogrid and the sand particles, so that the foundation can better withstand the impact of the upper cyclic dynamic load.
On the basis of the analysis of the test results of the cyclic dynamic load on the upper part of the closely spaced footing of the unreinforced and reinforced sand foundation, it can be seen that when S/B = 2.0, the dynamic load peak of the unreinforced and reinforced sand foundation is the largest at the time of failure. The dynamic load peak applied to the failure of the reinforced sand foundation is 960 kPa; the dynamic load peak applied to the failure of the unreinforced sand foundation is 800 kPa; and the ultimate bearing capacity is increased by 20%. Therefore, in practical engineering, the spacing between closely spaced footings should be arranged according to two times the width of the footing, and the bearing capacity of the foundation should be further improved by laying geogrid.

3.2. Earth Pressure Response

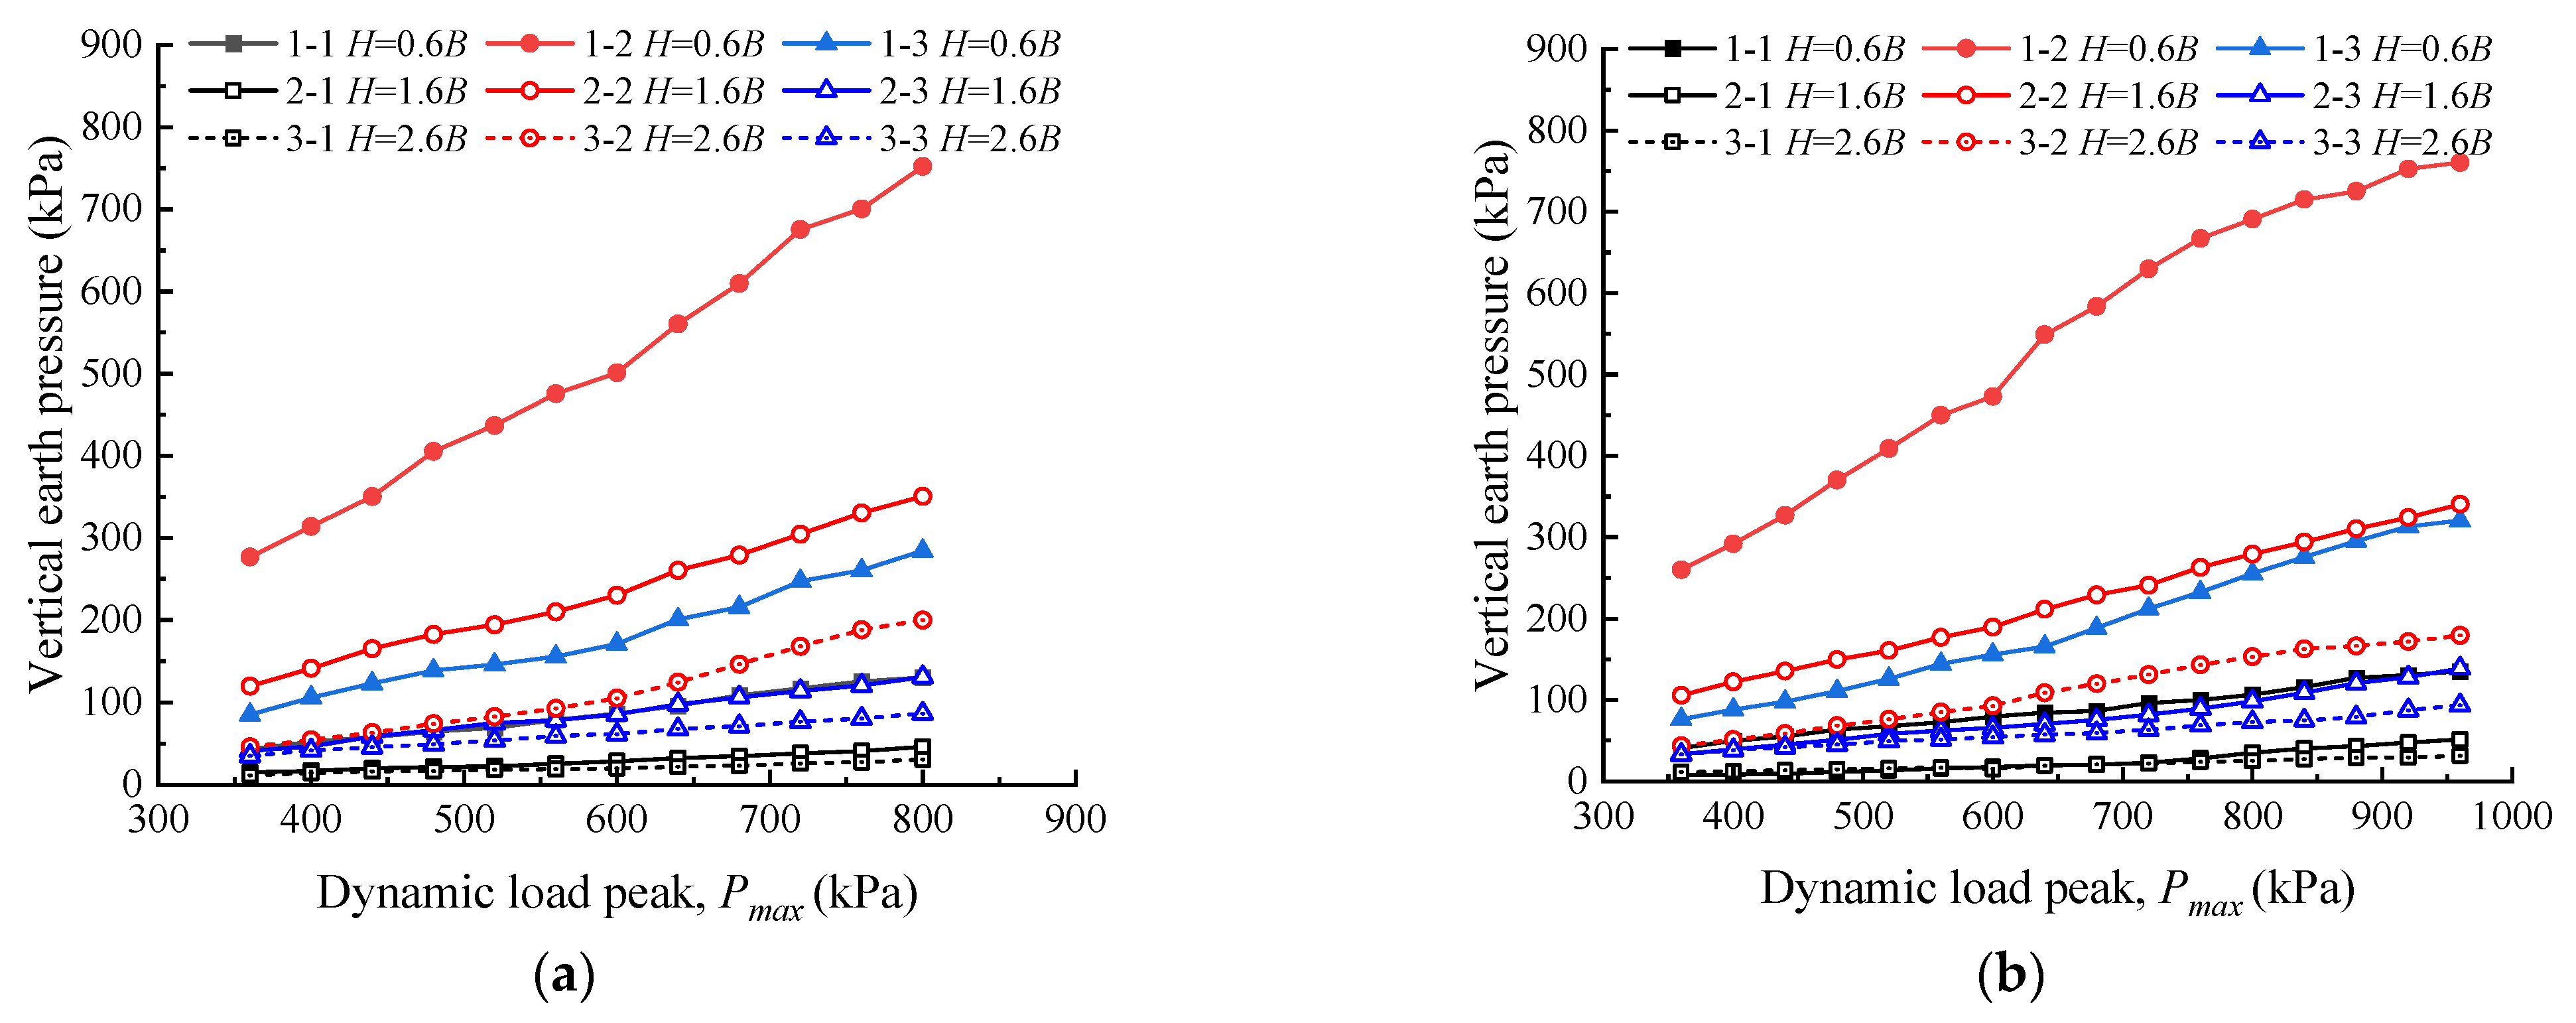
Because the dynamic soil pressure of the foundation under the action of closely spaced footings with different spacing ratios (S/B) is consistent, the case of S/B = 2.0 is selected for analysis. Figure 8 shows the vertical earth pressure–dynamic load peak curves of unreinforced and reinforced sand foundations when S/B = 2.0. The measurement position and the number for vertical earth pressure are shown in Figure 3. It can be seen from Figure 8 that the vertical earth pressure at the same buried depth increases with an increase in the dynamic load peak, and the vertical earth pressure decreases with an increase in the buried depth.
From Figure 8a, it can be seen that the vertical earth pressure distribution of unreinforced sand foundation at the same buried depth increases with the increase in the dynamic load peak, and the closer to the footing, the greater the vertical earth pressure (i.e., ‘1-2’, ‘2-2’, ‘3-2’ position), followed by the vertical earth pressure in the middle of closely spaced footings (i.e., ‘1-3’, ‘2-3’, ‘3-3’ position), and the outermost vertical earth pressure is the smallest (i.e., ‘1-1’, ‘2-1’, ‘3-1’ position). In addition, the vertical earth pressure of (‘1-3’, ‘2-3’, ‘3-3’ position) is smaller than that of (‘1-2’, ‘2-2’, ‘3-2’ position). The reasons are as follows: On one hand, the earth pressure box of (‘1-2’, ‘2-2’, ‘3-2’ position) is approximately at the center of the upper vertical dynamic load position, and the load transfer speed is faster, such that the vertical earth pressure is the largest. Qian et al. [21] studied a single footing under cyclic loading, and also found that the soil pressure below the footing was the largest, and the farther away from the footing, the smaller the soil pressure. On the other hand, the earth pressure box at (‘1-3’, ‘2-3’, ‘3-3’) is in the middle of the closely spaced footing (far away from the vibration source position relative to the bottom of the footing). At the same time, the soil in the middle of the closely spaced footing is affected by the interaction between the two footings, which changes the stress distribution in the middle of the closely spaced footing.
The vertical earth pressure distribution law of reinforced sand foundation in Figure 8b is similar to that of unreinforced sand foundation. From Figure 8b, it can be seen that under the same dynamic load, the vertical earth pressure in the reinforced sand foundation at the same position is less than that in the unreinforced sand foundation. The reason is that after the geogrid has been added to the foundation, the soil particles interact with the geogrid mesh, and the soil particles are embedded in the interior of the geogrid mesh, thus forming a good bearing layer, which enhances the diffusion of the base pressure.
In order to show the influence of geogrid on the stress distribution of foundation soil, the vertical earth pressure at different positions under the closely spaced footing of unreinforced and reinforced sand foundation (see Figure 3) is summarized in Table 3. Table 3 shows the vertical earth pressure at different measuring points in the sand foundation under the action of dynamic load peak Pmax = 760 kPa. It can be seen from Table 3 that the vertical earth pressure in reinforced sand foundation at the same buried depth is lower than that in the unreinforced sand foundation (e.g., the vertical earth pressure of the reinforced sand foundation at the buried depth H = 0.6B (i.e., ‘1-1’, ‘1-2’, ‘1-3’ position) is reduced by 26%, 5% and 13%, respectively, compared with the unreinforced sand foundation). This shows that the addition of geogrid has a certain influence on the stress distribution of the foundation soil, accelerates the attenuation of the earth pressure and shows that the reinforcement has a strong homogenization effect on the earth pressure in the foundation, which is also one of the reasons for the increase in the bearing capacity of the foundation after the reinforcement treatment. At the same time, many scholars often suggest using reinforcement on the foundation [19,22,23,24].

3.3. Strain in Geogrid under Foundation Loading

Only one layer of geogrid is laid in the reinforced sand foundation, the embedded depth of the first layer of geogrid is u = 0.6B. There are three measuring points of geogrid in each test condition. The strain of geogrid is measured by three flexible displacement meters. Figure 9 shows the strain evolution law of geogrid at different measuring points, when S/B = 1.0, 1.5, 2.0 and 2.5. It can be seen from Figure 9 that the strain of geogrid continues to increase with the increase in the dynamic load peak, and it shows a trend of nonlinear growth. When S/B = 1.0, the strain of the geogrid at the F1 position is the largest, reaching 8.9%, which is 1.7 and 3.4 times that at the F2 and F3 positions, respectively. This is due to the close distance between closely spaced footings, similar to an independent footing. The center of the closely spaced footing is the center of the independent footing, and the farther the distance from the center of the footing, the smaller the strain of geogrid, which is similar to the strain law of geogrid under the independent footing studied by Wang et al. [18]. In addition, under the same level of dynamic load, the strain of geogrid at the F1 position at the center of the closely spaced footing first decreases and then increases with the increase in S/B. When S/B = 2.0, the strain of geogrid at the F1 position is the smallest (e.g., when the dynamic load peak Pmax = 880 kPa, the strain of geogrid at F1 is 3.1% under the action of S/B = 2.0, which is 187%, 90% and 55% lower than S/B = 1.0, 1.5 and 2.5). This may indicate that the interference effect is the largest when S/B = 2.0, which limits the geogrid to producing excessive deformation and is more conducive to the stability of the foundation.
In addition, under the action of S/B = 1.0, 1.5 and 2.5, the strain of geogrid at the F1 and F2 positions are relatively close, and the strain of geogrid at the F3 position is smaller than that at F1 and F2 (e.g., when S/B = 1.5 (the dynamic load peak Pmax = 880 kPa), the strain of geogrid at F3 is 2.8%, while the strain of geogrid at the F1 and F2 positions is 2.1 times and 1.9 times that at the F3 position, respectively). However, when S/B = 2.0, the strain of geogrid at the positions of F1, F2 and F3 is relatively uniform, which also explains from the side why the ultimate bearing capacity of the reinforced sand foundation is the largest when S/B = 2.0. The reason is that when the geogrid interacts with the sand particles, the more uniform the geogrid force is, the less inclined the footing is and the greater the bearing capacity is [11].

3.4. Acceleration Response

Under the action of cyclic dynamic load, the soil vibration of the foundation is dynamically changed because of the excitation of the dynamic load, which affects the stability of the foundation. In order to obtain the acceleration response of sand foundation under different closely spaced footings, the first layer of accelerometer is arranged with the buried depth H = 0.6B below the center of the closely spaced footing. The horizontal distance between the accelerometers is l = 160 mm. The second layer of the accelerometer is arranged at the buried depth H = 1.6B, and the third layer of the accelerometer is arranged at the buried depth H = 2.6B (H is the vertical distance between the measuring element and the loading plate plane; B is the width of the footing). The specific measurement position is shown in Figure 3.
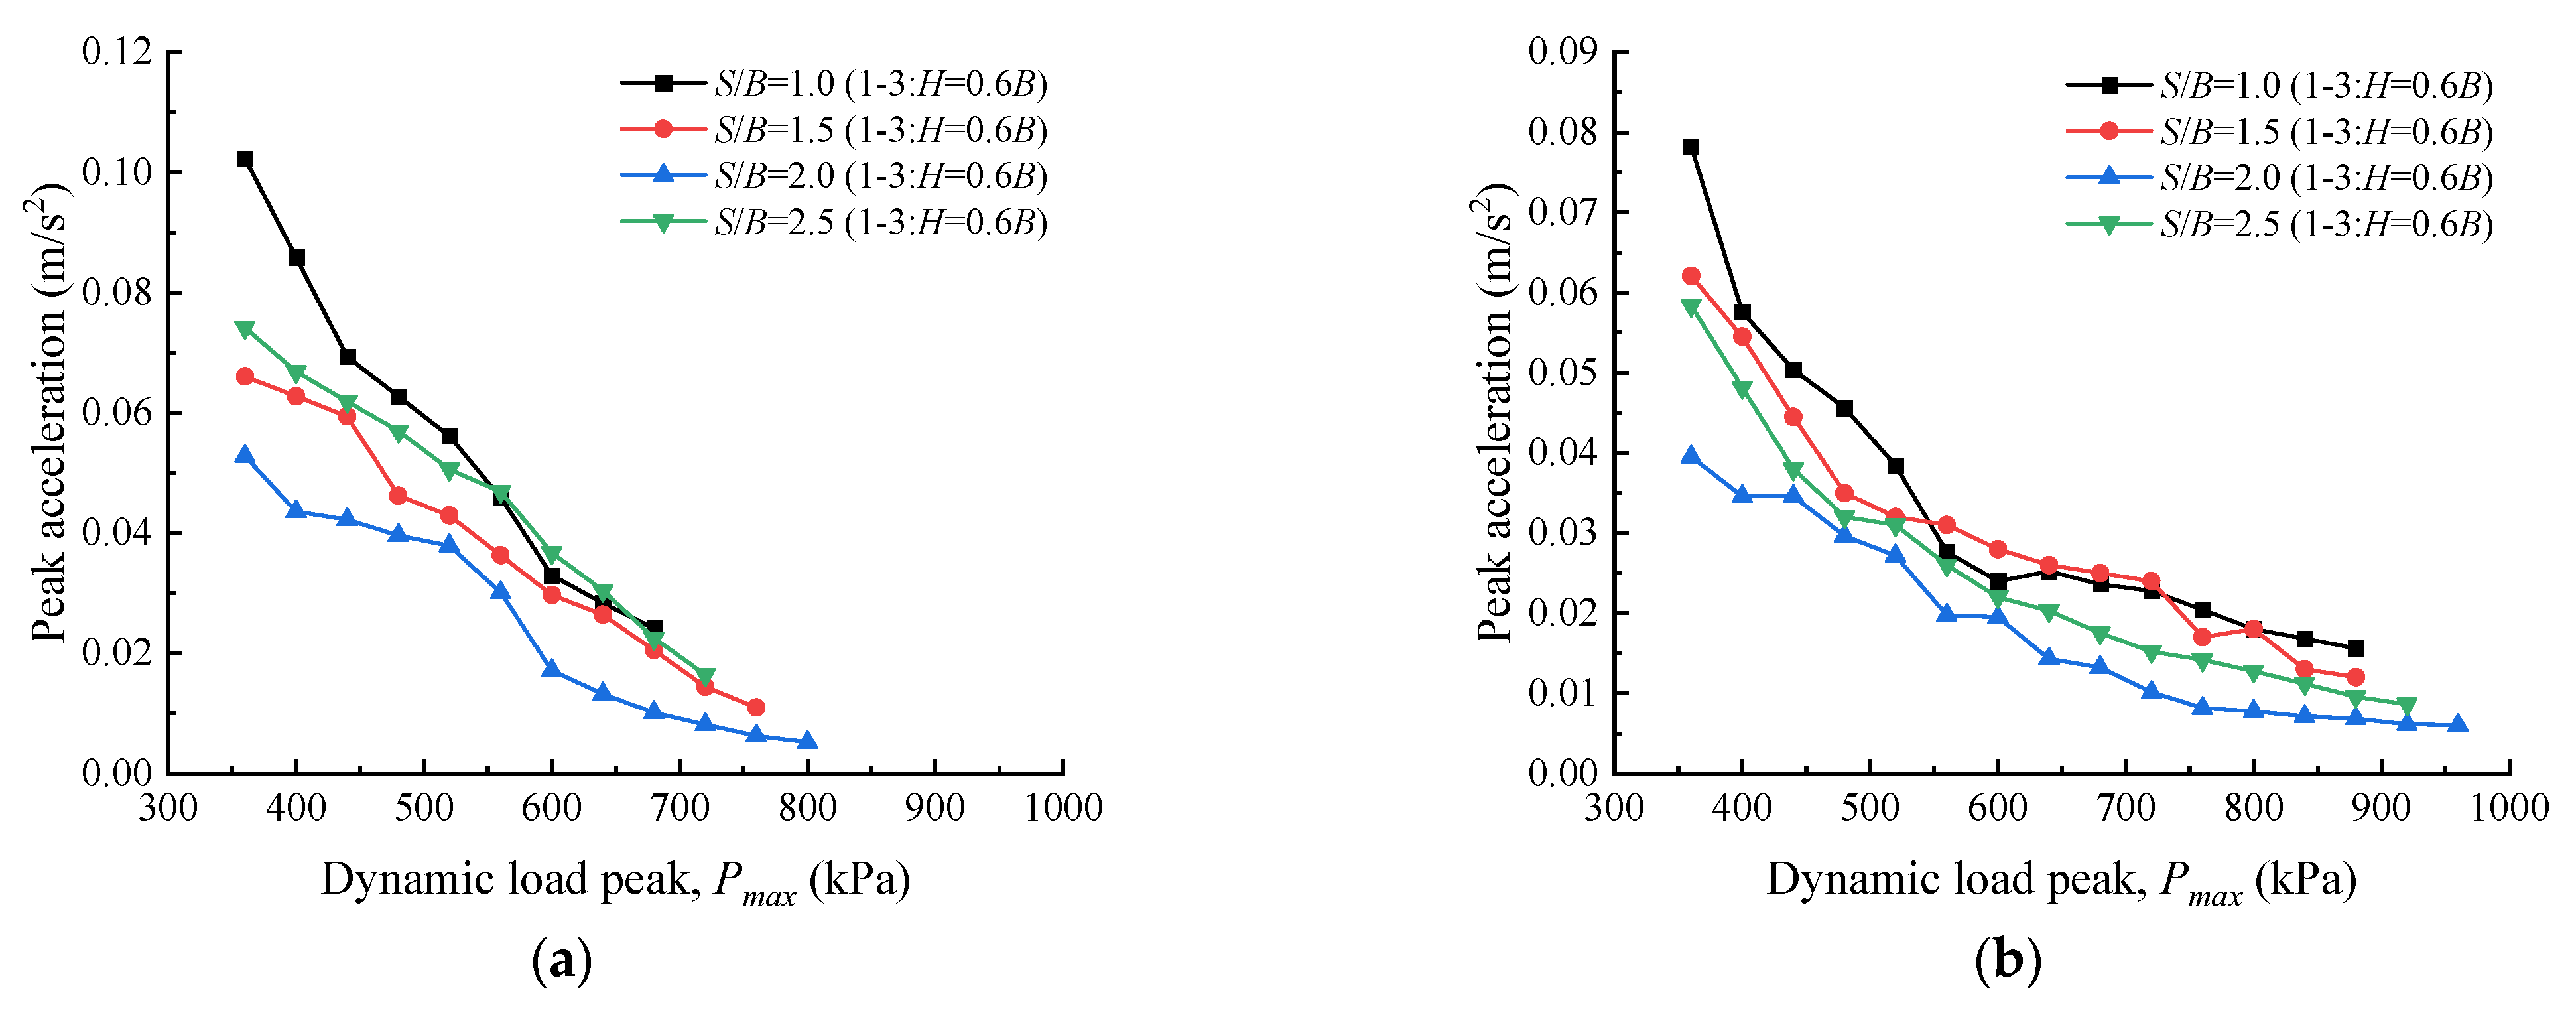
Figure 10 shows the peak acceleration curves of the sand foundation under cyclic dynamic loading with different spacing ratios. It can be seen from Figure 10 that the peak acceleration of the unreinforced and reinforced sand foundations at the center of the closely spaced footing decreases with the increase in the dynamic load peak, indicating that the foundation soil is in the process of being compacted under the dynamic load, and the stiffness of the foundation is improved, which accelerates the dissipation of acceleration in the foundation [18,19]. Second, the peak acceleration at the center of the closely spaced footing with different spacing ratios shows a trend of decreasing first and then increasing with the increase in S/B. When S/B = 2.0, the peak acceleration in the sand foundation is the smallest. The transient change of sand in the foundation under this spacing is small, which explains from the side why it is more conducive to the stability of the foundation when S/B = 2.0.
In addition, by comparing Figure 10a,b with each other, it can be seen that the decreasing trend of peak acceleration of reinforced sand foundation is gentler than that of unreinforced sand foundation, and the peak acceleration of reinforced sand foundation under dynamic load is lower than that of unreinforced sand foundation. For example, when S/B = 2.0 (Pmax = 560 kPa), the peak acceleration of reinforced sand foundation is 58% lower than that of unreinforced sand foundation, which indicates that the existence of a geogrid-reinforced layer has a good energy dissipation effect on the acceleration response of foundation soil.
Figure 11 is the evolution law of peak acceleration at different depths of the center of the closely spaced footing with a spacing ratio S/B = 2.0. It can be seen from Figure 11 that the attenuation law of peak acceleration of the unreinforced sand foundation and the reinforced sand foundation is similar. With the increase in the foundation depth (an increase in the distance from the vibration source), the peak acceleration of foundation soil continuously decreases. When the dynamic load peak Pmax = 720 kPa, the peak acceleration of the unreinforced sand foundation at the buried depth H = 1.6B and H = 2.6B is reduced by 19% and 45%, respectively, compared with the buried depth H = 0.6B, while the peak acceleration of the reinforced sand foundation at the buried depth H = 1.6B and H = 2.6B is reduced by 24% and 127%, respectively, compared with the buried depth H = 0.6B, which indicates that the attenuation speed of the dynamic response of the reinforced foundation along the depth direction is significantly greater than that of the unreinforced sand foundation.
In this section, through the analysis of the peak acceleration of the foundation soil under dynamic load, combined with the conclusions obtained in Section 3.1, Section 3.2 and Section 3.3, two suggestions are put forward for the design of closely spaced footings under cyclic load:
(1) From the aspects of ultimate bearing capacity design and engineering economic benefits, it is suggested that the spacing between closely spaced footings should be arranged according to two times the width of the footing (S/B = 2.0).
(2) In order to improve the bearing capacity of foundation and soil stability as much as possible, it is recommended to use geogrid as reinforcement.

4. Conclusions

This paper presented the experimental results of dynamic model of closely spaced footings. The test focused on the influence of the ratio of the center point spacing of closely spaced footings to the width of the footing (S/B) and the geogrid-reinforced layer on the dynamic response under cyclic (sinusoidal) load. According to the above series of dynamic tests, the following conclusions were drawn:
(1) Under cyclic dynamic load, the dynamic load peak of the foundation was the largest when S/B = 2.0, and the dynamic load peak of the reinforced sand foundation was 960 kPa, which was 20% higher than that of the unreinforced sand foundation.
(2) The vertical earth pressure at each buried depth of unreinforced and reinforced sand foundation increased with the increase in the cyclic dynamic load. Under the same dynamic load, the vertical earth pressure at each buried depth of reinforced sand foundation decreased in different degrees compared with that of unreinforced sand foundation.
(3) When S/B = 1.0, the strain law of geogrid was similar to that of geogrid under independent footing (i.e., the farther away from the center of footing, the smaller the strain of geogrid); with the increase in the distance between closely spaced footings, the strain of geogrid at the center of the closely spaced footing (F1 position) was the smallest when S/B = 2.0, which was 3.1%. Compared with S/B = 1.0, 1.5 and 2.5, it was reduced by 187%, 90% and 55%, respectively.
(4) The peak acceleration at the center of closely spaced footing (‘1-3’ position) showed a trend of first decreasing and then increasing with the increase in S/B, and the peak acceleration in the sand foundation was the smallest when S/B = 2.0 and decreased with the increase in the foundation depth (an increase in the distance from the vibration source).

Author Contributions

Paper revision and polishing, J.W. and Z.L.; laboratory experiment, H.Q. and Y.T.; paper writing, H.Q.; literature research, Y.T. All authors have read and agreed to the published version of the manuscript.

Funding

The project was funded by the Natural Science Foundation of China (No. 41962017), the Natural Science Foundation in Guangxi Province of China (No. 2022GXNSFDA035081, No. 2021GXNSFBA196043, No. 2019GXNSFBA245071), the High Level Innovation Team and Outstanding Scholars Program of Guangxi Institutions of Higher Learning of China (GuiJiaoRenCai [2020]6), the doctoral Foundation of Guangxi University of Science and Technology (No. 03200009), and the Project to Enhance the Basic Research Ability of Young and Middle-aged Teachers in Guangxi Universities (No. 2020KY08023).

Institutional Review Board Statement

Not applicable.

Informed Consent Statement

Not applicable.

Data Availability Statement

The data presented in this study are available on request from the corresponding author.

Conflicts of Interest

The authors declare no conflict of interest.

References

  1. Saha Roy, S.; Deb, K. Interference effect of closely spaced footings resting on granular fill over soft clay. Int. J. Geomech. 2019, 19, 04018181. [Google Scholar] [CrossRef]
  2. Swain, A.; Ghosh, P. Experimental study on dynamic interference effect of two closely spaced machine foundations. Can. Geotech. J. 2015, 53, 196–209. [Google Scholar] [CrossRef] [Green Version]
  3. Stuart, J.G. Interference between foundations, with special reference to surface footings in sand. Geotechnique 1962, 12, 15–22. [Google Scholar] [CrossRef]
  4. Reddy, E.S.; Borzooei, S.; Reddy, G.N. Interference between adjacent footings on sand. Int. J. Adv. Eng. Res. Stud. 2012, 1, 95–98. [Google Scholar]
  5. Graham, J.; Raymond, G.P.; Suppiah, A. Bearing capacity of three closely-spaced footings on sand. Geotechnique 1984, 34, 173–181. [Google Scholar] [CrossRef]
  6. Das, P.E.; AS, F.; Braja, M.; Puri, V.K.; Neo, B.K. Interference effects between two surface footings on layered soil. Transp. Res. Rec. 1993, 1406, 34–40. [Google Scholar]
  7. Kumar, J.; Ghosh, P. Upper bound limit analysis for finding interference effect of two nearby strip footings on sand. Geotech. Geol. Eng. 2007, 25, 499–507. [Google Scholar] [CrossRef]
  8. Kumar, J.; Bhoi, M.K. Interference of two closely spaced strip footings on sand using model tests. J. Geotech. Geoenviron. Eng. 2009, 135, 595–604. [Google Scholar] [CrossRef]
  9. Ghazavi, M.; Lavasan, A.A. Interference effect of shallow foundations constructed on sand reinforced with geosynthetics. Geotext. Geomembr. 2008, 26, 404–415. [Google Scholar] [CrossRef]
  10. Ghosh, P.; Kumar, S. Interference effect of two nearby strip surface footings on cohesionless layered soil. Int. J. Geotech. Eng. 2011, 5, 87–94. [Google Scholar] [CrossRef]
  11. Lavasan, A.A.; Ghazavi, M. Behavior of closely spaced square and circular footings on reinforced sand. Soils Found. 2012, 52, 160–167. [Google Scholar] [CrossRef] [Green Version]
  12. Roy, S.S.; Deb, K. Effect of aspect ratio of footing on behavior of two closely-spaced footings on geogrid-reinforced sand. Geotext. Geomembr. 2020, 48, 443–453. [Google Scholar]
  13. Naderi, E.; Hataf, N. Model testing and numerical investigation of interference effect of closely spaced ring and circular footings on reinforced sand. Geotext. Geomembr. 2014, 42, 191–200. [Google Scholar] [CrossRef]
  14. Dehkordi, P.F.; Ghazavi, M.; Ganjian, N.; Karim, U.F.A. Effect of geocell-reinforced sand base on bearing capacity of twin circular footings. Geosynth. Int. 2019, 26, 224–236. [Google Scholar] [CrossRef]
  15. Vivek, P.; Ghosh, P. Dynamic interaction of two nearby machine foundations on homogeneous soil. In Proceedings of the GeoCongress 2012: State of the Art and Practice in Geotechnical Engineering, Oakland, CA, USA, 25–29 March 2012; pp. 21–30. [Google Scholar]
  16. ASTM D2487-17; Standard Practice for Classifification of Soils for Engineering Purposes (Unifified Soil Classifification System). ASTM International: West Conshohocken, PA, USA, 2017.
  17. Engineering Geology Handbook Compilation Committee. Engineering Geology Handbook, 4th ed.; Architecture and Building Press: Beijing, China, 2007; pp. 218–224. (In Chinese) [Google Scholar]
  18. Wang, J.Q.; Zhang, L.L.; Xue, J.F.; Tang, Y. Load-settlement response of shallow square footings on geogrid-reinforced sand under cyclic loading. Geotext. Geomembr. 2018, 46, 586–596. [Google Scholar] [CrossRef]
  19. Wang, J.Q.; Zhang, L.L.; Tang, Y.; Huang, S.B. Influence of reinforcement-arrangements on dynamic response of geogrid-reinforced foundation under repeated loading. Constr. Build. Mater. 2021, 274, 122093. [Google Scholar] [CrossRef]
  20. China Academy of Building Research. GB50007-2011 Code for Design of Builiding Foundation; Architecture and Building Press: Beijing, China, 2011; pp. 124–126. (In Chinese) [Google Scholar]
  21. Qian, Y.; Han, J.; Pokharel, S.K.; Parsons, R.L. Stress analysis on triangular-aperture geogrid-reinforced bases over weak subgrade under cyclic loading: An experimental study. Transp. Res. Rec. 2011, 2204, 83–91. [Google Scholar] [CrossRef]
  22. Adams, M.T.; Collin, J.G. Large model spread footing load tests on geosynthetic reinforced soil foundations. J. Geotech. Geoenviron. Eng. 1997, 123, 66–72. [Google Scholar] [CrossRef]
  23. Choudhary, A.K.; Jha, J.N.; Gill, K.S. Laboratory investigation of bearing capacity behaviour of strip footing on reinforced flyash slope. Geotext. Geomembr. 2010, 28, 393–402. [Google Scholar] [CrossRef]
  24. Suku, L.; Prabhu, S.S.; Babu, G.S. Effect of geogrid-reinforcement in granular bases under repeated loading. Geotext. Geomembr. 2017, 45, 377–389. [Google Scholar] [CrossRef]
Figure 1. Particle gradation curve of sand.
Sustainability 15 00438 g001
Figure 2. Test geogrid.
Sustainability 15 00438 g002
Figure 3. Laboratory test device: (a) schematic diagram; (b) photograph.
Sustainability 15 00438 g003
Figure 4. Photographs of a closely spaced square footing.
Sustainability 15 00438 g004
Figure 5. The pattern of loading.
Sustainability 15 00438 g005
Figure 6. Number of cycles–footing settlement relationship curve of the unreinforced sand foundation.
Sustainability 15 00438 g006
Figure 7. Number of cycles–footing settlement relationship curve of the reinforced sand foundation.
Sustainability 15 00438 g007
Figure 8. Distribution of vertical earth pressure at different depths of sand foundation (S/B = 2.0): (a) unreinforced sand foundation; (b) reinforced sand foundation.
Sustainability 15 00438 g008
Figure 9. Strain evolution law of geogrid under different spacing ratios: (a) S/B = 1.0; (b) S/B = 1.5; (c) S/B = 2.0; and (d) S/B = 2.5.
Sustainability 15 00438 g009aSustainability 15 00438 g009b
Figure 10. Evolution law of peak acceleration under different spacing ratios: (a) unreinforced sand foundation; (b) reinforced sand foundation.
Sustainability 15 00438 g010
Figure 11. Evolution law of peak acceleration at different buried depths under spacing ratio S/B = 2.0: (a) unreinforced sand foundation; (b) reinforced sand foundation.
Sustainability 15 00438 g011
Table 1. Specific technical indicators of geogrid.
ItemValue
Longitudinal ultimate tensile strength (kN/m)31.4
Transverse ultimate tensile strength (kN/m)32.5
Longitudinal yield elongation (%)13.4
Transverse yield elongation (%)13.6
Tensile strength at 2% elongation in the longitudinal direction (kN/m)13.7
Tensile strength at 2% elongation in the transverse direction (kN/m)14.0
Tensile strength at 5% elongation in the longitudinal direction (kN/m)24.3
Tensile strength at 5% elongation in the transverse direction (kN/m)24.7
Aperture size (mm × mm)40 × 40
Table 2. Test conditions.
Type of FoundationTest SeriesS/BGeogrid Layout Typef
(Hz)
A
(kPa)
P0
(kPa)
NL (m)u (m)
unreinforcedC-11Level layout2160200---
C-21.5---
C-32---
C-42.5---
Geogrid-reinforcedD-1119.3B0.6B
D-21.519.3B0.6B
D-3219.3B0.6B
D-42.519.3B0.6B
Table 3. Summary of vertical earth pressure variation at different positions (Pmax = 760 kPa).
Measurement PositionVertical Earth Pressure of Unreinforced Sand Foundation/kPaVertical Earth Pressure of Reinforced Sand Foundation/kPaVertical Earth Pressure Reduction Ratio/%
1-112610026%
2-1412846%
3-1272413%
1-27016675%
2-233126326%
3-218814331%
1-326123213%
2-31218936%
3-3806916%
Disclaimer/Publisher’s Note: The statements, opinions and data contained in all publications are solely those of the individual author(s) and contributor(s) and not of MDPI and/or the editor(s). MDPI and/or the editor(s) disclaim responsibility for any injury to people or property resulting from any ideas, methods, instructions or products referred to in the content.