Article

Case Study on Dynamic Identification of Overburden Fracture and Strong Mine Pressure Mechanism of Isolated Working Face Based on Microseismic Clustering

1
School of Mines, China University of Mining and Technology, Xuzhou 221116, China
2
State Key Laboratory of Coal Resources and Safe Mining, University of Mining and Technology, Xuzhou 221116, China
3
Jinneng Holding Group, Datong 037003, China
*
Author to whom correspondence should be addressed.
Sustainability 2023, 15(1), 436; https://doi.org/10.3390/su15010436
Submission received: 6 October 2022 / Revised: 22 December 2022 / Accepted: 23 December 2022 / Published: 27 December 2022
(This article belongs to the Special Issue Advances in Dynamic Hazards Prevention in Underground Mines)

Abstract

:
Strong mine pressure has a great impact upon the safety production of coal mines. Microseismic information provides a more advanced technical means for overburden fracture dynamic identification and mine pressure mechanism research, since it contains rich information on rock fracture sources. In this study, the isolated LW8102 working face in Tongxin Mine was investigated in order to propose a spatio-temporal microseismic event data analysis method based on the k-means clustering algorithm. This algorithm can handle dynamic identification of overburden fractures constrained by spatiotemporally discrete distributions of microseismic events. This provided the dynamic extension process and the fracture distribution pattern of the overburden: eight fracture extensions were formed in the overburden. In each extension, vertical fractures connected the low and high rock layers in the LW8102 and LW8103 goafs, and through fractures connected the LW8102 and LW8103 goafs in their high, middle, and low levels. Some extensions had fractures that were connected to form a closed loop structure. In the vertical fracture, there was a tendency for one or two layers of the stratum to fail first, and then extend to one or both sides. The process of through and vertical fracture propagation followed a certain temporal sequence, reflected primarily in two forms: firstly, as the vertical fracture extended to a certain layer, it provided the initial rupture space for through fracture spreading; secondly, the through fracture first broke, and then extended to the vertical fracture until it intersected with the vertical fracture or provided the initial rupture space for the expansion of the vertical fracture. By matching the overburden fracture to the mine pressure that responded to the support resistance, we analyzed the mechanism of mine pressure at the working face. Through fracture at the high level was found to be the primary cause of the occurrence of mining pressure. It was precisely placed that the formation of multiple adjacent high through fractures 110 m from the floor, triggering simultaneous instability motion of the lower multi-layer level rock; this was the main reason for the phenomenon of strong mine pressure at the working face. Meanwhile, high through fracture at 80 m from the floor was the main reason for the phenomenon of large mine pressure at the working face.

1. Introduction

Preventing and controlling strong mine pressure has always been the key but challenging part of China’s mining activities. The phenomenon of strong mine pressure disasters appears under the extra thick coal seam mining conditions in the Datong hard roof mining area, manifested by severe rib spalling of the stope, the abrupt and drastic downcutting of the supporting column or even the pressure frame, and the heavy deformation of the mining roadway. It should be noted that under isolated working face conditions, the phenomenon of strong mine pressure is abnormally prominent, severely affecting safe production [1,2]. Scholars have carried out a great deal of research in this regard, concluding that the formation of a gradually evolving roof group structure with the characteristics of “low-level composite cantilever beam, masonry median beam and high-level structure” is the main reason for the high pressure. The unstable linkage of the high-level roof is the primary driver for the generation of strong pressure [3,4]. The structure of the roof arch in the mined-out area combined with the concentrated load transfer of the coal pillar reinforces the induced strong pressure [5] Affected by mining advance abutment pressure and bidirectional high abutment pressure of suspended roofs in adjacent working face goafs, the mine pressure will be higher [6]. Based on the above results, it is possible to recognize the causes of high mine pressure under such conditions. However, the results are based on indirect research methods, such as support resistance observation, numerical simulation, and theoretical analysis, and it is difficult to provide an accurate identification and determination of the dynamic spatial and temporal evolution laws of the overlying roof fracture, the dynamic destabilization mechanism, and the layer position of the rock formation controlled by the fracture, making it difficult to analyze and control the fracture destabilization activity of rock formations accurately. Therefore, it is important to use microseismic information to dynamically identify overburden fractures, and to analyze the mechanism of strong pressure in order to prevent and control roof disasters under such conditions.
Microseismic events contain rich information about the sources of rock rupture, through which analysis of the rock fracture network, seismic parameters, and the seismic mechanism for internal observation of the rock rupture process can be realized; moreover, the development mechanism of rock engineering hazards can be revealed, providing a more advanced technical means to solve the above problems. However, due to the discrete spatial and temporal distributions of microseismic events, it has been difficult to make a breakthrough in the study of dynamic identification of overburden fractures and mine pressure mechanisms at working faces using microseismic information [7,8,9]. To address this issue, some scholars initially conducted studies from the perspective of mining activities and microseismic event distribution characteristics [10,11]. These studies have shown that mining-induced microseismicity is caused by the fracturing of intact rock as a result of the sudden release of accumulated strain energy around underground openings. The occurrence and distribution of seismicity are affected by a combination of exploitation-induced, tectonic, and coseismic stresses [12,13,14]. In most cases, coal extraction has the most pronounced effect on the stressful environment. As such, induced microseismic characteristics are closely correlated with mining activity in temporal and spatial sequences [15]. Microseismic events tend to cluster close to the open cut [16]. In the process of longwall coal mining, most seismic sources occur in the range of 10 to 80 m to 100 to 200 m in front of the working face [17,18,19]. The microseismic events recorded at the Velenje Mine were spatially correlated with face advancement [20]. A significant temporal correlation of the monitored microseismic signals was observed during different excavation rounds. The majority of microseismic events occurred within 24 h after excavation, but several occurred up to 10 days after excavation [21]. The locations of microseismic occurrences overlap with stress concentration areas, and the frequency of microseismic event counts correlate well with the intensity of mining, while the energy magnitude and spatial distribution of microseismic events correlate poorly with the intensity of mining [13]. The spatial distribution characteristics of microseismic events are complicated, and it is difficult to determine the evolutionary trend of microseismicity over time, but the energy density clouds exhibit obvious nucleation characteristics [22].
In recent years, there has also been some research on the use of microseismic information to describe rock movement and explain the derived mine pressure phenomenon at the working face. Ma, C. C. efficiently interpreted progressive rupture effects in microseismic event clusters by feeding microseismic information into numerical simulations [7]. Yu, G. F. found that the high-energy microseismic events at Dongjiahe coal mine LW22517 were generated by the increased scale of overburden destruction as the insufficient mining stage entered the sufficient mining stage [23]. Pang Huan-dong inferred that micro-earthquake phenomena in the coal mine production site are mainly caused by shear action [24]. Cheng Yunhai found that the rock layer above the main roof of the three goaf sides formed a “C” shaped spatial structure, with microseismic events distributed on the outer side to constitute the rock rupture zone; meanwhile, the inner side of the “C” structure was the high-stress zone [25]. Cai Wu found that the distribution of large-energy microseismic events in Gansu Huating coal mine LW250103 showed an arch-shaped spreading of the mine seismic envelope during the mining period, which was in agreement the results presented by the ‘masonry beam’ assumption and numerical simulations [26].
In order to further study the fracture characteristics of the overburden and the mine pressure mechanism using microseismic information, in this study, the isolated working face LW8102 in Tongxin mine was investigated. A clustering algorithm for the integration of spatial and temporal characteristics of microseismic events was adopted to address the discrete spatial and temporal distributions of microseismic events. In turn, the dynamic expansion process and spatial and temporal distributions of the overburden fracture were analyzed in an attempt to provide a basis for the mechanism and control of mine pressure at the working face.

2. Working Face Conditions and Microseismic Monitoring Data

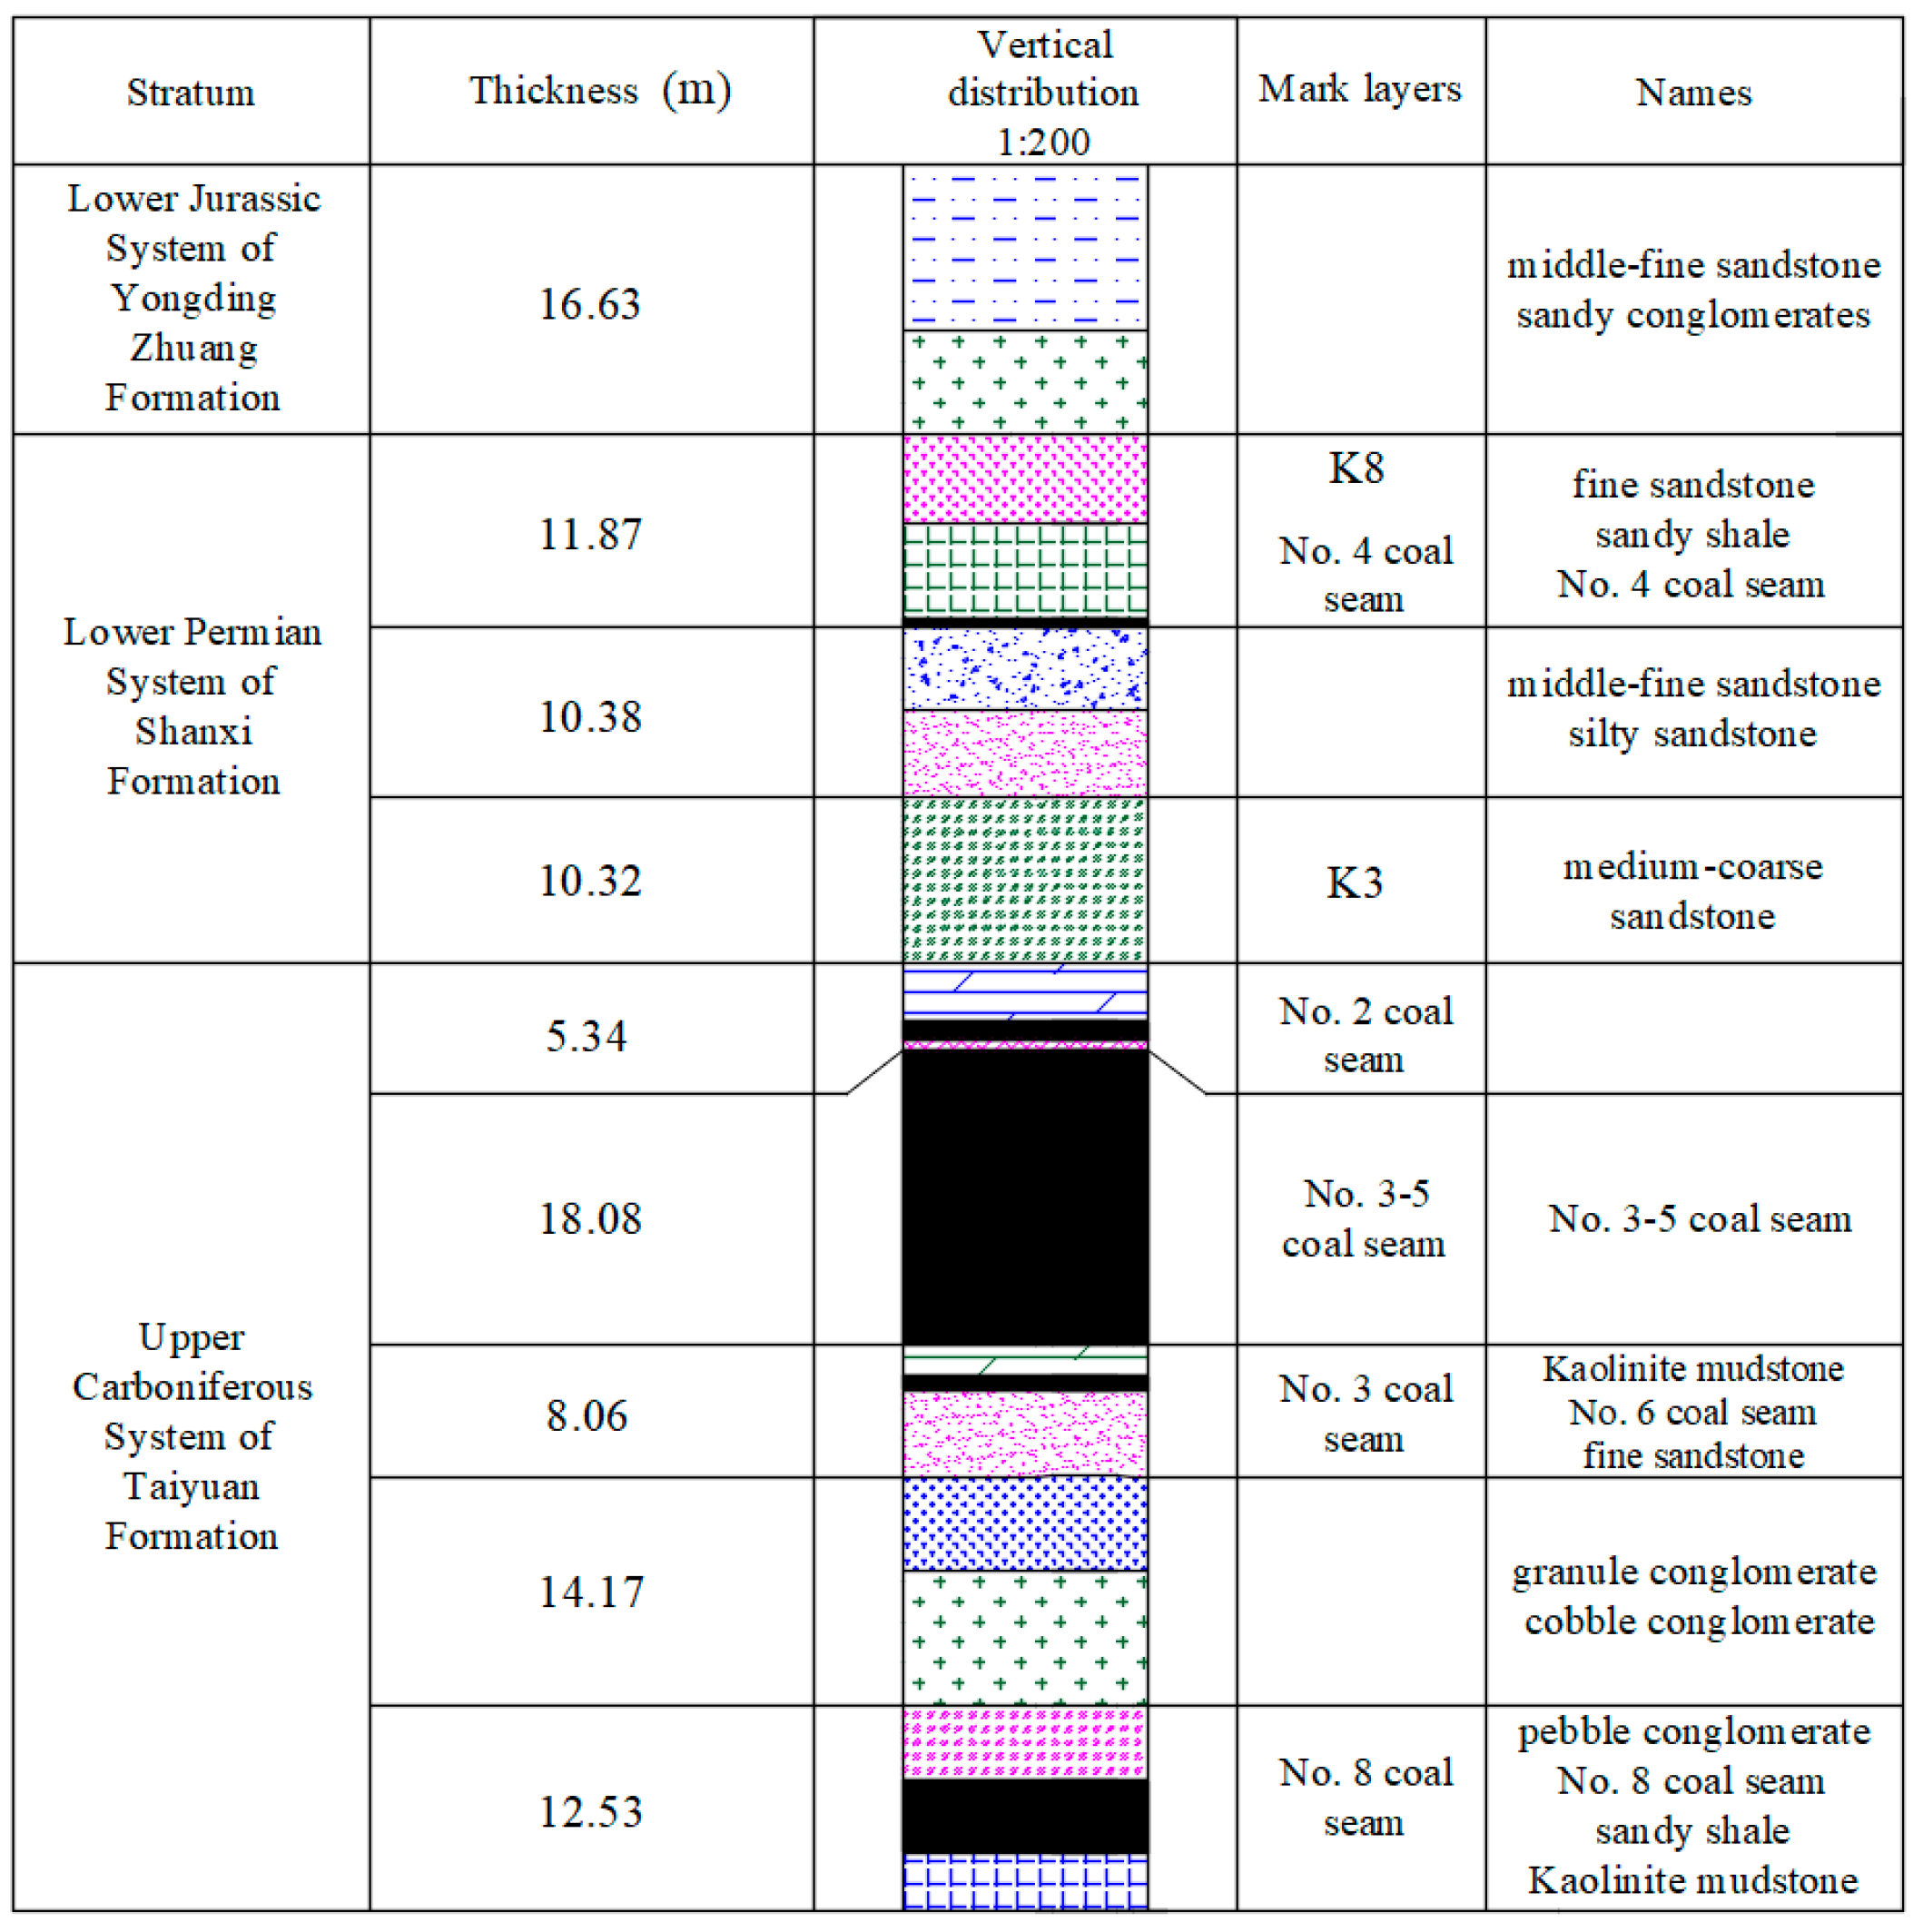
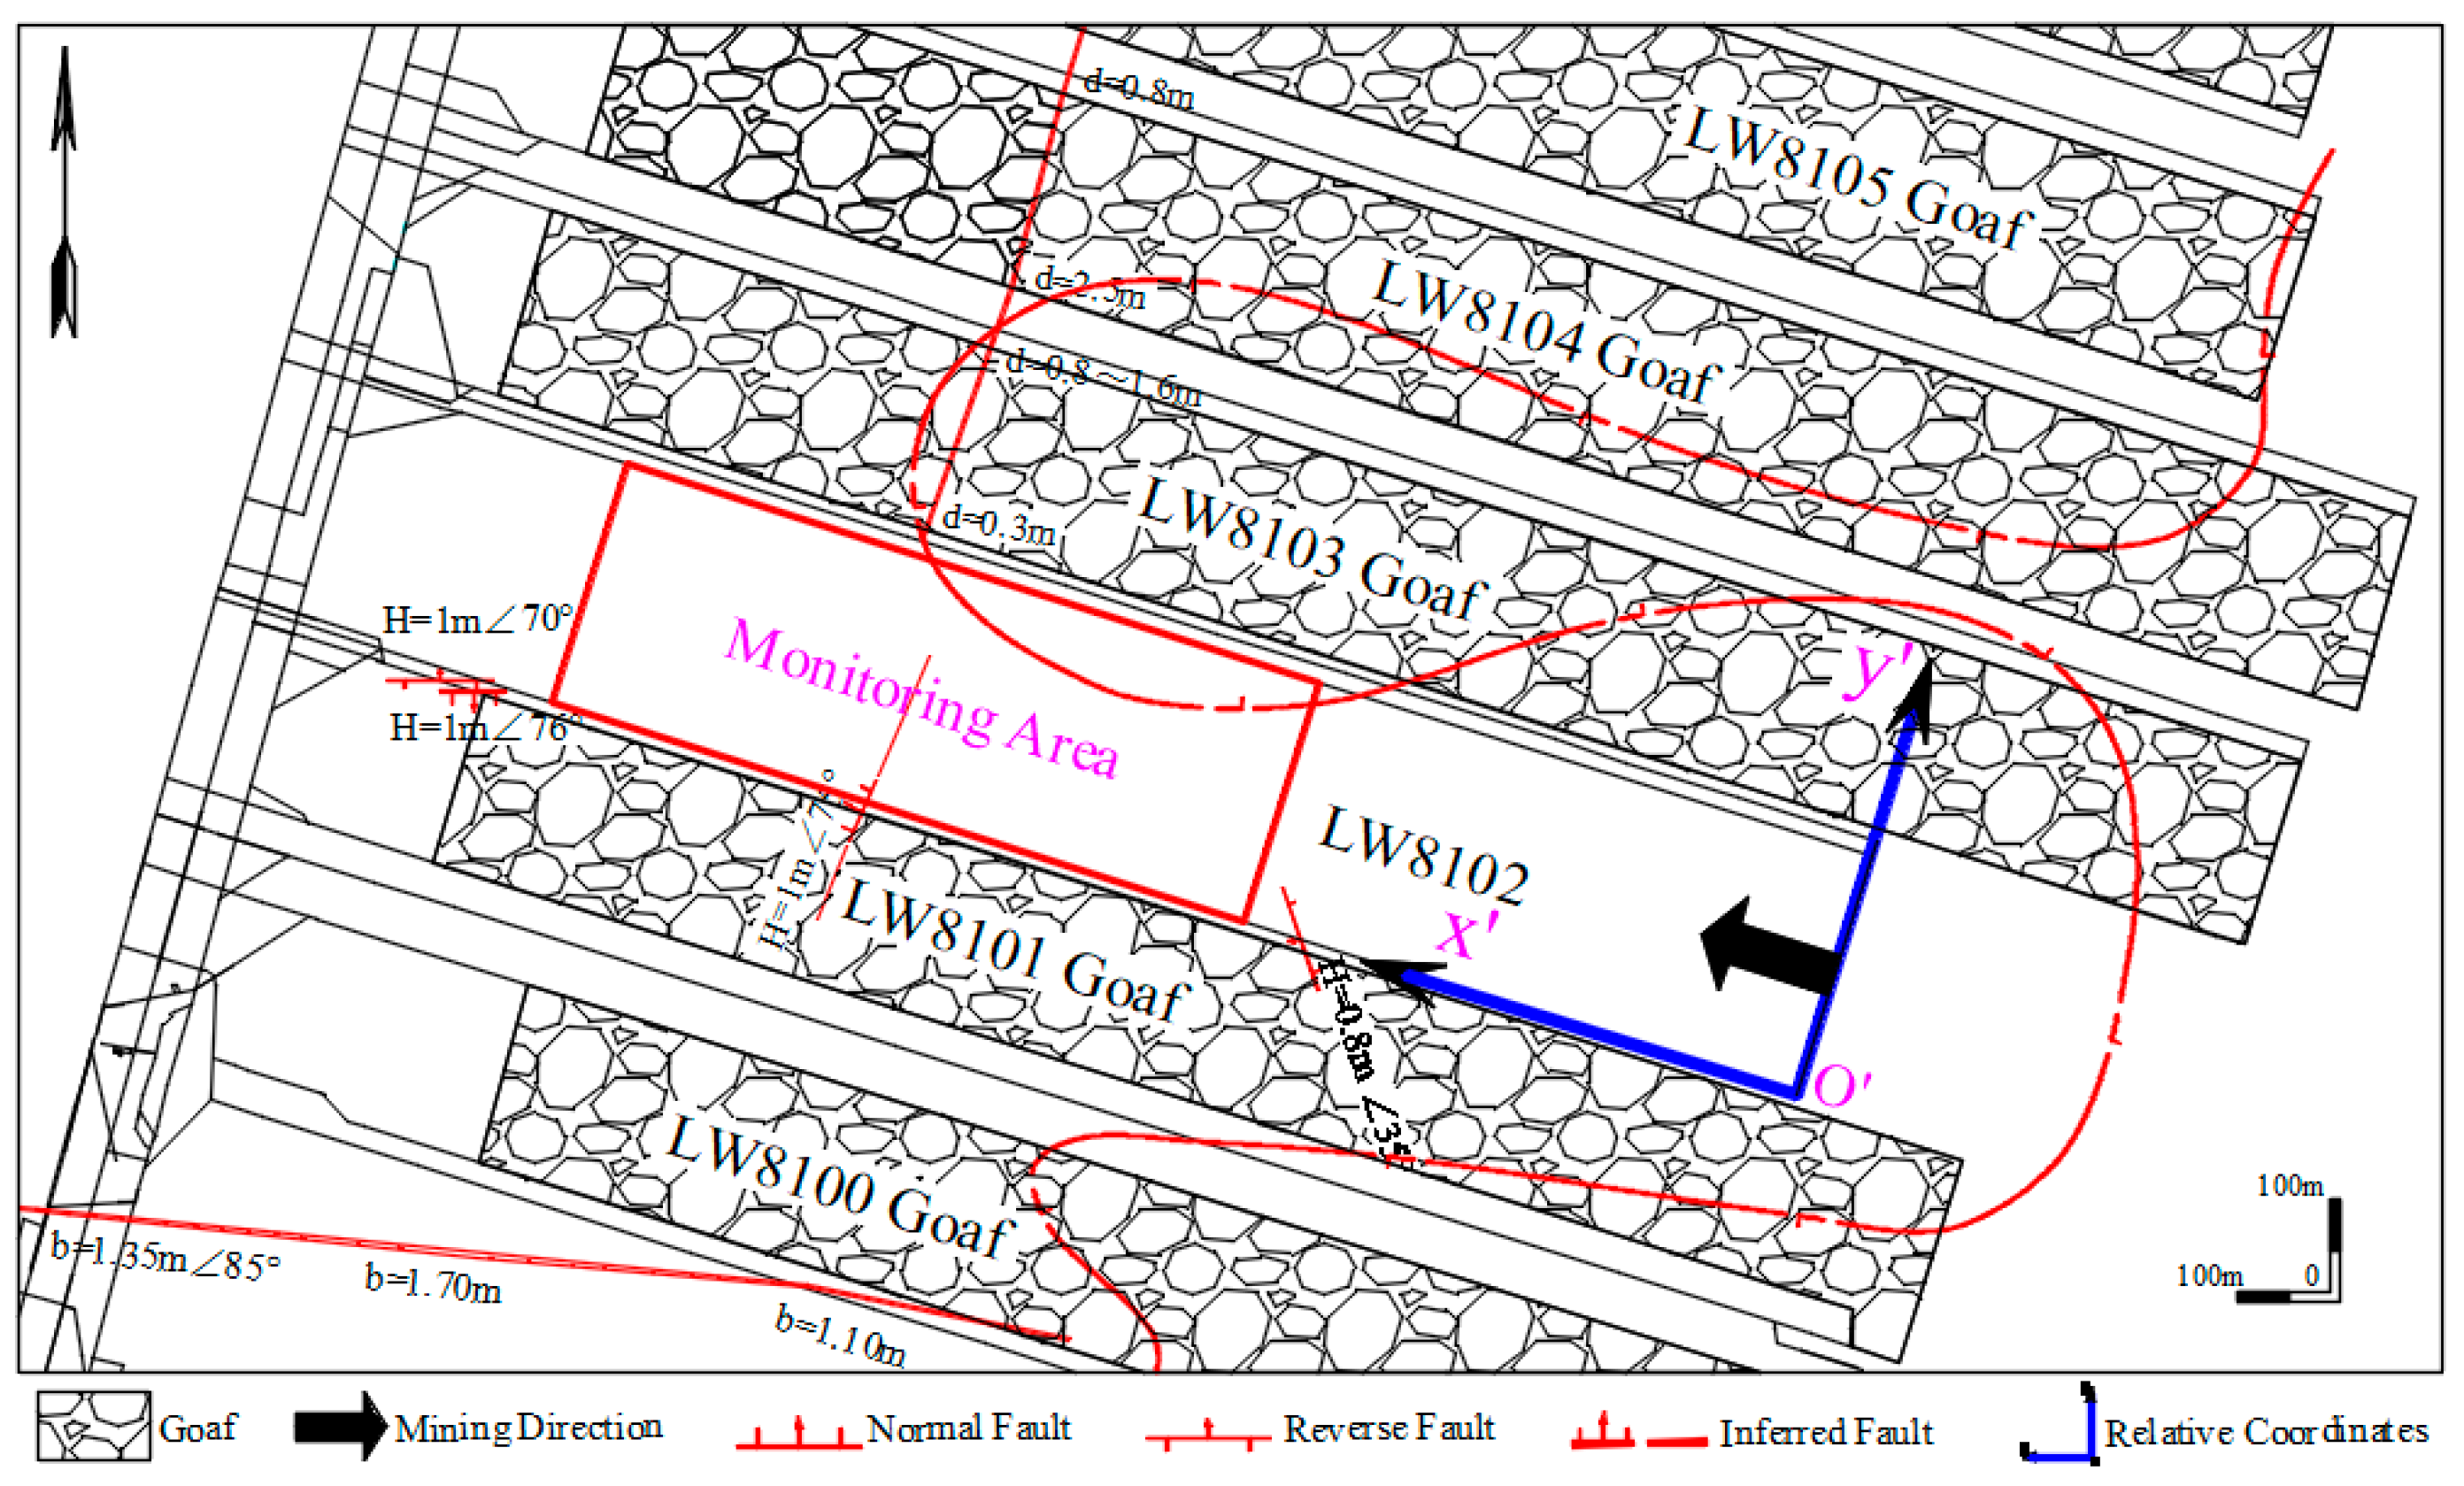
2.1. Working Face Conditions

The LW8102 of Tongxin Mine in Datong Mining Area, mines the 3–5# coal seam at a depth of about 450 m, with a thickness of 18.08 m for the seams, 4.61 m for the immediate roof, and 10.32 m for the main roof. Coal is mined using the single-strike longwall backward comprehensive mechanized low-level top caving mining method, with a mean strike length of 1516.5 m, inclined length of 251 m, and mining height of 3.9 m. The top coal is released in a combination of sequence and interval by one cut and one release, and the roof is managed by the natural collapse method. The stratigraphic column of LW8102 is shown in Figure 1.
LW8102 is an isolated island working face, flanked by the LW8101 goaf and LW8103 goaf, with a coal pillar width of 6 m in both sections, as shown in Figure 2. Mining at LW8101 and LW8103 was completed in October 2010 and in March 2015, respectively, and both of these sites experienced strong mine pressure during the mining. Stronger mine pressure is expected at LW8102 because LW8102 is affected by the advanced abutment pressure and bidirectional high abutment pressure of suspended roofs in adjacent working face goafs under isolated working face conditions; thus, LW8102 began mining in 2020 after the mine at LW8103 was completed for 5 years, and the overburden was relatively stable.
Regarding the geological structure, the 2102 roadway encounters two reverse faults and two positive faults about 173 m, 208 m, 574 m, and 1015 m from the auxiliary transportation roadway, which diagonally penetrated the working face. The 5102 roadway enters the igneous intrusion area about 558–1028 m from the auxiliary transportation road, which has irregular and intermittent intrusion forms.
Regarding the correspondence with the overlying Jurassic coal seams, the overlying Jurassic 8#, 9#, 11#, 12#, and 14# coal seams of Yongdingzhuang Mine were mined from 1962 to 1988. The 14# coal seams are 154 to 164 m apart from the Carboniferous 3–5# coal seams. There is no water in the overlying Jurassic coal seam mined-out area.

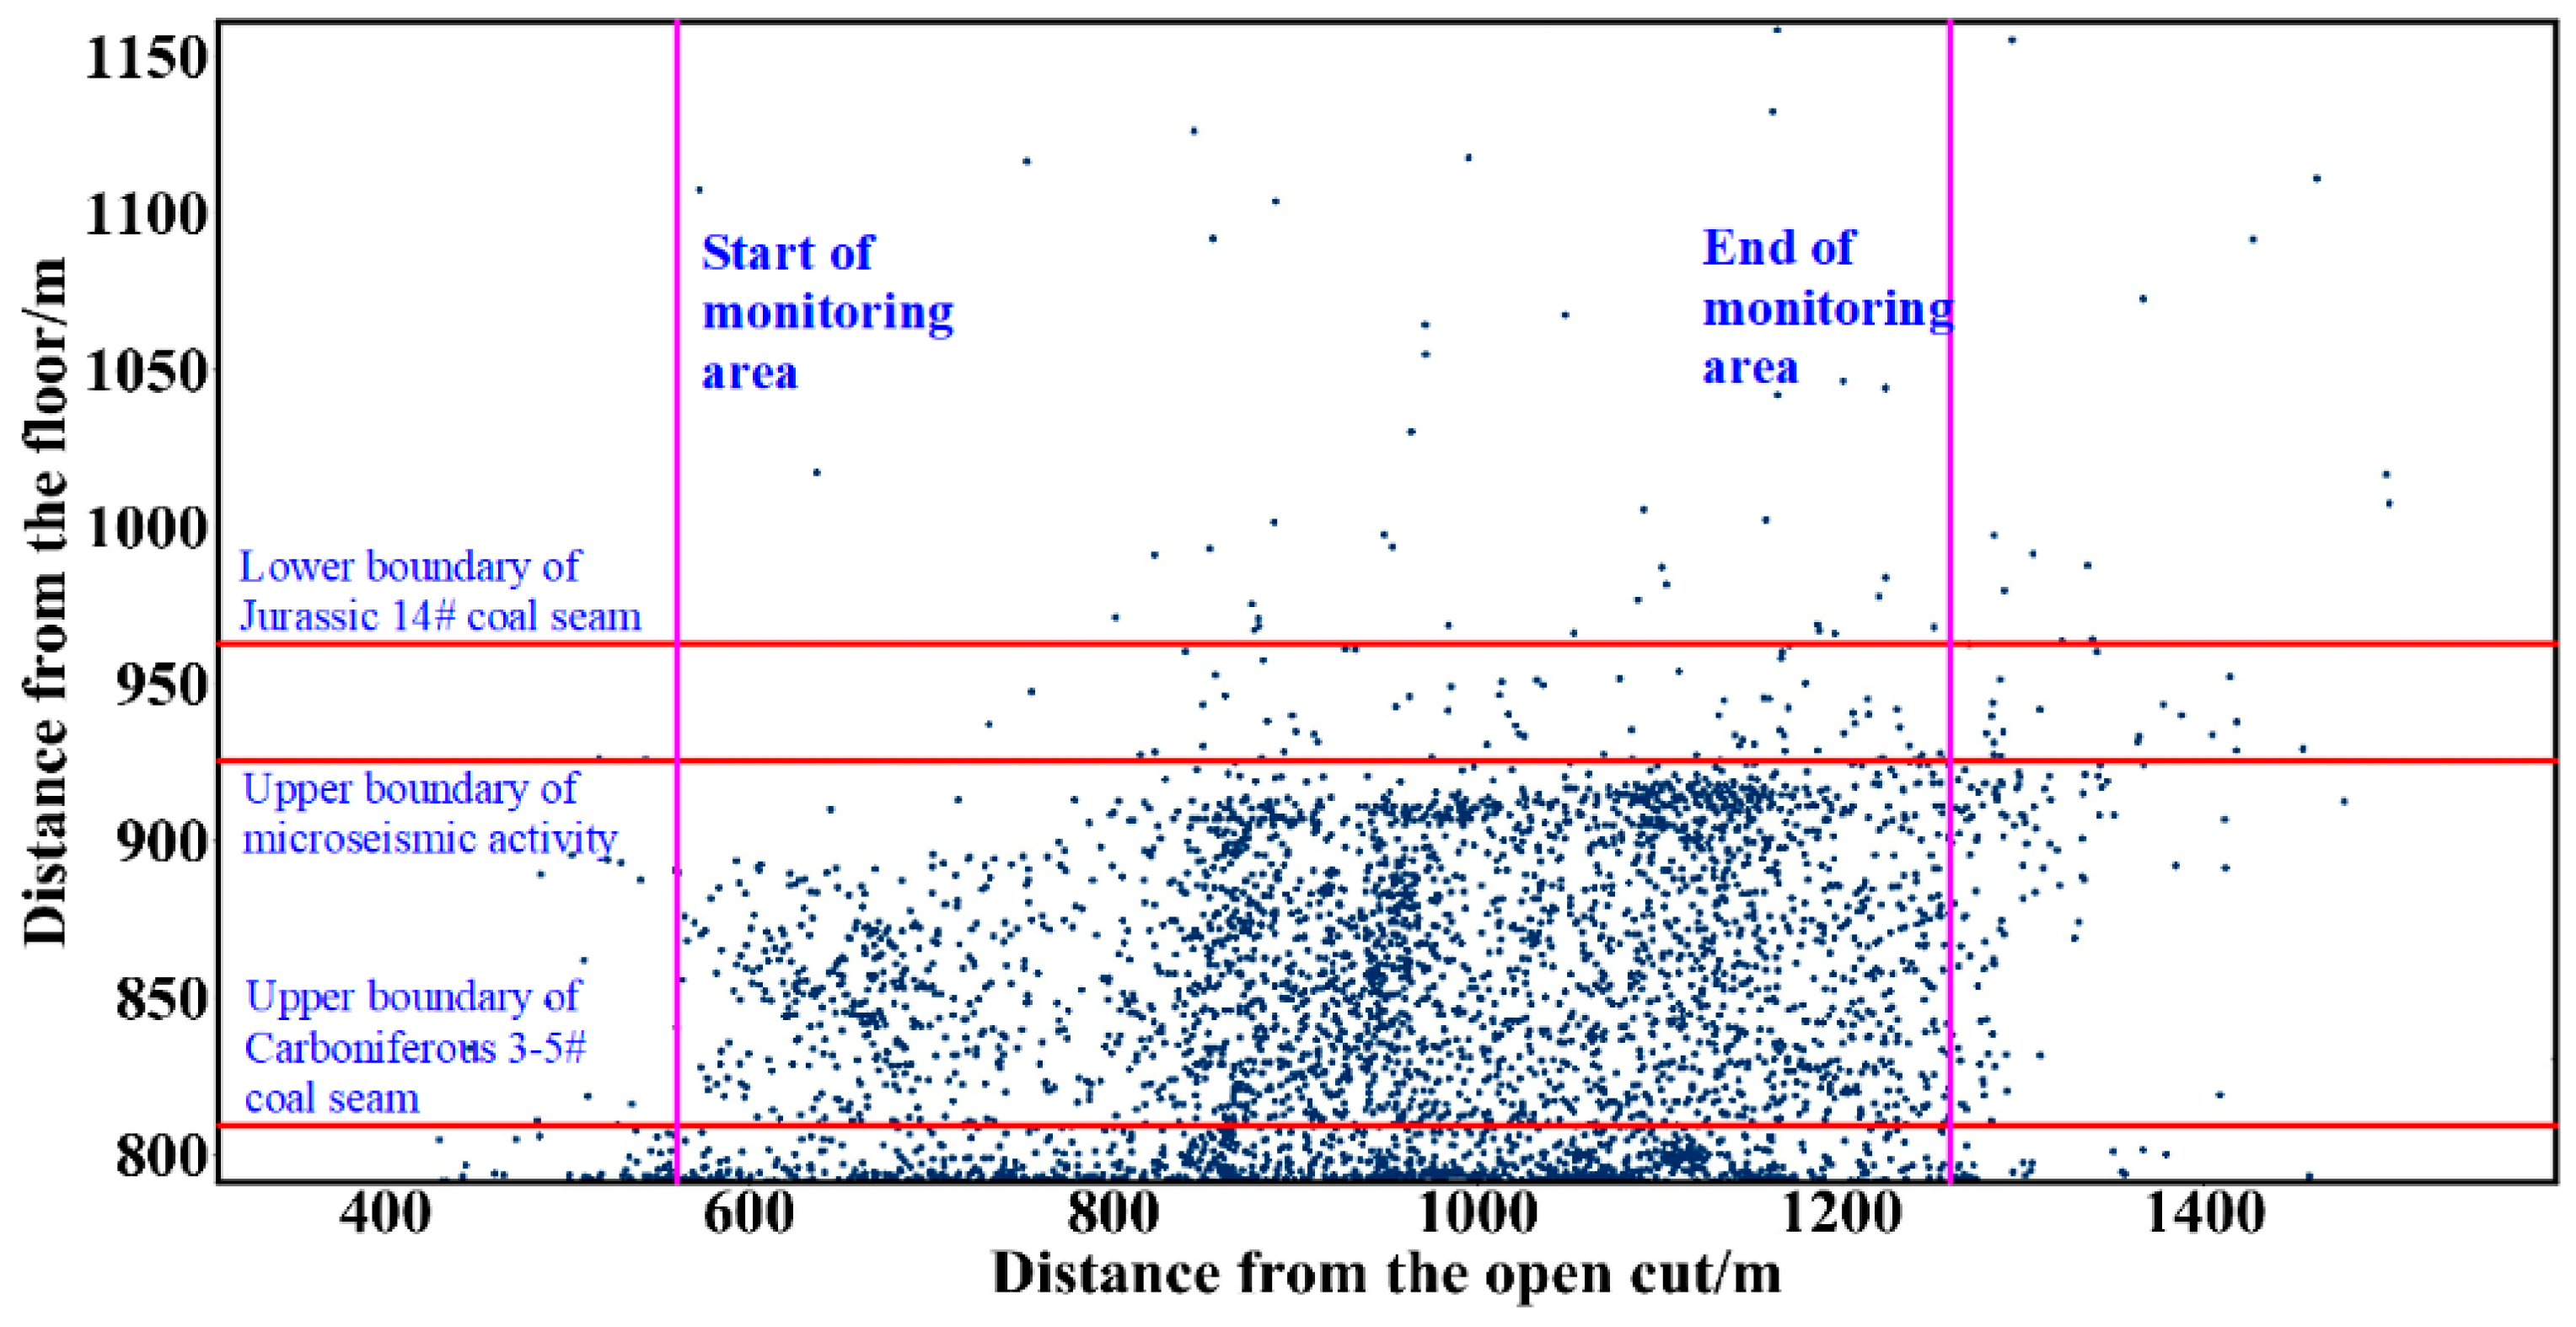
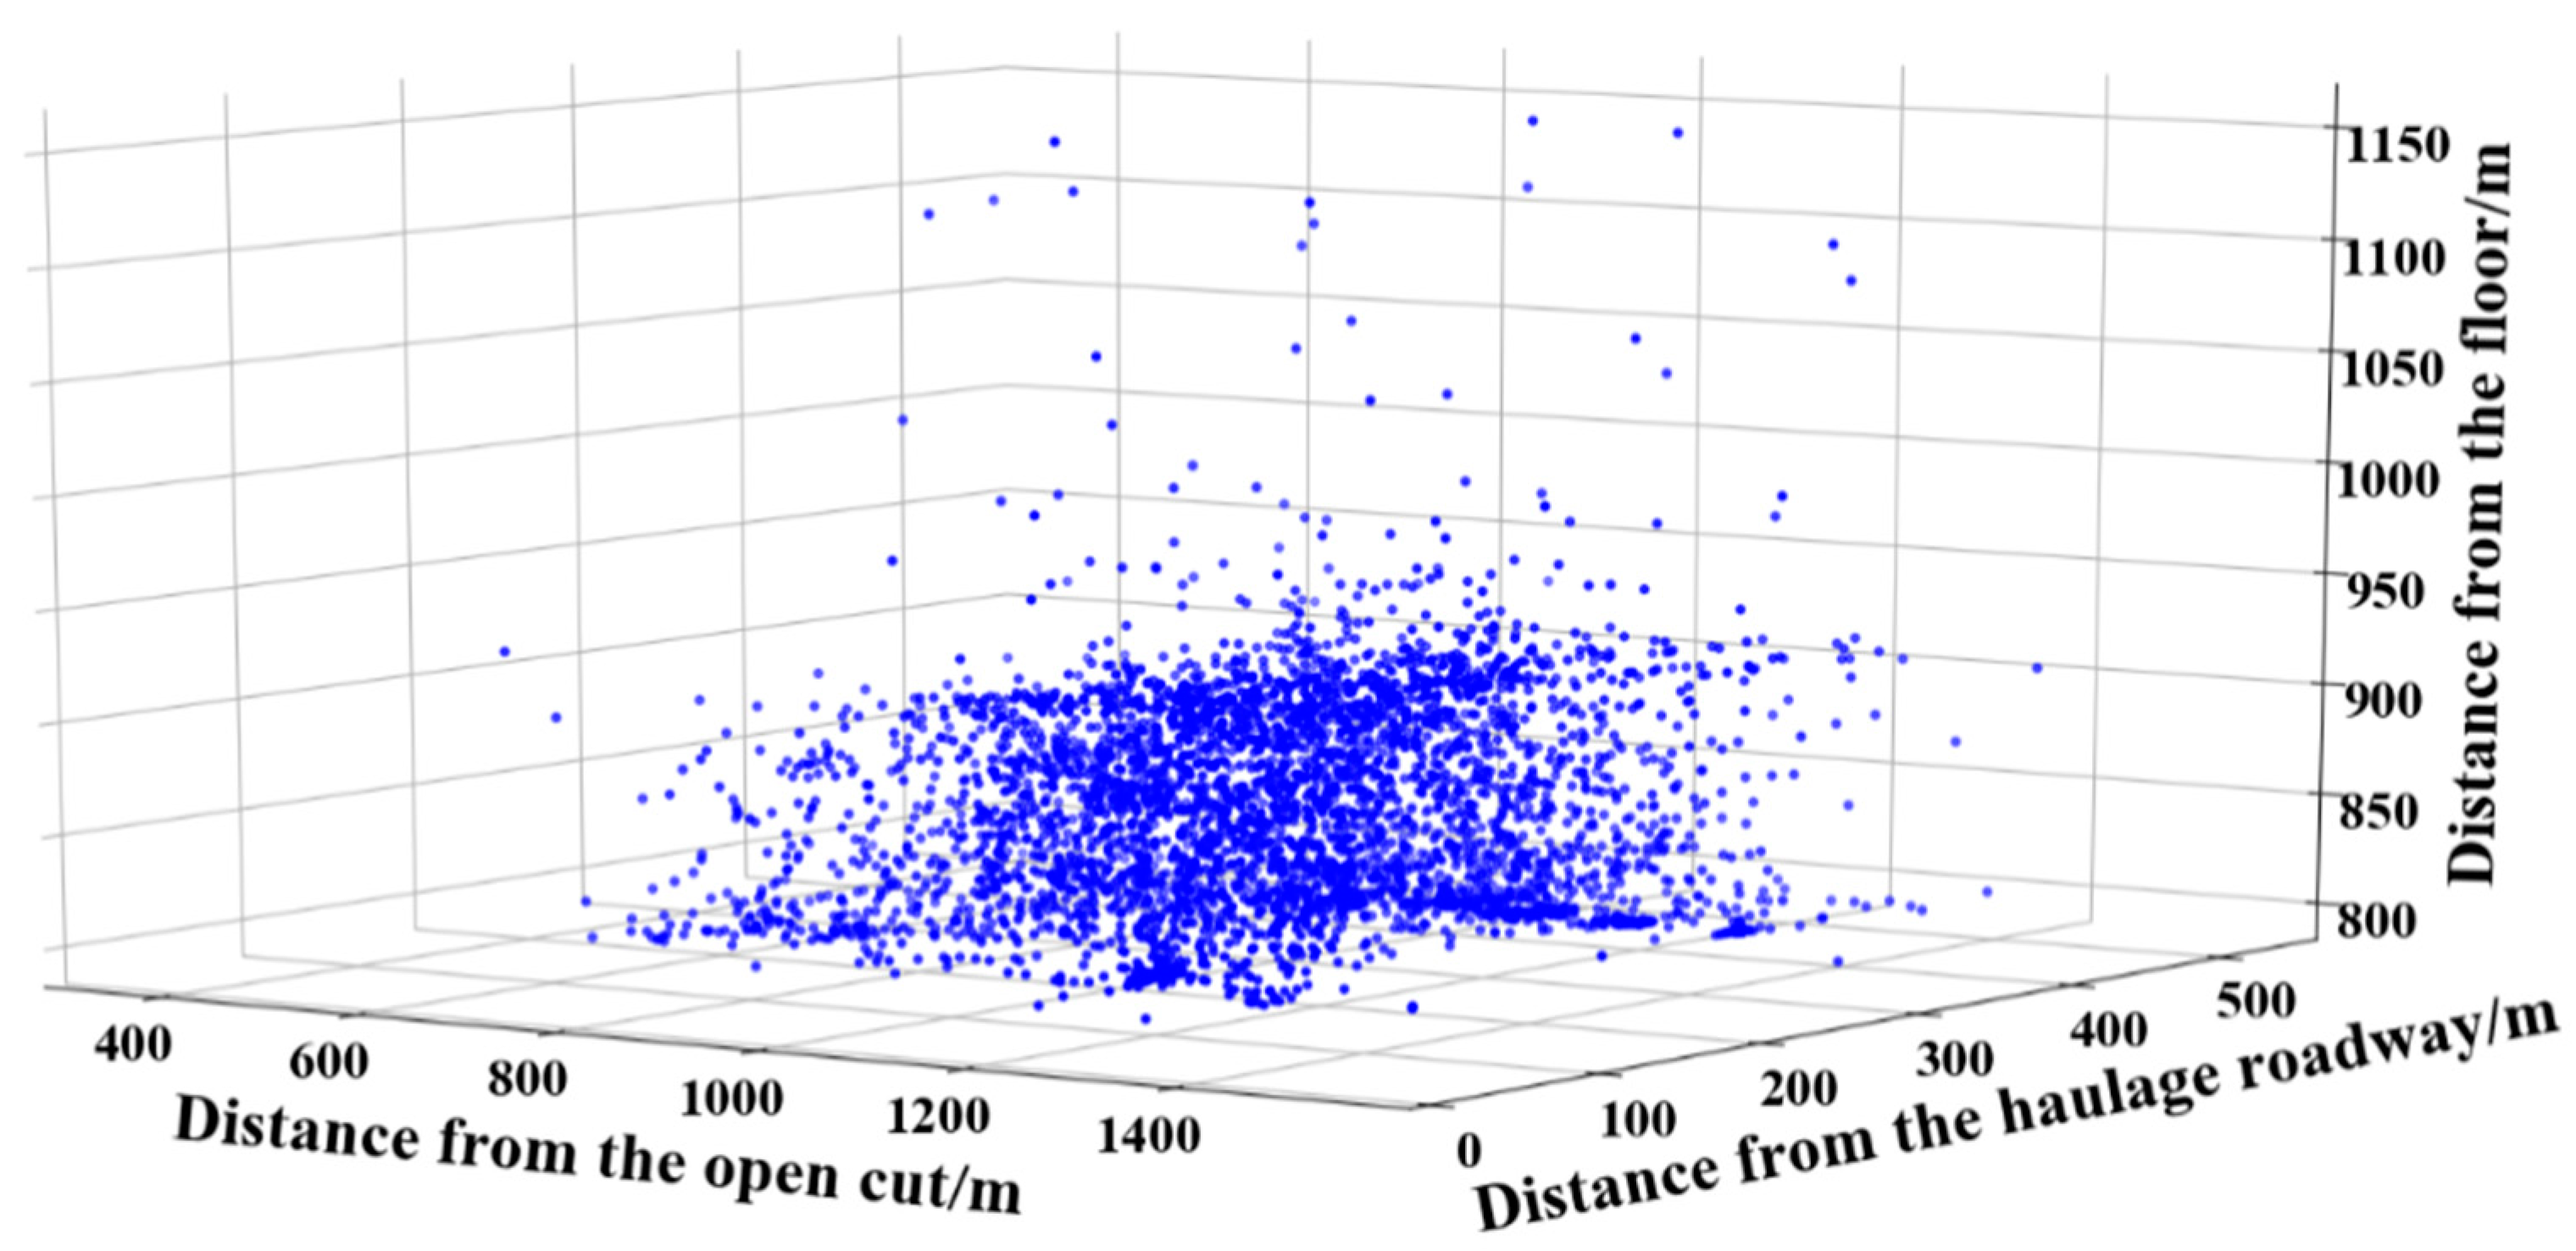
2.2. Microseismic Monitoring Data

Microseismic observations recorded relevant data from 15 October 2020 to 26 May 2021, during which time the workings advanced from approximately 560 m from the open cut to 1260 m from the open cut, with a total of 6648 microseismic events. The study object was the overlying rock in the working face, and a total of 4525 microseismic events were included. These events only included microseismic events above the coal seam floor of the working face, which meant their z-values were greater than 791. The information of each microseismic event included the occurrence time t , the values of three-dimensional coordinates x , y and z , and the energy e .
The data recorded on site were the latitude and longitude coordinates, and a relative coordinate system was established, as shown in Figure 2. x axis was along the working face advancing direction, and y axis was perpendicular to the face. The x and y coordinates of microseismic events were converted according to following the plane rotation and transformation formulas:
x = ( x x o ) cos α ( y y o ) sin α ,
y = ( x x o ) sin α + ( y y o ) cos α ,
where x and y represent the coordinate values of the microseismic event position in the relative coordinate system; x and y signify the coordinate values of the microseismic event position in the absolute coordinate system; x 0 and y 0 are the coordinates of the original point in the absolute coordinate system in Figure 1 (i.e., 551,076.564, 4,432,175.907). α represents the clockwise rotation angle of the relative coordinate system compared with the absolute coordinate system, i.e., −17.4505°.
Figure 3 shows the top view of the microseismic event distribution. The microseismic events were found to be distributed in a rectangular shape, and were mainly distributed in the mining space area in the x-axis direction, and in the LW8102 and LW8103 goafs in the y-axis direction. In comparison to the LW8103 goaf, there were no microseismic events in the opposite mining area of the LW8101 goaf. The reason for this is that LW8101 ended mining earlier than LW8103, and the overburden was more stable. This indicates that a longer period of overburden rock stabilization in the adjacent mining zone may weaken the influence on the isolated working face.
Figure 4 shows the front view of the microseismic event distribution. It can be found from the figure that in the x-axis direction, the microseismic events are distributed above the mining space range of the working face. The maximum range of impact activity in the z axis reached about a z value of 925 m, i.e., 130 m from the roof, which was unaffected by the Jurassic mined coal seam, indicating that the large structure overlying the Jurassic mined coal seam was not reactivated, and had little impact on the mine pressure at the working face.
Based on the aforementioned distribution of microseismic events in both the top and front views, microseismic events were found to have obvious nucleation features, indicative of rock fracture crack features. The microseismic events were plotted in the 3D distribution map, as illustrated in Figure 5. As the figure shows, the nucleation characteristics of the microseismic event distribution were more evident, but it is difficult to identify the directionality. Therefore, it was necessary to use an effective method to analyze and derive the distribution and extensional states of fracture cracks in overlying rocks. In this study, cluster analysis was used to classify microseismic events in the form of clusters, which were then plotted in a three-dimensional distribution map in temporal sequences to analyze the spatial and temporal distribution pattern of overburden fracture cracks.

3. Spatial and Temporal Clustering of Microseismic Events

3.1. Clustering Algorithm Principle

The clustering algorithm, also referred to as unsupervised classification, partitions the data into meaningful clusters. The k-means algorithm is a prototype-based clustering algorithm that partitions the feature matrix X of n samples into k non-intersecting clusters. Intuitively, cluster is a group of data aggregations where the data in a cluster are considered to belong to the same class. The number of clusters k is a super parameter, which must be determined by artificial input. The primary task of k-means is to find k optimal centroids and assign the nearest data to the cluster represented by those centroids.
The shorter distance from all sample points to the centroid for a cluster, the more identical the samples in this cluster, and the fewer the variations. Many methods are available to measure the distance, such as Euclidean distance, Manhattan distance, chord distance, etc. The Euclidean distance was adopted in this research. Let x denote a sample point in the cluster, μ the cluster’s centroid, n the number of features in each sample point, and i each feature of the constituent point. Then, we have the formula that expresses the distance from the sample point to the centroid:
d ( x , μ ) = i = 1 n ( x i μ i ) 2 ,
The sum of squares of distances from all sample points to the centroid in a cluster is as follows:
C l u s t e r   S u m   o f   S q u a r e ( C S S ) = j = 1 m i = 1 n ( x i μ i ) 2 ,
The total sum of squares of intra-cluster distances for all clusters in a dataset is as follows:
T o t a l   C l u s t e r   S u m   o f   S q u a r e = l = 1 k C S S l ,
where m is the number of samples in a cluster, j is the serial number of the sample, and Fformula (4) is the sum of squares in a cluster. k represents the number of clusters, and l represents the serial number for each cluster. The sum of the intra-cluster distance squares of all clusters in a dataset is summed to obtain the total sum of squares in Equation (5). The smaller the total sum of the squares of the clusters, the more similar the samples within each cluster will be, and the better the clustering will be. In the centroid’s iterative and changeable process, the total cluster sum of the squares becomes smaller and smaller. When it is the smallest, the centroid no longer changes, and clustering terminates [27].
The pseudo-code of the k-means clustering algorithm is shown below (Algorithm 1):
Algorithm 1. k-means clustering algorithm
Input: sample set D = { x 1 , x 2 , , x m } ;
Clustering number of clusters k
Process:
Randomly select numbers k from D Sample set as the initial mean vector { μ 1 , μ 2 , , μ k }
2. repeat
Let C i = ϕ ( 1 i k )
for j = 1 , 2 , , m do
Calculate the distance between the sample x j and each mean vector μ i ( 1 i k )
The nearest mean vector determines the cluster labeling of x j : λ j = arg min i { 1 , 2 , , k } d i j ;
Categorize the sample x j into the corresponding cluster: C λ j = C λ j { x j } ;
end for
for i = 1 , 2 , , k do
Calculate the new mean vector: μ i = 1 | C i | x C i x
if μ i μ i then
Update the current mean vector from μ i to μ i
else
Keep the current mean vector unchangeable
end if
end for
until the current mean vector keeps the same
Output: clusters are divided into C = { C 1 , C 2 , , C k } .

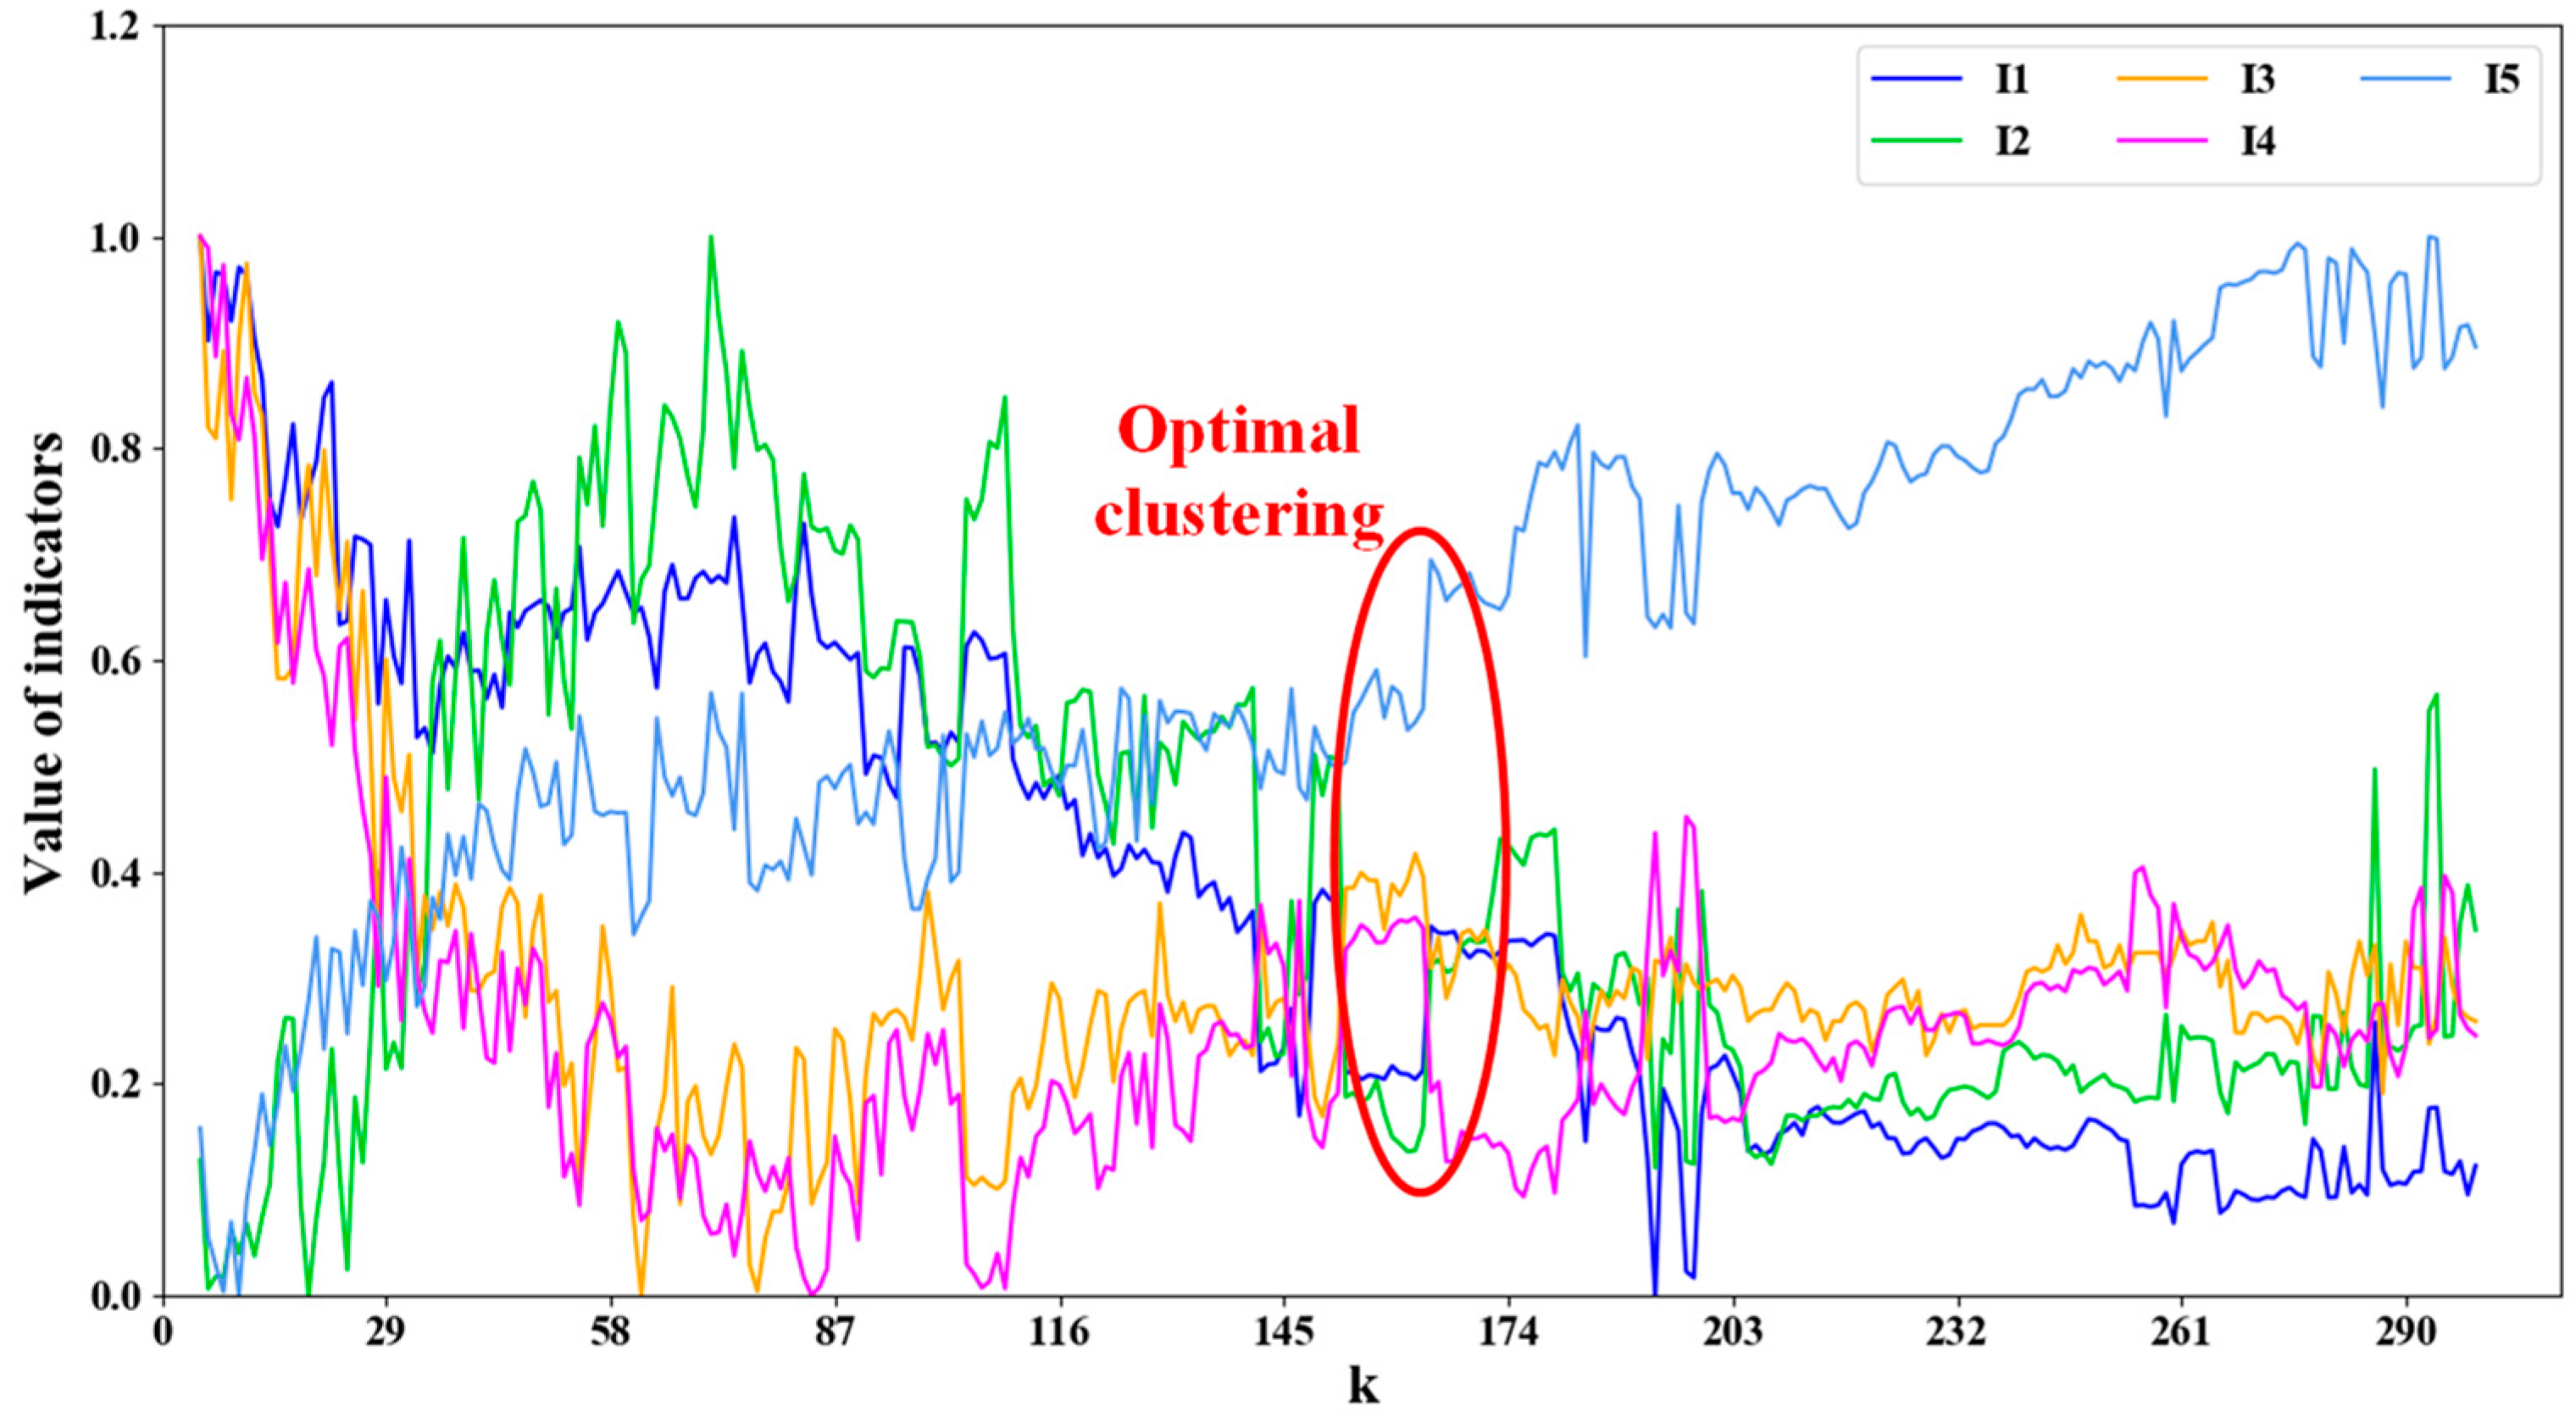
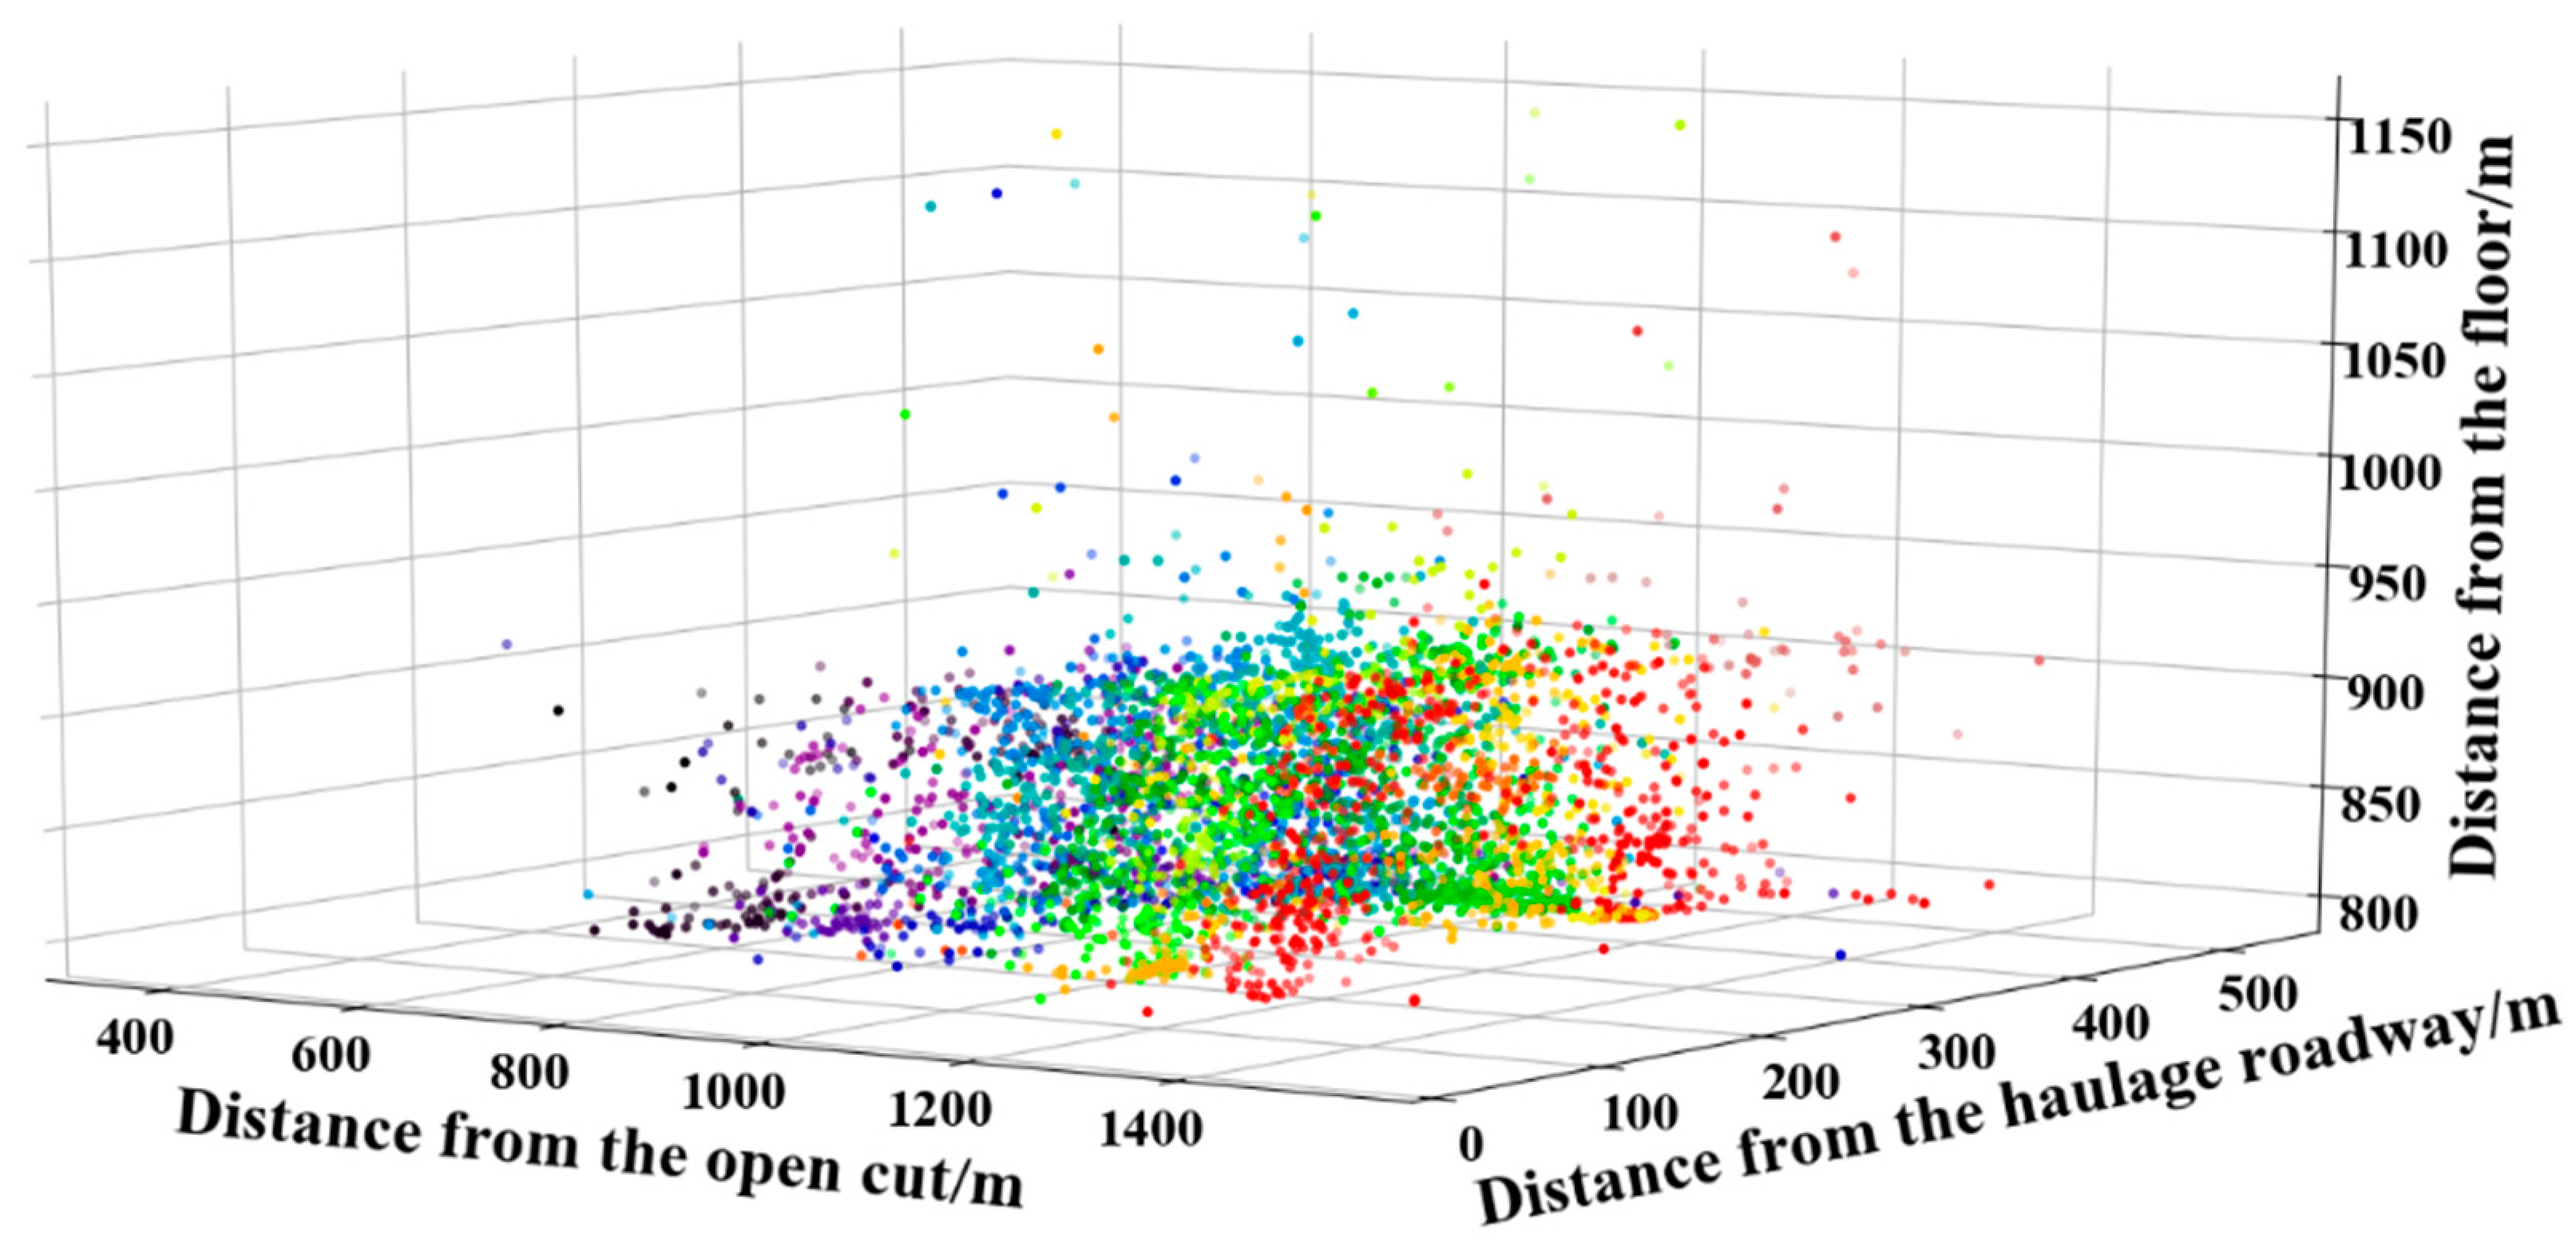
3.2. Selection of Spatio-Temporal Features and Determination of the Optimal k-Value

A microseismic event is considered to be a sample, which contains five elements: time (t), three-dimensional coordinates (x, y, z), and release energy (e). Of these, the characteristics of t and x gradually increase with the occurrence of microseismic events, y and z fluctuate within a certain range, and e is characterized as the occurrence of several large-energy events after a series of small-energy events. Therefore, when clustering, e is the noise feature, and time t as well as three-dimensional coordinates x, y, and z are chosen as the sample feature. During data pre-processing, time t is converted to the difference in time with respect to t of the first microseismic event.
Since the four characteristic distributions were different, and the characteristics with different value ranges have an impact on the distance calculation, the data were standardized in this study, in order to make the processed data obey the standard normal distribution with mean 0 and variance 1. The formula is as follows:
x * = x μ σ ,
where x * are standardized sample characteristic values, x are sample characteristic values, μ is the sample characteristics mean value, σ are sample characteristic variance values.
Clustering algorithms are typically evaluated by the average contour coefficients of all samples [28]. The contour coefficient is defined for each sample, both to measure the similarity between the sample and other samples in its cluster, as well as to measure the similarity between the sample and samples in other clusters. The single-sample contour coefficient formula is shown below:
s = b a max ( a , b ) ,
In the formula, a is the average distance from the sample to all the other points in the same cluster, and b is the average distance from the sample to all points in the next closest cluster.
The range of the contour coefficient is (−1, 1), where the closer the value is to 1, the more the sample is similar to the sample in its cluster and is not identical to the sample in other clusters. The closer the contour coefficient is to 1, the better the clustering effect is, and the negative number indicates an inferior clustering effect.
During microseismic data clustering, the mean contour coefficients decrease as k value increases, indicating that the smaller k is, the greater the similarity in the cluster and the lower the similarity out of the cluster, and the better the clustering outcome. However, when k value is very small, it is difficult to observe the distribution of overlying rock fractures. Therefore, it was essential to seek a balance between the fine-grained classification of microseismic events and the clustering effect, in order to find the optimal clustering result. This allowed the optimal clustering result to be found under conditions that ensured that the k value was large enough to separate the microseismic events and observe the distribution of cracks. In this regard, the following five indicators were observed during the computation.
I1: Average contour coefficients:
I 1 = 1 k l = 1 k j = 1 m s l j ,
I2: Standard deviation of contour coefficient:
I 2 = l = 1 k j = 1 m ( s l j s ¯ ) 2 k m ,
I3: Proportion of larger than the average contour coefficient in the total number of samples:
I 3 = P ( s | s > s ¯ ) ,
I4: Average value of the proportion of the contour coefficient greater than the average value in each cluster:
I 4 = 1 k l = 1 k P l ( s l j | s l j > s ¯ ) ,
I5: Standard deviation of the proportion of the contour coefficient greater than the average value in each cluster:
I 5 = l = 1 k ( P l ( s l j | s l j > s ¯ ) P ¯ ) 2 k ,
K values were computed from 5 to 300, and the five evaluation indicators were normalized as shown in Equation (13), in order for the evaluation indicators to converge in the range from 0 to 1, thereby allowing simultaneous observation of the clustering effect in the same graph. The curves of evaluation indicators with the k values are shown in Figure 6.
x * = x min ( x ) max ( x ) min ( x ) ,
where x * are normalized evaluation indicators, x are sample evaluation indicators.
In Figure 6, a larger value of I1 represents a better clustering effect. The initial value of I1 was large and decreased gradually; after decreasing to the minimum value, it continued to decrease after a short rise, and was unchanged as it decreased to a value of k 162. This meant that for indicator I1, the clustering effect decreased first in the increasing process of the k value, and continued to worsen after a brief increase, and was unchanged when the value of k reached 162. Thus, the set of optimal clusters was { k | k 162 } .
Larger I3, I4 represent a better the clustering effect. The initial value for I3, I4 was large and decreased gradually; after it decreased to the minimum value, it began to increase. When it increased to the k value of 162, it remained unchanged. This meant that for indicators I3, I4, the clustering effect first decreased to the worst in the increasing process of the k value, and then increased to the k value of 162 and remained unchanged. Therefore, the optimal set of clusters was { k | k 162 } .
The smaller the I2, the better the clustering effect. The initial value of I2 was low and increased gradually; when it increased to the maximum value, it began to decrease, and remained constant after the k value increased to 162. This meant that for the indicator I2, the clustering effect decreased to the worst in the increasing process of the k value, and then it remained unchanged when the k value increased to 162. Therefore, the optimal set of clusters was { k | k 162 } .
The smaller the I5, the better the clustering effect. The initial value of I5 was low and gradually increased. The I5 went through a period of invariance in the increasing process, and then continued to increase until it tended to become invariant again. The ending k value of the first invariant period was 162, and the starting k value of the second invariant period was 280. This meant that for the index I5, the clustering effect decreased continuously during the increasing process of the k value, and stopped changing when it decreased to the k value of 280. During this period, a period of constant clustering effect was experienced, and the ending k value of this period was 162. Therefore, the optimal set of clusters was { k | k 280 } .
Comprehensively analyzing the clustering effect under the five evaluation indicators, k value for optimal clustering should be greater than 162, less than 162 and less than 280 simultaneously, i.e., k is taken as 162. At the same time, 162 was large enough to realize the stripping of microseismic events with discrete spatial and temporal distributions, which enabled the observation of overburden fractures. Therefore, the clustering results with the k value of 162 were chosen to analyze the dynamic extension process and distribution pattern of overburden fractures.

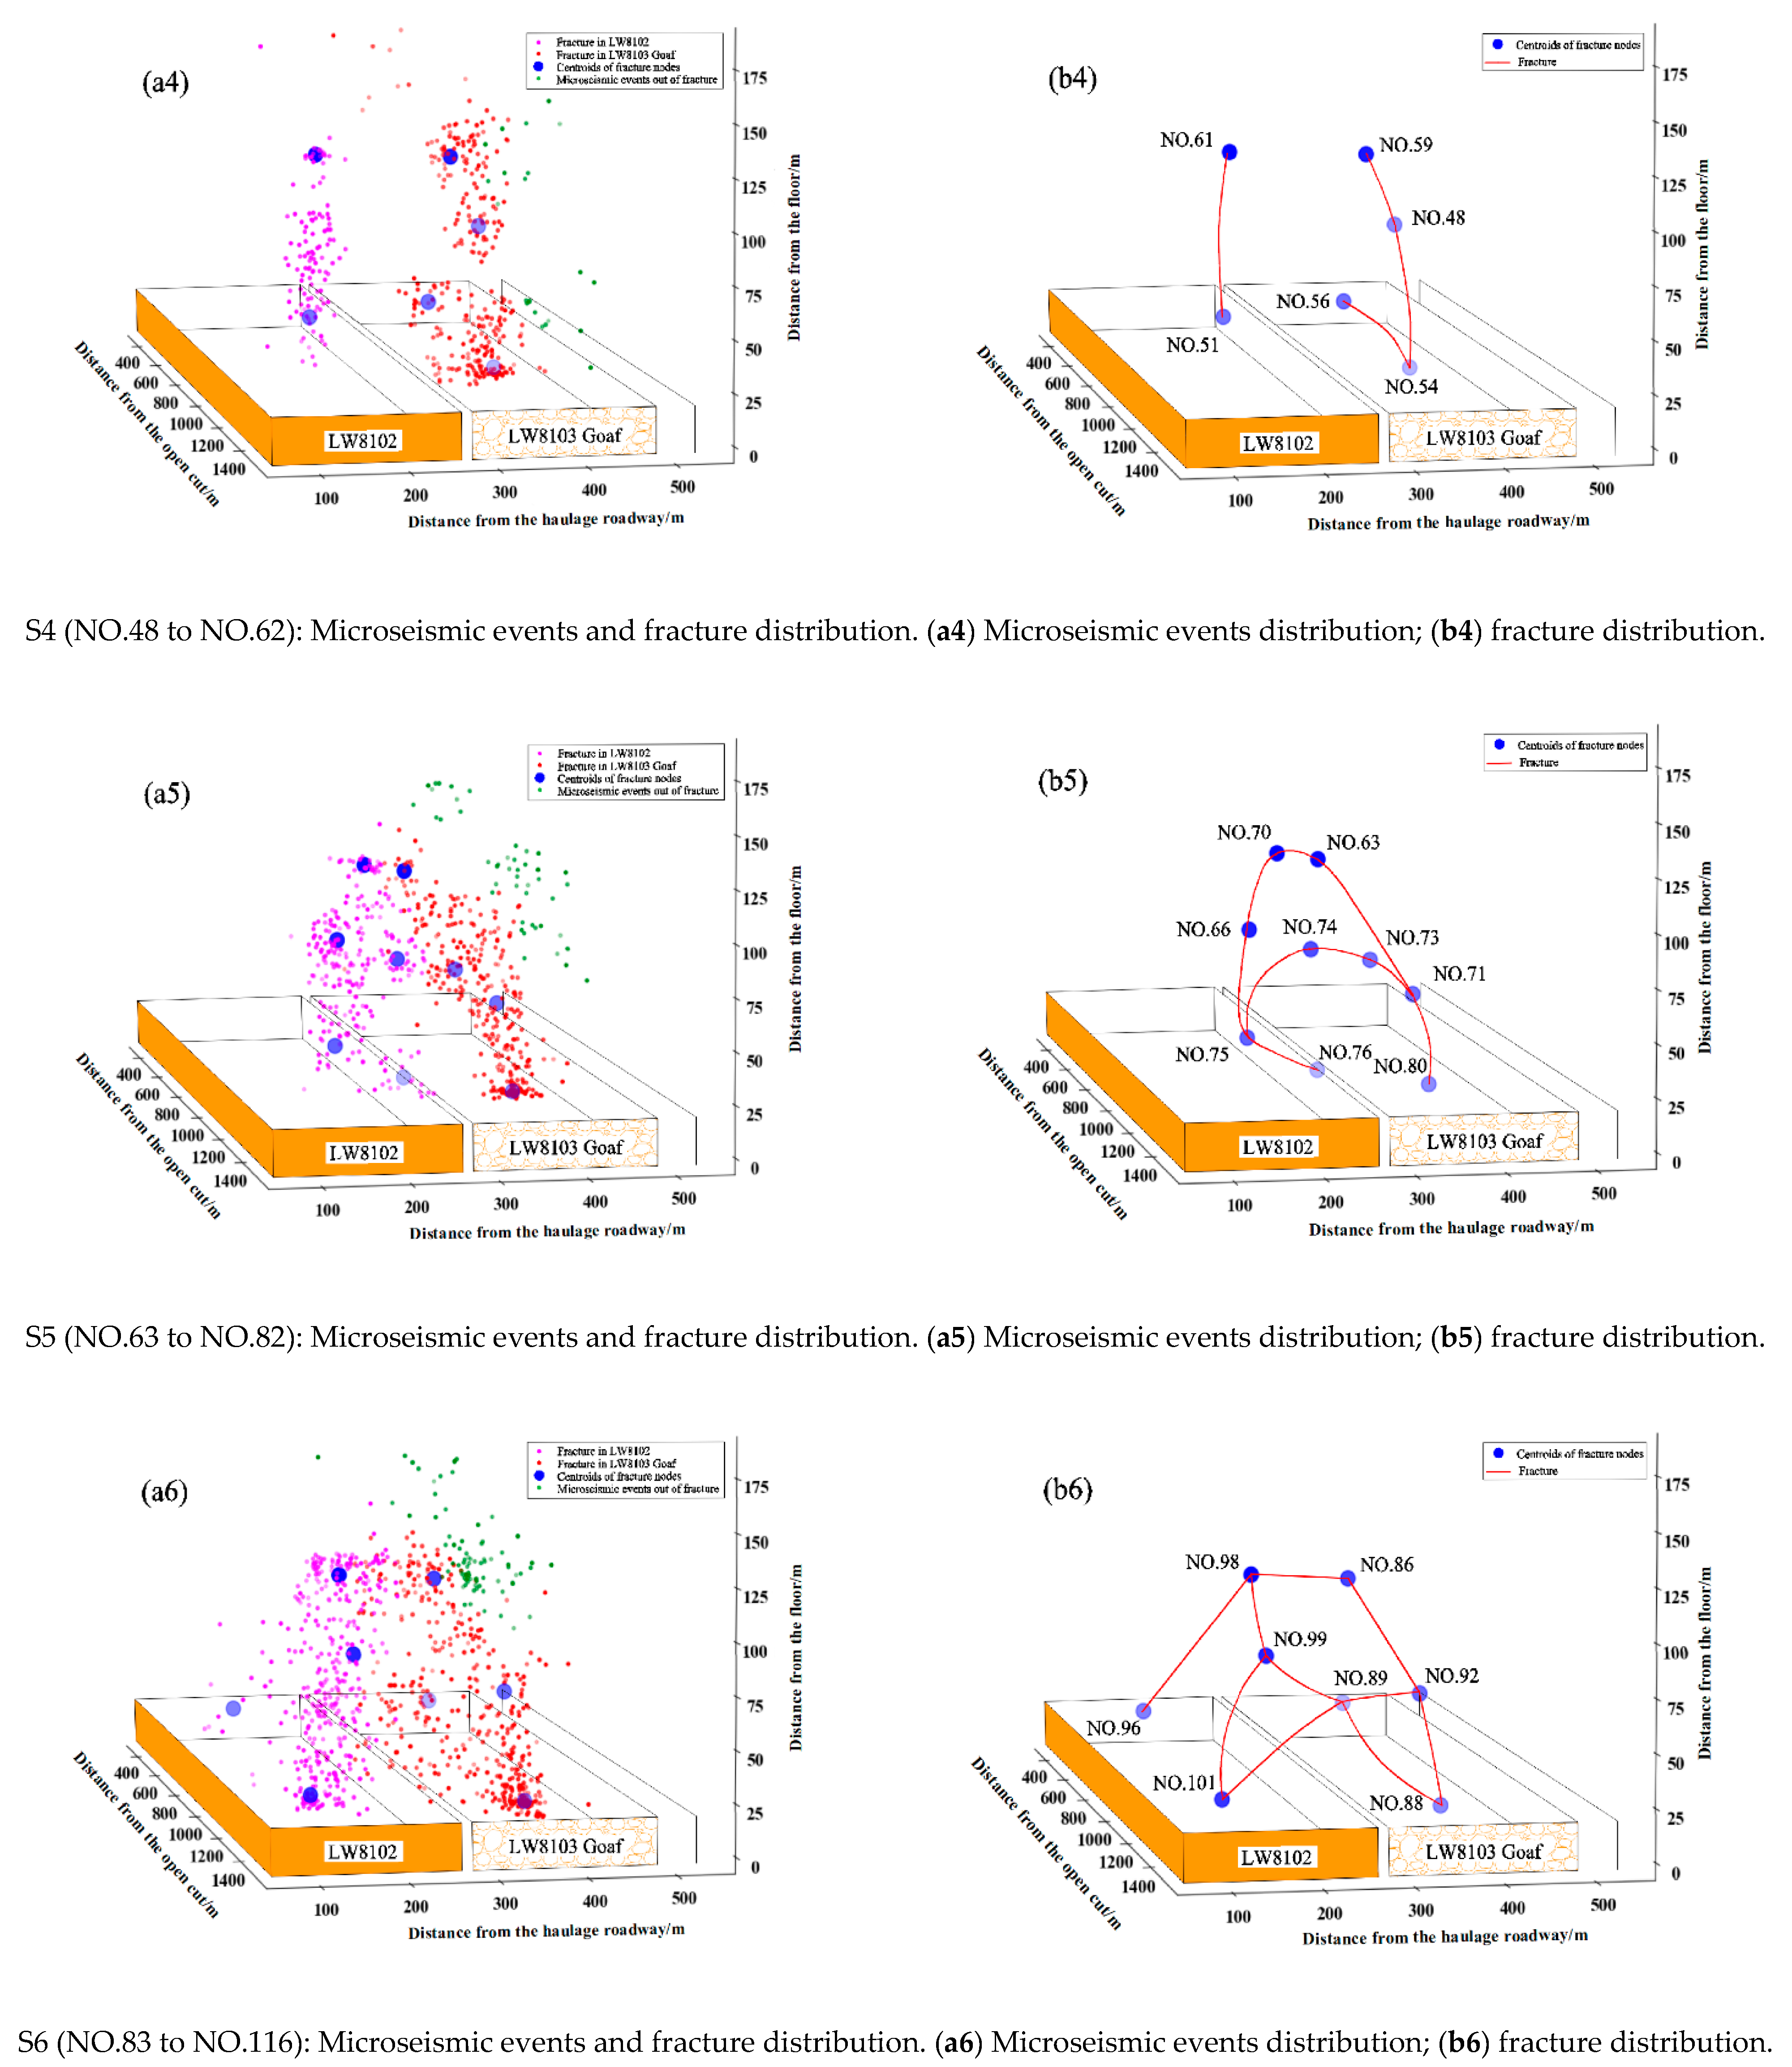
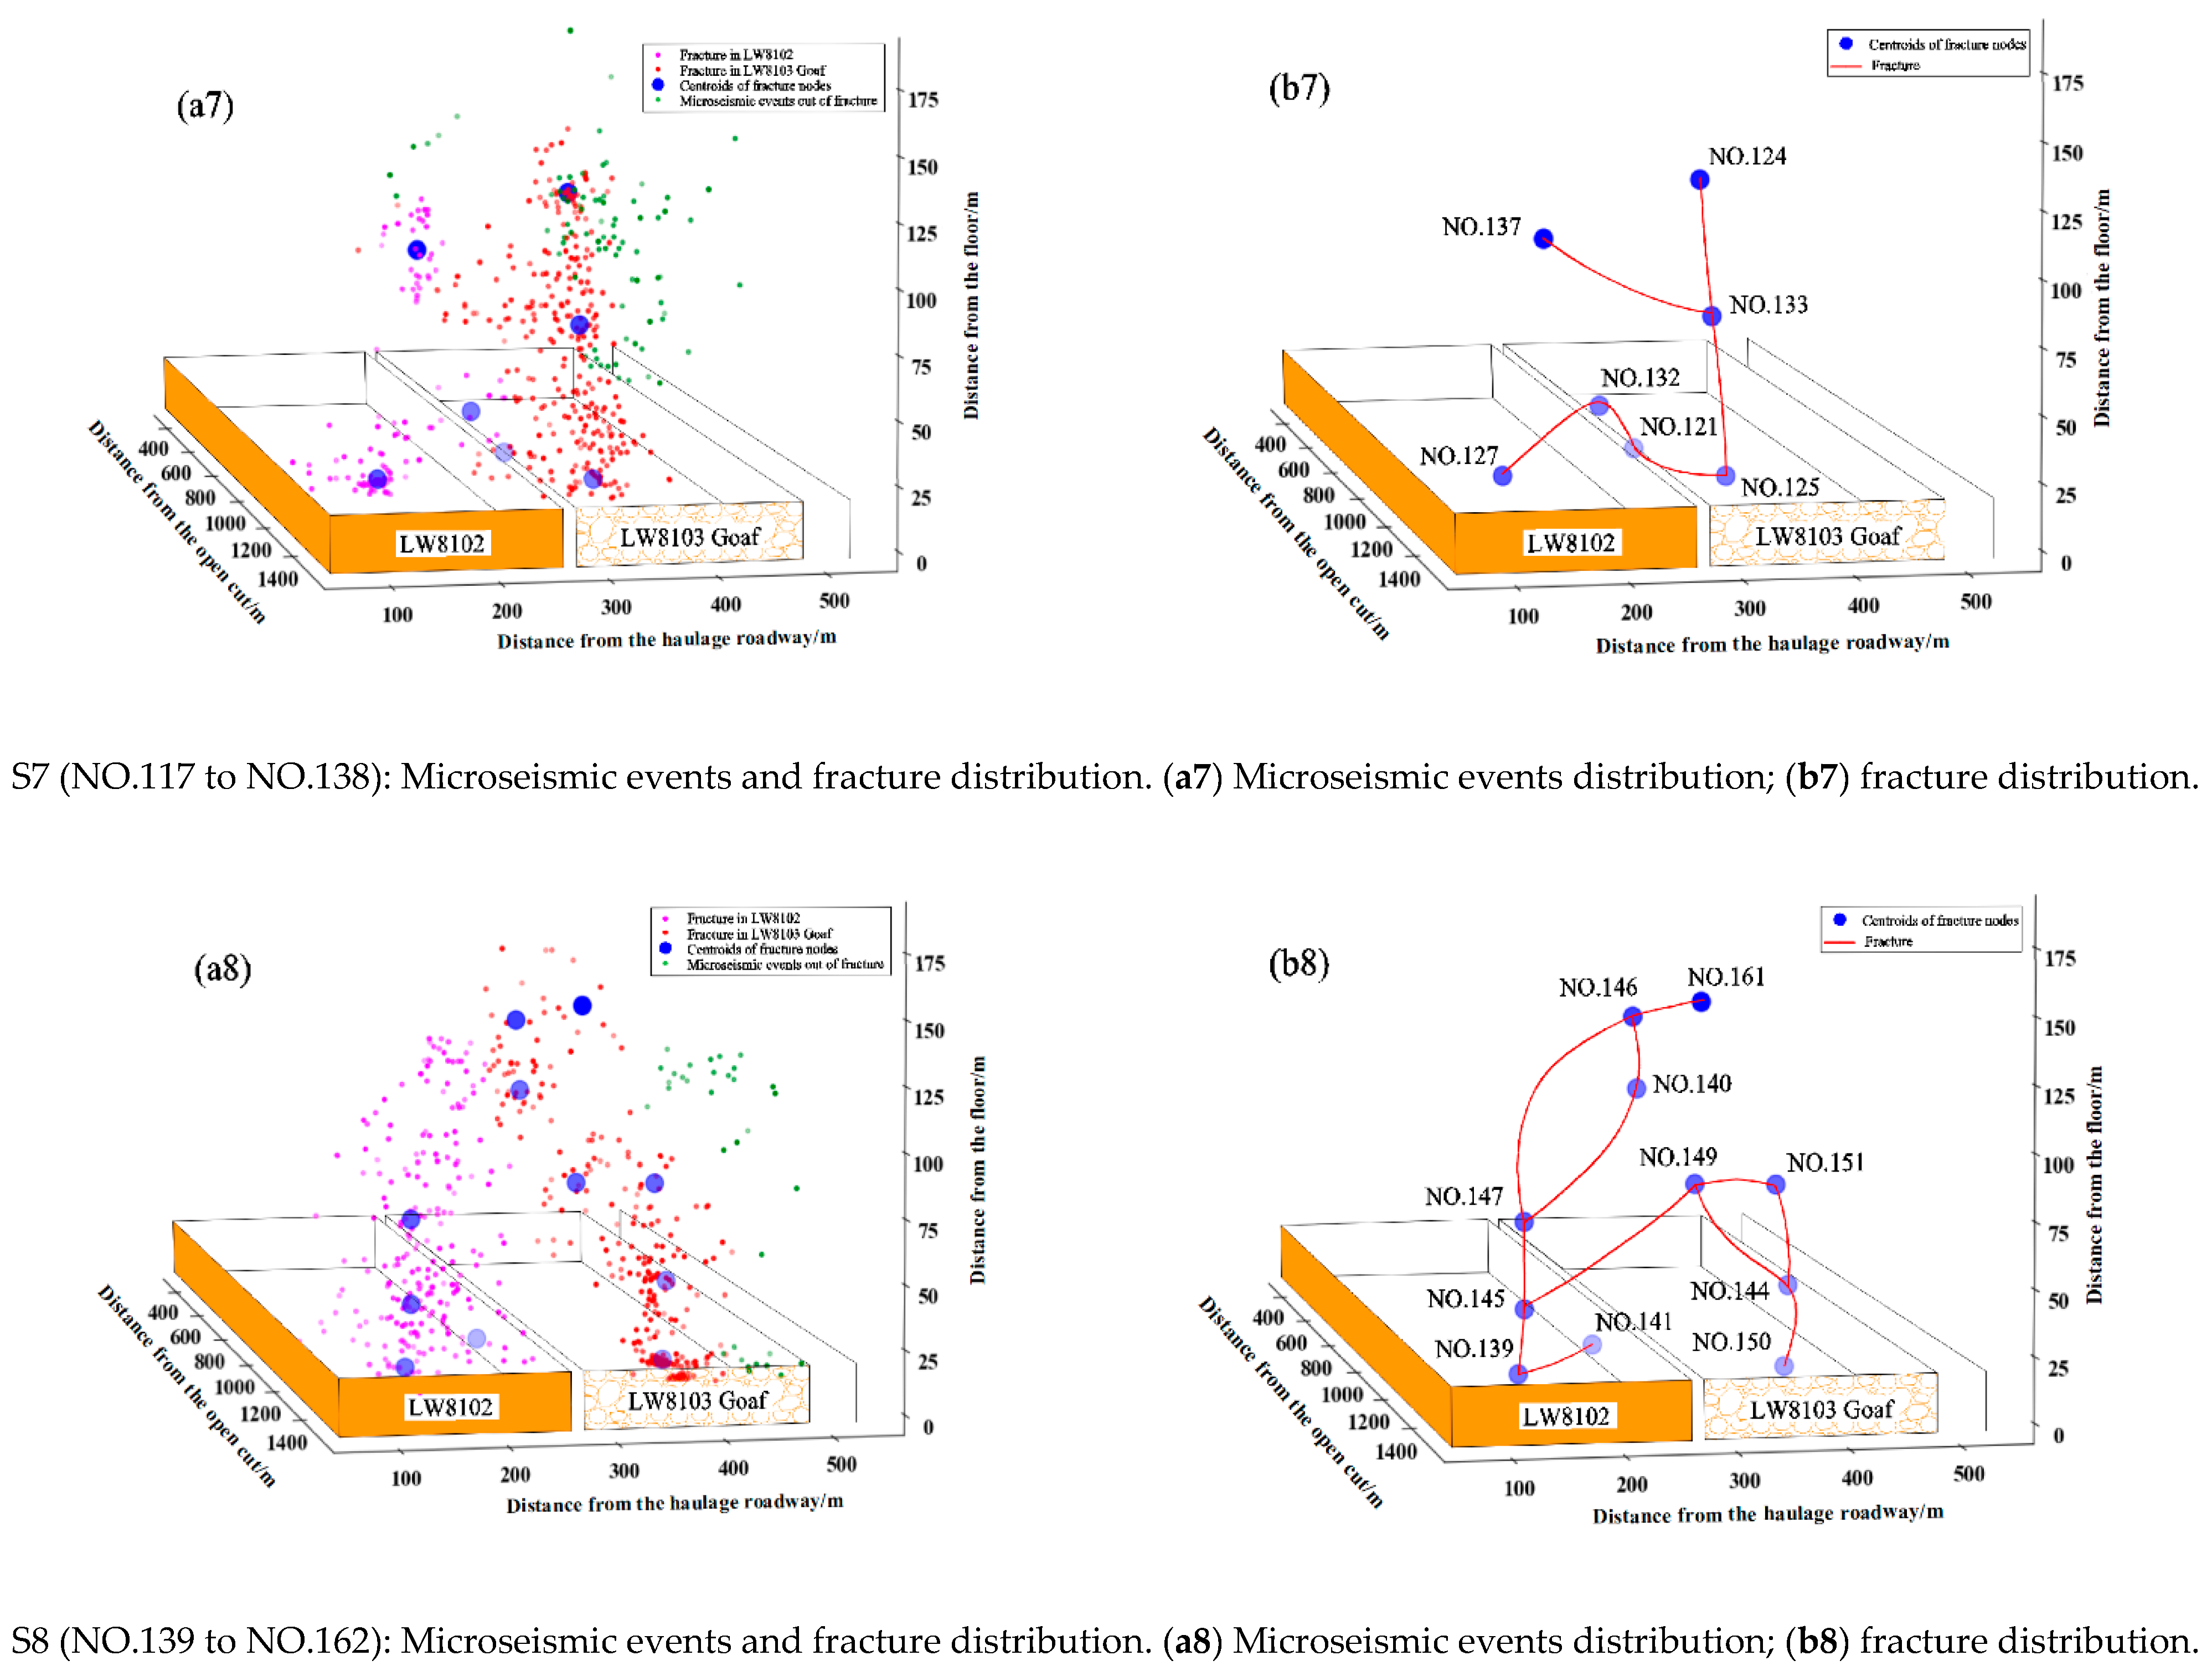
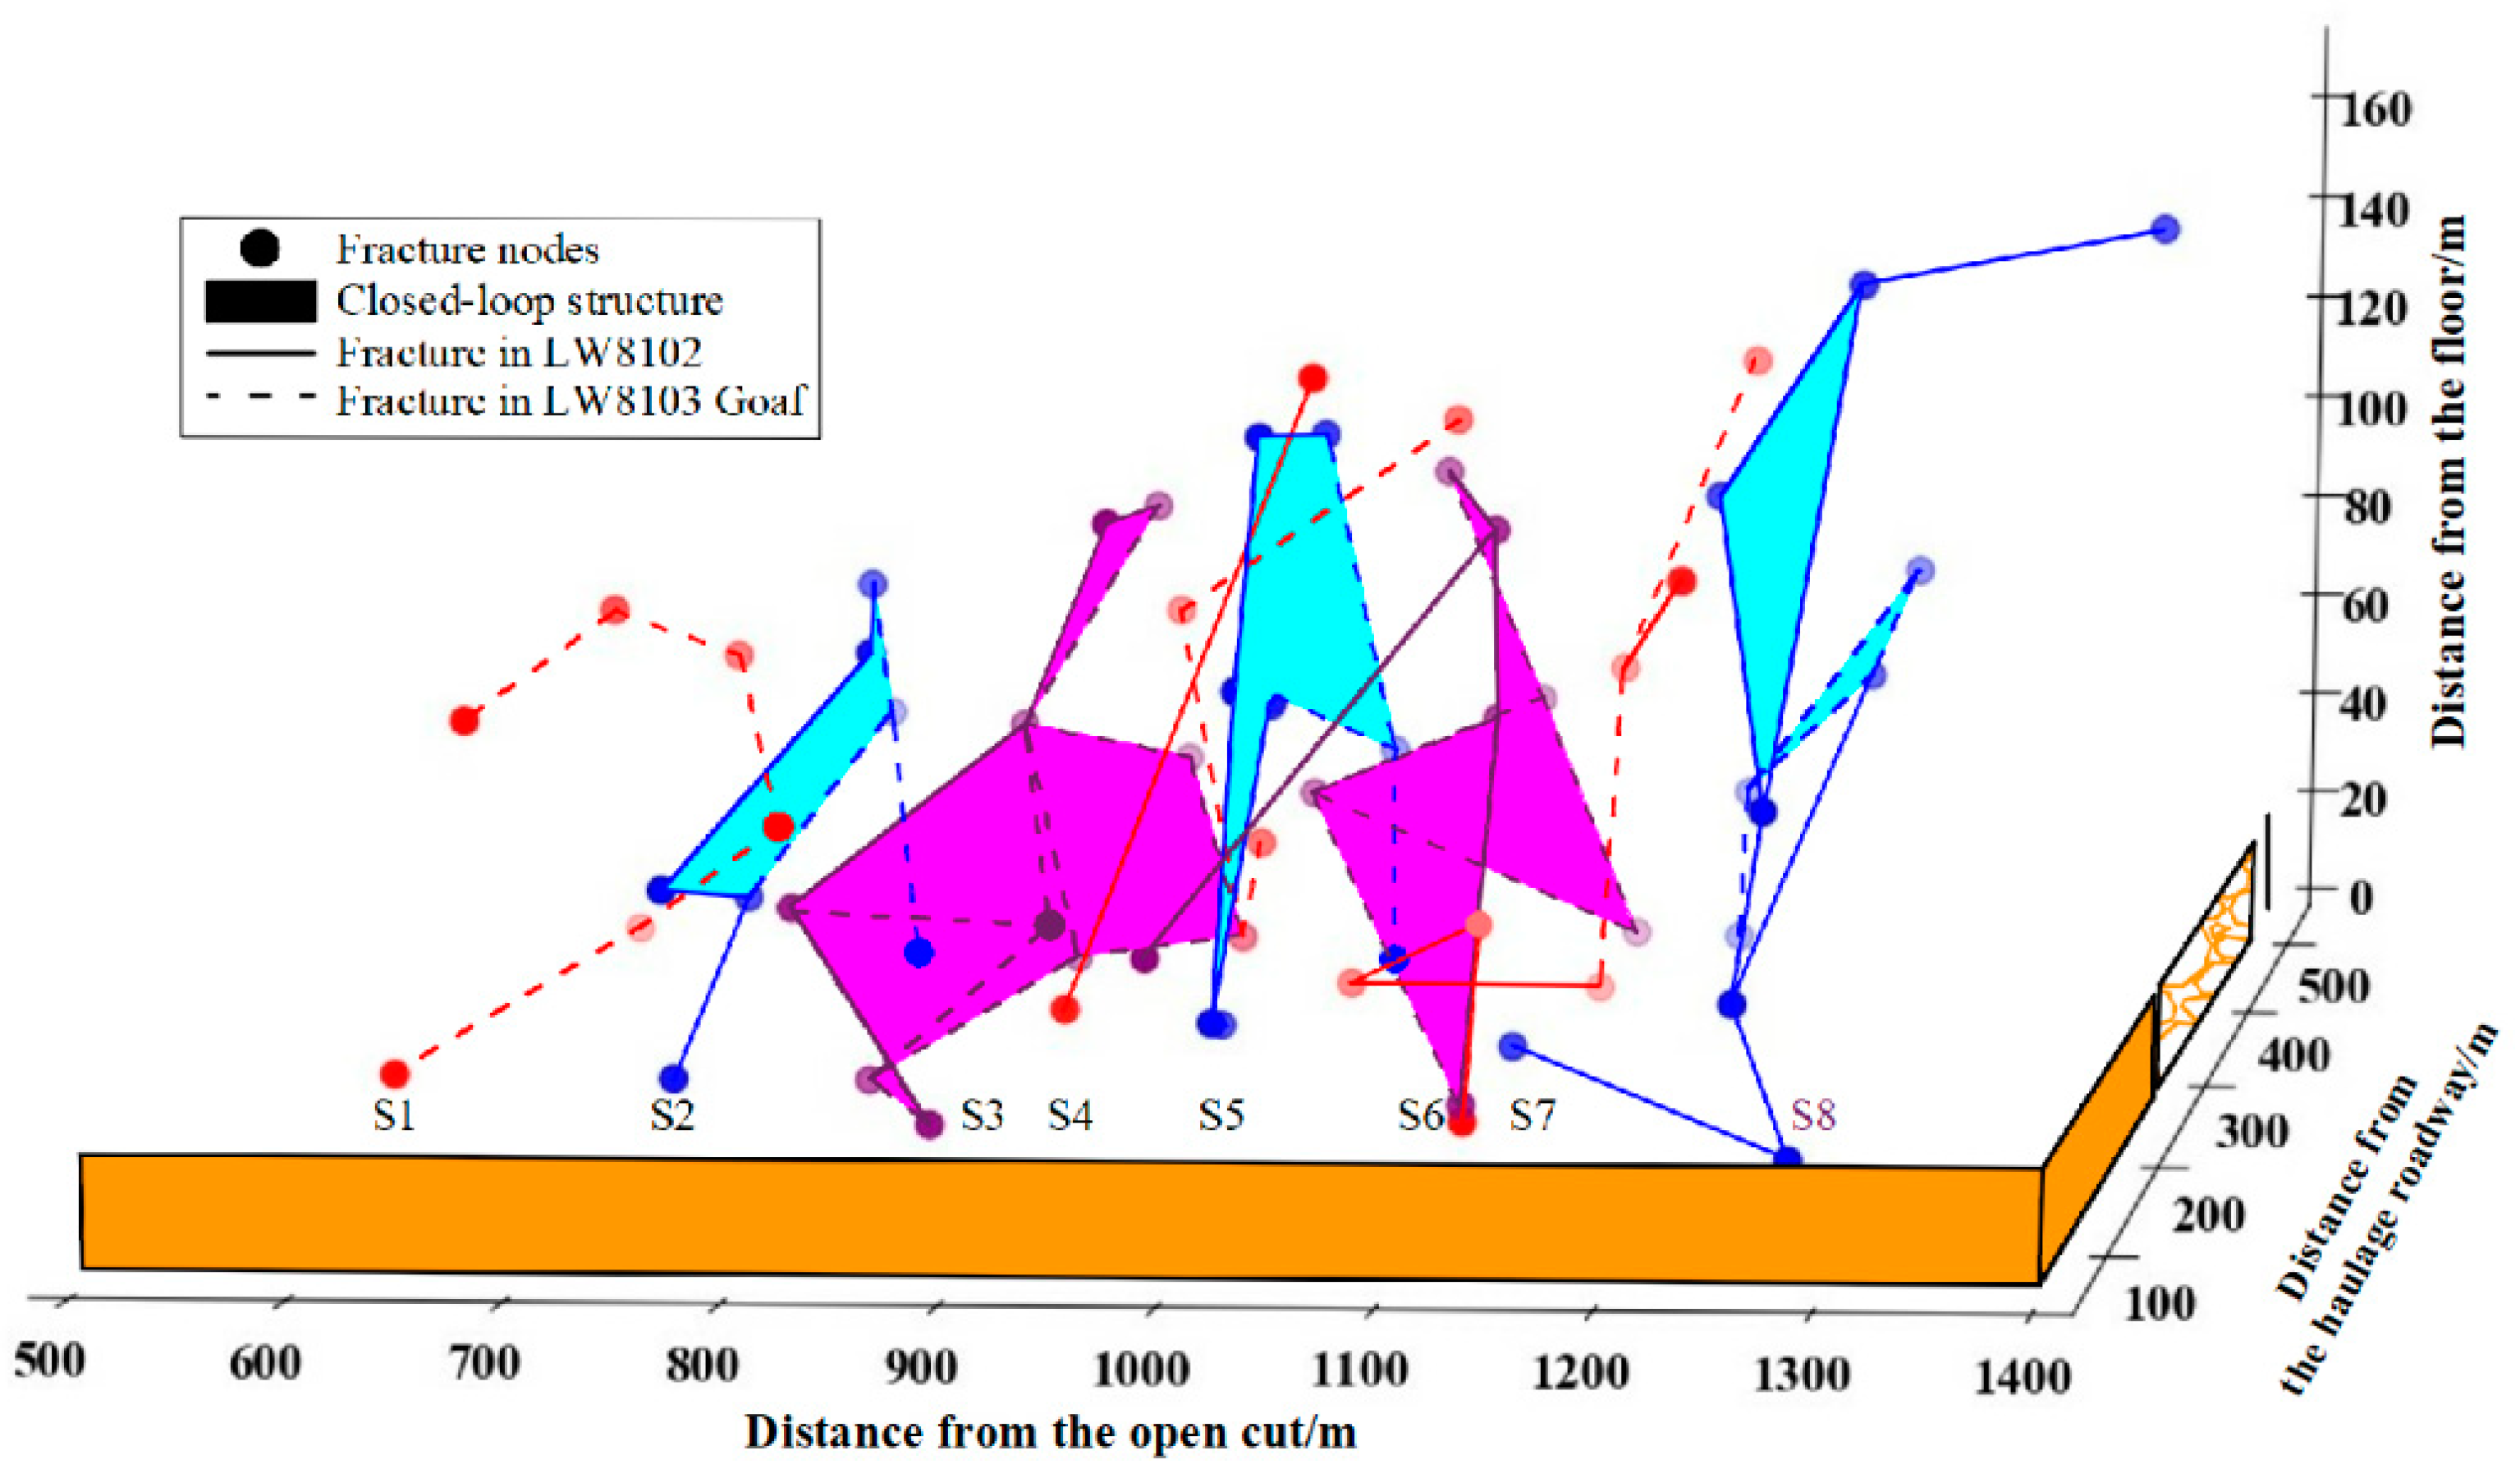
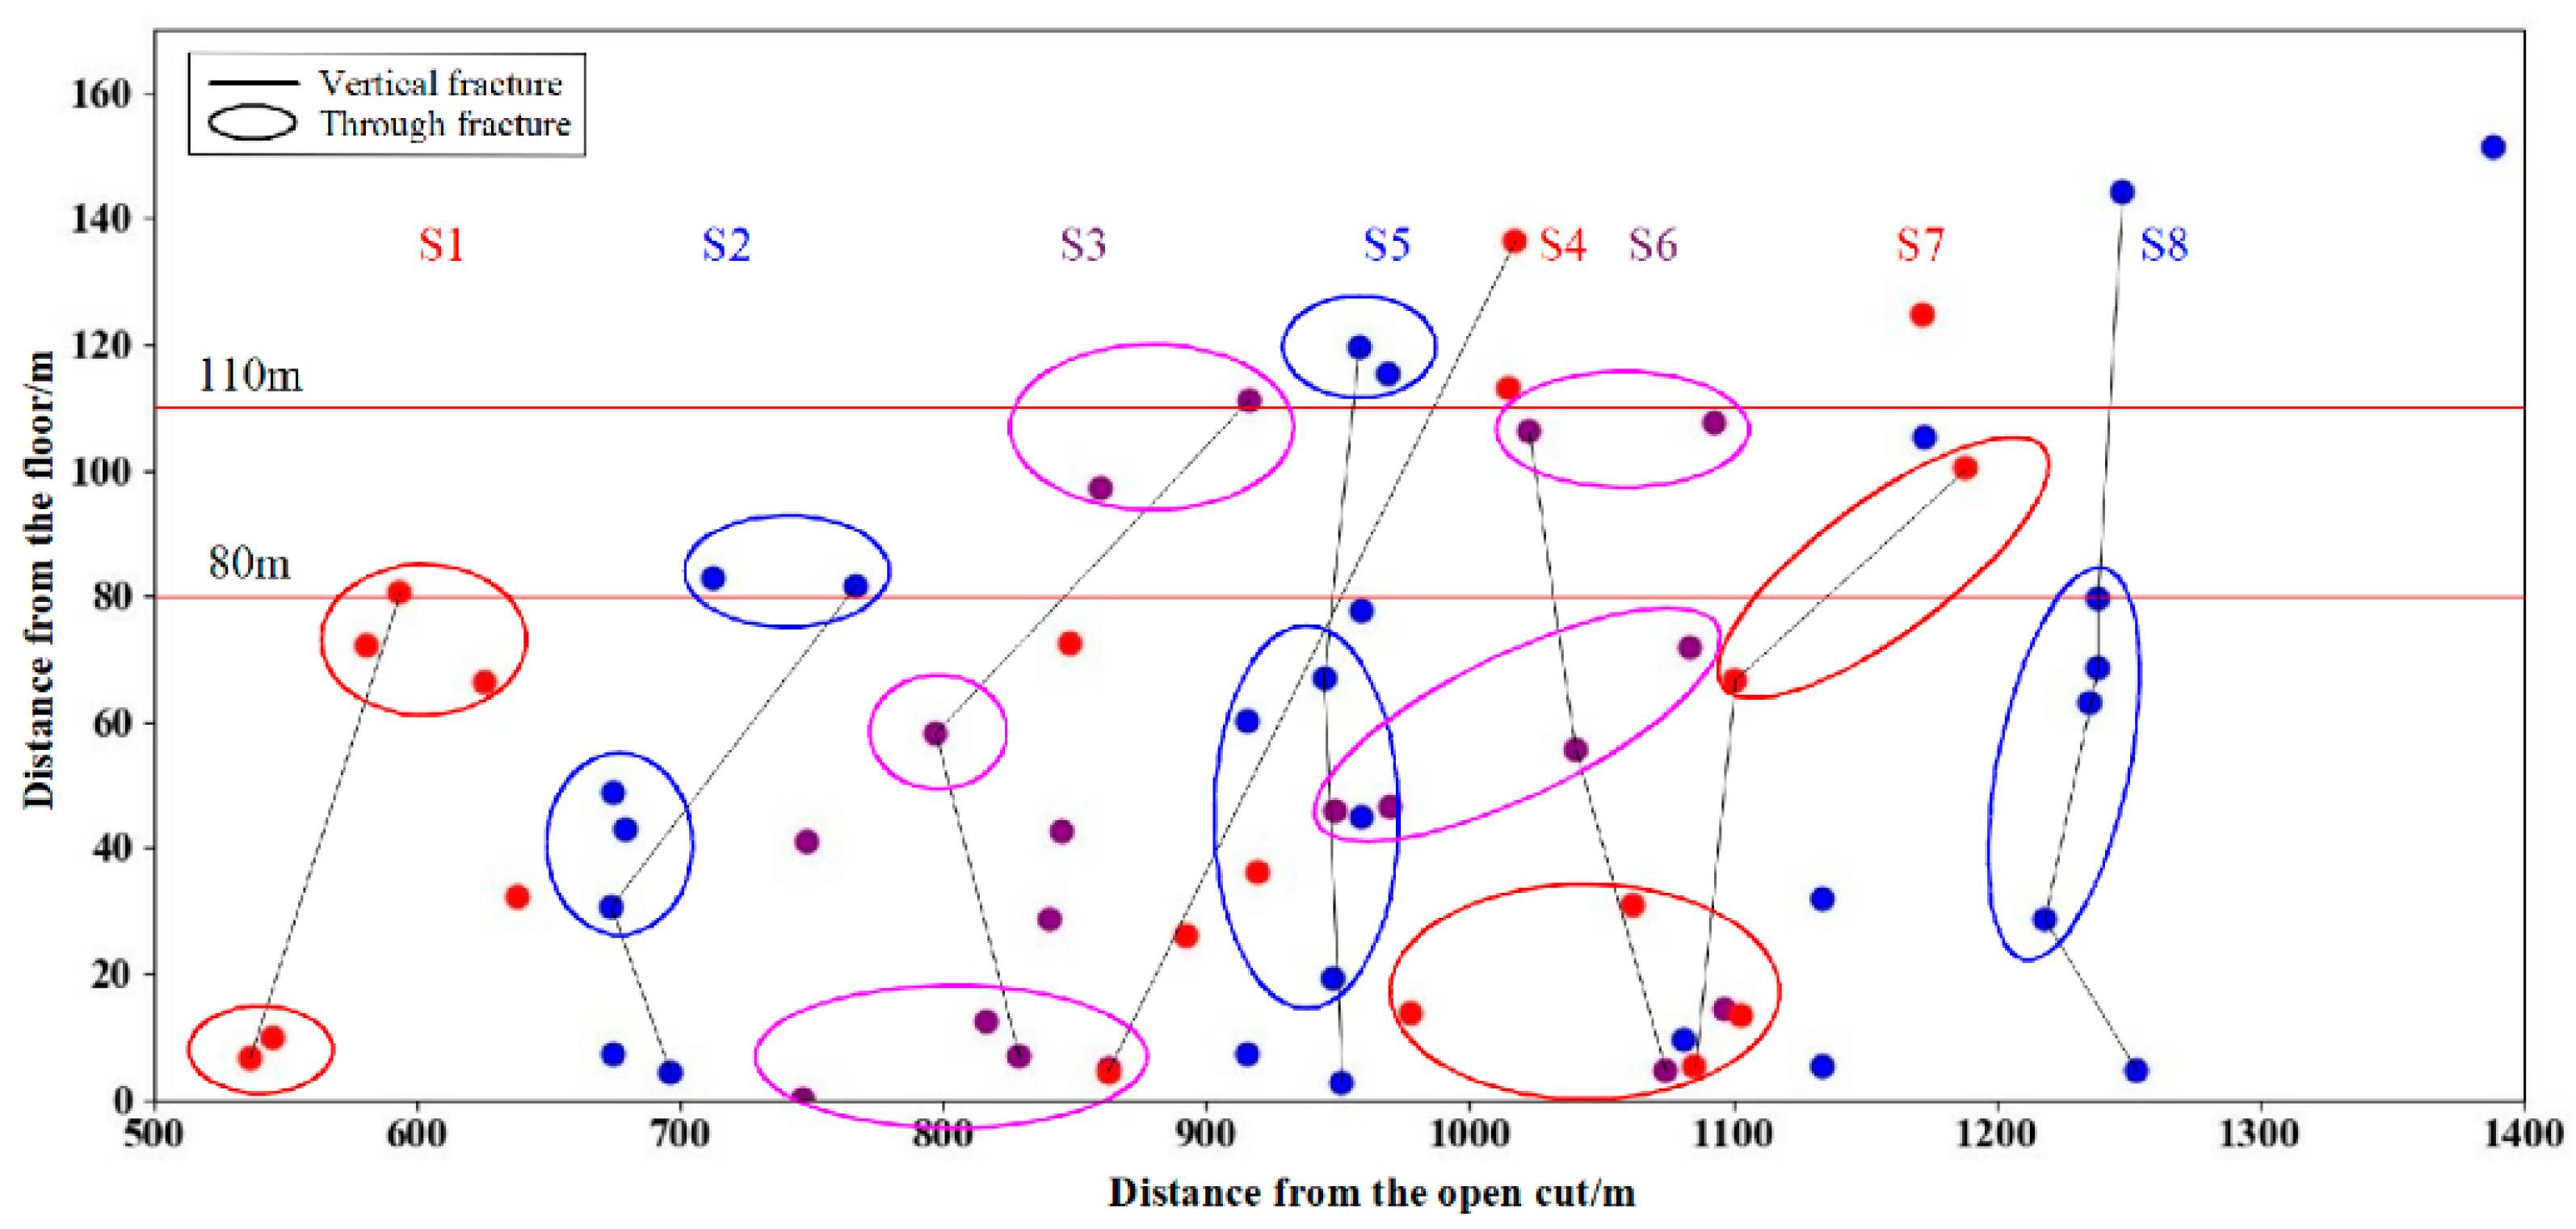
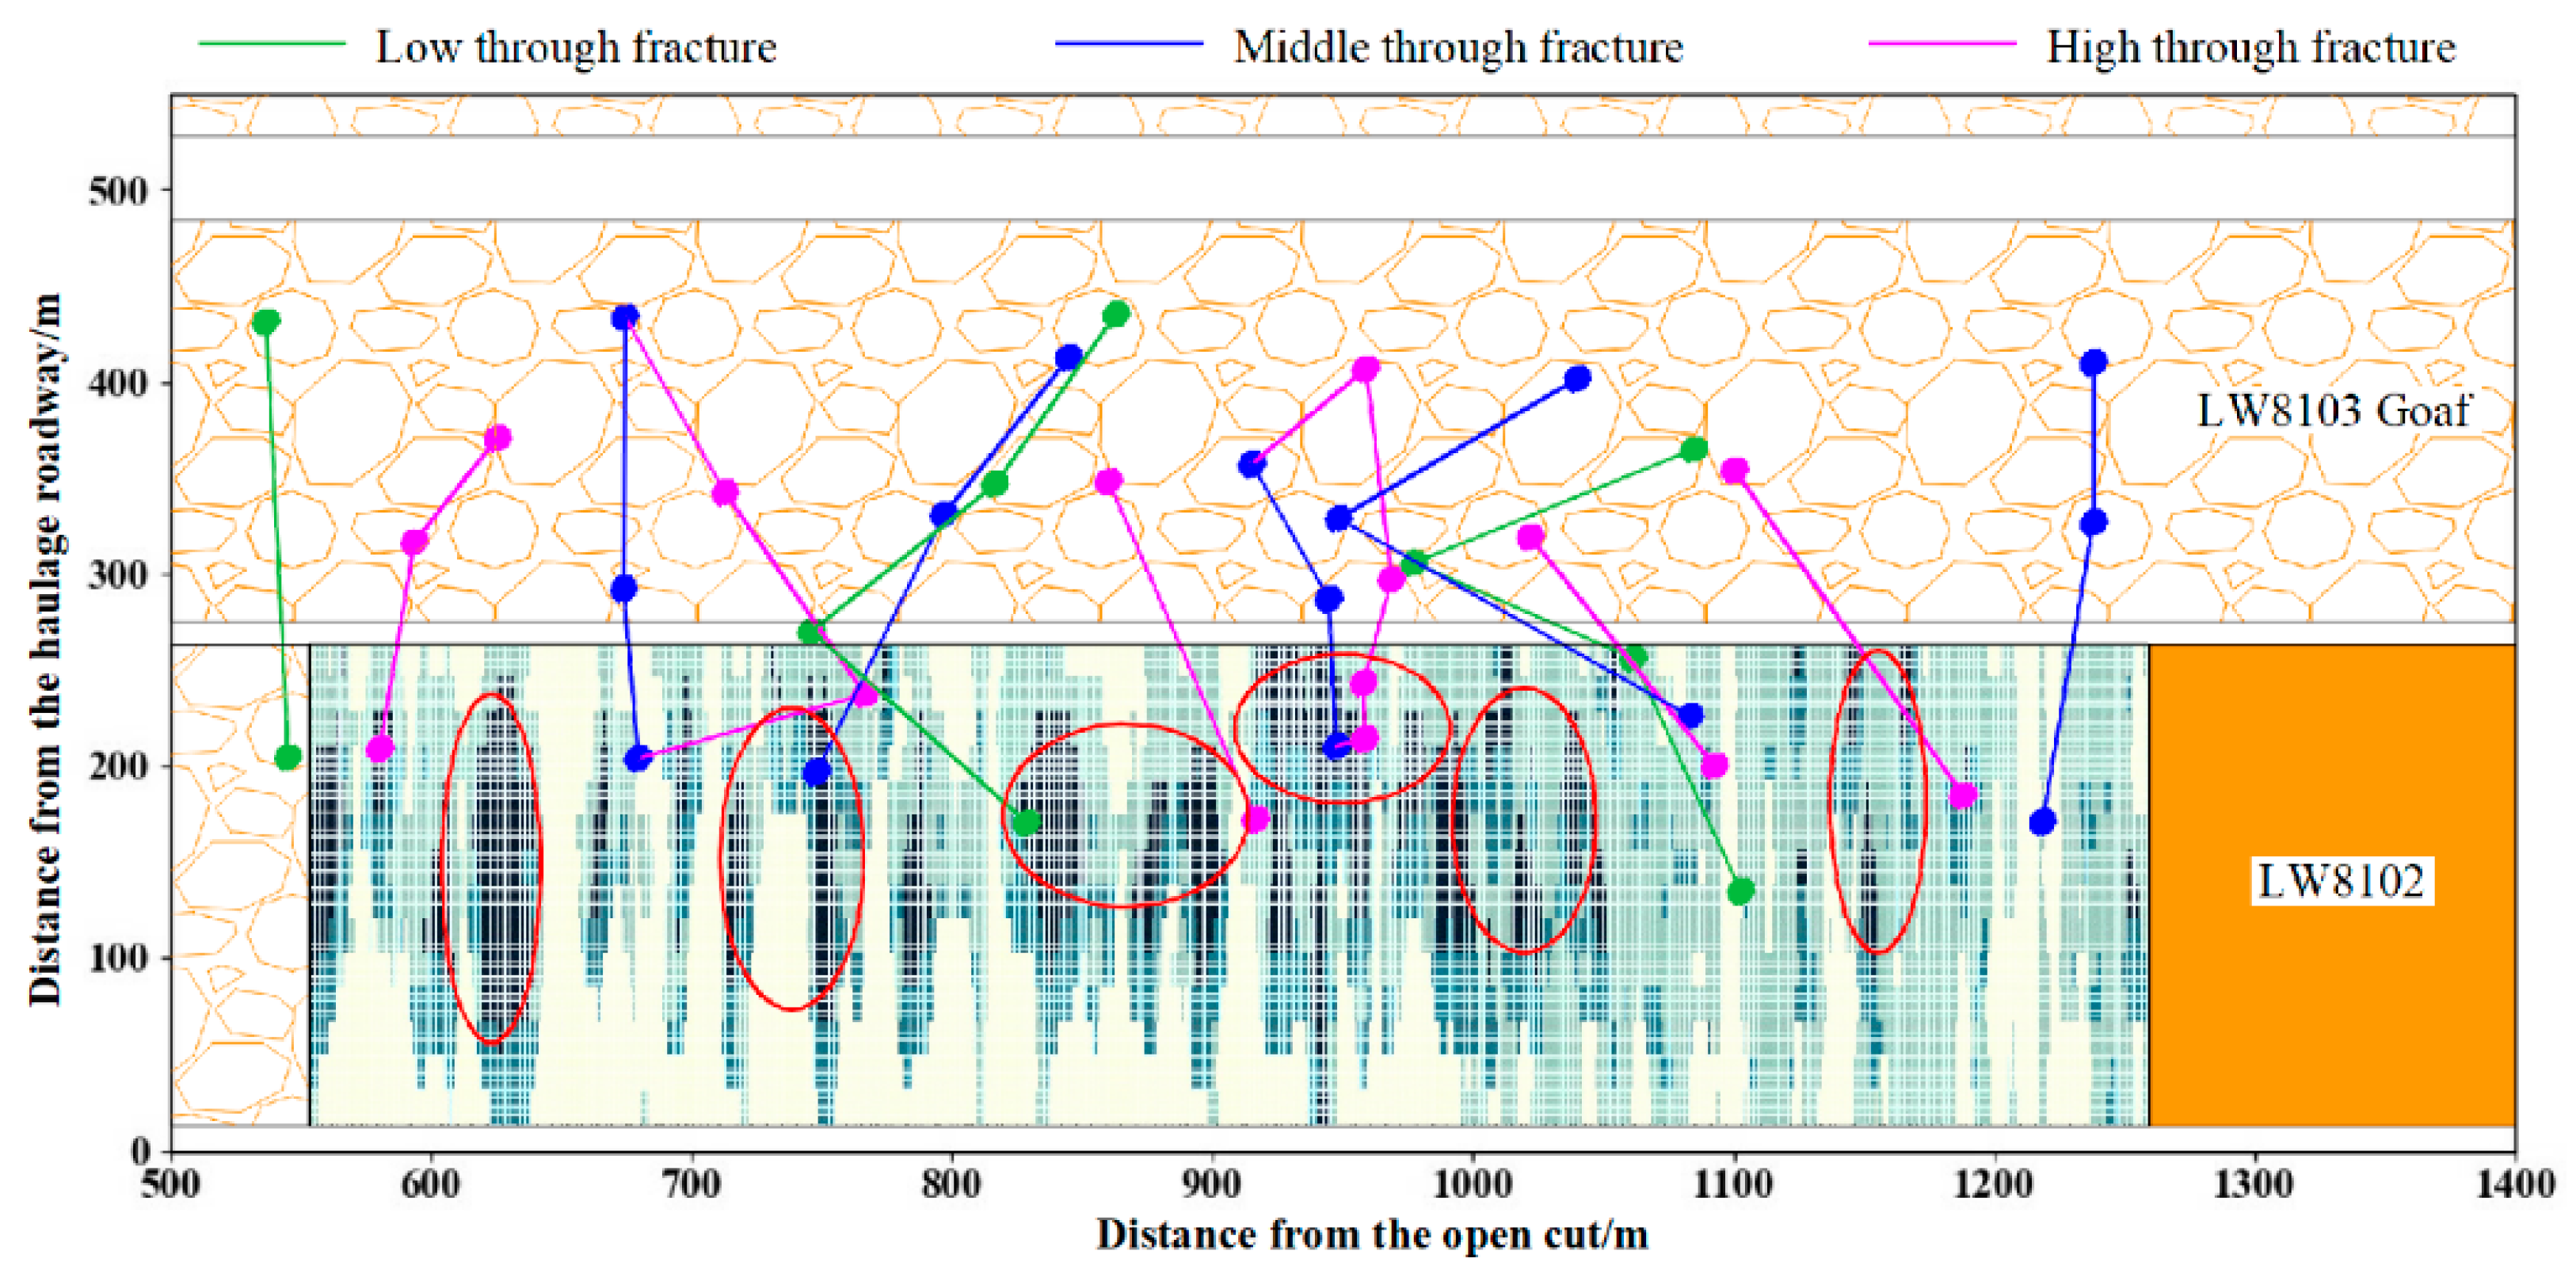
4. Dynamic Identification and Distribution Patterns of Overburden Fractures

During coal seam mining, the overburden rock initially sinks to deformation, gradually generating fracture cracks, and increasing the overburden fracture destabilization degree. Under different space and time conditions, fracture cracks extend and penetrate, forming fractures and destabilized forms of overlying rock. Therefore, the microseismic events in each cluster were plotted sequentially in a three-dimensional map in the order of centroid time sequence, in order to analyze the dynamic extension process and distribution patterns of fractures in overlying rocks.
The color gradients were fixed in chronological order, and the more posterior the event clusters were, the higher the values of the color gradients. All clusters were plotted in the 3D diagram, as shown in Figure 7. It can be found that, in time sequence, the microseismic events were positively correlated with the workface advancement; several fracture extension planes appeared along the advancing direction. The event clusters were plotted sequentially in a three-dimensional diagram, which shows that there were eight fracture extensions, named S1 to S8, in the advancing direction. The microseismic events and fracture distribution of each extension are shown in Figure 8. The fractures of all extensions are plotted in one figure, as shown in Figure 9.
From Figure 8 and Figure 9, it can be found that each extension formed vertical fractures connecting the low and high rock layers in the LW8102 and LW8103 goafs, and through fractures connecting the LW8102 and LW8103 goafs in their high, middle, and low levels. The fractures of some extensions linked to form a closed-loop structure. The vertical fractures and through fractures projected into the front view of the overburden, as shown in Figure 10. According to Figure 8, Figure 9 and Figure 10, the dynamic expansion process and distribution pattern of the overburden fracture could be obtained.
(1) Dynamic expansion process and distribution pattern of vertical fractures
A total of 15 vertical fractures were formed in the eight extensions. A single vertical fracture formed in both LW8102 and LW8103 goafs in each of the extents, apart from S1, S6, and S7. S1 and S7 failed to form a vertical fracture in LW8102. S6 formed two vertical fractures in LW8102, one of which was composed of NO.96 and NO.98, with fewer microseismic events, named S6-1, while the other one was densely distributed with microseismic events consisting of NO.98, NO.99, and NO.101, named S6-2.
According to the centroid temporal characteristics of vertical fracture nodes, the rupture time of the rock layers at different levels was found to vary. However, from the overall extension process, it showed a trend of rupture, initially by one or two layers of stratum, and then extending to one or both sides, reflecting four forms of extensions: from the middle to both ends; from both the ends to the middle; from low-lying to high-lying; and from high-lying to low-lying. The statistical table of vertical fracture dynamic expansion forms is shown in Table 1.
All of the vertical fractures were inclined toward the advancing direction. The low-lying ends were mainly distributed in the coal seam within 10 m from the floor. The high-lying ends varied from 80 m to 151 m from the floor, where S1 and S2 were located at 80 m from the floor; S3, S4, S5, S6, and S7 ranged from 100 to 136 m from the floor, with the highest, S8, reaching 151 m.
(2) Dynamic expansion process and distribution pattern of through fractures
A total of 14 through fractures were formed in the eight extensions. Through fractures formed with the exception of S4. The through fractures were found in the low, middle, and high levels of the extensions, with the numbers 6, 5, and 3, respectively. In the high level, through fractures formed in S1, S2, S3, S5, S6, S7, where S1, S2, and S7 were located in the rock layer at 80 m from the floor, and S3, S5, and S6 were located in the rock layer at 110 m from the floor. In the middle level, through fractures are formed in S2, S3, S5, S6, and S8, which were located in the formation about 40 m from the floor. In the low level, through fractures formed in S1, S3, and S7, which were located in the coal seam below 20 m from the floor.
According to the centroid temporal characteristics of the fracture nodes, there was a time sequence between through fractures and the vertical fracture expansion process, which was mainly reflected in two forms: the first one was when the vertical fracture extended to a certain layer. It provided the initial rupture space for through fracture spreading, e.g., extensions from the LW8102 to LW8103 goafs, from the LW8103 goaf to LW8102, and from both ends to the middle. The second process was that the through fracture first broke, and then extended to the vertical fracture until it intersected with the vertical fracture, or provided the initial rupture space for the expansion of the vertical fracture, e.g., extension from the middle to both ends. The statistical table of through fracture dynamic expansion forms is shown in Table 2. From Table 2, it can be found that the dynamic expansion form of the first process was significantly outnumbered by the second process, indicating that the expansion form of through fractures was dominated by the first one.

5. Mine Pressure Mechanism Based on Overburden Fractures

According to the dynamic expansion and distribution pattern of overburden fractures at the working face, vertical fractures were found to extend from high to low while also extending from low to high, indicating that the rupture times of different rock layers were different, and affected each other. When a through fracture forms and a vertical fracture joins with it, the rock formation where the through fracture is located will experience “slip” or “swing” instability. During the downward instability movement of the rock layer, it is extremely probable that kinetic energy was transferred to the lower layer, which caused the lower layer to move unstably along the lower fracture, triggering the synchronous instability movement of the multi-layer rock formation, and causing the mine pressure to appear at the working face. Therefore, the through fractures at different heights have different effects on the mine pressure at the working face, in which the higher the distance is from the floor, the stronger the pressure at the working face. This provides an explanation for the large and strong mine pressure phenomenon in the Datong hard roof mining area.
In order to study the relationship between the overburden fractures and the mine pressure at the working face, the support resistance in the microseismic monitoring area was monitored, and a heat map of the mine pressure state at the working face was obtained, as shown in Figure 11. From the figure, it can be seen that during the mining period, a total of six mining pressure appearances were generated, among which P3, P4, and P5 had high pressure intensity, short pressure interval, and long persistence. Moreover, in the following long-range monitoring area, despite there being no mining pressure appearance, Level 1 was dominant overall, showing a high mine pressure state. Thus, P3, P4, and P5 can generally be regarded as a strong mine pressure phenomenon, while P1, P2, and P6 can be regarded as a large mine pressure phenomenon.
The through fractures project into the top view of the working face, and the heat map of the mine pressure state of the working face was filled into the monitoring area to observe the correspondence between the above two, as shown in Figure 12. From the figure, it can be found that there was a clear correspondence between high through fracture and mining pressure appearance, indicating that high through fracture was the main cause of mining pressure appearance at the working face. P1, P2, and P6 correspond to high through fractures 80 m from the floor, indicating that high through fracture at 80 m from the floor was the main cause of the large mine pressure phenomenon at the working face. P3, P4, and P5 correspond to high through fractures 110 m from the floor. Furthermore, the interval between these three through fractures is relatively small, and the through fractures in other lower layers are also closely distributed. Therefore, it can be inferred that the formation of multiple adjacent high through fractures 110 m from the floor that triggered simultaneous instability movement of the lower multi-layer level rock is the main reason for the strong mine pressure phenomenon at the working face. The overall high mine pressure state in the following long-range monitoring area after strong mine pressure is related to the stabilization process of simultaneous instability movements of the multi-layered rock layers, leading to strong mine pressure.

6. Conclusions

(1) The problem that the discrete spatio-temporal distribution of microseismic events limits the study of overburden fracture characteristics can be solved using spatial and temporal clustering of the microseismic data, and characterizing the distribution of microseismic events in the form of clusters. The optimal k value was determined using the five evaluation indicators proposed in this study, which are as follows: average of contour coefficients; standard deviation of contour coefficients; proportion larger than the average contour coefficient in the total number of samples; average value of the proportion of the contour coefficients greater than the average value in each cluster; standard deviation of the proportion of the contour coefficients greater than the average value in each cluster. According to the clustered centroid time characteristics, the microseismic events in the clusters were sequentially plotted into the three-dimensional map, and the dynamic expansion process and distribution law of the overburden fractures could be obtained.
(2) The dynamic expansion process and distribution pattern of fractures in the overburden were as follows: eight fracture extensions were formed in the overburden. Each extension formed vertical fractures that connected the low and high rock layers in the LW8102 and LW8103 goafs, and through fractures connecting the LW8102 and LW8103 goafs in their high, middle, and low levels. The fractures of some extensions linked to form a closed-loop structure. The vertical fracture showed a trend of rupture, firstly by one or two layers of stratum, and then extending to one or both sides. There was a time sequence between the through fracture and the vertical fracture spreading process, which was mainly reflected in two forms: the first form is that when the vertical fracture extended to a certain layer, it provided the initial rupture space for through fracture spreading; the second form is that the through fracture first broke, and then extended to the vertical fracture until it intersected with the vertical fracture, or provided the initial rupture space for the expansion of the vertical fracture.
(3) The mechanism of mine pressure was analyzed based on the overburden fractures, which revealed that high through fracture was the main cause of mining pressure appearance. It was precisely positioned at the formation of multiple adjacent high through fractures 110 m from the floor, triggering simultaneous instability movements of the lower multi-layer level rock. This was the main reason for the strong mine pressure phenomenon at the working face. Meanwhile, high through fracture at 80 m from the floor was the main reason for the large mine pressure phenomenon at the working face.

7. Patents

“CN 114382544 A. 2022.04.22”A quantitative analysis method for fracture characteristics of overlying rock in working faces.

Author Contributions

Conceptualization, C.L. and Y.C.; methodology, P.Y. and Y.C.; software, S.L. and Y.C.; validation, Y.C., C.L. and J.L.; formal analysis, P.Y. and S.L.; investigation, J.L. and Y.C.; resources, J.L. and Y.C.; data curation, J.L. and Y.C.; writing—original draft preparation, Y.C., C.L. and S.L.; writing—review and editing, C.L. and Y.C.; visualization, Y.C. and C.L.; supervision, C.L.; project administration, C.L.; funding acquisition, C.L. and Y.C. All authors reviewed the manuscript. All authors have read and agreed to the published version of the manuscript.

Funding

This study is supported by the National Natural Science Foundation of China (52074267) and the Graduate Research and Innovation Program of Jiangsu Province (KYCX21_2367).

Institutional Review Board Statement

Not applicable.

Informed Consent Statement

Informed consent was obtained from all subjects involved in the study.

Data Availability Statement

Not applicable.

Acknowledgments

This study is supported by the National Natural Science Foundation of China (52074267) and the Graduate Research and Innovation Program of Jiangsu Province (KYCX21_2367). Many thanks give to Hongfei Duan, Yanwen Shang, and Wenyu Chai of Tongxin Mine for their help in obtaining microseismic data in this study.

Conflicts of Interest

The authors declare that no conflict of interest exist in this manuscript, the research is original, and has not been published previously or under consideration for publication elsewhere, in whole or in part.

References

  1. Yang, J.X.; Liu, C.Y.; Yu, B.; Lu, Y. Strong strata pressure caused by hard roof group structure breaking and supporting strength determination. J. Univ. Sci. Technol. Beijing 2014, 36, 576–583. (In Chinese) [Google Scholar] [CrossRef]
  2. Zhang, H.W.; Fu, X.; Yu, B.; Huo, B. Study of the cylindrical shell structural characteristic of the hard overlying strata of extra thick coal seam and its application. J. China Univ. Min. Technol. 2017, 46, 1226–1230. (In Chinese) [Google Scholar] [CrossRef]
  3. Yu, B.; Yang, J.X.; Gao, R. Mechanism and technology of roof collaborative controlling in the process of Jurassic and Carboniferous coal mining in Datong mining area. J. China Univ. Min. Technol. 2018, 47, 486–493. (In Chinese) [Google Scholar] [CrossRef]
  4. Zhu, W.B.; Yu, B. Breakage form and its effect on strata behavior of far field key stratum in large space stope. Coal Sci. Technol. 2018, 46, 99–104. (In Chinese) [Google Scholar] [CrossRef]
  5. Gao, R.; Yu, B.; Meng, X.B. Study on the mechanism of strong strata behavior influenced by overlying coal pillar and control technology of ground fracturing. J. Min. Saf. Eng. 2018, 35, 324–331. (In Chinese) [Google Scholar] [CrossRef]
  6. Yu, B.; Liu, C.Y.; Liu, J.R. Mechanism and control technology of pressure occurence in roadway with extra thickness and mechanized caving coal seam in Datong mining area. Chin. J. Rock Mech. Eng. 2014, 33, 1863–1872. (In Chinese) [Google Scholar] [CrossRef]
  7. Ma, C.C.; Li, T.B.; Zhang, H.; Jiang, Y.P.; Song, T. A method for numerical simulation based on microseismic information and the interpretation of hard rock fracture. J. Appl. Geophys. 2019, 164, 214–224. [Google Scholar] [CrossRef]
  8. Niitsuma, H. Acoustic emission/Microseismic technique: Review of research in the 20th century and future aspects. In Proceedings of the 15th International Acoustic Emission Symposium (IAES15), Tokyo, Japan, 11–14 September 2000; pp. 109–125. [Google Scholar] [CrossRef]
  9. Reyes-Montes, J.M.; Young, R.P. Interpretation of fracture geometry from excavation induced microseismic events. In Proceedings of the International Symposium of the International-Society-for-Rock-Mechanics, Liege, Belgium, 9–12 May 2006. [Google Scholar] [CrossRef]
  10. Xue, Y.; Liu, J.; Ranjith, P.G.; Gao, F.; Xie, H.; Wang, J. Changes in microstructure and mechanical properties of low-permeability coal induced by pulsating nitrogen fatigue fracturing tests. Rock Mech. Rock Eng. 2022, 55, 7469–7488. [Google Scholar] [CrossRef]
  11. Xue, Y.; Ranjith, P.; Chen, Y.; Cai, C.; Gao, F.; Liu, X. Nonlinear mechanical characteristics and damage constitutive model of coal under CO2 adsorption during geological sequestration. Fuel 2023, 331, 125690. [Google Scholar] [CrossRef]
  12. Fritschen, R. Mining-Induced Seismicity in the Saarland, Germany. Pure Appl. Geophys. 2010, 167, 77–89. [Google Scholar] [CrossRef]
  13. Kozlowska, M.; Orlecka-Sikora, B.; Rudzinski, L.; Cielesta, S.; Mutke, G. Atypical evolution of seismicity patterns resulting from the coupled natural, human-induced and coseismic stresses in a longwall coal mining environment. Int. J. Rock Mech. Min. Sci. 2016, 86, 5–15. [Google Scholar] [CrossRef]
  14. Sato, K.; Fujii, Y. Induced seismicity associated with longwall coal mining. Int. J. Rock Mech. Min. Sci. Geomech. Abstr. 1988, 25, 253–262. [Google Scholar] [CrossRef]
  15. Cao, W.; Durucan, S.; Cai, W.; Shi, J.-Q.; Korre, A.; Jamnikar, S.; Rošer, J.; Lurka, A.; Siata, R. The Role of Mining Intensity and Pre-existing Fracture Attributes on Spatial, Temporal and Magnitude Characteristics of Microseismicity in Longwall Coal Mining. Rock Mech. Rock Eng. 2020, 53, 4139–4162. [Google Scholar] [CrossRef]
  16. Woodward, K.; Wesseloo, J.; Potvin, Y. A spatially focused clustering methodology for mining seismicity. Eng. Geol. 2018, 232, 104–113. [Google Scholar] [CrossRef]
  17. Lasocki, S. Statistical short-term prediction in mining induced seismicity. In Proceedings of the 3rd International Symp on Rockbursts and Seismicity in Mines, Kingston, ON, Canada, 16–18 August 1993; pp. 211–216. [Google Scholar]
  18. Lj, J. Outbursts in Coal Mines; IEA Coal Research: London, UK, 1984. [Google Scholar]
  19. Yu, B.; Zhao, J.; Xiao, H.T. Case Study on Overburden Fracturing during Longwall Top Coal Caving Using Microseismic Monitoring. Rock Mech. Rock Eng. 2017, 50, 507–511. [Google Scholar] [CrossRef]
  20. Si, G.; Durucan, S.; Jamnikar, S.; Lazar, J.; Abraham, K.; Korre, A.; Shi, J.-Q.; Zavšek, S.; Mutke, G.; Lurka, A. Seismic monitoring and analysis of excessive gas emissions in heterogeneous coal seams. Int. J. Coal Geol. 2015, 149, 41–54. [Google Scholar] [CrossRef]
  21. Young, R.P.; Collins, D.S.; Hazzard, J.; Heath, A.; Pettitt, W.S.; Baker, C.; Billaux, D.; Cundall, P.; Potyondy, D.; Dedecker, F. Seismic Validation of 3-D Thermo-Mechanical Models for the Prediction of the Rock Damage around Radioactive Waste Packages in Geological Repositories-SAFETI; Final Report; European Commission Nuclear Science and Technology: 2005. Available online: https://cordis.europa.eu/project/id/FIKW-CT-2001-00200/reporting/it (accessed on 3 November 2022).
  22. Wang, G.F.; Gong, S.Y.; Dou, L.M.; Wang, H.; Cai, W.; Cao, A.Y. Rockburst characteristics in syncline regions and microseismic precursors based on energy density clouds. Tunn. Undergr. Space Technol. 2018, 81, 83–93. [Google Scholar] [CrossRef]
  23. Yu, G.; Cheng, G.; Li, L.; Tang, C.; Ren, B.; Han, Y. Preliminary Study on High-Energy and Low-Energy Microfracture Event Evolution Characteristics in the Development Process of Rock Failure. Geofluids 2020, 2020, 8880107. [Google Scholar] [CrossRef]
  24. Pang, H.D. Study of Micro Seismic Mode, Location of Rock Mass and Its Collapse Prediction. Ph.D. Thesis, Shandong University of Science and Technology, Qingdao, China, 2004. (In Chinese). [Google Scholar]
  25. Cheng, Y.H. Preventing Coal Bump by Appling Microseismic Locating Monitoring Technology in Longwallface. Ph.D. Thesis, Shandong University of Science and Technology, Qingdao, China, 2006. (In Chinese). [Google Scholar]
  26. Cai, W. Fault Rockburst Induced by Static and Dynamic Loads Superposition and Its Monitoring and Warning. Ph.D. Thesis, China University of Mining and Technology, Xuzhou, China, 2015. (In Chinese). [Google Scholar]
  27. Zhou, Z.H. Machine Learning; Tsinghua University Press: Beijing, China, 2016. (In Chinese) [Google Scholar]
  28. Li, Z.; Jia, L.; Su, B. Improved k-means algorithm for finding public opinion of mount emei tourism. In Proceedings of the 15th International Conference on Computational Intelligence and Security (CIS), Macao, China, 13–16 December 2019. [Google Scholar] [CrossRef]
Figure 1. Stratigraphic column of LW8102.
Sustainability 15 00436 g001
Figure 2. Mining conditions and layout of LW8102.
Sustainability 15 00436 g002
Figure 3. Top view of microseismic event distribution.
Sustainability 15 00436 g003
Figure 4. Front view of microseismic event distribution.
Sustainability 15 00436 g004
Figure 5. Three-dimensional distribution of microseismic events.
Sustainability 15 00436 g005
Figure 6. Variation curve of the indicators of clustering results with k.
Sustainability 15 00436 g006
Figure 7. Microseismic events distribution after setting the color gradient.
Sustainability 15 00436 g007
Figure 8. Microseismic events and fracture distribution of each extension.
Sustainability 15 00436 g008aSustainability 15 00436 g008bSustainability 15 00436 g008c
Figure 9. Fracture distribution of all extensions.
Sustainability 15 00436 g009
Figure 10. Front view of the distribution of through fractures and vertical fractures.
Sustainability 15 00436 g010
Figure 11. Heat map of mine pressure state at the working face.
Sustainability 15 00436 g011
Figure 12. Corresponding relationship between through fractures and mine pressure states.
Sustainability 15 00436 g012
Table 1. Statistical table of vertical fracture dynamic expansion forms.
Dynamic Expansion FormsLW8102LW8103 Goaf
Middle to both the endsS2, S5S1, S2, S4, S8
Both the ends to the middleS6-1, S8S6, S7
Low-lying to high-lyingS3, S4S3
High-lying to low-lyingS6-2S5
Table 2. Statistical table of through fracture dynamic expansion forms.
Dynamic Expansion FormsHigh LevelMiddle LevelLow Level
vertical fractures arise firstboth ends to the middleS1, S2, S5——S3, S7
LW8103 goaf to LW8102S6S3, S5——
LW8102 to LW8103 goafS3S8S1
through fractures arise firstmiddle to both the endsS7S2, S6——
Disclaimer/Publisher’s Note: The statements, opinions and data contained in all publications are solely those of the individual author(s) and contributor(s) and not of MDPI and/or the editor(s). MDPI and/or the editor(s) disclaim responsibility for any injury to people or property resulting from any ideas, methods, instructions or products referred to in the content.

