Abstract
Forecasting the performance and energy yield of photovoltaic (PV) farms is crucial for establishing the economic sustainability of a newly installed system. The present study aims to develop a prediction model to forecast an installed PV system’s annual power generation yield and performance ratio (PR) using three environmental input parameters: solar irradiance, wind speed, and ambient air temperature. Three data-based artificial intelligence (AI) techniques, namely, adaptive neuro-fuzzy inference system (ANFIS), response surface methodology (RSM), and artificial neural network (ANN), were employed. The models were developed using three years of data from an operational 2MWp Solar PV Project at Kuzhalmannam, Kerala state, India. Statistical indices such as Pearson’s R, coefficient of determination (R2), root-mean-squared error (RMSE), Nash-Sutcliffe efficiency (NSCE), mean absolute-percentage error (MAPE), Kling-Gupta efficiency (KGE), Taylor’s diagram, and correlation matrix were used to determine the most accurate prediction model. The results demonstrate that ANFIS was the most precise performance ratio prediction model, with an R2 value of 0.9830 and an RMSE of 0.6. It is envisaged that the forecast model would be a valuable tool for policymakers, solar energy researchers, and solar farm developers.
1. Introduction
Renewable energy is the best solution for mitigating the threats of climate change. With technology making rapid advancements, the renewable energy sector has achieved incredible progress in the last decade [1]. Since almost all renewable energy sources are intermittent, improved forecasting and modeling of power resources becomes essential for renewable energy to manage the grid effectively [2]. The vulnerabilities in the supply chain of renewable energy must be smoothened to cope with the variabilities. The incorporation of storage systems benefits the large scale solar power developments [2]. Intelligent systems can support the integration of renewables into the existing grid and make renewable energy competitive in the current market. When artificial intelligence (AI) is integrated into renewable energy plants, the sensors and internet of things (IoT) devices can give new insights to the grid operators. Hybridization and storage are also becoming popular with solar Photovoltaic (PV) plants, which help the grid in the case of intermittency and unreliability of the power source [3].
The increased acceptance of distributed energy resources in the grid necessitates integrating AI techniques to control and optimize loads and manage the selection of different renewable energy resources for meeting the loads based on availability. With AI integration, microgrids and virtual power plants have become more dynamic and intelligent [4]. Artificial intelligence can enhance the performance of solar power plants to a greater level. The weather remains a significant factor in influencing the generation of renewable energy-based plants, such as solar and wind plants [5]. It is crucial to predict the output of wind and solar PV plants for the demand and supply management of electricity systems worldwide. Different AI techniques can predict PV plants’ performance precisely and thus, improve efficiency and accessibility. AI can address the issues of variability in renewable energy generation [6]. AI-based techniques offer a higher potential for predicting both the weather and the performance of renewable energy [7]. AI techniques will learn critical information patterns, avoiding the need for mathematical routines and complex rules. Intelligent sensors and IoT systems are interconnected to collect vast amounts of data [8].
1.1. Literature Review
Most of the published work on this topic is concerned with predicting solar radiation. The power output of a PV-based solar farm/plant module, though, is affected by factors other than solar irradiation. There has been little research on projecting PV-generated electricity. Factors such as hardware (cell size, solar cell type, incidence angle, layout) and weather conditions influence the electrical power output. In a PV system, for example, the temperature of the solar cell influences the quantity of electricity generated. Solar irradiation, ambient temperature, wind speed, and relative humidity affect the cell’s temperature. Various researchers have made efforts to predict the power generated from a solar PV plant by utilizing artificial intelligence (AI) tools like adaptive neuro-fuzzy inference system (ANFIS) [9], artificial neural networks (ANN) [10], numerical regression [11], support vector machines [3,12], and response surface methodology (RSM) [13] based on weather categorization concepts. Shi et al. [14] used a support vector machine for weather categorization to create a unique prediction model for estimating the power production of a 20 MW PV facility. The prediction model had a prediction error of 8.46%. The study used only the type of day (foggy, clear, rainy, and cloudy) as input. RSM was employed to create a predictive model by Kazemian et al. [15] for a photovoltaic system. The correlations between the characteristics above outputs, such as thermal, electrical energy, entropy, and exergy, were determined by means of their interactions in system performance. In another study, solar irradiation data from a township named Kermanshah in Iran was used to predict solar radiation using three methodologies: ANFIS, ANN, and RSM. The results were compared among themselves. The finding was that the prediction efficacy of RSM was marginally superior compared to the neural network [16].
In a more extensive study by Mellit et al. [17], a year’s data was used to anticipate the electricity generated by a 50 W PV plant. ANN was used for model training and prediction. This study was intended to predict only day power generation with an error range of 4.38% to 31.01%. Deep learning neural networks (NNs) are also suggested for prediction and modeling. Because of the potential to maintain prior time-series data employing the memory architecture, the long short-term memory (LSTM) technique was used to predict PV power generation [18]. When applied to 21 examined PV plants, LSTM and auto-encoders proved more efficient in power prediction than multi-layer perceptron and physical prediction approaches [19]. A hybrid approach of fuzzy decision and neural networks was employed to model-predict the photovoltaic-based power generation at two different sites in Mexico [20]. The study conducted at Hermosillo and Mexico City in the Sonora State of Mexico proved that the ANFIS method provides more accurate results than the conventional statistical methods.
A case study was undertaken by Nguyen et al. [21] to predict the energy production from a large solar plant using LSTM. The uncertainty factors and weather forecasts were considered to anticipate power production. The study recommended ideal settings for the LSTM model to model-predict the power output of a giant solar power facility in Vietnam, which has four 100-unit nodes in hidden layers. The research also developed a realistic approach for projecting the short-term production of a large-scale PV facility using meteorological prediction data from any commercial supplier. Various types of neural networks were examined to model-predict the fault diagnosis system in PV installations by Khelil et al. [22]. Five types of neural networks were analyzed: probabilistic ANN, back-propagation ANN, two radial basis functions, and generalized regression ANN. Precision, selectivity, sensitivity, and speed were all factors in the comparison. The results demonstrate that the probabilistic ANN was the best contender for the assigned task.
A study by Nespoli et al. [23] emphasized that solar radiation measurement was crucial to predict power generation, since the generation depends on the incident solar radiation at the solar PV plant site. Daily solar radiation is estimated using the three ANN models for solar power capacity estimation. A comparative evaluation of these models was implemented based on the performance indexes. Nikodinoska et al. [24] reported that the model’s prediction accuracy could be improved by utilizing a larger number of weather parameters as inputs. Integrating the solar grid with the primary grid is also a key concern. A smart grid’s power energy management is critical for energy circulation, system security, and market economics. One of the most vital issues is the precise and constant forecasting of wind speed for the effective operation and management of wind power output connected to the smart grid. Deep learning methods such as Elman neural networks and extreme learning machines can effectively predict short-term wind speed prediction challenges [25,26]. A summary of notable studies and their outcomes is shown in Table 1.

Table 1.
A summary of AI/ML-based model prediction of solar power generation.
1.2. Research Gap
Most of the above research is concerned with the prediction of solar radiation, prediction of power output, and employing one or two AI approaches in tandem. A comparison of different AI-based model-prediction tools has not been tried in combination with PV plant performance modeling, evaluation, and metrics. To the best of the researchers’ information, the use of three years of real-time PV plant data (power generation and performance ratio) together with the associated highly nonlinear complicated data has not been studied in the existing literature.
1.3. Objective of the Study
This research uses three AI techniques to predict the performance of a PV power plant and compare it with the actual data. The novelty is that three years of actual solar generation data is compared with the performance models of RSM, ANN, and ANFIS. Three significant meteorological parameters (monthly tilted irradiation (MTI), wind speed, and air temperatures) are the input parameters for the above AI techniques. The most critical performance indices like power generation and performance ratio are compared as outputs. The validation using the necessary statistical tools like R, R2, NSCE, MAPE, RMSE, KGE, Theil’s U2, and Taylor’s Diagram makes the work unique compared to related research work. Specifically, the objective of the study is
- To model solar PV plants’ energy yield and performance ratio (PR) using various AI techniques;
- To compare the AI predicted value with the actual plant performance;
- To validate the performance model with Taylor’s diagram and statistical tools.
2. Artificial Intelligence Tools: An Overview of RSM, ANN, and ANFIS
2.1. Response Surface Methodology (RSM)
RSM is an amalgamation of statistical and mathematical approaches employed for:
- Designing a series of trials for accurate response prediction;
- Ensuring the selected design fits the data’s hypothesized (empirical) model;
- Determining whether optimal settings for the model’s control parameters results in a threshold response within a domain of interest.
Building a mathematical model of RSM allows one to determine the independent variable that, when changed, results in the responsible variable having an optimal value. RSM uses two models: the first order model, also known as multiple linear regression, and the second-order model, also known as the pure quadratic method [33]. Although RSM-based experimental design is practical in many domains of energy research, it may not be directly related to the system under investigation. A simple mathematical approximation of the response is generated based on the facts. Simpler designs and models are generally simpler to grasp, enhancing their value in real-world situations. The depth and complexity of the successful model are determined by the design chosen. Optimization designs may represent more complex behavior by including higher-order model components, while factorial designs could be used to evaluate linear and interaction effects [13,34].
The RSM modeling is dependent on the actual behavior of a response in such a way that:
wherein, y represents the estimated response being a function of variables combined with a source of variability . Variable values are coded such that their impacts may be compared within the design range:
where, denotes the range of variables, denotes the value of the lowest variable, and the value of the variable under consideration while represents the coded value. A quadratic or cubic value is generally used to approximate y. Suppose the n × 1 vector of response is denoted with y while n × p coded value matrix is denoted with X, and c represents the model coefficient for p × 1 vector. The data matrix can be represented in the following form as Equation (3):
The data matrix so defined is called a design matrix. This design matrix can determine the model vector to reduce the error (residual) in model prediction.
2.2. Artificial Neural Network (ANN)
Artificial neural networks (ANNs) have been helpful in various model prediction applications. The activity of live neural networks is the foundation of ANNs. As a result, they have been claimed to learn in the same manner as humans. An ANN structure generally consists of one input, a few hidden layers, and one output layer [35]. Each layer’s neurons process incoming signals and output results, with their connections weighted. A robust training strategy allows an ANN to readily adapt to any collection of input-output patterns and construct a model function with the least amount of error feasible. The neural network design includes hidden layer connection patterns, activation function choices, and, most significantly, neurons in the hidden layers [36,37]. A typical architecture of ANN is shown in Figure 1.
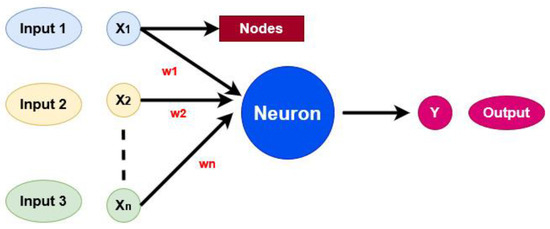
Figure 1.
Representation of an Artificial Neural Network.
According to Rao et al. [38] and Ajbar et al. [39], ANN models have the following characteristics:
To develop new information, locate knowledge that is difficult to obtain, primarily through non-linear correlations between variables;
To increase forecast accuracy, a wide range of variables are used;
Using solid procedures and information systems as vital instruments to document activities and data from variables to reproduce high-quality findings. ANN prioritizes flexibility and dynamic adaptability over exact or highly accurate results in model implementations. The common practice in ANN modeling is to offer various study kinds and scopes, analyze prediction factors, and exhibit multiple parts of training techniques, algorithms, and data demands [40].
Neural networks are capable of processing ambiguous or partial input. A neural network’s settings may be changed to accommodate changing situations and needs. ANNs are good at identifying patterns (in images). On the other hand, the conclusion of a neural network involves some ambiguity, which is not always ideal. A neural network must go through a “learning” phase before it can be employed. The data quality in the learning phase significantly impacts the result.
2.3. Adaptive Neuro-Fuzzy Inference System (ANFIS)
Fuzzy logic and ANN are the two components that make up the ANFIS, a hybrid AI technique. The capacity for training and the spatial structure of ANNs are integrated with the decision-making process of fuzzy logic in an application known as ANFIS. Like artificial neural networks, the ANFIS learns by examining examples from a data collection used for training it [41]. As a result, the optimum ANFIS structure for tackling the relevant issue is discovered. The developed structure is put through its paces to observe how it reacts to a new sample dataset. Lower error levels illustrate the ANFIS model’s applicability [42,43]. A representation diagram of ANFIS architecture is shown in Figure 2. The ANFIS architecture is typically comprised of five phases that run every stage of the algorithm’s fuzzy logic and NN.
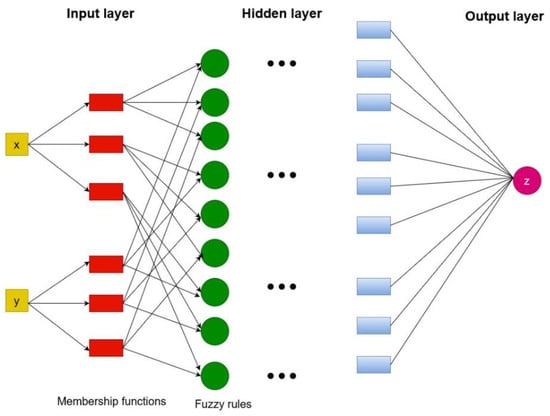
Figure 2.
ANFIS architecture illustrating two inputs and three MFs.
Determine Membership Functions (MFs)
MFs are indicators of the “resemblance” or “levels of membership” of a value. This is often represented as sinusoidal curves with a range of values.
Firing Strength of the Fuzzy Rule
The step 1 input is now transmitted to the node layer and amplified through the power of an automated fuzzy rule. Consider it similar to calculating a “weight” depending on the computerized rule and the data concerned.
Normalize the Calculation of Firing Strength
The third step uses step 2 to change the quality of the firing intensity from the previous node to the aggregate of all firing intensities (See Figure 2). Consider the algorithm contrasting the intensity of a single node’s outcome rule to the intensity of remaining nodes and their underpinning rules. If a node has greater strength, it is most likely the “best viable” rule arrangement for the dataset and will be prioritized for the next step.
Integrate Premises (Self-governing Variables) and Outcomes (Dependent Variable)
In the fourth step, the weighted values are blended with the original inputs from the learning data set to generate an outcome depending on the relevant data (Figure 2).
Prediction and Final Outcome
The last phase oversees all input signals and their implementation to testing data to produce a projected result. De-fuzzing and translating the data to understandable values are also part of this stage.
3. Methodology
3.1. Description of the 2 MWp Solar Plant
2 MW Kuzhalmannam Solar PV Project (Figure 3) is the first Independent Power Producer (IPP) Project developed by the Agency for New and Renewable Energy Research & Technology (ANERT) in the owned site of ANERT at Kuzhalmannam Palakkad district, Kerala, India. The PV Project has completed more than four years of successful operation. So far, it has generated more than 12 million units of electricity for the primary grid since its commissioning on 9 December 2016. The date of Commercial Operation (CoD) of the project is declared as 19 December 2016. ANERT is currently earning monthly revenue from the PV power plant for power generation and contribution sharing with the main grid. The dedicated PV-based power plant also has a Solar Resource Assessment (SRRA) facility, which gathers meteorological data such as relative humidity, solar radiation, wind speed, rain, air pressure, etc. Based on energy-generating data from 2018 and 2019, an energy study of this solar PV power plant indicated that the PV plant has a daily average output of 7422.17 kilowatt-hours (kWh) with a mean Performance ratio (PR) of 73.39 [44]. The weather data from the SRRA station and the operational data of the solar PV plant from SCADA were utilized to model the solar PV plant’s generation for different climate seasons [45]. The technical description of the PV power plant is summarized as shown in Table 2.
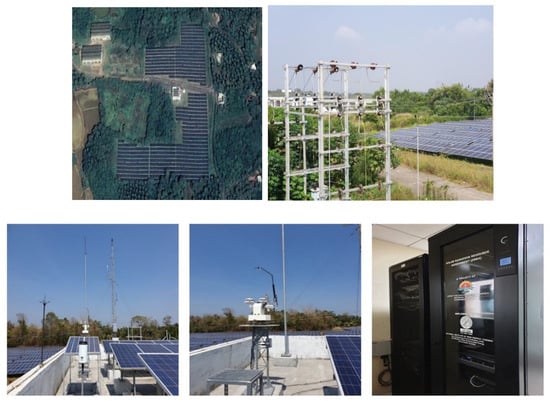
Figure 3.
Google map, photograph, and Dedicated SRRA station of ANERT 2 MW PV Plant at Kuzhalmannam site, Kerala, India.

Table 2.
Technical description of the PV plant.
3.2. Data Collection and Instrumentation
The Supervisory Control and Data Acquisition (SCADA) system, which connects with all inverters and String Monitoring Units, is integrated with the Kuzhalmannam 2 MW solar PV power plant (SMU). The PV Power Plant features an embedded/integrated SCADA system that collects solar irradiance, energy production, wind speed, ambient temperature, and module temperature at regular intervals. The integrated SCADA system also records voltage, current, and power at the output of each inverter and stores the vital operational data of the SPV power plant. The monitoring guidelines of IEC Standard 61724 are followed when recording data (Padmavathi & Daniel, 2013). The data files are saved regularly and can be retrieved as needed. The SCADA system can transfer data between the central computer and remote terminal units. The local utility maintains a smart meter at the connecting point for metering and invoicing and accounts for energy export and import to the grid. The specification of the temperature, sunlight irradiation, and wind speed sensors are shown in Table 3. Solar PV power plant generation data for three years from 2018 to 2020 have been collected from the actual site for modeling and analyzing the performance based on AI tools ANN, ANFIS, and RSM. The 2MW PV Plant Data has been collected through the SCADA output utilizing the following instruments installed at the site as part of the performance assessment of the PV plant:

Table 3.
Technical details of the sensors and SCADA system.
- Pyranometer
- Anemometer
- Temperature Sensor
A simple flowchart depicting the research methodology adopted in the present work is shown in Figure 4.
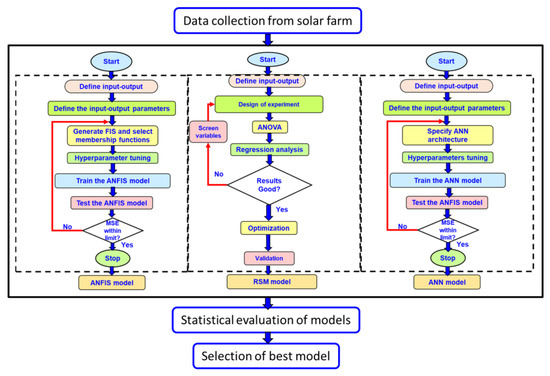
Figure 4.
Flowchart of research methodology.
3.3. Parameter Selection and Modeling
The following input parameters were selected for the study:
Solar radiation: Global Tilted Irradiation is the significant input parameter chosen for the study [46]. The Monthly Tilted Irradiation (MTI) for the study period of 2018, 2019, and 2020 are collected
Wind Speed: Wind speed affects PV plant productivity because it affects the heat transfer from the PV modules, which increases PV process efficiency [5].
Temperature: Outside air temperature affects PV power plant efficiency since air temperature is proportional to the temperature of the module [47].
The following responses are generated as part of the study:
Energy Yield: Energy Yield is the AC output power generated in kWh/MWh from the PV power plant. Cumulative Energy Generation during the month [48]:
Performance Ratio (PR): PR is the ratio of the observed generation with the generation supposedly produced by the PV plant based on its DC nameplate ratings at STC during the period. Performance Ratio (PR) can be calculated by the following equation [49,50]:
where
= Energy Generation
= Power Output of the PV Plant
= Global Tilted Irradiation
= Global Horizontal Irradiation at the Ground Level
3.4. Data Pre-Processing
Examining data before modeling is essential in determining data quality [51]. Figure 5a depicts a correlation heatmap, while Figure 5b depicts the data correlation in the form of a correlation matrix. These two illustrate the Pearson correlation coefficient between input and targets. Pearson correlation results demonstrate a robust correlation (0.9116) between MTI and power generation. This shows that MTI is the most significant influencer for power generation, followed by air temperature (0.4448). Like the performance ratio, the air temperature is the most prominent influencer (0.1747). Figure 5b shows the correlation between the various factors and data distribution. The data analysis during pre-processing shows a substantial correlation among different parameters under consideration.
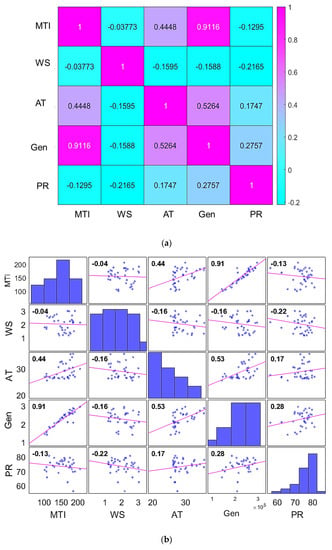
Figure 5.
(a) Data correlation heatmap (b) Correlation matrix.
3.5. Statistical Modeling Appraisal of Predictive Model
The predictive models developed using ANN, RSM, and ANFIS were appraised using statistical methods for their predictive ability. The established statistical indices such as Pearson’s R, coefficient of determination (R2), Nash-Sutcliffe model efficiency (NSCE), root-mean-squared error (RMSE), Mean abs. % error (MAPE), and Kling-Gupta model efficiency (KGE) were used to assess the models. The expression for these statistical indices is shown in Equations (6)–(11) [52,53].
‘R’ depicts the correlation between the forecasted and observed values (Equation (6)). R2 squared is the square of this coefficient, representing the proportion of total variance the regression line can account for, denoted by Equation (9).
‘NSCE’ is a normalized statistic that calculates the relative size of residual variation (“noise”) vs. observed data variance. The NSE value reflects how closely the observed vs. simulated data plot matches the 1:1 line. The NSCE value closer to unity indicates a perfect fit.
The ‘RMSE’ and ‘MAPE’ were employed to estimate the prediction error. One of the most often used methods for measuring prediction quality is ‘RMSE’. It uses Euclidean distance to demonstrate how much forecasts differ from observed actual values. ‘MAPE’ is another popular tool for evaluating prediction accuracy. It represents the forecast’s percentage error in proportion to the real data.
KGE has been used to measure prediction efficiency in a more balanced way compared to NSCE. It combines three main elements i.e., bias, variance, and coefficient of vacation.
wherein ‘n’ represents total elements, ‘i’ denotes the term under consideration, ‘xi’ represents the observed value, ‘yi’ denotes model-projected value, is the average of observed values, is average of predicted values, ‘β’ denotes bias error, ‘α’ denotes error in flow variability, and correlation is shown with ‘R’.
Theil’s statistics
Theil’s statistics were used in this work to assess the predictive models’ uncertainty. For prediction models, Theil suggested two statistical metrics. The first is Theil’s U1, which is used to determine the accuracy of predictions. However, Theil’s U2 (also known as Theil’s U) is a more often used statistical metric for estimating the predictive model’s forecast quality. Theil’s U2 is an assortment of mean residuals and error differences between measured and predicted values [54]. It offers a varied range of standardized measures combined with a lower weight (near to 0), suggesting a higher level of prediction quality. Theil’s U2 was measured with the following expression:
Taylor’s diagram
The degree of correlation between model-projected and observed data can be summarized using the Taylor diagram [55]. In this graph, a single data point on a 2-D graph represents the coefficient correlation, root-mean-square (RMS) variance between the two data fields and the proportion of standard deviations between the two data fields. When these data are combined, they provide a quick summary of the degree of sequence consistency, allowing one to judge whether a model resembles the natural mechanism. The graph helps to evaluate the relative benefits of competing models and track overall performance as a model evolves [4,56].
4. Results and Discussion
Three established techniques-based machine learning modeling systems were used in the present work for predictive power generation and performance ratio modeling. The data for the modeling was obtained from an operational 2 MWp solar PV plant installed in Kerala, India. The information was collected month-wise and was highly nonlinear due to unpredictable weather in that area. Three major control factors (inputs) were chosen: monthly tilted irradiation, wind speed, and air temperature.
4.1. RSM-Based Modeling
In the first phase, the three-year data was used for model prediction using RSM. The RSM modeling process comprises the following steps:
- (i)
- Defining the control factors (input) and response variables (output);
- (ii)
- Preparation of design matrix;
- (iii)
- Analysis of variations (ANOVA);
- (iv)
- Development of the mathematical function of the model;
- (v)
- Model prediction;
- (vi)
- Statistical analysis of data.
In the present problem, the monthly tilted irradiation (MTI) in kWh/m2, WS in m/s, and the temperature of air temperature (AT) in °C were chosen as input (control factors). In contrast, power generation (PG) in kWh and performance ratio (PR) were designated as outputs. The proposed design matrix was loaded with month-wise performance data from a 2 MWp solar plant installed at Kuzalmanan, Kerala, India. The design matrix is presented in Table 4.

Table 4.
Design array for RSM modeling.
4.1.1. RSM Model for Power Generation
The design matrix listed in Table 4, containing three control factors and two response variables, was used for RSM-based model development. The ANOVA of the data was carried out to recognize substantial values amongst input data with resulting responses. Also, the statistical variables like R2, Adjusted R2, the F-test, and the probability index must be evaluated to find if the proposed model is well-suited to the test results. The higher the F-value and the lower the P-value, the more relevant the matching term in the proposed response correlation is; hence, a test value of ‘P’ lower than 0.05 is deemed substantial [57]. The outcomes of ANOVA are listed in Table 5.

Table 5.
ANOVA of power generation data.
The F-value of the model is 45.69, indicat the model is statistically substantial. B2, A2B, AB2, B2C, C3 are important model terms in this scenario. The model terms are not necessary if the value is more significant than 0.1000. The prediction model in the form of mathematical equations was generated. The developed model in a cubic equation is presented as Equation (13).
where MTI represents monthly tilted irradiation, WS represents wind speed, and AT represents air temperature. The model was used for prediction at all experimental run settings. The observed and predicted power generation values are illustrated as a comparative graph in Figure 6a. The RSM-based modeling of power generation was successful in generating easy mathematical equations. High R and coefficient of determination values as 0.9986 and 0.9773 were achieved during regression, indicating a high degree of correlation. The MAPE was 2.24%, while the RMSE was 6133.93 (on account of large data values). The mean absolute percentage error (MAPE) was only 2.24%, while Kling-Gupta’s efficiency was 0.9847. The Nash-Sutcliffe efficiency (NSCE) is as high as 0.9774.
Power generation = −1.33 × 10⁷ + 41293.79*MTI + 9.11 × 10⁵*WS + 1.047 × 10⁶*AT − 18753.13*MTI*WS + 1439.10*MTI*AT + 44481.45*WS*AT − 285.73*MTI2 − 58701.22*WS2 − 38884.27*AT2 + 22.26*MTI2*WS + 4.69*MTI2*AT + 2768.79*MTI*WS2 − 46.27*MTI*AT2 − 9699*WS2*AT + 0.209*MTI3 − 16595.39*WS3 + 491.80*AT3
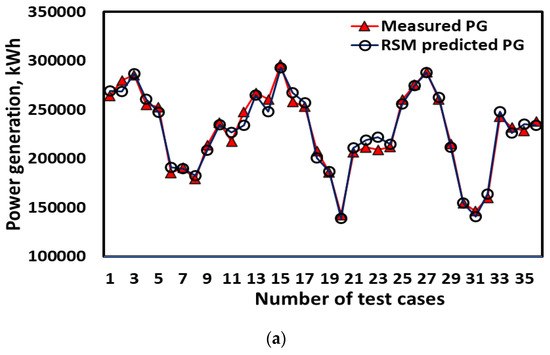
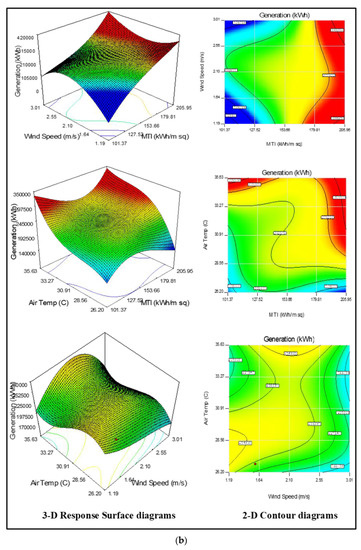
Figure 6.
(a) Measured vs. RSM predicted power generation. (b) 3-D Response surface diagrams and 2-D contours for power generation.
Theil’s U2 was 0.1653, indicating minimal uncertainty of the prediction model. Low errors and good prediction effectiveness establish a robust prognostic model. The interaction of various inputs and their effects are shown as 3-D response surfaces and 2-D contour diagrams in Figure 6b. It is observed that at lower MTI, power generation initially increases with an increase in wind speed but then decreases. The trend is reversed at the higher MTI range as the power generation first decreases but again increases at higher wind speed, but the rate of change is slightly subdued in the higher MTI range. On the other hand, the air temperature positively affects the entire range of operations.
4.1.2. RSM Model for Performance Ratio
The predictive model of PR was also developed using the performance data of three consecutive years obtained from a 2 MWp solar plant. The design matrix and the outcomes of ANOVA are listed below (Table 6):

Table 6.
ANOVA of performance ratio data.
The F-value of the model as 11.86 indicates that the model is statistically substantial. A, C, BC, B2, A2B, A2C, AB2, AC2, B2C, A3, B3, C3 are important PR models. The model terms are not important if the value is larger than 0.1000. The prediction model as a mathematical equation was generated. The established model in the cubic equation is presented as Equation (14).
Sqrt(PR) = −248.88 + 0.755*MTI + 18.66*WS + 20.22*AT − 0.37*MTI*WS + 0.0299*MTI*AT + 0.83*WS*AT − 5.54 × 10⁻³*MTI2 − 0.92*WS2 − 0.757*AT2 + 4.17 × 10⁻⁴*MTI2*WS +9.47 × 10⁻⁵*MTI2*AT + 0.057*MTI*WS2 − 9.55 × 10⁻⁴*MTI*AT2 − 0.18215*WS2*AT +3.86 × 10⁻⁶*MTI3 − 0.465*WS3 + 9.69 × 10⁻³*AT3
MTI represents monthly tilted irradiation, WS represents wind speed, and AT represents air temperature.
All experimental run settings were utilized for model-based forecasts. Table 6 shows the predicted results of PR. In Figure 7a, a comparison graph depicts the observed and projected levels of PR. The RSM-based modeling of PR resulted in simple mathematical equations. During regression, high R and R2 values as high as 0.9346 and 0.8735 were obtained, suggesting a high degree of correlation. The MAPE and RMSE were low at 2.05% and 1.85, respectively. The superior values of KGE and NSCE were 0.9175 and 0.8738, respectively. The prediction uncertainty of the RSM-based model was evaluated with Theil’s U2, 0.3343. The low errors and high predictive efficiency establish the model as an efficient predictive model for PR. The developed model is shown in 3-D response surfaces and 2-D contour diagrams. It also helps understand the interactions of various inputs and their effects on the output, as illustrated in Figure 7b. It was noted that the PR augments on a higher MTI rate while the PR peaks at the mid-range of wind speed. A combination of high air temperature and high wind speed improves the PR.
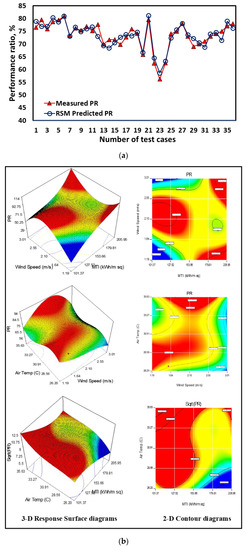
Figure 7.
(a) Measured vs. RSM predicted performance ratio and (b) 3-D Response surface diagrams and 2-D contours for performance ratio.
4.2. ANN-Based Modeling
ANN was used for the model prediction of power generation and performance ratio of a 2 MWp solar plant. The performance data collected for three consecutive years was used in model development. The proposed neural network utilized in the present study is shown in Figure 8a. The model’s proposed architecture is shown in Figure 8b. ANN has the inherent ability to model multi-input and multi-output problems. The input parameters in this study were MTI (kWh/m2), WS (m/s), and AT (oC), while the output parameters were PG (kWh) and PR (%). The output parameters in this study were predicted by employing a feed-forward NN. The present work uses a multilayer feed-forward NN comprising one input layer with three neurons, and one hidden layer with ten neurons, while the output layer has two neurons representing two outputs. During training, the count of neurons in the hidden layer was estimated through trial and error, and the count of neurons with the lowest mean squared error (MSE) was chosen.
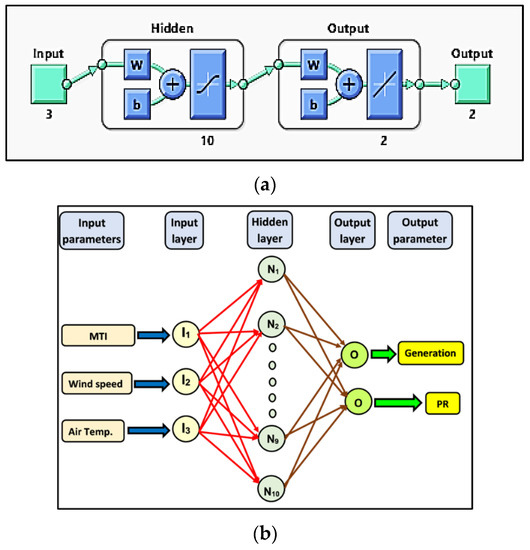
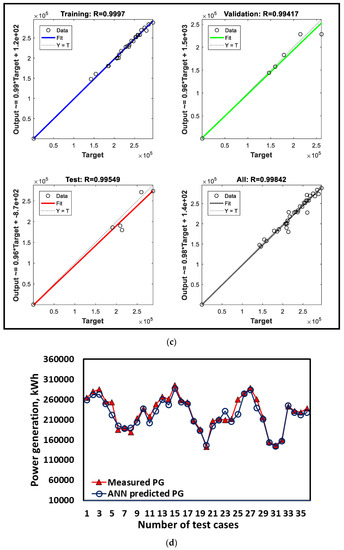
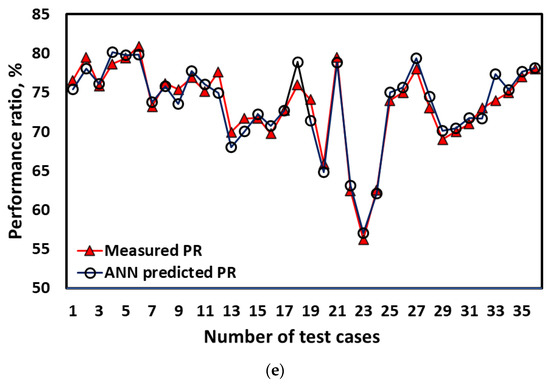
Figure 8.
(a) ANN network; (b) proposed ANN model’s architecture; (c) regression coefficient for ANN model; (d) comparison of measured and ANN-predicted power generation; (e) comparison of measured and ANN-predicted performance ratio.
The data were arbitrarily partitioned into three parts; the most considerable (70%) portion was used for model training, and 15% was used for authentication and testing. The Levenberg-Marquardt (trainlm) function was employed in training as it has the combined advantage of the Gauss-Newton method and the steepest descent technique; it has the rapidity of the Gauss-Newton technique and the steadiness of the most vertical descent method. The trainlm procedure converges significantly quicker than the first-order gradient approach because it uses the estimated second-order derivative. The model’s performance was measured using the MSE scale, with the constraint that the model’s performance should be as near to zero as possible.
The outcome of regression coefficients (R) during authentication and testing are illustrated in Figure 8c. The R was observed to be 0.9997 during training, 0.9941 during validation, and 0.9954 during testing. The developed model was subsequently used for model prediction. The comparative graph training depicting measured and model-predicted power generation is illustrated in Figure 8d. Also, the comparative evaluation of measured and ANN forecasted performance ratios is shown in Figure 8e. R for the power generation model was 0.9679, and R2 was 0.9369, suggesting a high correlation between observed and ANN-predicted data. Similarly, in the case of the PR model, the R and R2 values were 0.9963 and 0.9337, correspondingly. The MAPE, NSCE, and KGE for electricity generation are 3.77 percent, 0.9128 percent, and 0.9096 percent, respectively. In PR, the MAPE, NSCE, and KGE are 1.5 percent, 0.9317, and 0.9638, respectively. Theil’s U2 was utilized to calculate the prediction uncertainty of the model. The power generation model yielded a result of 0.325, while the performance ratio yielded a result of 0.245. These statistical indices exhibiting low error and high predictive efficiency establish the developed ANN model as a robust prognostic model [58].
4.3. ANFIS-Based Modeling
The present work used three inputs with one output variable to build a multiple-input single-outcome (MISO) fuzzy model for predicting power production from a solar-based PV plant. The suggested ANFIS model’s architecture for the present study is illustrated in Figure 9. It comprises five stages: fuzzification, the product, the rule/normalization, defuzzification, and global output summing. The first order Sugeno model was employed for this study, which contains three input variables using Sugeno’s and Takagi’s fuzzy IF-THEN rules. The suggested input selection approach is based on the concept that the ANFIS model with the lowest RMSE (root mean squared error) after an epoch of training has a higher potential for reaching a lower RMSE when given additional training epochs. This assumption is heuristically sound.
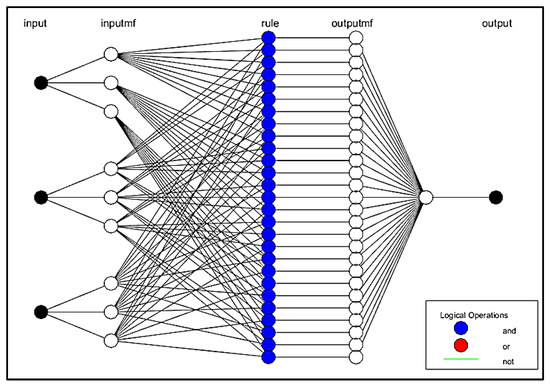
Figure 9.
ANFIS architecture for model development.
All of the nodes in the first layer were adaptive and had a troika of input variables. This base layer contains a node function for each node. The product layer (second layer) has no adaptive nodes. It combines all inward signals to assess each membership function’s weight (MF). Each node’s output corresponds to the weight of the rule’s firing strength. Each node in the third layer (the normalization or layer) evaluates each rule for activation level to perform the preconditioned matching of the fuzzy rules. To acquire the output, the defuzzification layer (fourth layer) is utilized to de-fuzzify MFs. This study used the centroid defuzzification approach to determine the region’s centroid beneath the MFs. This layer’s (product layer’s) nodes are all adaptable. The fifth layer is non-adaptive, containing a single node since it is the sum of total outcomes for inwards signals from the defuzzification layer [41].
4.3.1. ANFIS Model for Power Generation
The performance data collected from the solar plant was used for model development using the ANFIS approach. It was utilized to establish the relationship between MTI, WS, and AT with performance parameters, viz., power generation. The complete experimental dataset was explicitly divided into two parts training and validation datasets. Hence, 70% of the overall testing results were randomly selected for training, while the remaining data was used to investigate the performance of the ANFIS-based model created. For the creation of the designated ANFIS model, MATLAB 2016 is used. The grid partitioning approach constructed the Sugeno-based FIS structure to link the input components and output responses based on particular framed rules [7]. The neuro-fuzzy algorithm was optimally trained using the hybrid learning technique. The proposed ANFIS multi-input single-output (MISO) model for power generation is illustrated in Figure 10a.
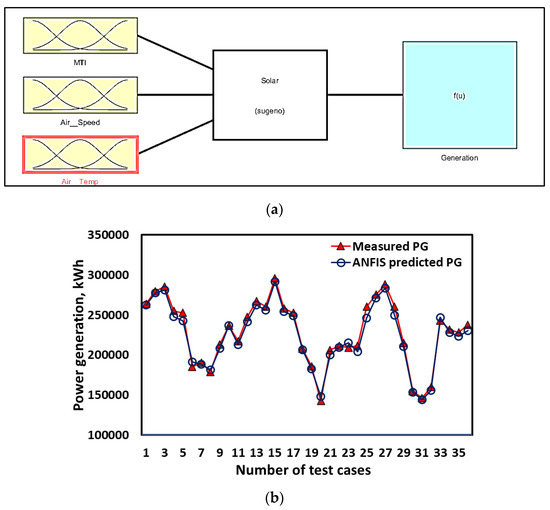
Figure 10.
(a) Proposed ANFIS-based MISO model for power generation; (b) measured vs. ANFIS-predicted power generation.
This step was used to obtain the expected output from the fuzzy rules. A comparative graph between measured and ANFIS-predicted power generation is shown in Figure 10b. The ANFIS model was evaluated using statistical indices for its predictive efficiency and possible errors. During regression, R besides R2 values were high at 0.9950 and 0.9901, suggesting a higher level of correlation. The MAPE and RMSE were low at 2.09% and 5492.81, respectively. The high value of RMSE is attributed to handling large-value numbers in modeling. The predictive efficiency of the model was estimated with KGE and NSCE; they were 0.9828 and 0.956, respectively. The uncertainty in ANFIS based model was evaluated using Theil’s U2, and it was on the lower side of 0.1506. The high predictive efficiency and low errors proved the model robust and efficient for power generation.
4.3.2. ANFIS Model for Performance Ratio
The solar plant’s performance data was utilized to construct an ANFIS-based model using a hybrid technique of fuzzy and neural networks. MTI, WS, and AT were chosen as input parameters, while PR was selected as an output parameter. Figure 11a shows that a MISO neuro-fuzzy model was utilized to simulate PR. The comparative graph between measured and ANFIS-predicted power generation is shown in Figure 11b.
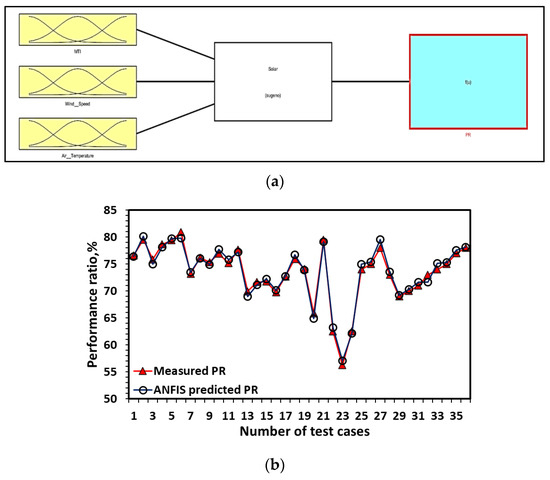
Figure 11.
(a) Projected ANFIS-based MISO model for performance ratio; (b) comparison of measured and ANFIS-predicted PR.
The predictive model developed using ANFIS was evaluated using statistical indices for its predictive efficiency and prediction errors. The results of the statistical evaluation are listed in Table 7. A good value of R and R2 as 0.9915 & 0.9830 indicates a good association quality. On the error front, the MAPE and RMSE were low at 0.8% and 0.6898, respectively. The model’s predictive efficiency was measured with KGE and NSCE, which were 0.9917 and 0.9837, respectively. The uncertainty in ANFIS based model was estimated using Theil’s U2, which was 0.1259. The excellent predictive efficiency and negligible errors establish the ANFIS-based model as an efficient model for PR.

Table 7.
Statistical measures and uncertainty of models.
4.4. Comparison of RSM, ANN, and ANFIS Based on Statistical Indices and Taylor’s Diagram
The predictive power generation and PR model developed using RSM, ANN, and ANFIS successfully forecasted the output at a high degree of correlation. However, their efficiency and ability to predict were not equal in the present study. The models were evaluated using different statistical indices, viz., R, R2, MAPE, RMSE, NSCE, and KGE. The models were also assessed for their predictive uncertainty (Table 7). The outcomes of the model evaluation are listed in Table 8.

Table 8.
Measured and modeled predicted outputs.
The Taylor diagrams for performance ratio and power generation are illustrated in Figure 12. The ANFIS model performs better than the ANN and RSM models in predicting performance ratio. The ANFIS model point is closer to the baseline than ANN and RSM models. Similarly, in the case of power generation, the ANFIS model performs better than ANN and RSM models. Hence, it can be concluded that ANFIS based predictive model is the most suitable among these three models (ANFIS, ANN, and RSM) for performance mapping and model prediction of solar power plants.
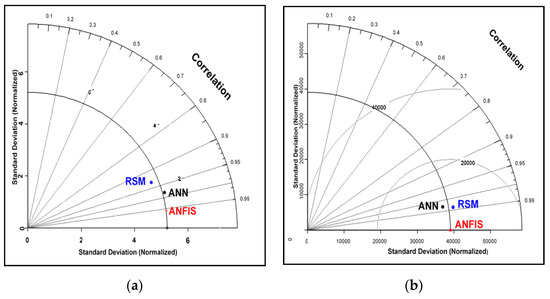
Figure 12.
Taylor diagram for (a) performance ratio and (b) power generation.
Among the various AI techniques, the prediction by ANFIS matches very closely, matching the PV plant’s actual performance as proven by the different statistical models.
5. Conclusions
This study investigates the feasibility of applying AI techniques to construct a prediction model for the yearly energy output and performance ratio of a solar PV facility. To that end, AI approaches such as RSM, ANFIS, and ANN were examined. The investigation was conducted on an actual functioning 2 MWp grid-connected solar Photovoltaic plant erected at the Kuzalmannan location in Kerala, India. Meteorological data such as solar irradiance, temperature, wind speed, and matching PV production were collected for model training, testing, and validation over three years. To determine the most accurate prediction model, statistical indices such as Pearson’s R, coefficient of determination (R2), Nash-Sutcliffe efficiency (NSCE), root-mean-squared error (RMSE), mean absolute-percentage error (MAPE), Kling-Gupta efficiency (KGE), and Taylor’s diagram were used. The following are the main outcomes of the present study:
The remarkable advantage of AI-based techniques in handling extensive solar plant design and performance optimization data is demonstrated.
Compared with different AI techniques, the results show that ANFIS is the most accurate prediction model, with the highest value of R2 at 0.9901, NSCE at 0.9828, and KGE at 0.956. The uncertainty in ANFIS-based model prediction was only 0.1506, indicating a robust predictive model.
The ANN-based prediction was marginally inferior to ANFIS as R2 was 0.9369, NSCE was 0.9128, and KGE was 0.9096. The uncertainty in ANFIS-based model prediction was 0.325, indicating a comparable prediction model.
The RSM and ANOVA facilitated the development of correlation expression for performance ratio and power generation. Taylor’s diagrams were employed to compare the model’s output visually.
Since solar generation is intermittent, forecasting solar performance is very important. Precise solar generation forecasting using AI tools can provide helpful information for load dispatch centers and power scheduling from other sources for electrical utilities or electricity generation applications. It is hoped that the data-driven models will be attractive to solar PV plant developers and policymakers.
However, advanced study and validation are needed for PV plants installed in different climate zones. Future work could be oriented toward the development of an advanced machine learning algorithm for solar power prediction. It might be of even more value if machine learning could predict the performance degradation over the plant life.
Author Contributions
Conceptualization, K.S. and P.S.; methodology, W.K.N.; software, P.S.; validation, E.C.; formal analysis, E.C.; investigation, K.S.; resources, I.K.; data curation, A.G., P.S.; writing—original draft preparation, A.G.; writing—review and editing, P.S., K.S.; visualization, P.S.; supervision, K.S., W.K.N.; project administration, E.C.; funding acquisition, K.S., I.K. All authors have read and agreed to the published version of the manuscript.
Funding
The authors are grateful for the financial support of the Universiti Malaysia Pahang (www.ump.edu.my) through grant PGRS210349. The authors are also thankful to the Russian Science Foundation grant no. 22-19-20011 support of South Ural state university.
Data Availability Statement
No new data were created or analyzed in this study. Data sharing is not applicable to this article.
Conflicts of Interest
The authors declare no conflict of interest.
References
- Khan, N.; Sudhakar, K.; Mamat, R. Role of Biofuels in Energy Transition, Green Economy and Carbon Neutrality. Sustainability 2021, 13, 12374. [Google Scholar] [CrossRef]
- Bishoyi, D.; Sudhakar, K. Modeling and performance simulation of 100 MW LFR based solar thermal power plant in Udaipur India. Resour. Technol. 2017, 3, 365–377. [Google Scholar] [CrossRef]
- Solomin, E.; Sirotkin, E.; Cuce, E.; Selvanathan, S.; Kumarasamy, S. Hybrid Floating Solar Plant Designs: A Review. Energies 2021, 14, 2751. [Google Scholar] [CrossRef]
- Gholami, H.; Mohamadifar, A.; Sorooshian, A.; Jansen, J.D. Machine-learning algorithms for predicting land susceptibility to dust emissions: The case of the Jazmurian Basin, Iran. Atmos. Pollut. Res. 2020, 11, 1303–1315. [Google Scholar] [CrossRef]
- Gopi, A.; Sudhakar, K.; Keng, N.W.; Krishnan, A.R.; Priya, S.S. Performance Modeling of the Weather Impact on a Utility-Scale PV Power Plant in a Tropical Region. Int. J. Photoenergy 2021, 2021, 5551014. [Google Scholar] [CrossRef]
- Sabzehgar, R.; Amirhosseini, D.Z.; Rasouli, M. Solar power forecast for a residential smart microgrid based on numerical weather predictions using artificial intelligence methods. J. Build. Eng. 2020, 32, 101629. [Google Scholar] [CrossRef]
- Adedeji, P.A.; Akinlabi, S.A.; Madushele, N.; Olatunji, O.O. Neuro-fuzzy resource forecast in site suitability assessment for wind and solar energy: A mini review. J. Clean. Prod. 2020, 269, 122104. [Google Scholar] [CrossRef]
- Ahmad, T.; Zhang, D.; Huang, C.; Zhang, H.; Dai, N.; Song, Y.; Chen, H. Artificial intelligence in sustainable energy industry: Status Quo, challenges and opportunities. J. Clean. Prod. 2021, 289, 125834. [Google Scholar] [CrossRef]
- Moreira, M.; Balestrassi, P.; Paiva, A.; Ribeiro, P.; Bonatto, B. Design of experiments using artificial neural network ensemble for photovoltaic generation forecasting. Renew. Sustain. Energy Rev. 2020, 135, 110450. [Google Scholar] [CrossRef]
- Shuvho, B.A.; Chowdhury, M.A.; Ahmed, S.; Kashem, M.A. Prediction of solar irradiation and performance evaluation of grid connected solar 80KWp PV plant in Bangladesh. Energy Rep. 2019, 5, 714–722. [Google Scholar] [CrossRef]
- Awan, A.B.; Zubair, M.; Mouli, K.V.C. Design, optimization and performance comparison of solar tower and photovoltaic power plants. Energy 2020, 199, 117450. [Google Scholar] [CrossRef]
- Dao, L.; Ferrarini, L.; La Carrubba, D. Improving Solar and PV Power Prediction with Ensemble Methods. IFAC-PapersOnLine 2020, 53, 12829–12834. [Google Scholar] [CrossRef]
- Ren, H.; Ma, Z.; Li, W.; Tyagi, V.; Pandey, A. Optimisation of a renewable cooling and heating system using an integer-based genetic algorithm, response surface method and life cycle analysis. Energy Convers. Manag. 2021, 230, 113797. [Google Scholar] [CrossRef]
- Shi, J.; Lee, W.-J.; Liu, Y.; Yang, Y.; Wang, P. Forecasting Power Output of Photovoltaic Systems Based on Weather Classification and Support Vector Machines. IEEE Trans. Ind. Appl. 2012, 48, 1064–1069. [Google Scholar] [CrossRef]
- Kazemian, A.; Khatibi, M.; Maadi, S.R.; Ma, T. Performance optimization of a nanofluid-based photovoltaic thermal system integrated with nano-enhanced phase change material. Appl. Energy 2021, 295, 116859. [Google Scholar] [CrossRef]
- Naderloo, L. Prediction of solar radiation on the horizon using neural network methods, ANFIS and RSM (case study: Sarpol-e-Zahab Township, Iran). J. Earth Syst. Sci. 2020, 129, 148. [Google Scholar] [CrossRef]
- Jiang, H.; Hong, L. Application of BP Neural Network to Short-Term-Ahead Generating Power Forecasting for PV System. Adv. Mater. Res. 2012, 608–609, 128–132. [Google Scholar] [CrossRef]
- Mosavi, A.; Salimi, M.; Ardabili, S.F.; Rabczuk, T.; Shamshirband, S.; Varkonyi-Koczy, A.R. State of the Art of Machine Learning Models in Energy Systems, a Systematic Review. Energies 2019, 12, 1301. [Google Scholar] [CrossRef]
- Gensler, A.; Henze, J.; Sick, B.; Raabe, N. Deep Learning for solar power forecasting—An approach using AutoEncoder and LSTM Neural Networks. In Proceedings of the 2016 IEEE International Conference, Systems, Man, and Cybernetics (SMC), Budapest, Hungary, 9 October 2016; pp. 2858–2865. [Google Scholar] [CrossRef]
- Pitalúa-Díaz, N.; Arellano-Valmaña, F.; Ruz-Hernandez, J.A.; Matsumoto, Y.; Alazki, H.; Herrera-López, E.J.; Hinojosa-Palafox, J.F.; García-Juárez, A.; Pérez-Enciso, R.A.; Velázquez-Contreras, E.F. An ANFIS-Based Modeling Comparison Study for Photovoltaic Power at Different Geographical Places in Mexico. Energies 2019, 12, 2662. [Google Scholar] [CrossRef]
- Nguyen, N.Q.; Bui, L.D.; Van Doan, B.; Sanseverino, E.R.; Di Cara, D.; Nguyen, Q.D. A new method for forecasting energy output of a large-scale solar power plant based on long short-term memory networks a case study in Vietnam. Electr. Power Syst. Res. 2021, 199, 107427. [Google Scholar] [CrossRef]
- Khelil, C.K.M.; Amrouche, B.; Kara, K.; Chouder, A. The impact of the ANN’s choice on PV systems diagnosis quality. Energy Convers. Manag. 2021, 240, 114278. [Google Scholar] [CrossRef]
- Nespoli, A.; Niccolai, A.; Ogliari, E.; Perego, G.; Collino, E.; Ronzio, D. Machine Learning techniques for solar irradiation nowcasting: Cloud type classification forecast through satellite data and imagery. Appl. Energy 2021, 305, 117834. [Google Scholar] [CrossRef]
- Nikodinoska, D.; Käso, M.; Müsgens, F. Solar and wind power generation forecasts using elastic net in time-varying forecast combinations. Appl. Energy 2021, 306, 117983. [Google Scholar] [CrossRef]
- Zhao, F.; Zeng, G.-Q.; Lu, K.-D. EnLSTM-WPEO: Short-Term Traffic Flow Prediction by Ensemble LSTM, NNCT Weight Integration, and Population Extremal Optimization. IEEE Trans. Veh. Technol. 2019, 69, 101–113. [Google Scholar] [CrossRef]
- Chen, M.-R.; Zeng, G.-Q.; Lu, K.-D.; Weng, J. A Two-Layer Nonlinear Combination Method for Short-Term Wind Speed Prediction Based on ELM, ENN, and LSTM. IEEE Internet Things J. 2019, 6, 6997–7010. [Google Scholar] [CrossRef]
- Sharadga, H.; Hajimirza, S.; Balog, R.S. Time series forecasting of solar power generation for large-scale photovoltaic plants. Renew. Energy 2019, 150, 797–807. [Google Scholar] [CrossRef]
- Mandal, P.; Madhira, S.T.S.; Haque, A.U.; Meng, J.; Pineda, R.L. Forecasting Power Output of Solar Photovoltaic System Using Wavelet Transform and Artificial Intelligence Techniques. Procedia Comput. Sci. 2012, 12, 332–337. [Google Scholar] [CrossRef]
- Fentis, A.; Rafik, M.; Bahatti, L.; Bouattane, O.; Mestari, M. Data driven approach to forecast the next day aggregate production of scattered small rooftop solar photovoltaic systems without meteorological parameters. Energy Rep. 2022, 8, 3221–3233. [Google Scholar] [CrossRef]
- Ma, H.; Zhang, C.; Peng, T.; Nazir, M.S.; Li, Y. An integrated framework of gated recurrent unit based on improved sine cosine algorithm for photovoltaic power forecasting. Energy 2022, 256, 124650. [Google Scholar] [CrossRef]
- Yang, M.; Zhao, M.; Huang, D.; Su, X. A composite framework for photovoltaic day-ahead power prediction based on dual clustering of dynamic time warping distance and deep autoencoder. Renew. Energy 2022, 194, 659–673. [Google Scholar] [CrossRef]
- Agga, A.; Abbou, A.; Labbadi, M.; El Houm, Y.; Ali, I.H.O. CNN-LSTM: An efficient hybrid deep learning architecture for predicting short-term photovoltaic power production. Electr. Power Syst. Res. 2022, 208, 107908. [Google Scholar] [CrossRef]
- Ahmed, R.; Sreeram, V.; Mishra, Y.; Arif, M. A review and evaluation of the state-of-the-art in PV solar power forecasting: Techniques and optimization. Renew. Sustain. Energy Rev. 2020, 124, 109792. [Google Scholar] [CrossRef]
- Sharma, P.; Sharma, A.K. Application of Response Surface Methodology for Optimization of Fuel Injection Parameters of a Dual Fuel Engine Fuelled with Producer Gas-Biodiesel blends. Energy Sources Part A Recover. Util. Environ. Eff. 2021, 1–18. [Google Scholar] [CrossRef]
- Ghritlahre, H.K.; Chandrakar, P.; Ahmad, A. Application of ANN model to predict the performance of solar air heater using relevant input parameters. Sustain. Energy Technol. Assessments 2020, 40, 100764. [Google Scholar] [CrossRef]
- Sharma, P. Artificial intelligence-based model prediction of biodiesel-fueled engine performance and emission characteristics: A comparative evaluation of gene expression programming and artificial neural network. Heat Transf. 2021, 50, 5563–5587. [Google Scholar] [CrossRef]
- Fathi, M.; Parian, J.A. Intelligent MPPT for photovoltaic panels using a novel fuzzy logic and artificial neural networks based on evolutionary algorithms. Energy Rep. 2021, 7, 1338–1348. [Google Scholar] [CrossRef]
- Premalatha, M.; Naveen, C. Analysis of different combinations of meteorological parameters in predicting the horizontal global solar radiation with ANN approach: A case study. Renew. Sustain. Energy Rev. 2018, 91, 248–258. [Google Scholar] [CrossRef]
- Ajbar, W.; Parrales, A.; Huicochea, A.; Hernández, J. Different ways to improve parabolic trough solar collectors’ performance over the last four decades and their applications: A comprehensive review. Renew. Sustain. Energy Rev. 2022, 156, 111947. [Google Scholar] [CrossRef]
- Barthwal, M.; Rakshit, D. Artificial neural network coupled building-integrated photovoltaic thermal system for indian montane climate. Energy Convers. Manag. 2021, 244, 114488. [Google Scholar] [CrossRef]
- Shafieian, A.; Parastvand, H.; Khiadani, M. Comparative and performative investigation of various data-based and conventional theoretical methods for modelling heat pipe solar collectors. Sol. Energy 2020, 198, 212–223. [Google Scholar] [CrossRef]
- dos Santos, C.M.; Escobedo, J.F.; de Souza, A.; da Silva, M.B.P.; Aristone, F. Prediction of solar direct beam transmittance derived from global irradiation and sunshine duration using anfis. Int. J. Hydrogen Energy 2021, 46, 27905–27921. [Google Scholar] [CrossRef]
- Tao, H.; Ewees, A.A.; Al-Sulttani, A.O.; Beyaztas, U.; Hameed, M.M.; Salih, S.Q.; Armanuos, A.M.; Al-Ansari, N.; Voyant, C.; Shahid, S.; et al. Global solar radiation prediction over North Dakota using air temperature: Development of novel hybrid intelligence model. Energy Rep. 2020, 7, 136–157. [Google Scholar] [CrossRef]
- Gopi, A.; Sudhakar, K.; Keng, N.W.; Krishnan, A.R. Comparison of normal and weather corrected performance ratio of photovoltaic solar plants in hot and cold climates. Energy Sustain. Dev. 2021, 65, 53–62. [Google Scholar] [CrossRef]
- Gopi, A.; Sudhakar, K.; Ngui, W.; Kirpichnikova, I.; Cuce, E. Energy analysis of utility-scale PV plant in the rain-dominated tropical monsoon climates. Case Stud. Therm. Eng. 2021, 26, 101123. [Google Scholar] [CrossRef]
- Kumar, B.S.; Sudhakar, K. Performance evaluation of 10 MW grid connected solar photovoltaic power plant in India. Energy Rep. 2015, 1, 184–192. [Google Scholar] [CrossRef]
- Sukumaran, S.; Sudhakar, K. Fully solar powered Raja Bhoj International Airport: A feasibility study. Resour. Technol. 2017, 3, 309–316. [Google Scholar] [CrossRef]
- Dabou, R.; Bouchafaa, F.; Arab, A.H.; Bouraiou, A.; Draou, M.D.; Necaibia, A.; Mostefaoui, M. Monitoring and performance analysis of grid connected photovoltaic under different climatic conditions in south Algeria. Energy Convers. Manag. 2016, 130, 200–206. [Google Scholar] [CrossRef]
- Rehman, H.U.; Korvola, T.; Abdurafikov, R.; Laakko, T.; Hasan, A.; Reda, F. Data analysis of a monitored building using machine learning and optimization of integrated photovoltaic panel, battery and electric vehicles in a Central European climatic condition. Energy Convers. Manag. 2020, 221, 113206. [Google Scholar] [CrossRef]
- Dierauf, T.; Growitz, A.; Kurtz, S.; Hansen, C. Weather-Corrected Performance Ratio. Technical Report. NREL/TP-5200-57991. 2013; pp. 1–16. Available online: https://www.google.com.hk/url?sa=t&rct=j&q=&esrc=s&source=web&cd=&cad=rja&uact=8&ved=2ahUKEwjjp-qW2bT7AhUkr1YBHTt0C70QFnoECA8QAQ&url=https%3A%2F%2Fwww.nrel.gov%2Fdocs%2Ffy13osti%2F57991.pdf&usg=AOvVaw2fK_WtIl3-KADV9W-86ZWr (accessed on 6 September 2022).
- Sudhakar, K.; Premalatha, M.; Rajesh, M. Large-scale open pond algae biomass yield analysis in India: A case study. Int. J. Sustain. Energy 2011, 33, 304–315. [Google Scholar] [CrossRef]
- Said, Z.; Sharma, P.; Sundar, L.S.; Afzal, A.; Li, C. Synthesis, stability, thermophysical properties and AI approach for predictive modelling of Fe3O4 coated MWCNT hybrid nanofluids. J. Mol. Liq. 2021, 340, 117291. [Google Scholar] [CrossRef]
- Gupta, H.V.; Kling, H. On typical range, sensitivity, and normalization of Mean Squared Error and Nash-Sutcliffe Efficiency type metrics. Water Resour. Res. 2011, 47, 10601. [Google Scholar] [CrossRef]
- Sharma, P. Prediction-Optimization of the Effects of Di-Tert Butyl Peroxide-Biodiesel Blends on Engine Performance and Emissions Using Multi-Objective Response Surface Methodology. J. Energy Resour. Technol. 2021, 144, 1–26. [Google Scholar] [CrossRef]
- Taylor, K.E. Summarizing multiple aspects of model performance in a single diagram. J. Geophys. Res. Atmos. 2001, 106, 7183–7192. [Google Scholar] [CrossRef]
- Simão, M.L.; Videiro, P.M.; Silva, P.B.A.; Assad, L.P.D.F.; Sagrilo, L.V.S. Application of Taylor diagram in the evaluation of joint environmental distributions’ performances. Mar. Syst. Ocean Technol. 2020, 15, 151–159. [Google Scholar] [CrossRef]
- Rejeb, O.; Ghenai, C.; Jomaa, M.H.; Bettayeb, M. Statistical study of a solar nanofluid photovoltaic thermal collector performance using response surface methodology. Case Stud. Therm. Eng. 2020, 21, 100721. [Google Scholar] [CrossRef]
- Nour-Eddine, I.O.; Lahcen, B.; Fahd, O.H.; Amin, B.; Aziz, O. Power forecasting of three silicon-based PV technologies using actual field measurements. Sustain. Energy Technol. Assess. 2020, 43, 100915. [Google Scholar] [CrossRef]
Disclaimer/Publisher’s Note: The statements, opinions and data contained in all publications are solely those of the individual author(s) and contributor(s) and not of MDPI and/or the editor(s). MDPI and/or the editor(s) disclaim responsibility for any injury to people or property resulting from any ideas, methods, instructions or products referred to in the content. |
© 2022 by the authors. Licensee MDPI, Basel, Switzerland. This article is an open access article distributed under the terms and conditions of the Creative Commons Attribution (CC BY) license (https://creativecommons.org/licenses/by/4.0/).