Article

Evaluation of the Laboratory Degradation Performance of a Straw Drainage Board

1
Key Laboratory for Transport Industry of Bridge Detection Reinforcement Technology, Chang’an University, Xi’an 710064, China
2
Zhuhai Communication Group, Zhuhai 519000, China
3
Institute of Geotechnical Engineering, School of Transportation, Southeast University, Nanjing 211189, China
*
Author to whom correspondence should be addressed.
Sustainability 2022, 14(24), 16365; https://doi.org/10.3390/su142416365
Submission received: 31 October 2022 / Revised: 3 December 2022 / Accepted: 5 December 2022 / Published: 7 December 2022

Abstract

:
Plastic drainage boards are installed into the foundation as vertical drainage channels in vacuum preloading projects. After construction, numerous plastic drainage boards are left in the foundation, causing not only white pollution but also potential groundwater contamination. Straw was utilized to produce degradable drainage boards in this study, and the feasibility of straw drainage boards was confirmed by laboratory degradation tests. The results revealed that Zhuhai’s soft marine soil is rich in degrading bacteria such as Bacteroidota and Firmicutes, which have adverse effects on the performance of the straw drainage board. The straw drainage board was deteriorated by bacteria in the foundation, and the discharge capacity and tensile strength dropped with time, with the discharge capacity degradation relationship as qw(t) = qw0(1 − 3.83 × 10⁻⁶t2). The discharge capacity and tensile strength of straw drainage boards are lower than those of plastic drainage boards, but they all meet the engineering requirements. Straw drainage boards can replace plastic drainage boards in vacuum preloading reinforcement projects, which not only solves the problem of environmental pollution but also expands the comprehensive utilization of straw resources in a new way.

1. Introduction

The “Fourteenth Five-Year Plan” states that China will continue to increase investment in infrastructure, which brings new opportunities for the development of soft soil engineering. More and more buildings, highways, railways, airports, and other large projects are being built on soft ground [1,2,3,4] which puts forward higher requirements for the development of vacuum preloading engineering. During construction, drainage boards are inserted into the foundations and water flows out along the drainage boards under vacuum pressure, thus accelerating foundation settlement [5,6]. In China, drainage boards are mostly manufactured from composite plastic, and the inner core plate is made of a polyethylene or polypropylene plastic skeleton; The external filter membrane is of a hot-melt nonwoven geotextile. After construction, the drainage board continues to maintain the drainage channel, which has an adverse effect on post-construction settlement. Moreover, numerous plastic drainage boards are left in the foundation, causing environmental pollution [7,8,9,10]. A degradable drainage board is a vertical drainage made of natural fibre (straw, jute, and coconut) or biodegradable polymeric synthetic materials, which have good engineering properties such as discharge capacity and tensile strength during construction. After construction, the discharge capacity and strength gradually degrade until failure due to the biodegradation of the straw fibres by microorganisms in the soil, as well as the influence of pH, temperature, and humidity. On one hand, it is a more environmentally friendly product compared to plastic drainage boards; on the other hand, the failure of discharge capacity will also reduce post-construction settlement. Therefore, degradable drainage boards have good application prospects. Lee et al. [11] first introduced prefabricated drains made of natural materials to surcharge preloading engineering. Drainages made from natural fibres have been used in recent years in soft ground improvement projects in countries such as India, South Korea, and Australia [12,13,14]. Xu et al. [15] used wheat straw as drainage and verified the discharge capacity suggesting that long wheat straw is suitable for horizontal drainage and short wheat straw is suitable for vertical drainages. Shi et al. [16] used SEM scanning electron microscopy to compare and analyze the microstructure of straw from rice and wheat, and found that both had similar discharge capacities. Cao et al. [17] conducted a vacuum preloading drainage experiment using straw rolls as vertical drainages and found that the straw rolls had a good discharge capacity by analyzing the settlement and pore pressure in the tests. However, many of these applications were in inert adverse environments, such as bioactive soils, in which cellulose-degrading microorganisms exist; the decay process of cellulose-based materials such as jute is very serious, for example, Miura et al. [18] showed the severe degradation of a jute fibre drain buried in Ariake clay: the drain lost almost 78% of its tensile strength after only 126 days. Because saturated soft soils, especially alluvial soils normally have large organic contents and complex biological profiles. Nguyen and Indraratna [13] carried out a series of laboratory investigations into the biodegradation of jute drains showing that coir, having a major component of lignin, retained more than 80% of its original tensile strength after more than 600 days exposed to saturated soil. However, jute lost approximately 85% of its fresh strength after 300 days and almost 80% of the discharge capacity was lost after 520 days.
Moreover, most studies have not considered the degradation of drainage board performance caused by biodegradation. Crop straw is mainly composed of cellulose, hemicellulose, and lignin, accounting for more than 80% of the dry weight of the straw, including about 10–25% lignin, 20–30% hemicellulose and 40–50% cellulose. When the straw drainage board is inserted into the soil, enzymes produced by microorganisms degrade the large cellulose polymers into small molecule compounds, which are eventually degraded into CO2 and H2O. There are more than 200 lignocellulose-degrading microorganisms present in the environment, mainly consisting of bacteria and fungi, which are diverse and coordinated with each other [19]. Bacteria have the advantages of a short reproductive cycle, simple structure, and resistance to acids and bases, and have great potential for their application in the degradation of lignocellulose [20]. Therefore, it is necessary to evaluate the biodegradation of straw drainage boards.
This paper uses straw to produce a drainage board. The biodegradable prefabricated vertical drainage (BPVD-B and BPVD-C) consists of a straw fibre core plate and a permeable nonwoven fabric, with the drainage channels set within the core plate which has a parallel D-shaped cross-section. The BPVD-B and BPVD-C were subjected to indoor degradation experiments, longitudinal discharge capacity tests, and tensile strength tests were carried out. The law of discharge capacity degradation with time is given. The plastic vertical drainage (PVD-C) tests were also carried out at the same time, and the results were compared with the straw drainage board. Soil bacterial communities of microorganisms were analyzed.

2. Materials

The BPVD production process is the same for PVD, except that there are differences in the materials; the specific production process is as follows: (1) Mixing 13–17% rice straw, 10–13% wood chips, 3–5% reeds, 5–8% corn cobs, 13–17% corn straw, 12–17% wheat straw, 2–5% bamboo fibres and 7–12% rice husk powder in a mixing drum to obtain a plant fibre mixture. (2) Put 30–35% adhesive into the plant fibre mixture and heat and stir at a temperature of 150–190 °C to melt the adhesive and mix it in with the plant fibre mixture. (3) Then, 4–8% hemp fibre or glass fibre wire is added and mixed well to obtain a mixture. (4) The mixture is evenly dispersed and pressed into boards using heated smooth rollers with a heat setting of 120–180 °C. (5) The plates are pressed using a forming roller with a knife groove to obtain a biodegradable plant drainage plate core with drainage grooves. The length and width of the drainage grooves are 3.5 mm and 2 mm. The core plate of the plastic drainage boards (PVD-C) was made of polyethylene (HDPE) by stamping. The width and thickness were 70 mm and 4 mm for the BPVD-B, and 100 mm and 4 mm for both the BPVD-C and PVD-C. The core plates of the BPVD-B, BPVD-C, and PVD-C were wrapped in the same nonwoven geotextile with an effective aperture size of 0.075 mm. The photograph of the drainage boards (PSVD-B, PSVD-C, and PVD-C) are presented in Figure 1. The properties of the drainage boards are shown in Table 1.
Table 1 shows that there are significant differences in terms of the core plate and filter membrane. The discharge capacity of the straw drainage board is much higher than that of coconut shell and jute drainage boards, while the strength is lower than that of coconut shell and jute drainage boards. The straw drainage board has a lighter mass and larger drainage channels. Therefore, the straw drainage board has a better engineering performance than coconut shell and jute drainages.

3. Laboratory Investigation into the BPVDs

3.1. Experimental Scheme

This study sampled buried drainage boards on-site and indoors. The soil was taken from the site of the Hegang Expressway project in Zhuhai, with a sampling depth of 6 m. The soil sample was homogeneous, grey-black silt, containing a small amount of shell and mica-like material, and was a marine soft soil; the physical and mechanical properties of the soil sample are shown in Table 2. The BPVD-B, BPVD-C, and PVD-C drainage boards were used for the degradation tests. The degradation characteristics of the drainage boards were conducted in a chamber at a temperature of 22 °C and relative humidity of 88%, which are close to the annual average temperature and relative humidity of Guangdong Province. A 1 m length of drainage board was inserted into the soil and after set periods of time (5, 10, 15, 30, 60, 90, 120, 150, 180, 210, and 240 days) the drainage boards were taken out for discharge capacity and tensile strength investigations. To better understand the degradable characteristics of drainage boards, the microbiota of the natural soil was sequenced.

3.2. Discharge Capacity Test

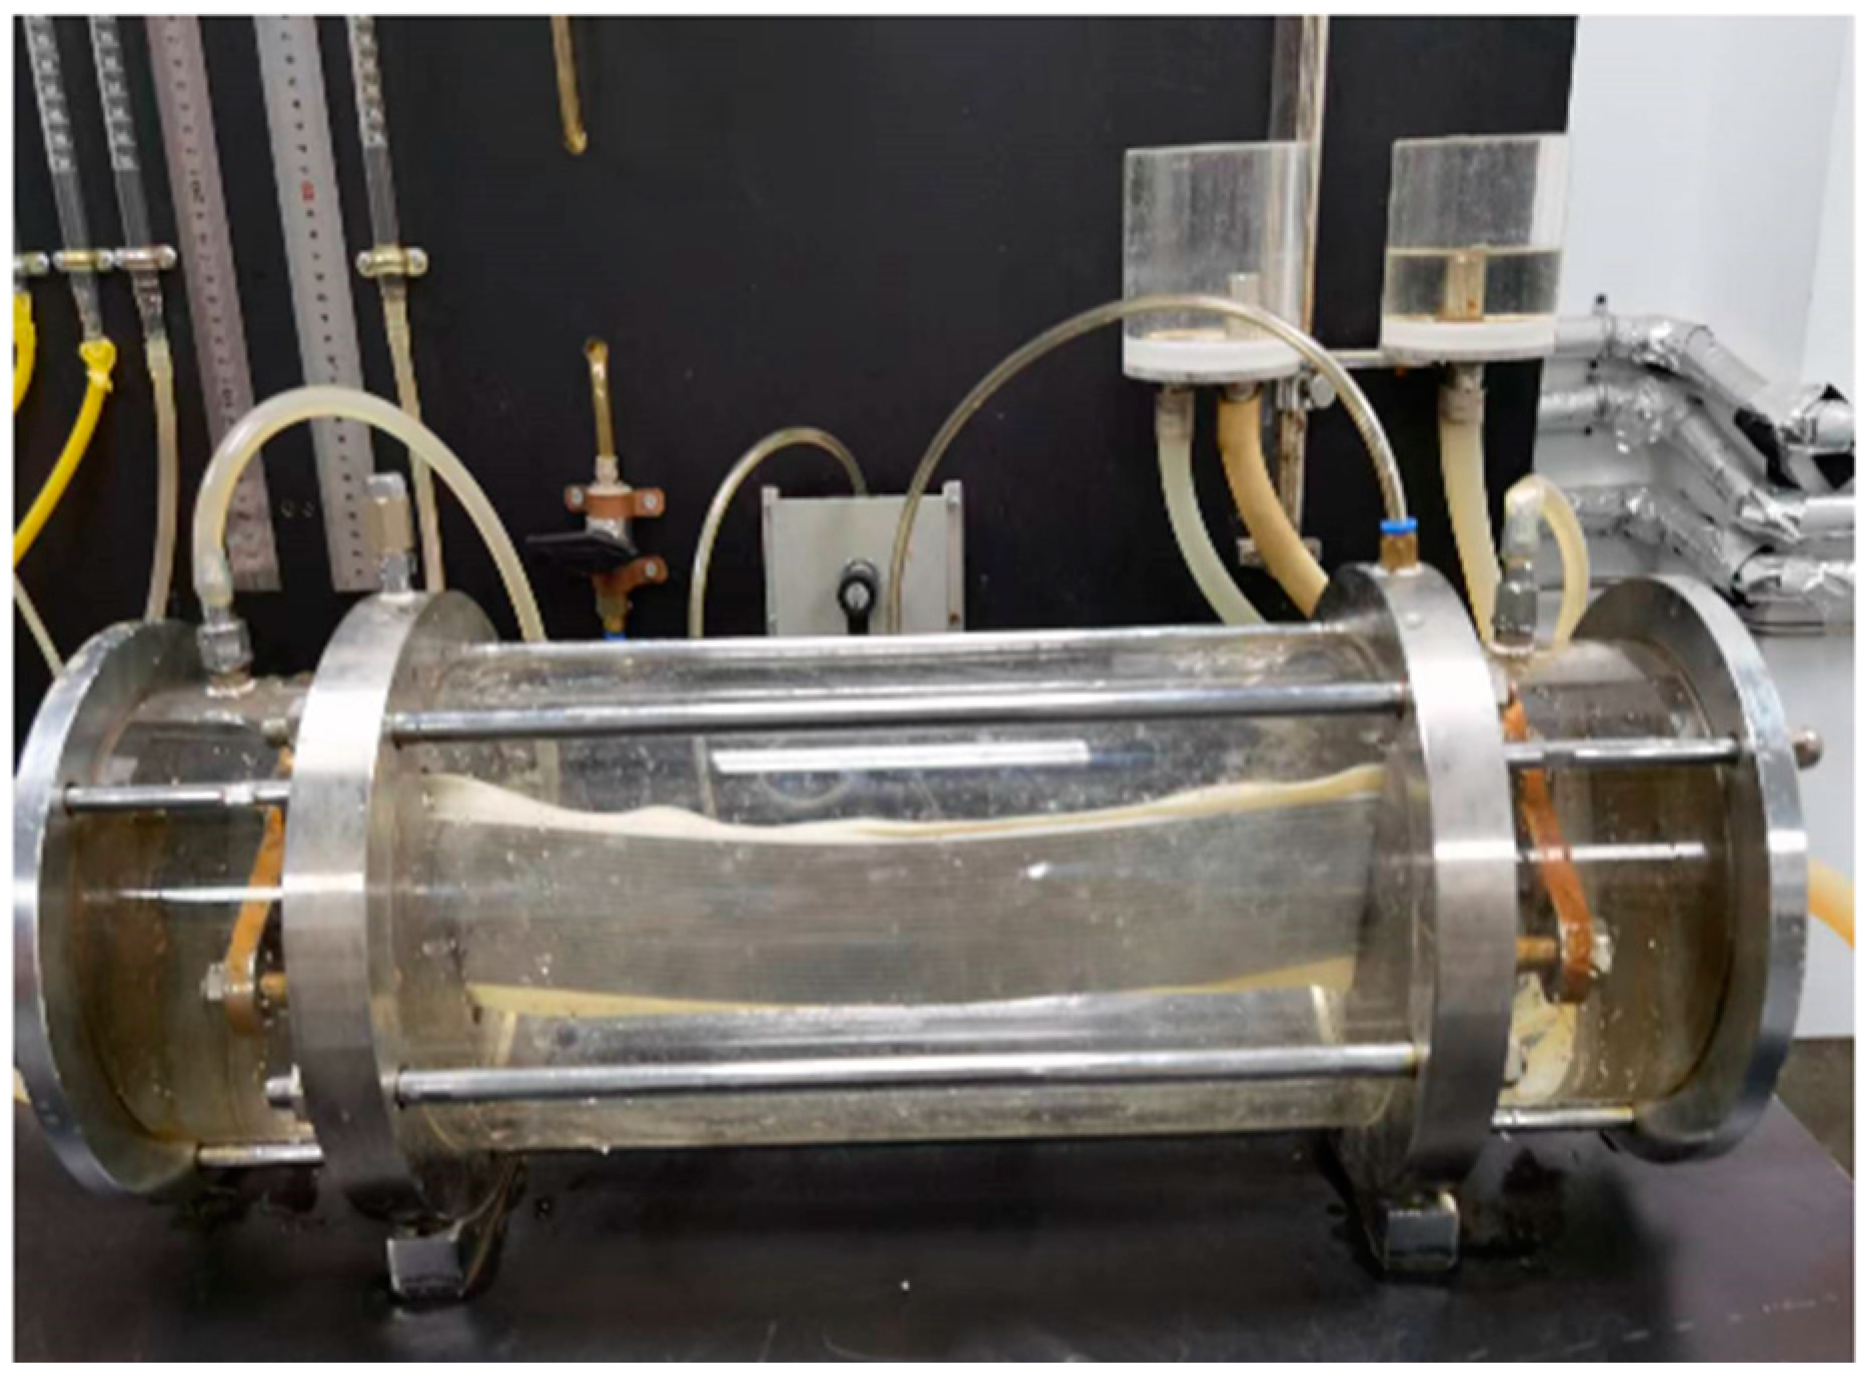
Discharge capacity is a flow rate per unit of time at a specified lateral pressure and unit hydraulic gradient. The test was carried out using ASTM D 4716 [21]. The drainage board was wrapped with a latex membrane, the confining pressure is transferred to the drainage board by the latex membrane, which is less than 0.3 mm thick, and the test was carried out under laminar flow conditions, with a hydraulic gradient of 0.5 and a length of 40 cm for each test piece. The confining pressures of 50, 175, and 350 kPa were applied respectively. Figure 2 shows a sketch of the discharge capacity tester. The test was carried out after 1 h of seepage under a stable lateral pressure and hydraulic gradient, and the discharge capacity can be calculated according to Equation (1).
q = Q   l t   h η r η 20  
where q is the discharge capacity (cm3/s); Q is the water quantity (cm3) flowing through the drainage board during 1 h; l is the effective length of the drainage board (cm); t is the time (s); ∆h is the head difference (cm); and ηr20 is the hydrodynamic viscous coefficient ratio which is determined by the water temperature. After set periods of time, the longitudinal discharge capacity test was carried out. The rate of discharge capacity loss can be calculated according to Equation (2) and can be used to evaluate the degradation effect. qw0 is the discharge capacity (cm3/s) before degradation; qwt is the discharge capacity (cm3/s) after degradation time t; and Dq is the rate of discharge capacity loss.
D q = q w 0 q wt q w 0 × 100 %  

3.3. Tension Tests

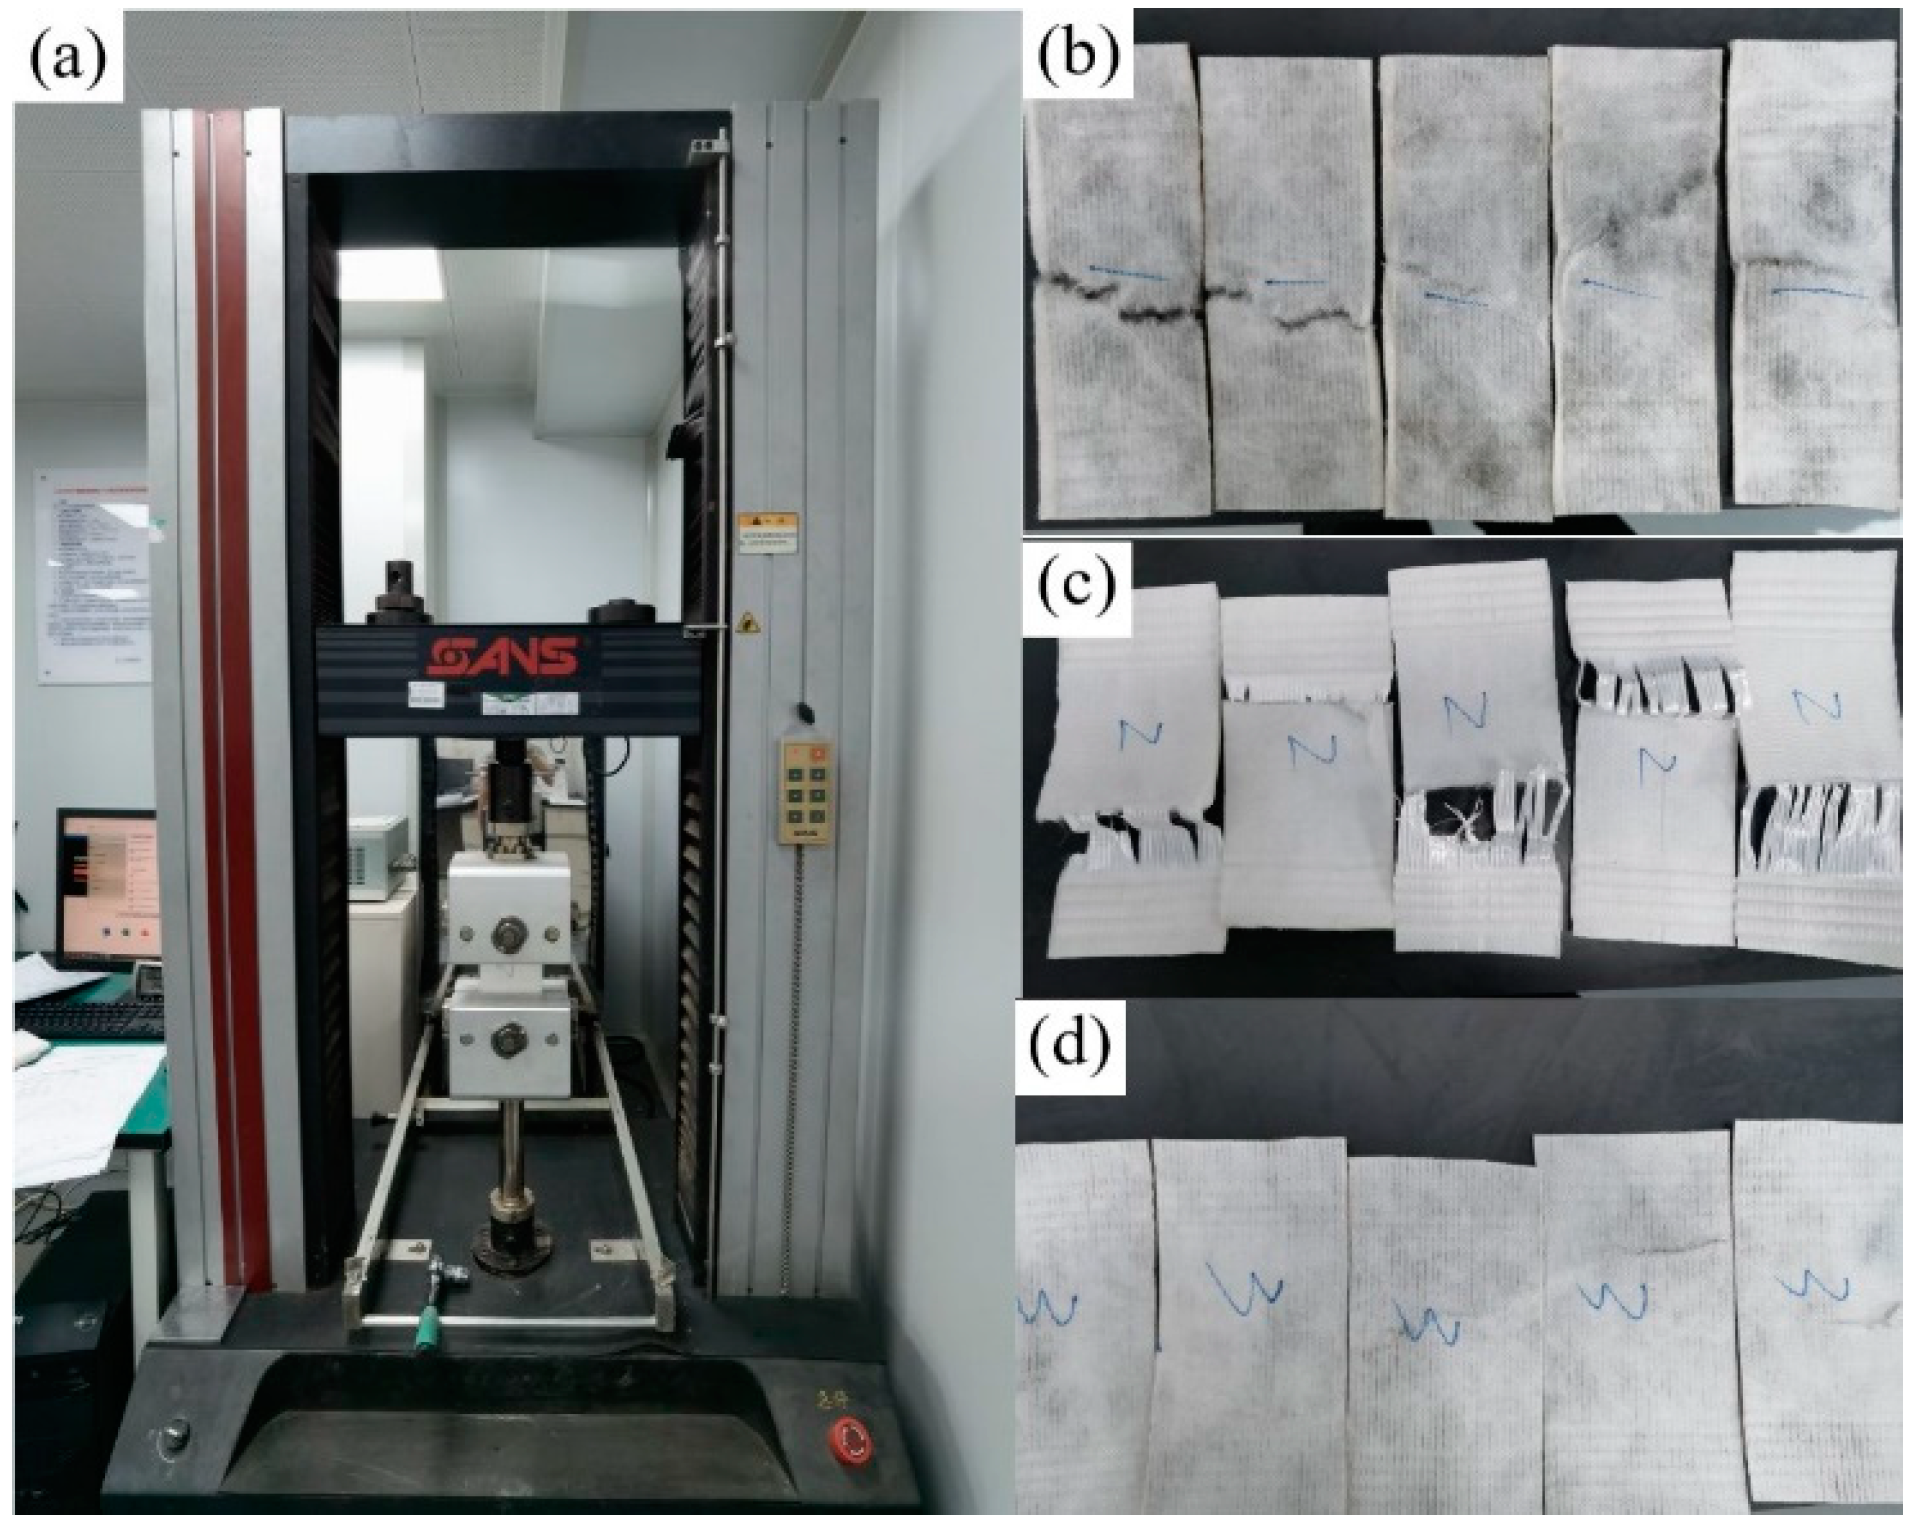
Strain-controlled testers (Figure 3) were used to conduct tensile tests in the dry state, with a specimen length of 100 mm and a rate of 25 mm/min. When the elongation of the drainage board was less than 4%, the tensile strength and elongation index was judged as unqualified; when the elongation was between 4% and 10%, the test value was taken as the peak strength at fracture; when the elongation was greater than 10%, the test value was taken as the strength corresponding to an elongation of 10%. After a period of time, the samples were removed and the tensile strength tests were carried out to obtain the strength, and the rate of loss of tensile strength was calculated according to Equation (3), where T0 is the initial ultimate tensile strength; Tt is the ultimate tensile strength at degradation time t; and DT is the rate of loss of tensile strength.
D T = T 0 T t T 0   ×   100 %

3.4. Microbiota Investigation

To understand the biodegradability of the straw drainage board, the DNA of the microorganisms in the soil was sequenced using an Illumina PE 250 sequencing experiment [22], the process for which is shown in Figure 4. DNA was randomly extracted from the soil at depths of 6 m and was subjected to a polymerase chain reaction (PCR) technique to specify and amplify the DNA [23], and the DNA information was read. The PCR products were quantified using the Quanti Fluor™-ST Blue Fluorescence Quantification System (Promega), and the fluorescence signal collected in each round was counted to obtain the sequence of the template DNA fragment, which gave the microbial colony population in the soil. In this sample, the RNA and DNA analyses of the soil microorganism were used to obtain the bacterial community. After analyzing the microbial bacterial community using the PCR technique, the degradation community was identified. This reveals the degradation of the straw drainage board.

4. Discussion of Experimental Results

4.1. Discharge Capacity

Figure 5 shows the variation in discharge capacity over time under different confining pressures (75 kPa, 150 kPa, and 350 kPa) for BPVD-B, BPVD-C, and PVD-C. PVD-C has a higher discharge capacity than BPVD-B and BPVD-C, and the discharge capacity decreases with the increase in the confining pressure for all drainage boards. Before the degradation test (t = 0 d), the discharge capacity of the PVD-C decreased significantly with the increase in confining pressure, and the discharge capacity decreased from 157 cm3/s to 89 cm3/s. However, BPVD-B and BPVD-C are less affected by the confining pressure, and the water discharge is reduced by 13 cm3/s and 20 cm3/s, respectively, but both meet the requirements of the “Technical Regulations for the Application of Waterborne Engineering Plastic Drainage Boards” [24]. During the first 30 days of the test, the discharge capacity of all drainage boards decreased rapidly. The reason for this is that the internal drainage channel of the drainage board is squeezed by the confining pressure. At this time, the biodegradation effect of the drainage board is not obvious; the PVD-C has obvious radial compression deformation under confining pressure, which leads to a significant reduction in drainage capacity. Pressures of 75 kPa, 150 kPa, and 350 kPa, respectively simulate the drainage capacity of drainage boards at 3 m, 9 m, and 18 m. The discharge capacity decreased with depth.
Straw drainage boards are degraded by microorganisms in the soil, which leads to a decrease in discharge capacity. As can be seen from Figure 5, the discharge capacity of the PVD-C decreases rapidly during the first 30 days due to the deformation of the drainage plate under confining pressure which decreases slightly with time after 30 days. However, in the first 180 days, there is no serious difference between the straw drainage board and the plastic drainage board with regard to changes in discharge capacity; after 180 days, the discharge capacity of the straw drainage board starts to decrease rapidly. This is due to the degradation by microorganisms. After 240 days, the discharge capacity decreased by 27.45% and 29.51% for BPVD-B and BPVD-C, respectively. Those figures indicate that the straw drainage board retains a good discharge capacity in early construction, ensuring that the drainage channels are open to allow drainage from the foundation. After construction, the straw drainage board can quickly degrade, which can effectively prevent excessive post-construction settlement. Additionally, the discharge capacity of PVD-C was reduced by 10% at 240 days, which was still a better drainage capacity compared to the straw drainage board. After construction, the PVD-C was left in the ground, which leads to large post-construction settlements and pollutes the environment.
Indraratna et al. [25] and Deng et al. [26] indicated that after the drainage boards were installed into the soil, the drainage capacity started to decrease due to biodegradation in an exponential decay, i.e., qw(t) = qw0e−wt. The effect of biodegradation on soil consolidation was also evaluated. Nguyen et al. [12] studied drainages composed of jute and coconut shells showing different forms of discharge capacity degradation over time, proposing general polynomial degradation forms for convex, concave, and linear degradation curves.
qw(t) = qw0(1 − atb)
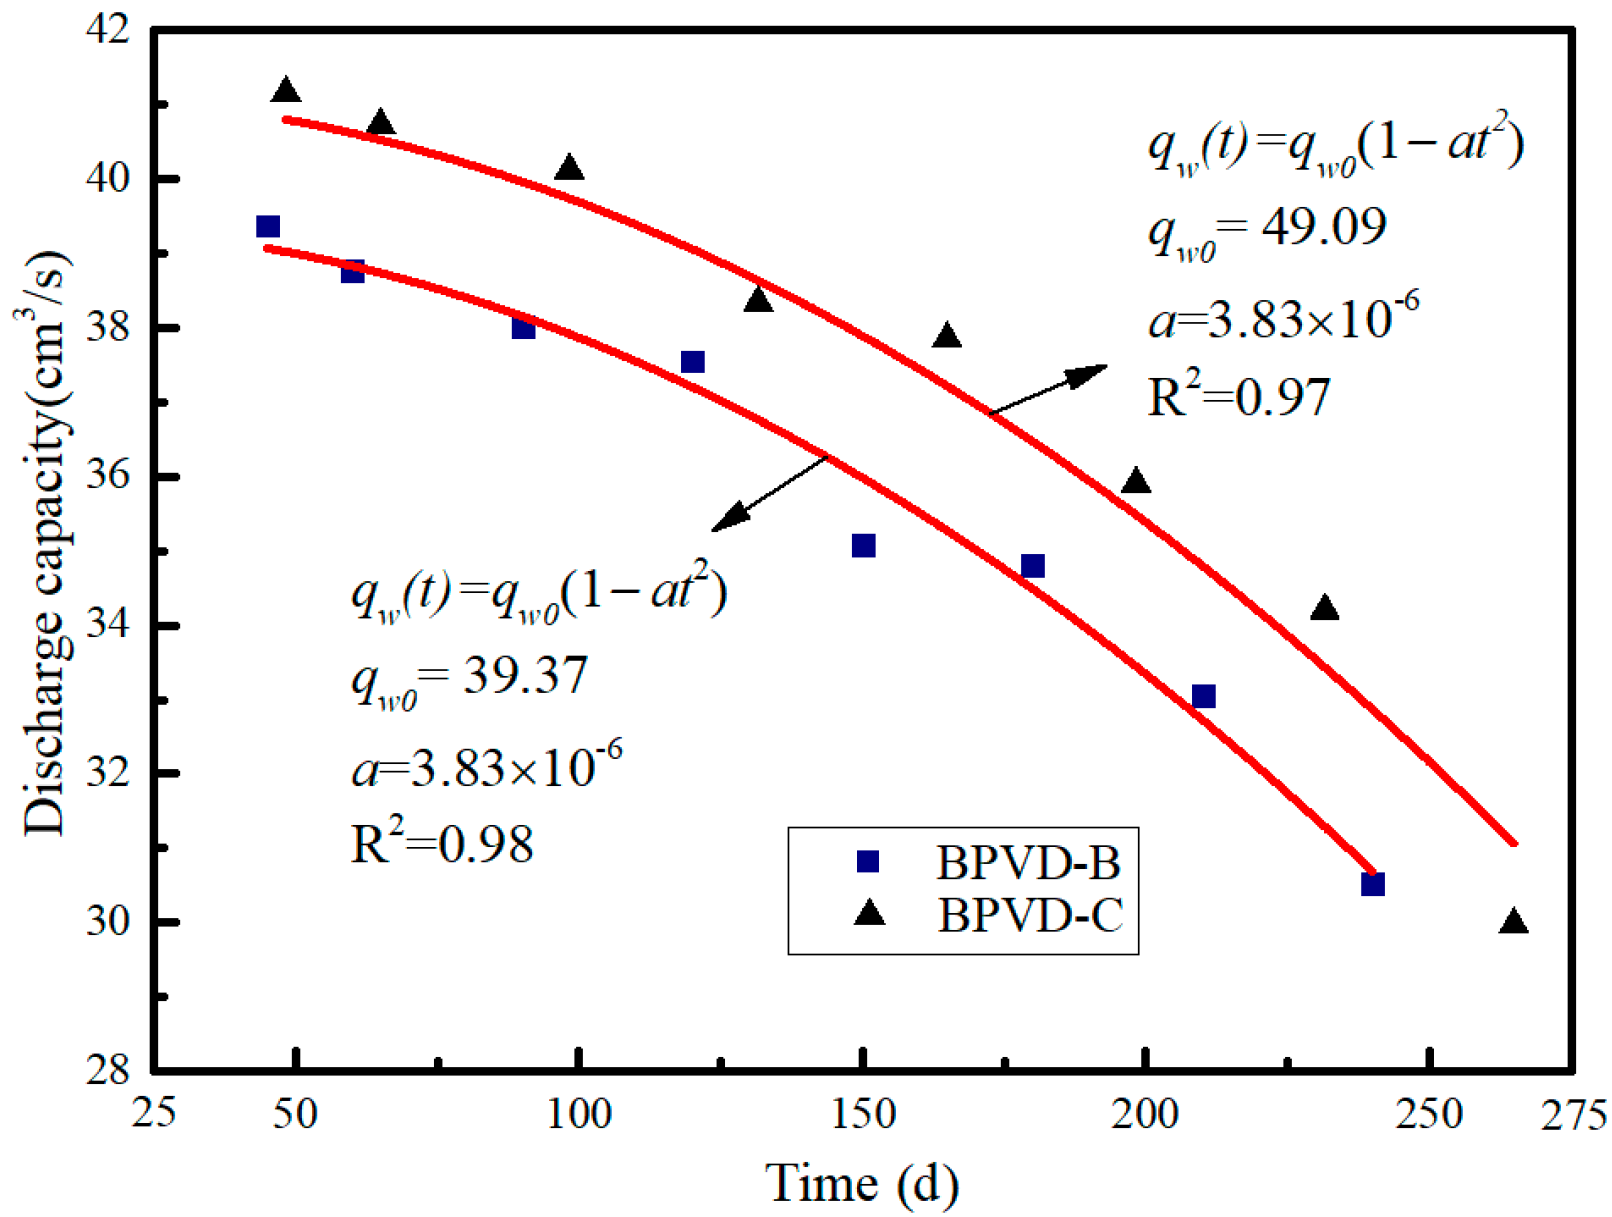
In Equation (4), a is the attenuation coefficient, indicating the degradation of the discharge capacity; b is the order of the polynomial degradation curve; and qw0 is the initial discharge capacity. a and b should satisfy the condition 0 < (1 − atb) < 1 when b < 1, when the degradation takes the form of a concave curve; when b > 1, the degradation takes the form of a convex curve; and when b = 1, it is linear. Figure 6 shows the degradation of the convex curve of discharge capacity versus time for BPVD-B and BPVD-C at 350 kPa confining pressure, with the degradation relationship qw(t) = qw0(1 − at2). After computer fitting, the decay coefficient for both drainage boards was 3.83 × 10⁻⁶ d−2, and the fitted curves fitted well to the test values with a variance of 0.98 and 0.97, respectively. The discharge capacity of the drainage board degraded to 0 after 510 days, as calculated by Equation (4), which indicates that the board was completely degraded. However, the JTS 206-1-2009 [24] shows that the drainage board cannot meet project requirements when the discharge capacity is lower than 15 cm3/s. Therefore, the potentially longest life expectancy of a straw drainage board is 425 days, calculated by Equation (4).

4.2. Tensile Strength of BPVDs

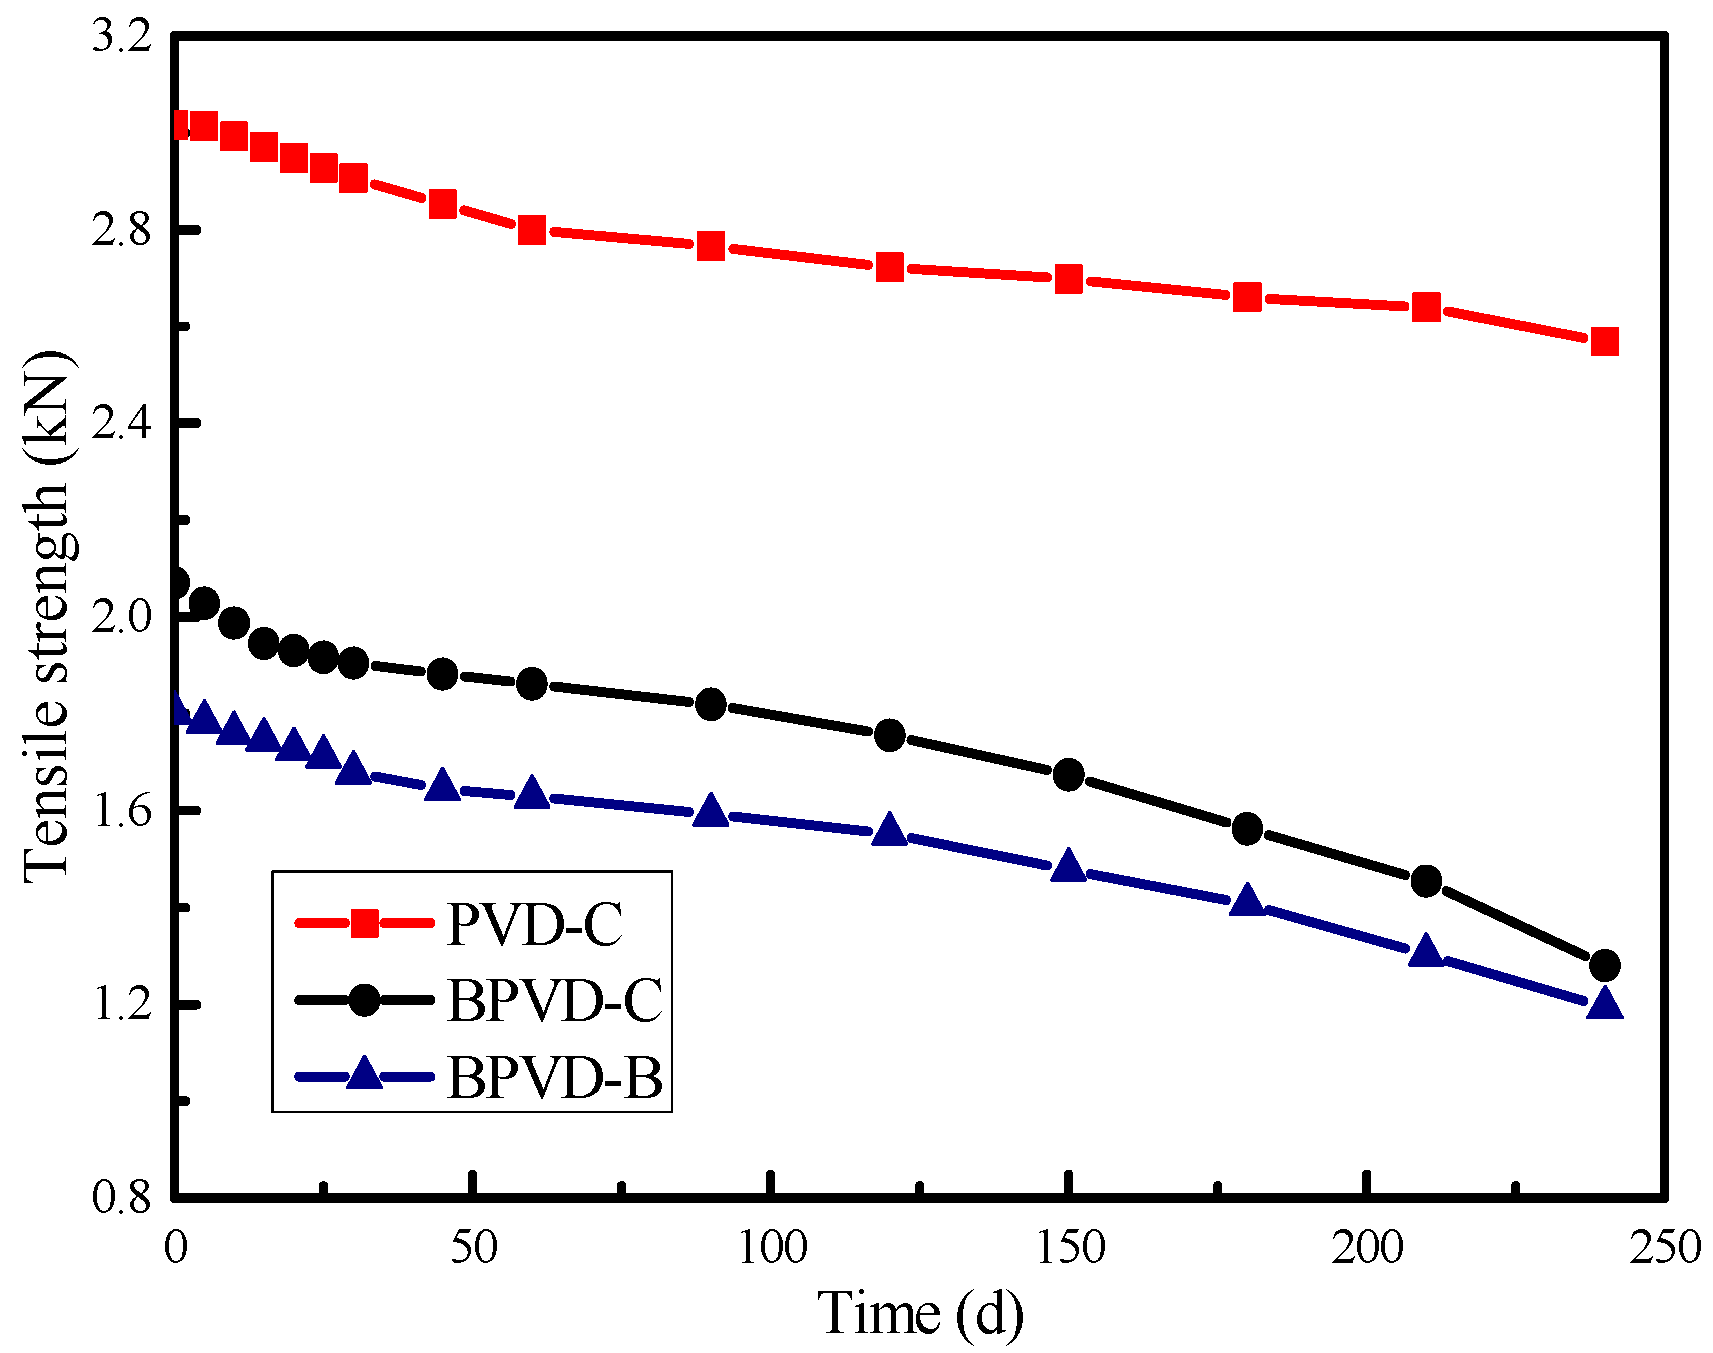
Figure 7 shows the variation in the tensile strength of BPVD-B, BPVD-C, and PVD-C with time; the tensile strength of PVD-C is higher than that of BPVD-B and BPVD-C, and the tensile strength of PVD-C decreases with time from 0 to 30 days, and after 30 days the tensile strength remains constant. The trend of the tensile strength of BPVD-B and BPVD-C during 0–30 days is approximately the same as that of PVD-C. After 30 days, the degradation of the tensile strength starts to accelerate, especially after 180 days, the degradation of the tensile strength becomes more significant, with a loss of 11.8% and 13.6% of the strength of BPVD-B and BPVD-C, respectively during 180–240 days. The reason is that when the drainage board is subjected to tension, the tension is mainly borne by the core and the filter membrane. PVD-C are made of polyethylene and polypropylene, which are stable and not easily degraded, and the tensile strength remains stable after degradation.

4.3. Weight Loss

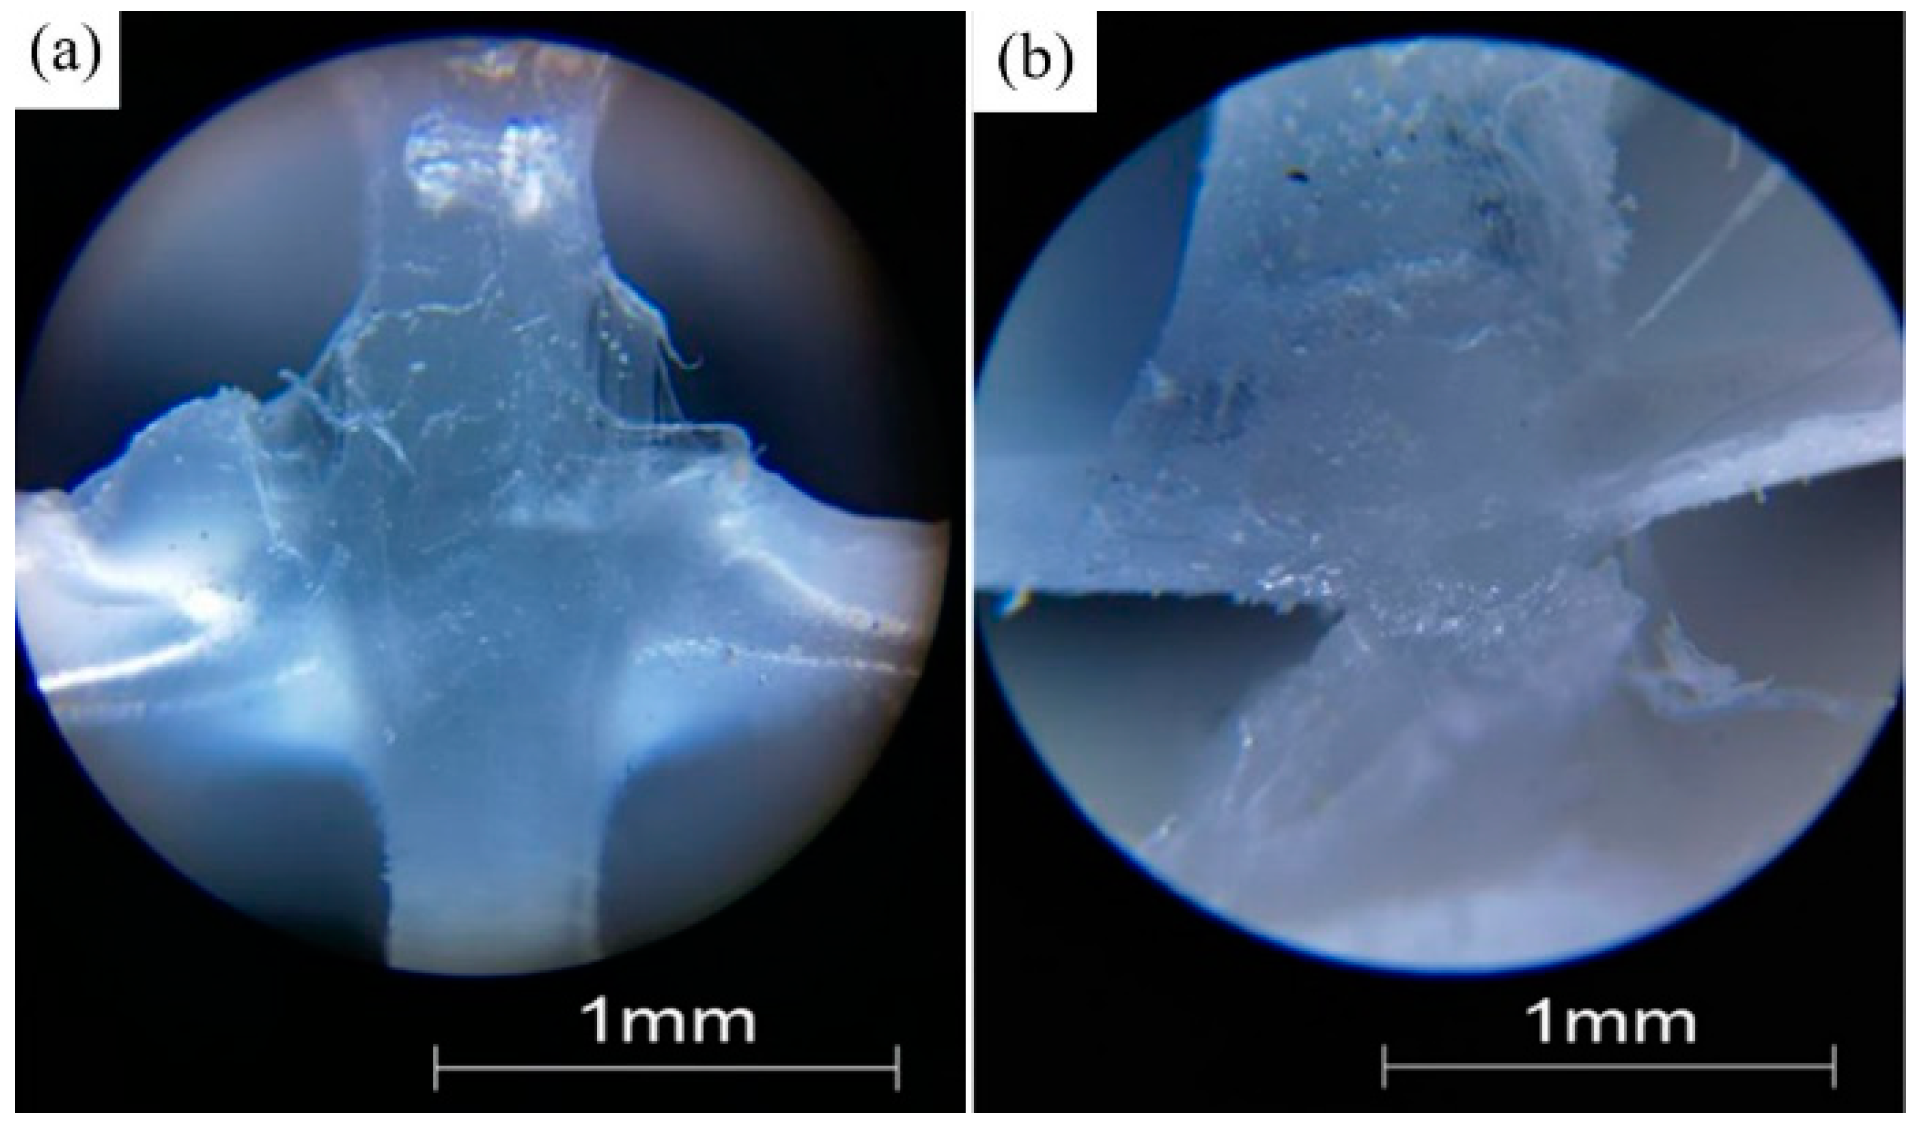
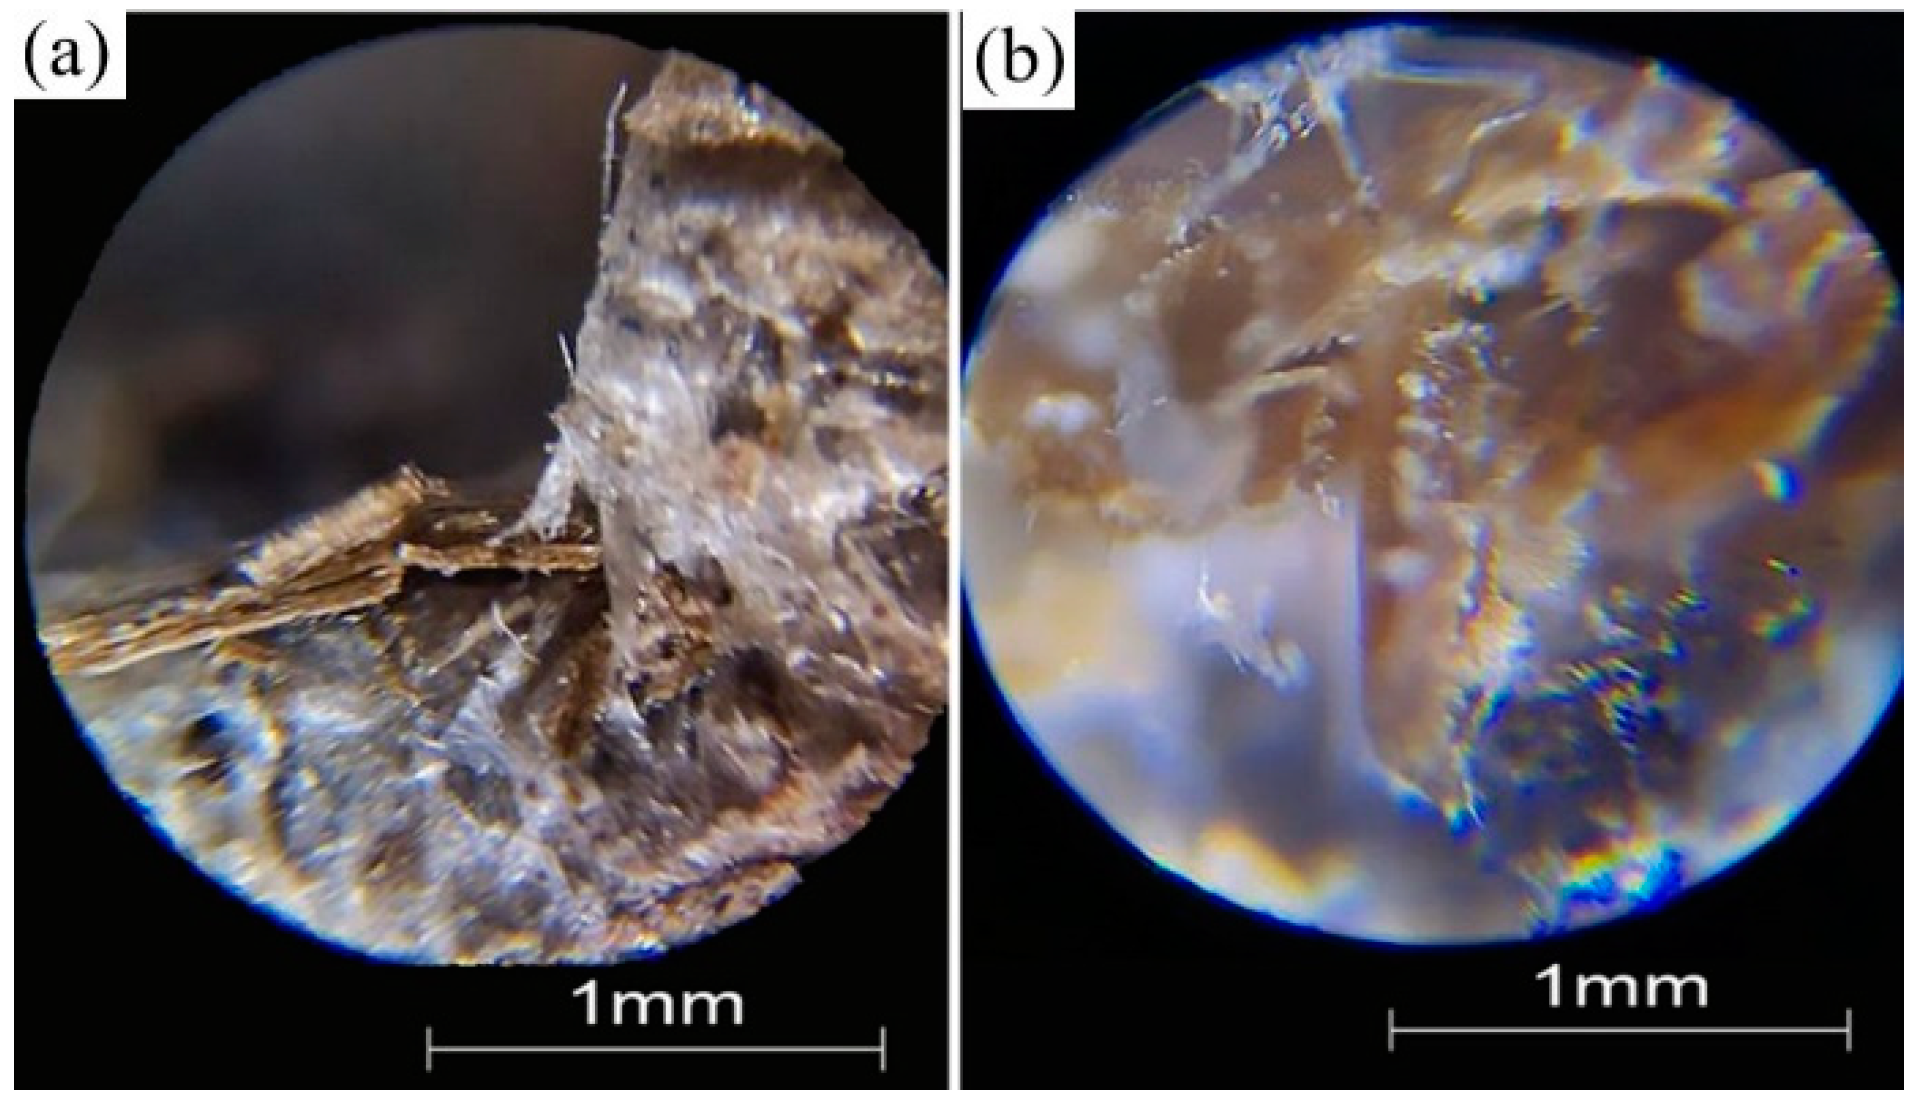
Figure 8 shows the variation in weight loss for the three types of drainage board. The weight loss of BPVD-B and BPVD-C maintains a continuous increasing trend in the middle and late stages. After 240 days, the weight loss rate was 14.2% for BPVD-C, 12.4% for BPVD-B, and 7.4% for PVD-C. The weight loss rate of BPVD-B and BPVD-C is twice that of PVD-C, which has a better degradation effect. In order to further evaluate the degradation effect of BPVD-B and BPVD-C, the surface morphologies of the drainage boards before and after degradation were observed by optical microscope. The surface morphologies of the BPVD-C and PVD-C are shown in Figure 9 and Figure 10. The core of the PVD-C is intact and the surface form remains unchanged. It is still relatively smooth, and the colour becomes dark. However, the surface of the BPVD-C is noticeably mottled and the surface became rougher, and undulating, with erosion marks and holes.

4.4. Microbial Analysis

The DNA sequencing of microorganisms showed that a total of 491,856 16 s rDNA sequences were obtained from the soil samples, consisting of 18 phyla, 24 orders, 51 families, and 81 genera. Table 3 shows the dominant phylum, order, family, and genus of bacteria at depths of 6 m. The abundances of bacterial phylum in soil samples at different depths of 6 m are presented in Figure 11a. Bacteroidota and Firmicutes were the primary phyla, accounting for approximately 91.5% of the population. Proteobacteria and Spirochaetota were the secondary phyla. Based on the available studies [27,28] on lignin and cellulose degradation, the Proteobacteria and Firmicutes are the dominant phyla in the natural environment. The microorganisms with potential cellulolytic activities could provide a unique opportunity for the biodegradation of cellulosic matter through efficient enzymatic conversion into highly energetic molecules [29]. Studies of microbial degradation in soil samples have focused on the biological genus level, and further analysis can yield specific bacterial species. The distribution of the dominant genus with relative abundance is listed in Figure 11b. Analysis of the bacterial community in situ showed a high relative abundance of Prevotella, Rikenella, and Ruminococcus. Prevotella can ferment enzymes and gene clusters to degrade starch, protein, cellulose, and hemicellulose. Ruminococcus are crucial fibre-degrading bacteria and are the most abundant of bacterial communities. These anaerobic bacteria can ferment carbon sources, break down fibrous substances, and convert plant fibres into volatile fatty acids. Therefore, the straw drainage boards can degrade in Zhuhai marine soft soil.
Nguyen et al. [12] conducted DNA extraction and sequencing techniques to determine the microbial properties of these decayed fibres indicating that bacteria such as the species of the genera Clostridium and Bacillus can cause the rapid decomposition of cellulose-based material (i.e., jute), whereas other organic matter–consuming microbes such as sulfate-reducing bacteria do not directly contribute to the biodegradation of jute. However, Prevotella, Rikenella, and Ruminococcus are the dominant degrading bacteria of straw fibre, which shows that the degrading bacteria of straw fibre are different from jute and coconut fibre. Wang et al. [30] studied the composting performance of distilled grain and found that the increased abundance of Proteobacteria, Firmicutes, Chloroflexi, and Deinococcota accelerated the composting rate. These studies show that degradation bacteria vary depending on the soil and natural fibres. It is necessary to investigate the microbial population in the soil before installing degradable drainage boards.

5. Degradation Rate

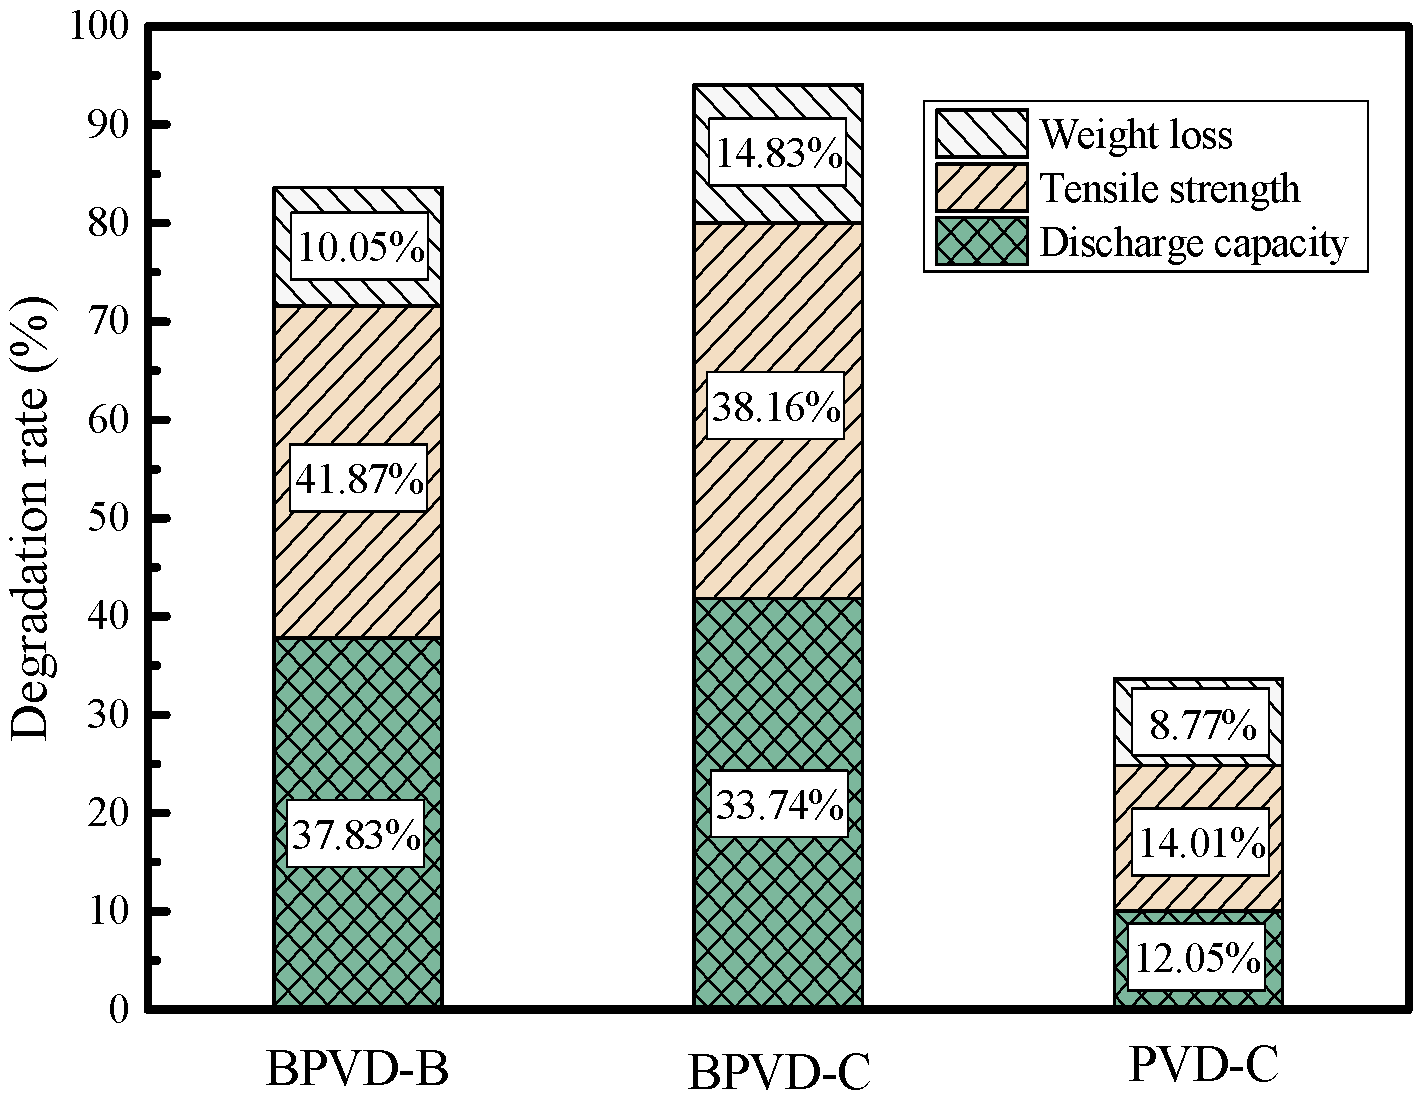
Figure 12a shows the degradation rate with time for the discharge capacity. The degradation rate of BPVDs with time is divided into two stages: a gentle increase in degradation rate with time from 0–180 days, and a rapid increase in degradation rate after 180 days. The discharge capacity degradation rates of BPVD-B and BPVD-C are approximately equal, with BPVD-C having a greater discharge capacity than BPVD-B. Compared to the straw drainage boards, the degradation effect of the plastic drainage boards is not obvious. Figure 12b shows the degradation rate of the tensile strength of the drainage boards over time. The degradation rates of the tensile strength were approximately equal for BPVD-B and BPVD-C and much greater than PVD-C. The rapid increase in the degradation rate of tensile strength compared to the discharge capacity starts from day 50, indicating that the degradation time of the straw drainage board strength is earlier than the degradation time of the discharge capacity. Figure 12c shows the variation in the weight loss rate with time. The weight loss rate of the three drainage boards does not differ greatly, all increasing with time and then stabilizing. Figure 13 shows the degradation rates of BPVD-B, BPVD-C, and PVD-C on day 240. The degradation of BPVD-B and BPVD-C was mainly manifested in the reduction in discharge capacity and tensile strength, with both close to 40%. However, the degradation rates of discharge capacity, tensile strength, and weight of PVD-C were 11.6%, 14.8%, and 8.8% respectively, where degradation was not significant.
The degradation of the straw drainage board was seen as the decline in the discharge capacity, tensile strength, and weight loss, so it is necessary to evaluate the degradation of the straw drainage board. At present, there are three methods to evaluate the degradation of biodegradable materials: (1) The growth rate of degradable colonies on the surface of the material is used. The greater the microbial abundance, the better the degradation performance. (2) Evaluated by the weight loss rate. In a certain time period, the higher the weight loss rate, the better the degradation performance. (3) Evaluated by discharge capacity and tensile strength. The faster the mechanical properties decrease, the better the degradation. Straw drainage boards need to ensure both adequate strength and good discharge capacity during construction. Therefore, it is necessary to improve the degradation evaluation method for straw drainage boards to become suitable for engineering applications. Considering the effects of discharge and tensile strength and weight loss, a comprehensive evaluation was carried out using hierarchical analysis to establish an engineering failure model for straw drainage boards. The procedure follows.
  • Construct the judgement matrix R:
R = [ r 11 r 12 r 13 r 21 r 22 r 23 r 31 r 32 r 33 ]
In Equation (5), rij indicates the importance degree of the i-th factor in relation to j. For straw drainage boards, i, j = 1, 2, 3 represent discharge capacity, tensile strength, and weight loss, respectively. Three factors combine to influence the engineering performance of the straw drainage boards. Figure 13 shows that after 240 days of testing, the degradation rates of discharge capacity, tensile strength, and weight loss were 37.83%, 41.87%, and 10.05%, respectively for BPVD-B. Thus, the ratio of discharge capacity to tensile strength and weight are 0.89 and 3.80 (r12 = 0.89, r13=3.80), respectively. The ratio of tensile strength to discharge capacity and weight are 1.12 and 4.27 (r21 = 1.12, r23 = 4.27), respectively. The ratio of weight to discharge capacity and tensile strength are 0.26 and 0.23 (r31 = 0.26, r32 = 0.23), respectively. In summary, the judgement matrix is as follows:
R = [ 1.00 0.89 3.80 1.12 1.00 4.27 0.26 0.23 1.00 ]
2.
Calculating the product of elements in each row of the judgement matrix (mi):
m i = j = 1 n r i j , i = 1 , 2 , 3
Calculating the weight coefficient (wi):
w i = w ¯ i i = 1 n w ¯ i , i = 1 , 2 , 3
w i ¯ = m i n   , i = 1 , 2 , 3 .   n = 3
The weight coefficient (wi) of BPVD-B is obtained using Equations (7)–(9), w1 = 0.42, w2 = 0.47, and w3 = 0.11.
3.
Calculate the overall degradation rate:
r = r 1 w 1 + r 2 w 2 + r 3 w 3
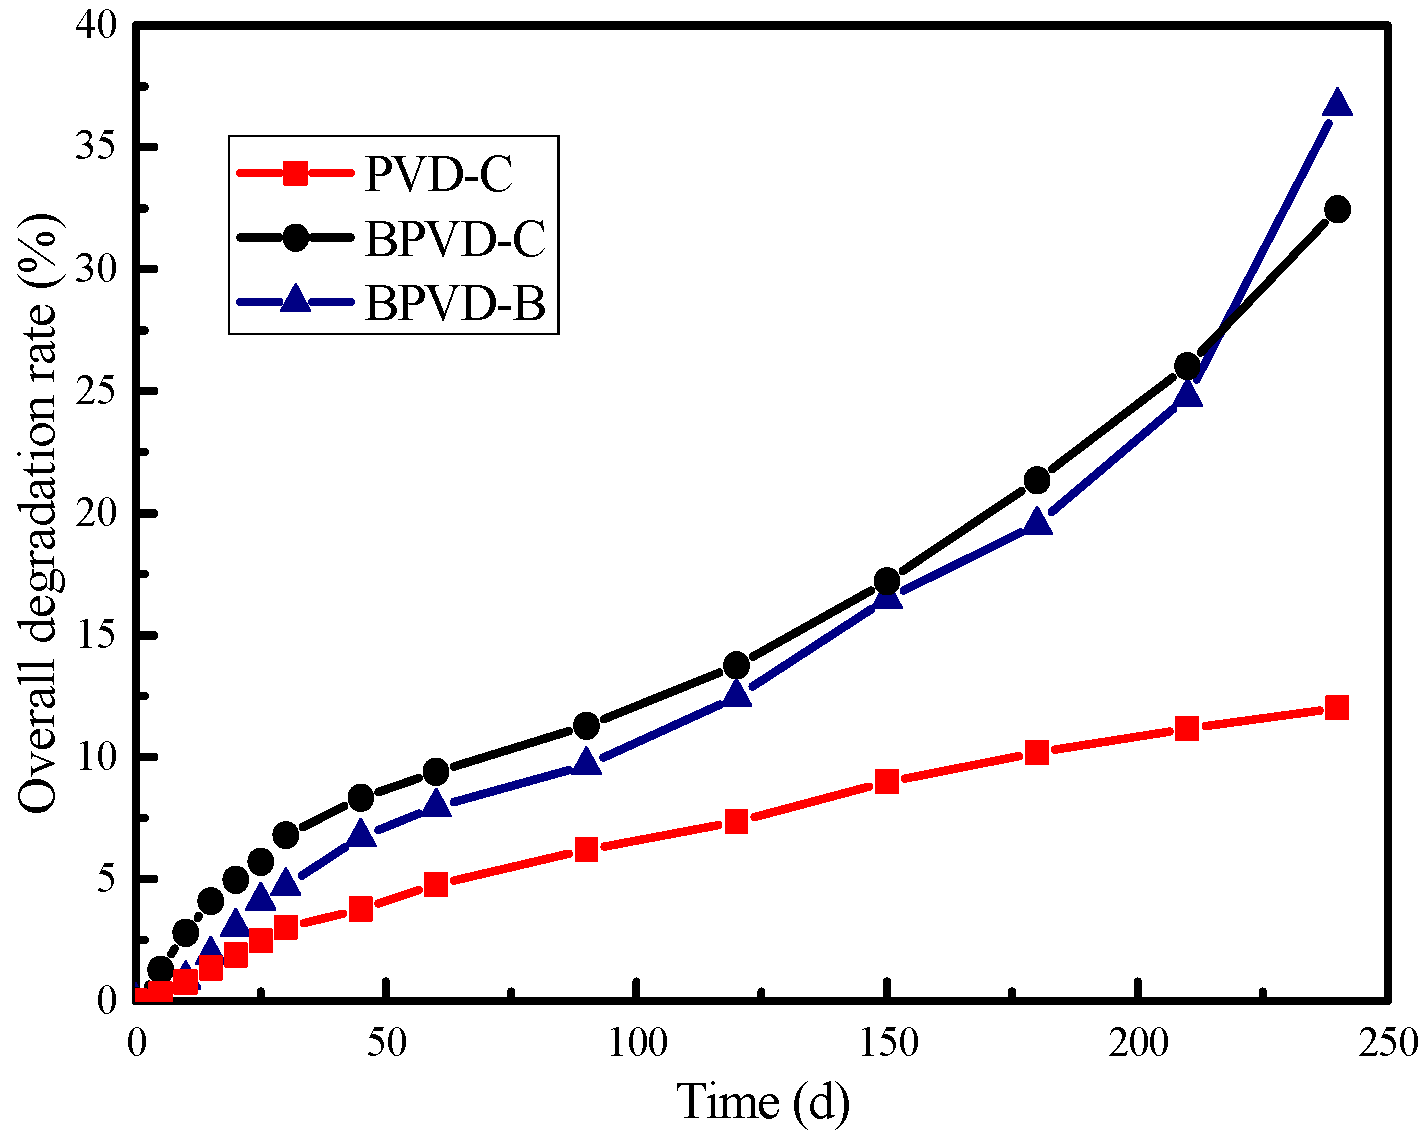
where r1 is the degradation rate of discharge capacity, r2 is the degradation rate of tensile strength, and r3 is the weight loss rate. Similarly, the calculation method for BPVD-C and PVD-C is the same as BPVD-B. Figure 14 shows the overall degradation rate for BPVD-B, BPVD-C, and PVD-C. The overall degradation rate was approximately the same for BPVD-B and BPVD-C, with a rapid increase over time. The degradation rate of PVD-C was much lower than that of BPVD-B and BPVD-C and increased slightly with time. The overall degradation rate considers the various factors and accurately evaluates the degradation performance of the straw drainage board.

6. Conclusions

The three types of drainage boards were subjected to indoor degradation experiments. Longitudinal discharge capacity tests and tensile strength tests were carried out for different degradation times. The following conclusions were drawn:
  • The discharge capacity and tensile strength are less for straw drainage boards than plastic drainage boards. The discharge capacity decreases with the increase in confining pressure and time, and there is no significant difference between the straw drainage boards and plastic drainage boards for discharge capacity changes and tensile strength in 0–180 days. The plastic drainage board can be replaced by a straw drainage board to reduce environmental pollution and post-construction settlement.
  • Straw drainage boards are degraded by microorganisms in the soil, which leads to a discharge capacity degradation in the form of a convex function with time, and the degradation relationship follows qw(t) = qw0 (1 − at2), a = 3.83 × 10⁻⁶ d−2. The discharge capacity of the drainage board degraded to 0 after 510 days and the potentially longest life expectancy of the straw drainage board is 425 days.
  • The degradation rate of BPVDs with time is divided into two stages: a gentle increase in degradation rate with time from 0–180 days, and a rapid increase in degradation rate after 180 days. The degradation of BPVD-B and BPVD-C was mainly manifested in the reduction in discharge capacity and tensile strength, with both close to 40% at 240 days. However, the degradation of PVD-C was not significant. The overall degradation rate considers the various factors and accurately evaluated the degradation performance of the straw drainage board.
  • Bacteroidota and Firmicutes were the primary phyla, accounting for approximately 91.5% of the population in Zhuhai marine soft soil; these bacteria will accelerate the degradation of the straw drainage board.

Author Contributions

Conceptualization, R.Z. and Y.D.; methodology, W.Y.; validation, Y.S. and C.W.; investigation, W.Y.; resources, Y.D.; data curation, R.Z.; writing—original draft preparation, W.Y.; writing—review and editing, R.Z.; supervision, Y.D.; project administration, Y.S.; funding acquisition, Y.D. All authors have read and agreed to the published version of the manuscript.

Funding

This research was funded by the National Natural Science Foundation of China (Prof. Yongfeng Deng), grant number 42272322.

Institutional Review Board Statement

Not applicable.

Informed Consent Statement

Not applicable.

Data Availability Statement

Not applicable.

Acknowledgments

The authors express their appreciation for the support from the National Natural Science Foundation of China to complete the research project.

Conflicts of Interest

The authors declare no conflict of interest.

References

  1. Wang, J.; Cai, Y.; Ma, J.; Chu, J.; Fu, H.; Wang, P.; Jin, Y. Improved Vacuum Preloading Method for Consolidation of Dredged Clay-Slurry Fill. J. Geotech. Geoenviron. Eng. 2016, 142, 06016012. [Google Scholar] [CrossRef]
  2. Lei, H.; Qi, Z.; Zhang, Z.; Zheng, G. New Vacuum-Preloading Technique for Ultrasoft-Soil Foundations Using Model Tests. Int. J. Geomech. 2017, 17, 04017049. [Google Scholar] [CrossRef]
  3. Zhu, W.; Yan, J.; Yu, G. Vacuum preloading method for land reclamation using hydraulic filled slurry from the sea: A case study in coastal China. Ocean Eng. 2018, 152, 286–299. [Google Scholar] [CrossRef]
  4. Wu, J.; Xuan, Y.; Deng, Y.; Li, X.; Zha, F.; Zhou, A. Combined vacuum and surcharge preloading method to improve lianyungang soft marine clay for embankment widening project: A case. Geotext. Geomembr. 2020, 49, 452–465. [Google Scholar] [CrossRef]
  5. Lei, M. Study and Analysis: Mechanism of Vacuum Preloading, Stress of Soil. Appl. Mech. Mater. 2011, 71–78, 3389–3396. [Google Scholar] [CrossRef]
  6. Ni, P.; Mei, G.; Zhao, Y. Surcharge preloading consolidation of reclaimed land with distributed sand caps. Mar. Georesour. Geotechnol. 2018, 37, 671–682. [Google Scholar] [CrossRef]
  7. Guerra, A.J.T.; Bezerra, J.F.R.; Fullen, M.A.; Mendonça, J.K.S.; Jorge, M.C.O. The effects of biological geotextiles on gully stabilization in São Luís, Brazil. Nat. Hazards 2014, 75, 2625–2636. [Google Scholar] [CrossRef]
  8. Hsuan, Y.G.; Schroeder, H.F.; Rowe, K.; Müller, W.; Greenwood, J.; Cazzuffi, D.; Koerner, R.M. Long-term performance and lifetime prediction of geosynthetics. In Proceedings of the 4th European Geosynthetics Conference, Edinburgh, Scotland, 7–10 September 2008. [Google Scholar]
  9. Wiewel, B.V.; Lamoree, M. Geotextile composition, application and ecotoxicology—A review. J. Hazard. Mater. 2016, 317, 640–655. [Google Scholar] [CrossRef]
  10. Prambauer, M.; Wendeler, C.; Weitzenböck, J.; Burgstaller, C. Biodegradable geotextiles—An overview of existing and potential materials. Geotext. Geomembr. 2019, 47, 48–59. [Google Scholar] [CrossRef]
  11. Lee, S.; Karunaratne, G.; Ramaswamy, S.; Aziz, M.; Gupta, N.D. Natural geosynthetic drain for soil improvement. Geotext. Geomembr. 1994, 13, 457–474. [Google Scholar] [CrossRef]
  12. Asha, B.S.; Mandal, J.N. Laboratory performance tests on natural prefabricated vertical drains in marine clay. Proc. Inst. Civ. Eng.-Ground Improv. 2015, 168, 45–65. [Google Scholar] [CrossRef]
  13. Nguyen, T.T.; Indraratna, B.; Carter, J. Laboratory investigation into biodegradation of jute drains with implications for field behavior. J. Geotech. Geoenviron. Eng. 2018, 144, 04018026. [Google Scholar] [CrossRef] [Green Version]
  14. Nguyen, T.T.; Indraratna, B.; Baral, P. Biodegradable prefabricated vertical drains: From laboratory to field studies. Geotech. Eng. 2020, 51, 39–46. [Google Scholar]
  15. Xu, G.; Yu, X.; Wu, F.; Yin, Y. Feasibility of vacuum consolidation in managing dredged slurries with wheat straw as drainage channels. KSCE J. Civ. Eng. 2016, 21, 1154–1160. [Google Scholar] [CrossRef]
  16. Shi, Q.; Chai, S.X.; Wei, L. Experimental investigation of water absorption and tensile properties of rice straw and wheat straw used for reinforced material. Chin. J. Undergr. Space Eng. 2016, 1, 1471–1476. (In Chinese) [Google Scholar]
  17. Cao, G.; Zhang, X.; Gong, S.; Zheng, F. Investigation on emission factors of particulate matter and gaseous pollutants from crop residue burning. J. Environ. Sci. 2008, 20, 50–55. [Google Scholar] [CrossRef]
  18. Miura, T.; Tou, M.; Murota, H.; Bono, M. The basic experiment on permeability characteristics of fiber drain. In Proceedings of the Annual Regional Meeting of JSCE; JSCE: Kyushu, Japan, 1995. (In Japanese) [Google Scholar]
  19. Tsapekos, P.; Kougias, P.G.; Vasileiou, S.A.; Treu, L.; Campanaro, S.; Lyberatos, G.; Angelidaki, I. Bioaugmentation with hydrolytic microbes to improve the anaerobic biodegradability of lignocellulosic agricultural residues. Bioresour. Technol. 2017, 234, 350–359. [Google Scholar] [CrossRef]
  20. Hasunuma, T.; Okazaki, F.; Okai, N.; Hara, K.Y.; Ishii, J.; Kondo, A. A review of enzymes and microbes for lignocellulosic biorefinery and the possibility of their application to consolidated bioprocessing technology. Bioresour. Technol. 2013, 135, 513–522. [Google Scholar] [CrossRef]
  21. ASTM (2008) D 4716; Standard Test Method for Determining the (in-Plane) Flow Rate per Unit Width and Hydraulic Transmissivity of a Geosynthetic Using a Constant Head. ASTM International: West Conshohocken, PA, USA, 2008.
  22. Mahmoudi, N.; Slater, G.F.; Fulthorpe, R.R. Comparison of commercial DNA extraction kits for isolation and purification of bacterial and eukaryotic DNA from PAH-contaminated soils. Can. J. Microbiol. 2011, 57, 623–628. [Google Scholar] [CrossRef] [Green Version]
  23. Singh, J.; Birbian, N.; Sinha, S.; Goswami, A. A critical review on PCR, its types and applications. Int. J. Adv. Res. Biol. Sci. 2014, 1, 65–80. [Google Scholar]
  24. JTS 206-1-2009; Technical Specification for the Technical Specification for Application of Plastic Drainboard for Port and Waterway Engineering. China Communication Press: Beijing, China, 2009. (In Chinese)
  25. Indraratna, B.; Nguyen, T.T.; Carter, J.; Rujikiatkamjorn, C. Influence of biodegradable natural fibre drains on the radial consolidation of soft soil. Comput. Geotech. 2016, 78, 171–180. [Google Scholar] [CrossRef]
  26. Deng, Y.B.; Xie, K.H.; Lu, M.M.; Tao, H.B.; Liu, G.B. Consolidation by prefabricated vertical drains considering the time dependent well resistance. Geotext. Geomembr. 2013, 36, 20–26. [Google Scholar] [CrossRef]
  27. Sun, L.; Liu, T.; Müller, B.; Schnürer, A. The microbial community structure in industrial biogas plants influences the degradation rate of straw and cellulose in batch tests. Biotechnol. Biofuels. 2016, 9, 128. [Google Scholar] [CrossRef] [PubMed]
  28. Bao, Y.; Dolfing, J.; Wang, B.; Chen, R.; Huang, M.; Li, Z.; Feng, Y. Bacterial communities involved directly or indirectly in the anaerobic degradation of cellulose. Biol. Fertil. Soils. 2019, 55, 201–211. [Google Scholar] [CrossRef]
  29. Wen, Z.; Liao, W.; Chen, S. Production of cellulase by Trichoderma reesei from dairy manure. Bioresour. Technol. 2005, 96, 491–499. [Google Scholar] [CrossRef]
  30. Wang, S.P.; Gao, Y.; Sun, Z.Y.; Peng, X.Y.; Xie, C.Y.; Tang, Y.Q. Thermophilic semi-continuous composting of kitchen waste: Performance evaluation and microbial community characteristics. Bioresour. Technol. 2022, 367, 127952. [Google Scholar] [CrossRef]
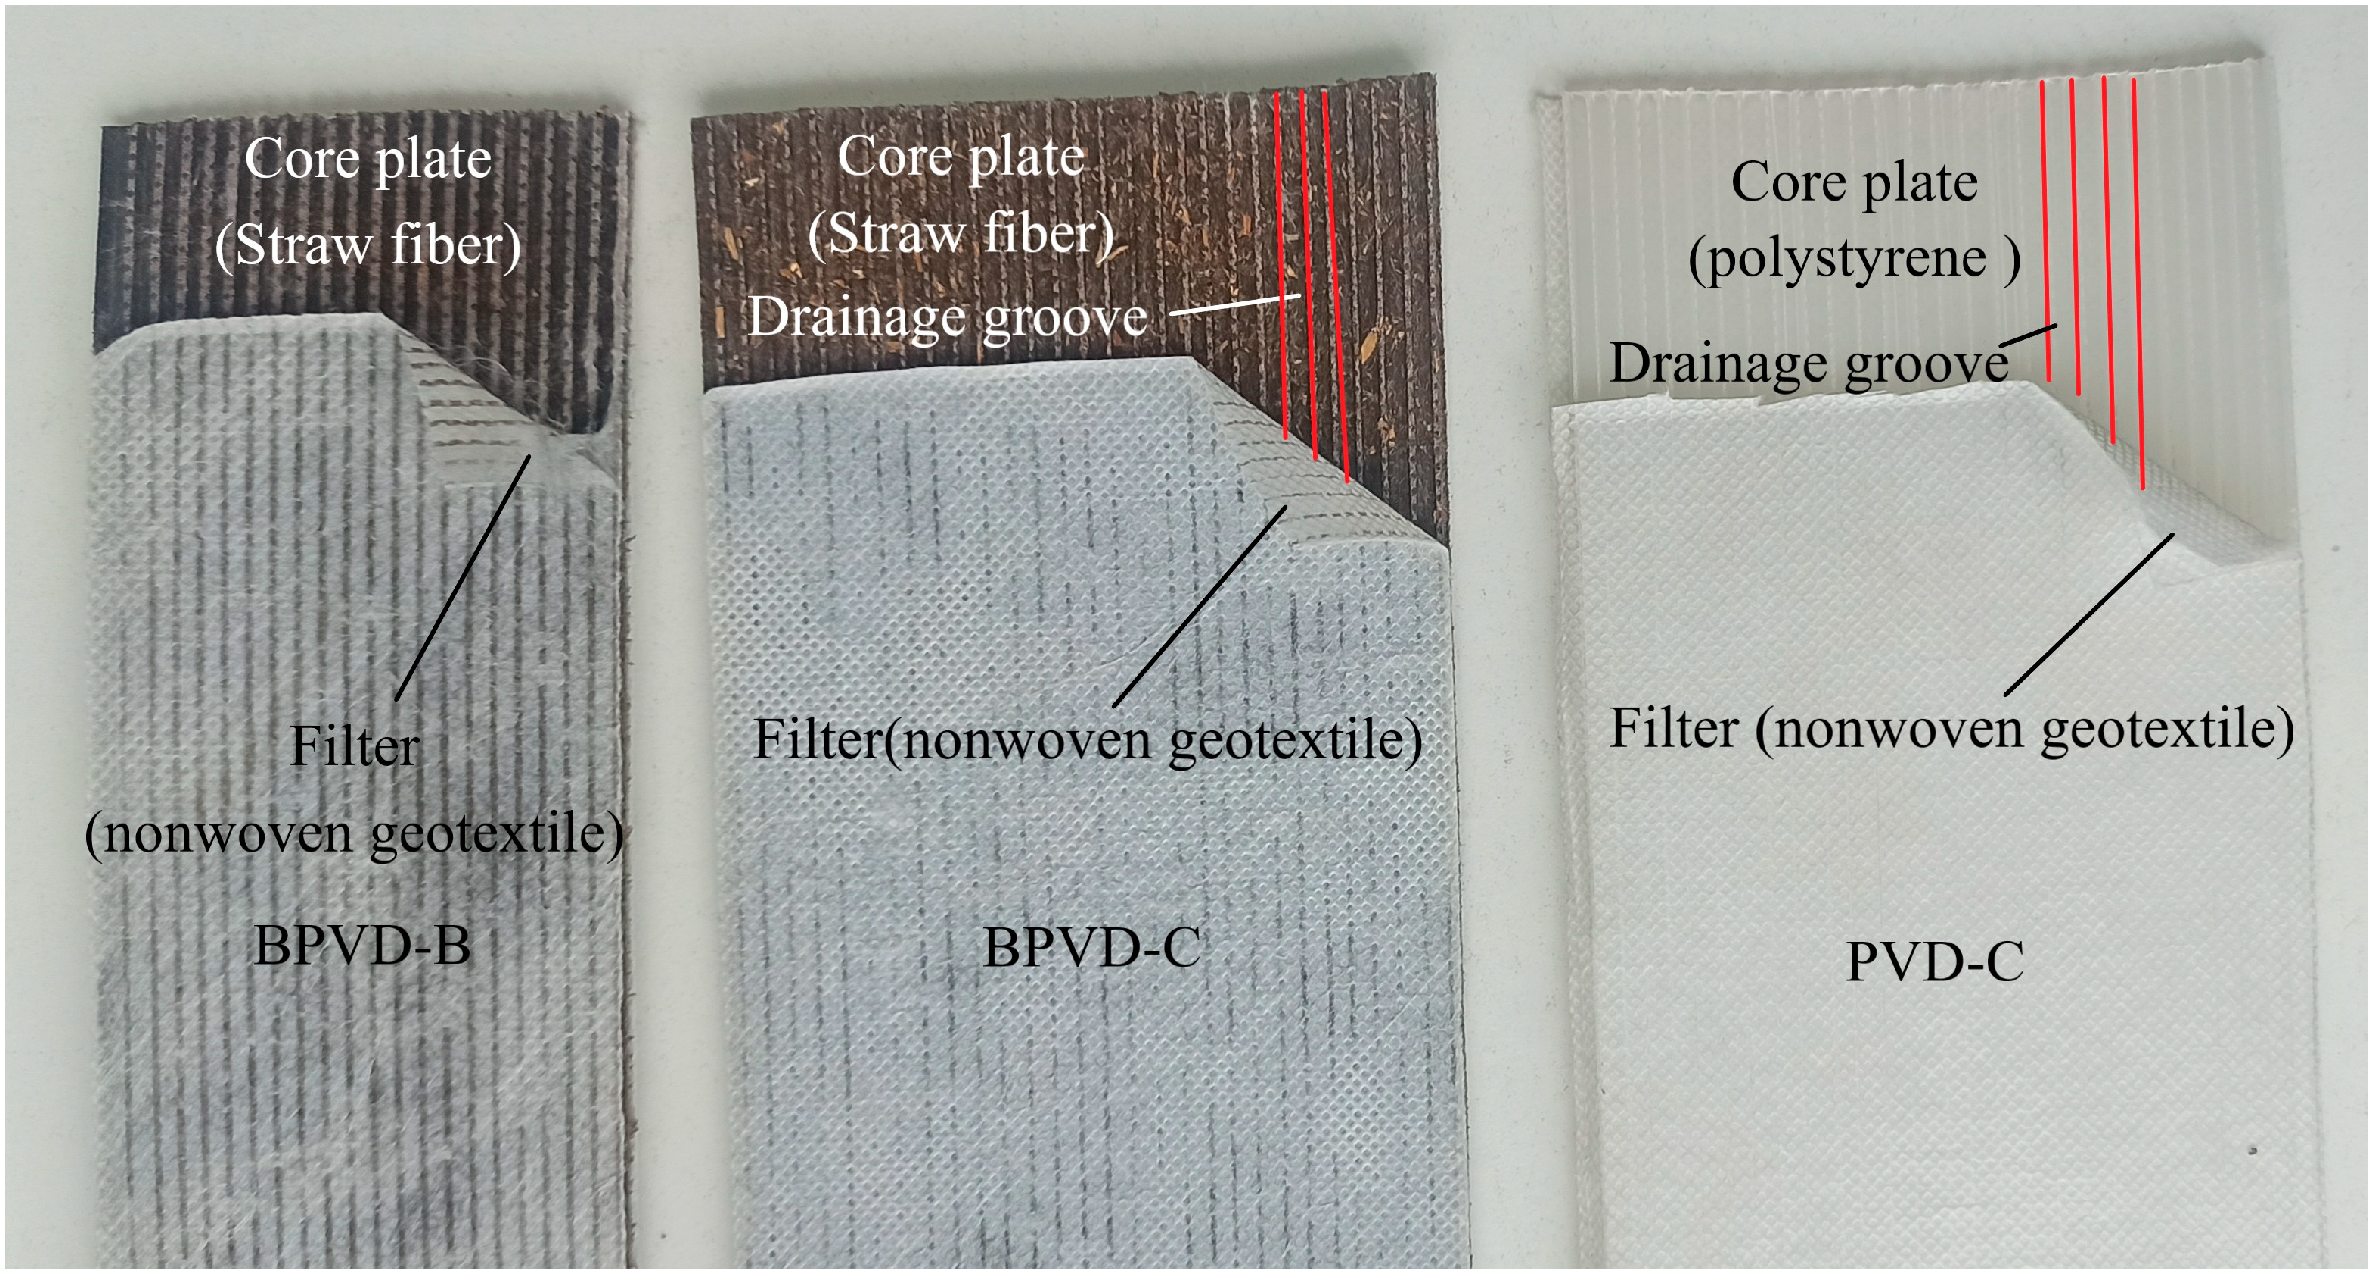
Figure 1. Diagram of straw drainage board.
Sustainability 14 16365 g001
Figure 2. Sketch of the discharge capacity testing device.
Sustainability 14 16365 g002
Figure 3. Tensile test of drainage board: (a) testing machine; (b) BPVD-B; (c) PVD-C; and (d) BPVD-C.
Sustainability 14 16365 g003
Figure 4. Sequencing process of the Illumina PE 250.
Sustainability 14 16365 g004
Figure 5. Variation in discharge capacity with time: (a) at 350 kPa; (b) at 150 kPa; and (c) at 75 kPa.
Sustainability 14 16365 g005
Figure 6. qw(t) = qw0(1 − at2) fitted curve.
Sustainability 14 16365 g006
Figure 7. Variation in tensile strength with time.
Sustainability 14 16365 g007
Figure 8. Variation in weight with time.
Sustainability 14 16365 g008
Figure 9. Surface morphology of the plastic drainage board: (a) before test; and (b) after test.
Sustainability 14 16365 g009
Figure 10. Surface morphology of the straw drainage board: (a) before test; and (b) after test.
Sustainability 14 16365 g010
Figure 11. The bacterial community in Soil (0 days): (a) distribution of bacterial phylum; and (b) distribution of bacterial genus.
Sustainability 14 16365 g011
Figure 12. Degradation rate: (a) discharge capacity; (b) tensile strength; and (c) weight.
Sustainability 14 16365 g012
Figure 13. Comparison of degradation rate.
Sustainability 14 16365 g013
Figure 14. Overall degradation rate: BPVD-B, BPVD-C and PVD-C.
Sustainability 14 16365 g014
Table 1. Performance requirements for biodegradable drainage board materials.
PropertyBPVD-BBPVD-CPVD-CNPVD 1 [11]NPVD 2 [11]NPVD 3 [11]
Core typeStraw fibreStraw fibrePolystyrene Coir strandsCoir strandsFlat coir mat
Filter typenonwoven geotextilenonwoven geotextilenonwoven geotextilewoven jutenonwoven jutewoven jute
Weight per m: g648957185165280
Width: mm70100100909090
Thickness: mm44491112
Drainage groove size (length × width/diameter): mm 3.5 × 23.5 × 23.5 × 2///
Filter permeability: cm/s7.35 × 10−47.35 × 10−47.35 × 10−42 × 10−31.4 × 10−32 × 10−3
Tensile strength: kN1.82.073.026.22.255.75
Discharge capacity (350 kPa): cm3/s42.0852.6589.461.950.71.95
Table 2. Physical properties of soils.
wn (%)GSρ0 (g/cm3)e0Sr (%)wL (%)Es (MPa)wp (%)c (kPa)ϕ (◦)Cv (10−3 cm2/s)
49.42.641.71.3398.3442.4627.25.41.91.61
Table 3. The dominant phylum, order, family, and genus of bacteria at depths of 6 m.
ClassificationBacteriaAbundance
PhylumBacteroidetes45.52%
Firmicutes50.15%
Proteobacteria2.59%
ClassClostridia41.89%
Bacteroides39.22%
Bacilli10.75%
FamiliesPrevotellaceae16.79%
Oscillospiraceae13.87%
Lachnospiraceae9.39%
Lactobacillaceae4.94%
Ruminococcaceae4.53%
GenusPrevotella13.47%
Rikenella4.29%
Bacteroides3.82%
Paraprevotella2.62%
Ruminococcus2.49%
Clostridium2.27%
Publisher’s Note: MDPI stays neutral with regard to jurisdictional claims in published maps and institutional affiliations.