Article

Simulation Evaluation of a Current Limiting Scheme in an Urban Rail Transit Network

1
School of Transportation Engineering, Dalian Jiaotong University, Dalian 116028, China
2
China Railway Beijing Group Co., Ltd., Beijingxi Railway Station, Beijing 100844, China
*
Author to whom correspondence should be addressed.
Sustainability 2023, 15(1), 375; https://doi.org/10.3390/su15010375
Submission received: 15 November 2022 / Revised: 12 December 2022 / Accepted: 20 December 2022 / Published: 26 December 2022
(This article belongs to the Special Issue Advance in Transportation, Smart City, and Sustainability)

Abstract

:
The formulation of the current limiting scheme of an urban rail transit network is a complex multi-objective planning problem as the effect of the current limiting scheme is unknown before implementation. In this article, a method combining discrete event simulation and agent simulation is used to study the simulation scheduling principle of the current limiting scheme, and a modeling method based on an abstract agent group is proposed. Based on the AnyLogic simulation platform, a meso-scale simulation model for evaluating the current limiting scheme of urban rail transit networks was developed, and a logical framework for the operation simulation of the intelligent group and urban rail network system with stations, passengers, and trains as units was constructed. Furthermore, the data exchanges between stations, trains, and passengers were controlled through discrete events of driving. The results show that the constructed simulation model can effectively replace the actual system to evaluate the current limiting scheme and reduce the computational redundancy of passenger agents flowing in the urban rail network system and the cost of model transformation.

1. Introduction

Recently, to achieve the goal of carbon neutrality and build a nationally efficient, environmentally friendly, and sustainable transportation system, countries worldwide have begun to actively develop urban rail transit businesses with large transportation capacities [1]. From the perspective of cities with existing urban rail lines, the uneven spatial and temporal distribution of passenger flows is the current situation faced by urban rail operating companies. Implementing a current limiting scheme is a common method for passenger flow control. A good current limiting scheme can balance contradictions in terms of safety, fairness of rides, train capacity, and all aspects of contradictions. However, the science behind it often needs to be verified and evaluated by simulation and modeling. At present, the research object of urban rail flow restriction schemes is gradually changing from the station level to the line network level.
In order to solve this problem, in a different manner than the station-level micro-simulation of passenger facility equipment capabilities and passenger behavior, this paper believes that the simulation evaluation model of the network-level current limiting scheme can adopt the research method of mesoscopic simulation. Focusing on designing and optimizing the communication mechanisms of various intelligent bodies, such as stations, trains, and passengers. Establish a streamlined and reliable discrete event scheduling system to ensure that the simulation model can still run efficiently under extremely large passenger flow. Additionally, it can adapt to the rapid secondary transformation in the case of line expansion and interruption.

2. Literature Review

To realize the effective control of passenger flows in an urban rail transit operation network, scholars have conducted a series of studies on the formulation, evaluation, and verification of the current limiting scheme. According to the different angles of studying passenger flow control methods, the related research on the design and simulation evaluation of the current limiting scheme is roughly divided into three levels: station, line, and network.
In terms of the design and research of the current limiting scheme, the passenger flow control of a single station aims to reasonably use the facilities and equipment nodes in the station to control the inbound passenger flow and the spatial distribution of the passenger flows in the station to match transportation capacity and transportation demand. Zhou et al. [2] built a passenger flow control model based on the linear quadratic optimal control theory to minimize passenger density on a platform. Wang et al. [3] used the flow entry rate quantitatively and established a collaborative passenger flow control model based on mathematical programming to minimize passenger flow delays. Based on system dynamics, Li et al. [4] defined the passenger flow mode and established a mathematical model of the passenger flow evolution of the internal facilities of the station. The multi-station passenger flow collaborative control of the line must consider the executable and synergistic flow control scheme of each station at the same time. By taking the passenger flow balance as the goal, Ren et al. [5] and Xue et al. [6] proposed a multi-station coordinated passenger flow control method for urban rail lines. Wang et al. [7], Yu et al. [8], and Chen et al. [9] established a mathematical programming model with the goal of minimizing the average passenger delay time to disperse the pressure of the oversaturated station to other stations to achieve the optimal state of the whole line. Zhao et al. [10] and Yang et al. [11] considered the objectives of minimizing delay loss, maximizing profit from passenger transport, and being fairest to establish a multi-objective programming model or a two-layer linear programming model. Research on network-level current limiting schemes focuses more on controlling complex passenger flow characteristics and congestion propagation in macro networks. Li et al. [12] used Fisher’s optimal segmentation method to determine a reasonable passenger flow control period and established a line passenger flow collaborative control linear programming model to minimize the total passenger waiting time and maximum passenger flow turnover. To minimize the total delay time of passengers and the control intensity of each station, Li et al. [13] and Zhang et al. [14] proposed a multiline collaborative passenger flow control model for an urban rail transit network. Lu et al. [15], Chen et al. [16], Zhou et al. [17], and Lu et al. [18] combined specific passenger flow control methods to build a planning model for the collaborative optimization of passenger flow control by means of station skipping, large and small crossings, connecting bus line adjustments, and train schedule adjustments.
In terms of the simulation evaluation of the current limiting scheme, there are many studies on the verification and evaluation of the passenger flow control effect of a single station. Most are based on station discrete event micro-simulation [19,20,21,22,23,24] and system dynamics simulation [25] to study the relationship between station passenger facilities and equipment capacity, transportation capacity, and passenger flow level. The verification and evaluation of line-level passenger flow control effects include coordination analysis [26,27] and line load deduction [28]. Simulation research at the network level often focuses on the situational deduction of congestion propagation caused by the uneven distribution of passenger flows in the network or during emergencies [29,30,31,32]. There are a few related studies on the simulation evaluation of specific network current limiting schemes [33]. This difficulty is mainly reflected in the large number of stations and passengers with different characteristics at the network level, the logic of changing passenger flow being relatively complex, and the computational load of the simulation model being large. It is difficult to realize the data tracking of the flow process of individual passengers in an online network. Even if the simulation evaluation of the current limiting scheme of a specific rail network is realized, when the stations, lines, and other facilities are renovated or new lines are built in the network, the model may need to be rebuilt.
To sum up, this paper is based on the research results and future research prospects of the urban rail network layer restriction process and simulation evaluation. Based on the time-based current limiting scheme of the urban rail transit network, a method combining discrete event simulation and intelligent body simulation is adopted. Study the scheduling principle of the simulation of restricted flow scheme, and design a modeling method based on abstract agent group. Finally, based on the above theory, Relying on the AnyLogic simulation platform to customize the development of a mesoscopic simulation evaluation model for the current limiting scheme of Dalian’s urban rail network, and the effectiveness and practicability of the model are verified by specific examples.

3. Methods

3.1. Discrete Event Scheduling Method for Simulation Model of the Current Limiting Scheme in Different Periods

Congestion is the product of the contradiction between supply and demand, and its specific manifestation are the phenomena of queues and delays caused by insufficient supply capacity. Urban rail transit passenger flows have complex characteristics, such as non-equilibrium, non-steady state, and nonlinearity, which are mainly manifested in the diversity of passenger flow origin and destination distribution, randomness of arrival time, and limitation of station and train capacity. The key to formulating the flow restriction plan is to start from the core element of the capacity bottleneck, map out the passenger flow sources passing through the capacity bottleneck area, and control the source station in a targeted manner to construct an effective flow restriction plan. Therefore, a simulation evaluation model should be constructed based on the key discrete events of passenger flow control in the line network and the accumulation and propagation mechanism of passenger flow in the rail transit network and the source, evolution, while the influencing factors of passenger flow congestion should be considered as the basis for the identification of control points. As such, there is a need to classify related discrete events and design the structural order and content of future event tables.

3.1.1. Description of Current Limiting Scheme

The essence of formulating the urban rail transit network flow restriction plan is to consider the impact of complex passenger flows on network congestion points and adjust them based on the time and space distribution of passenger flow demand, which is a type of “peak shaving” strategy. Based on the results of the passenger flow distribution, it is often necessary to analyze the internal relationship between the incoming passenger flow at a station and the passenger flow through the section and study the correlation between the bottlenecks of the line network capacity, the coordination of passenger flow control among multiple stations, and the transferability of demand between control periods. The OD of the incoming passenger flow at each station is analyzed here to determine the proportion of inbound passenger flow passing through each section and the proportion of passenger flow originating from each station. Taking a simple two-line intersecting urban rail transit network as an example, the description of the problem is shown in Figure 1.
Among the line intersections, S 3 is the transfer station; N 1 and N 2 , respectively, represent the safety capacity of trains on the two running lines; the controllable variable n i includes the train safety capacity and the platform flow limit; and the unit can be the number of passengers or the ratio. The rectangle below S i is the current number of passengers gathered at the station. The accumulated rectangles with different heights and different fillings above the trains in the section are the size of the boarding passenger flow at each station ahead of the operation, indicating the composition of the current train passenger flow. The decision variable is the optimal inbound passenger flow or flow restriction rate of station i within the flow restriction period Δ t (ratio of restricted flow to inbound demand).
The determination of the current limiting period a, from the perspective of operations research, this is a multi-stage decision-making problem about collaborative current limiting. The division of the current limiting period directly affects the implementation effect of the current limiting scheme. If the time granularity is too small, it is not conducive to implementation, and if the granularity is too large, it cannot meet the security precision requirements. In various studies of actual city network operation and current limiting schemes, most of the divided periods Δ t are concentrated in 15 min or 30 min.
It can be seen that for any running direction in the network, when the passenger flow of getting off at each station of the rail transit line is small and the passenger flow of getting on the train is large, from a macro perspective, the passenger flow is cumulatively spread along the line with the train as the carrier, and the safety risks brought about by the crowded passenger flow will also spread along the line. Among them, the transfer passenger flow will also spread congestion and risk to other lines in the network. To sum up, the ultimate goal of formulating the current limiting plan is not only to secure that the passenger flow density in the platform, and that the train meets the safety requirements, but also to maximize the transportation efficiency of the enterprise. At the same time, considering the fairness of passengers waiting for flow limitation, a reasonable flow limitation time period and corresponding flow limitation for each station in the urban rail network are given.

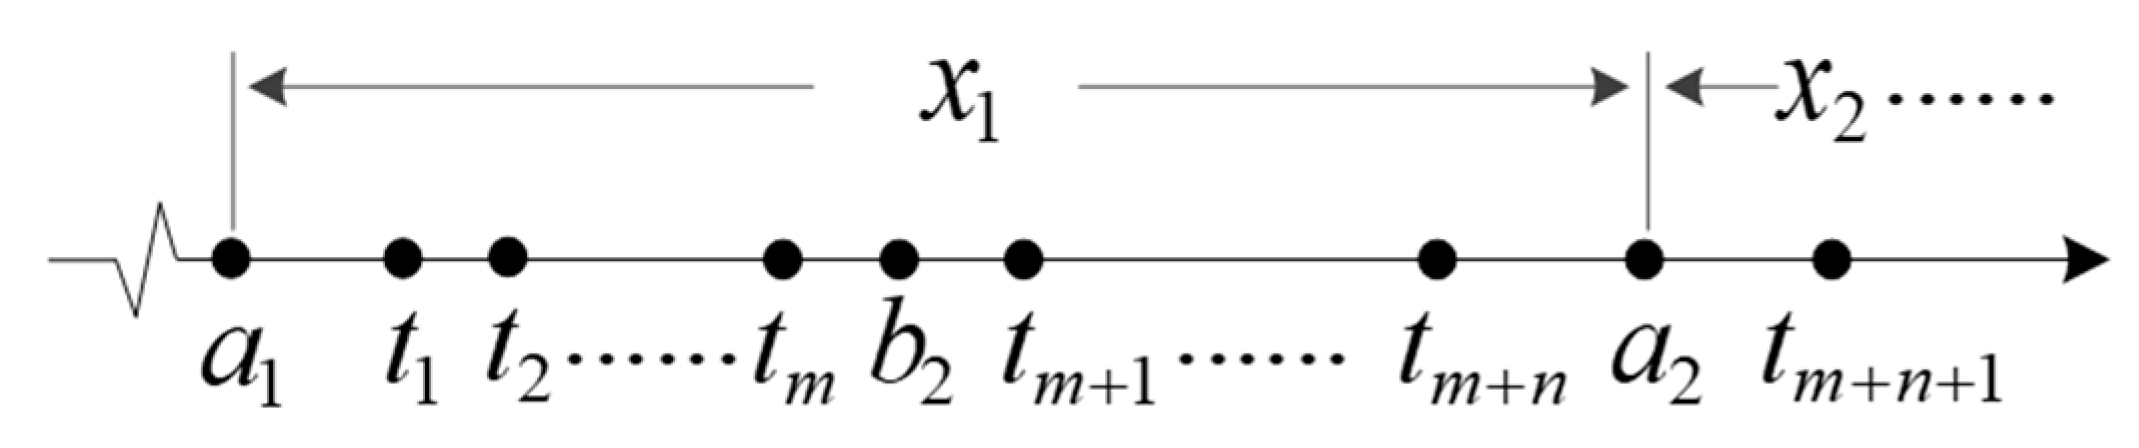
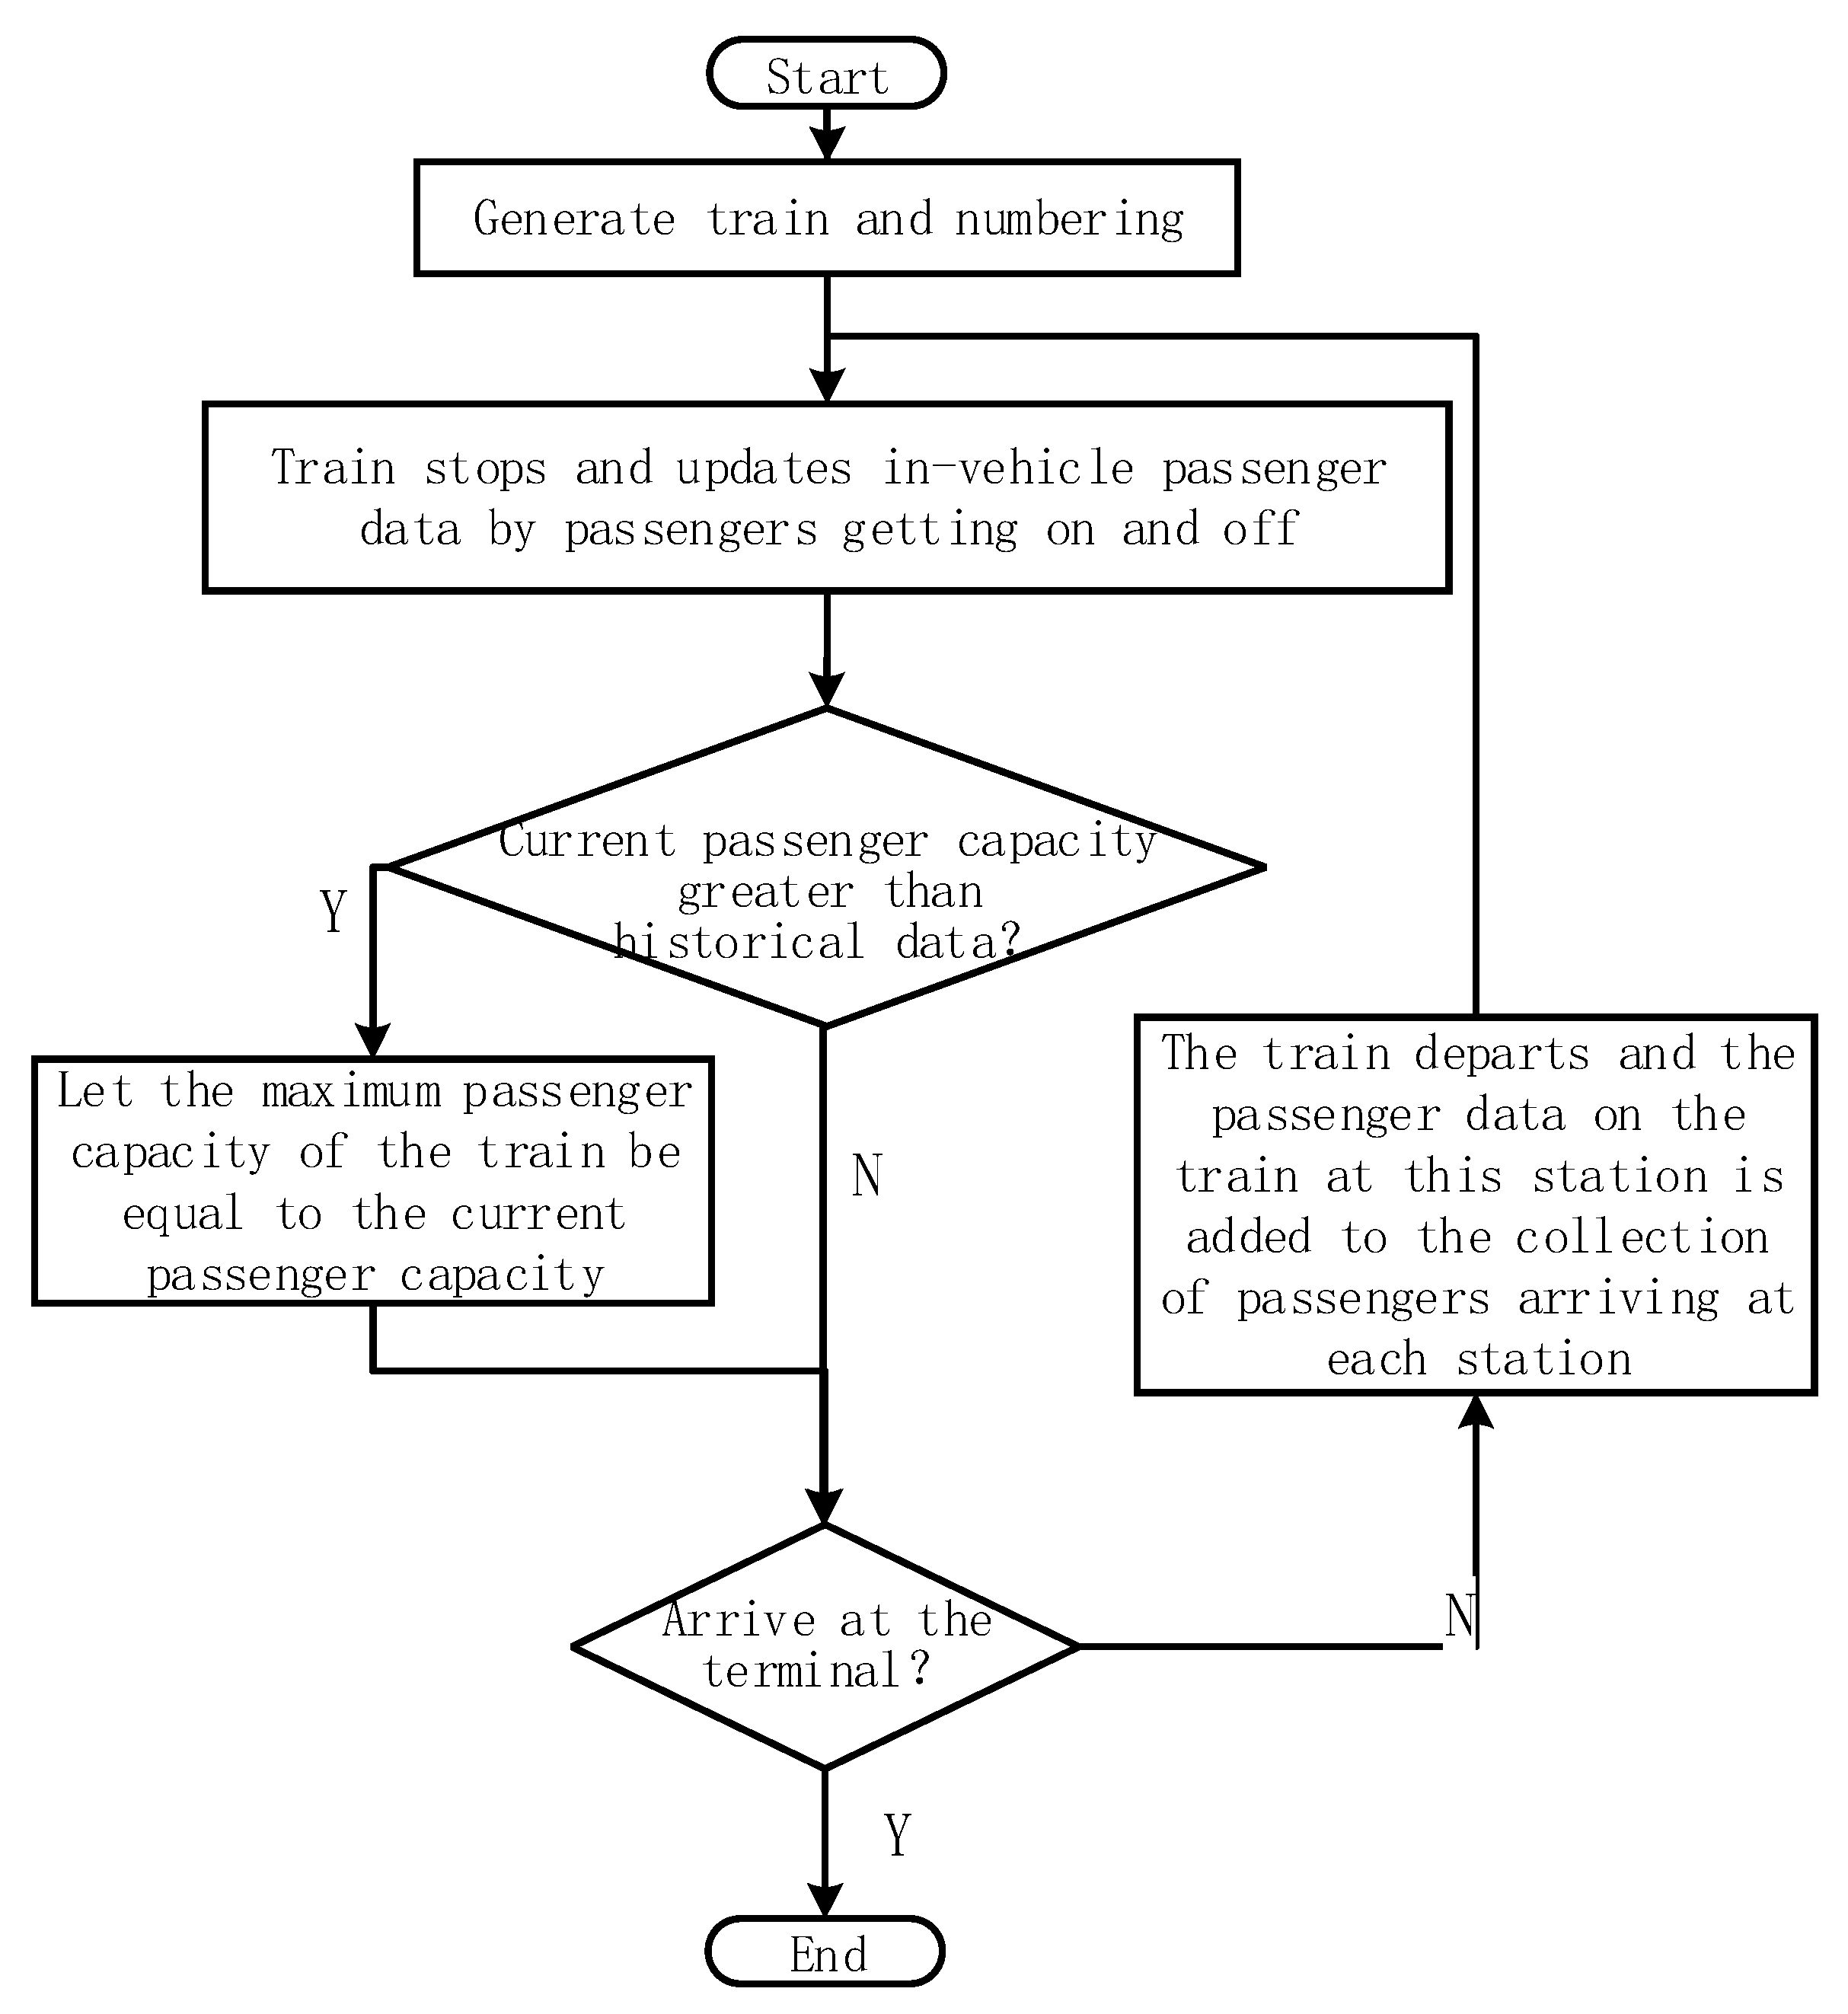
3.1.2. The Principle of Simulation Scheduling of the Current Limiting Scheme

In the process of implementing the current limiting scheme, different station passenger flow states have different scheduling system events. Taking the current limiting period of a transfer station in the line network as an example, the simulation logic model of passenger flow control is shown in Figure 2.
Among them, passengers who arrive at the station after t m need to wait outside the station, and passengers who arrive at the station during the train stop time can get on the train. If b i happens before t m , all the passengers who arrive at the platform of the train get on the train, and there is no waiting time from a i to b i at the station. If b i happens after t m , all passengers arriving on the platform of the train will get on the train, and the passengers waiting outside the station will be released into the station one after another, until the sum of the number of people entering the station and the number of passengers waiting to transfer in the station reaches the limit of the station. The station generates waiting time from a i to b i . If a 2 time x 2 < x 1 and n > x 2 , the default time for the next time passengers will enter the station is time b i and later. The conditions for allowing passengers enter the station at and after time a 2 are:
{ x 2 > x 1 x 1 < n < x 2 o r { x 2 > x 1 n < x 1 o r { x 2 < x 1 n < x 2
According to the above passenger flow control logic, the future event table of the simulation model is composed of two basic events: each passenger arriving at the station and train arriving. According to the movement logic of passengers in the network, the basic events of the passengers arrival can be subdivided into four types: arrival of up-transfer passengers, arrival of up-link non-transfer passengers, arrival of downlink passengers, and arrival of downlink non-transfer passengers. The arrival of passengers at each station obeys a nonstationary Poisson distribution with different mean values, and the running and stopping times of each train are based on the train running diagram. For example, at time b i , when a train arrives, the passengers waiting on the side of the platform will be boarded, and data exchanges between the train and the station and between the station and the station need to be conducted; at time a 2 , the arrival rate of passengers at all stations in the urban rail network will be refreshed. The current limit number for each station is thus re-assigned.

3.2. Logic Model of Passenger Flow Control in Rail Transit Network

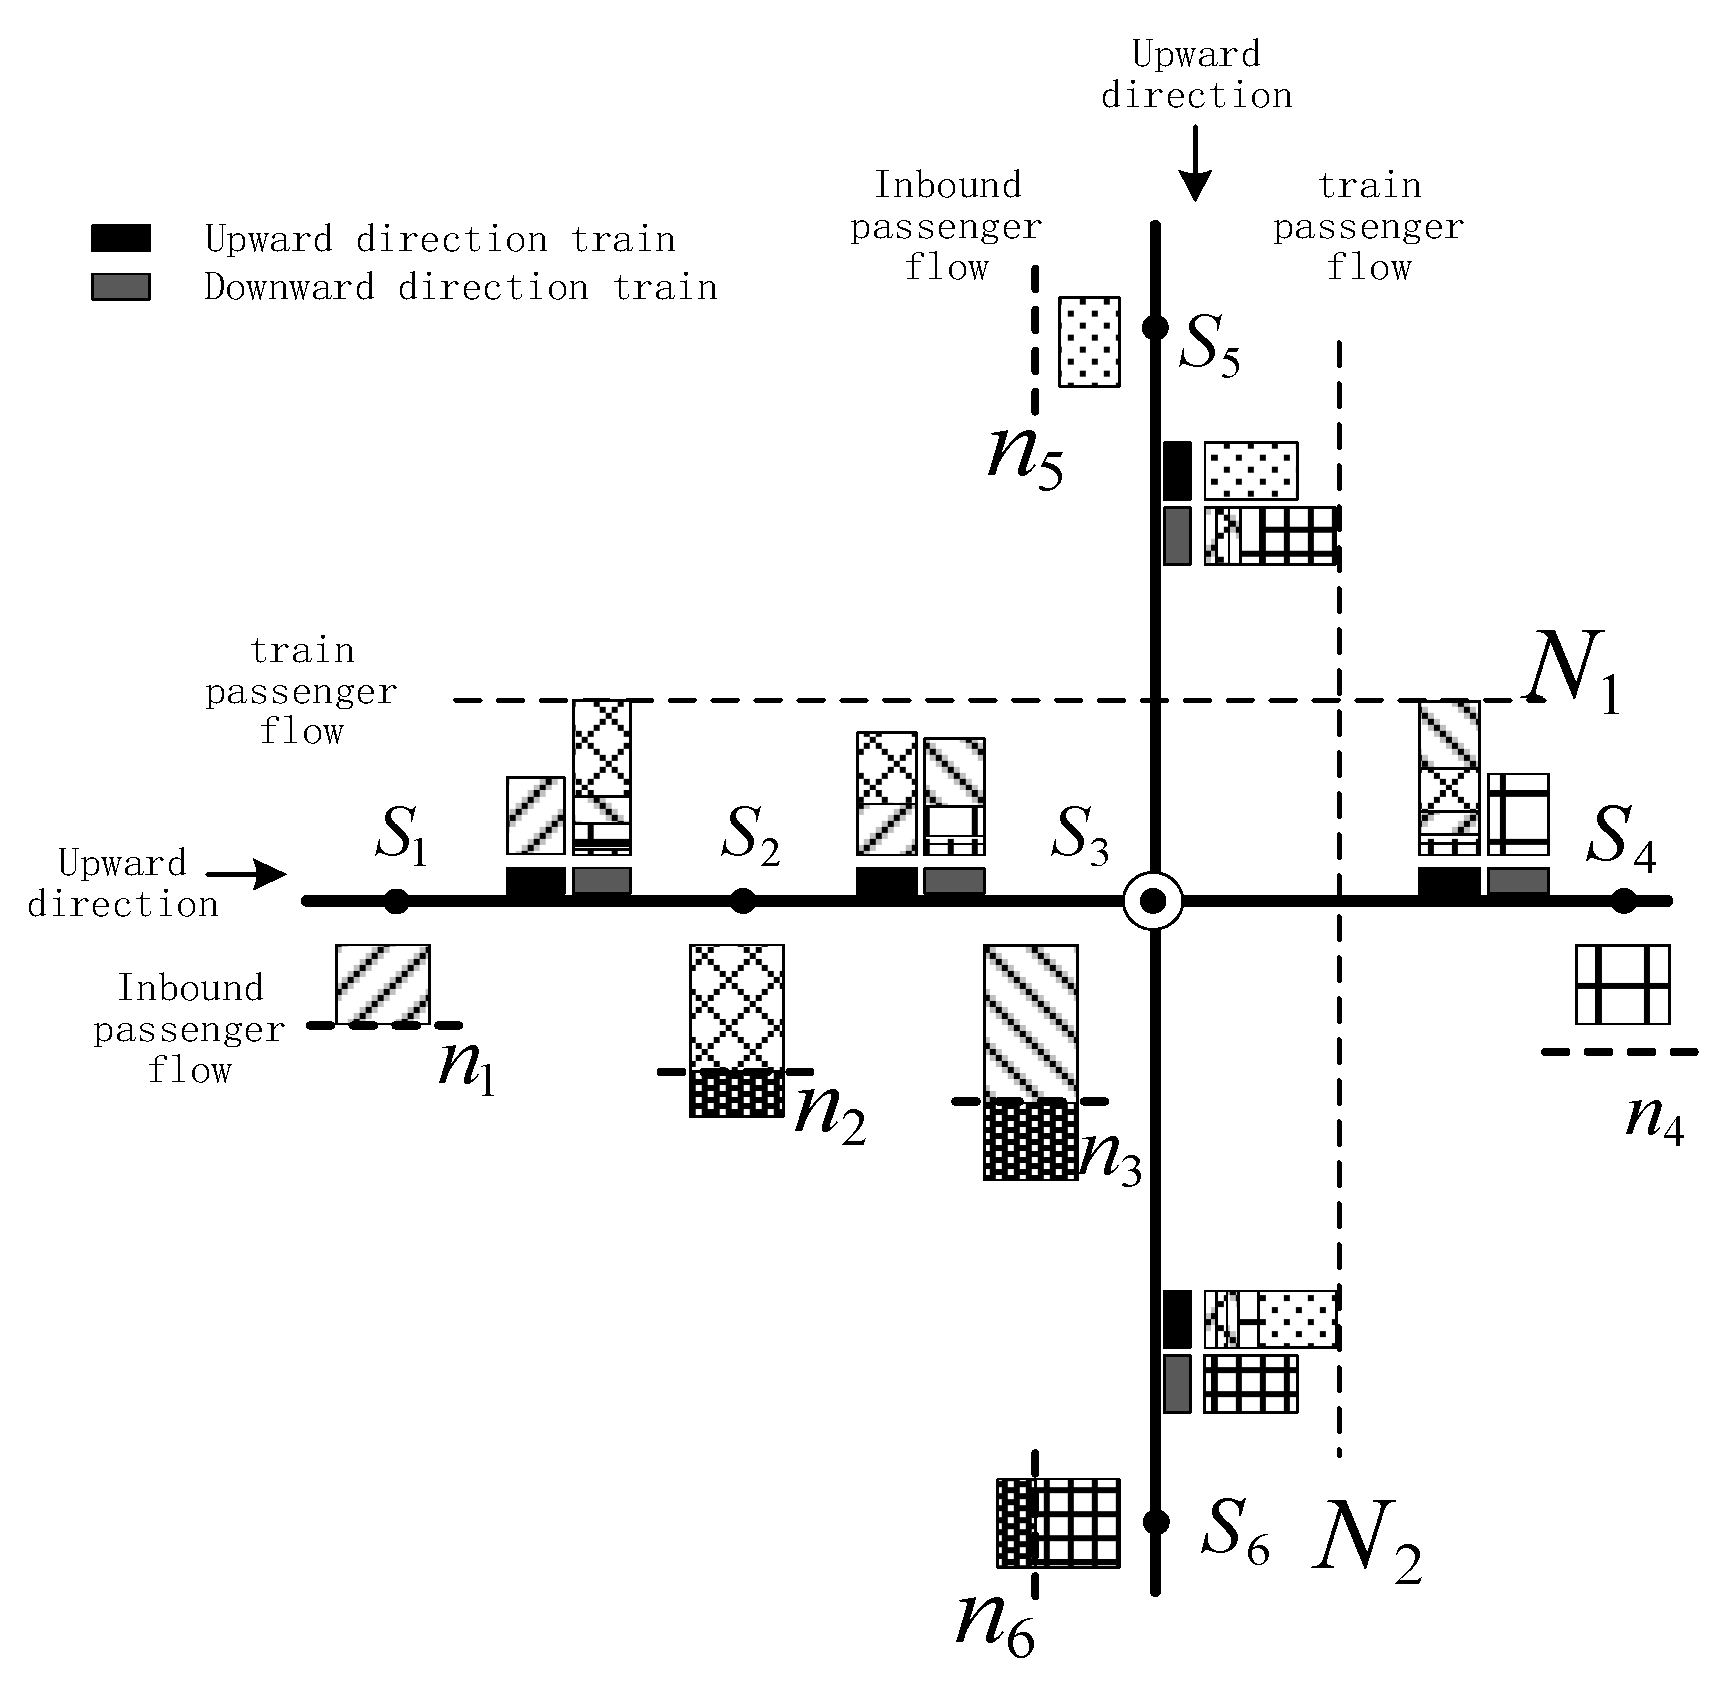
3.2.1. Problem Statement

The corresponding simulation logic models are also different for passengers with different OD characteristics. Taking the Beijing urban rail system as an example, as of December 2020, there were 24 lines in the Beijing urban rail system, with a total of 428 stations, including 64 transfer stations. At the transfer station, if a different logic model is used to describe the flow of all passengers in the network, at least 428 passenger source modules are required, and 182,756 passenger OD logic models of 427 × 428 need to be designed. Therefore, the transfer logic is more complex. The workload of such simulation programs and model development is enormous and bound to cause computational redundancy. Therefore, in this study, an abstract station agent group is established to store the status data of each station in the line network during the discrete event simulation process, based on which the single-source control of passenger and train arrival events at each node in the network is realized. The agent and train agent groups also facilitate the data statistics of stations, trains, and passengers in the simulation process.

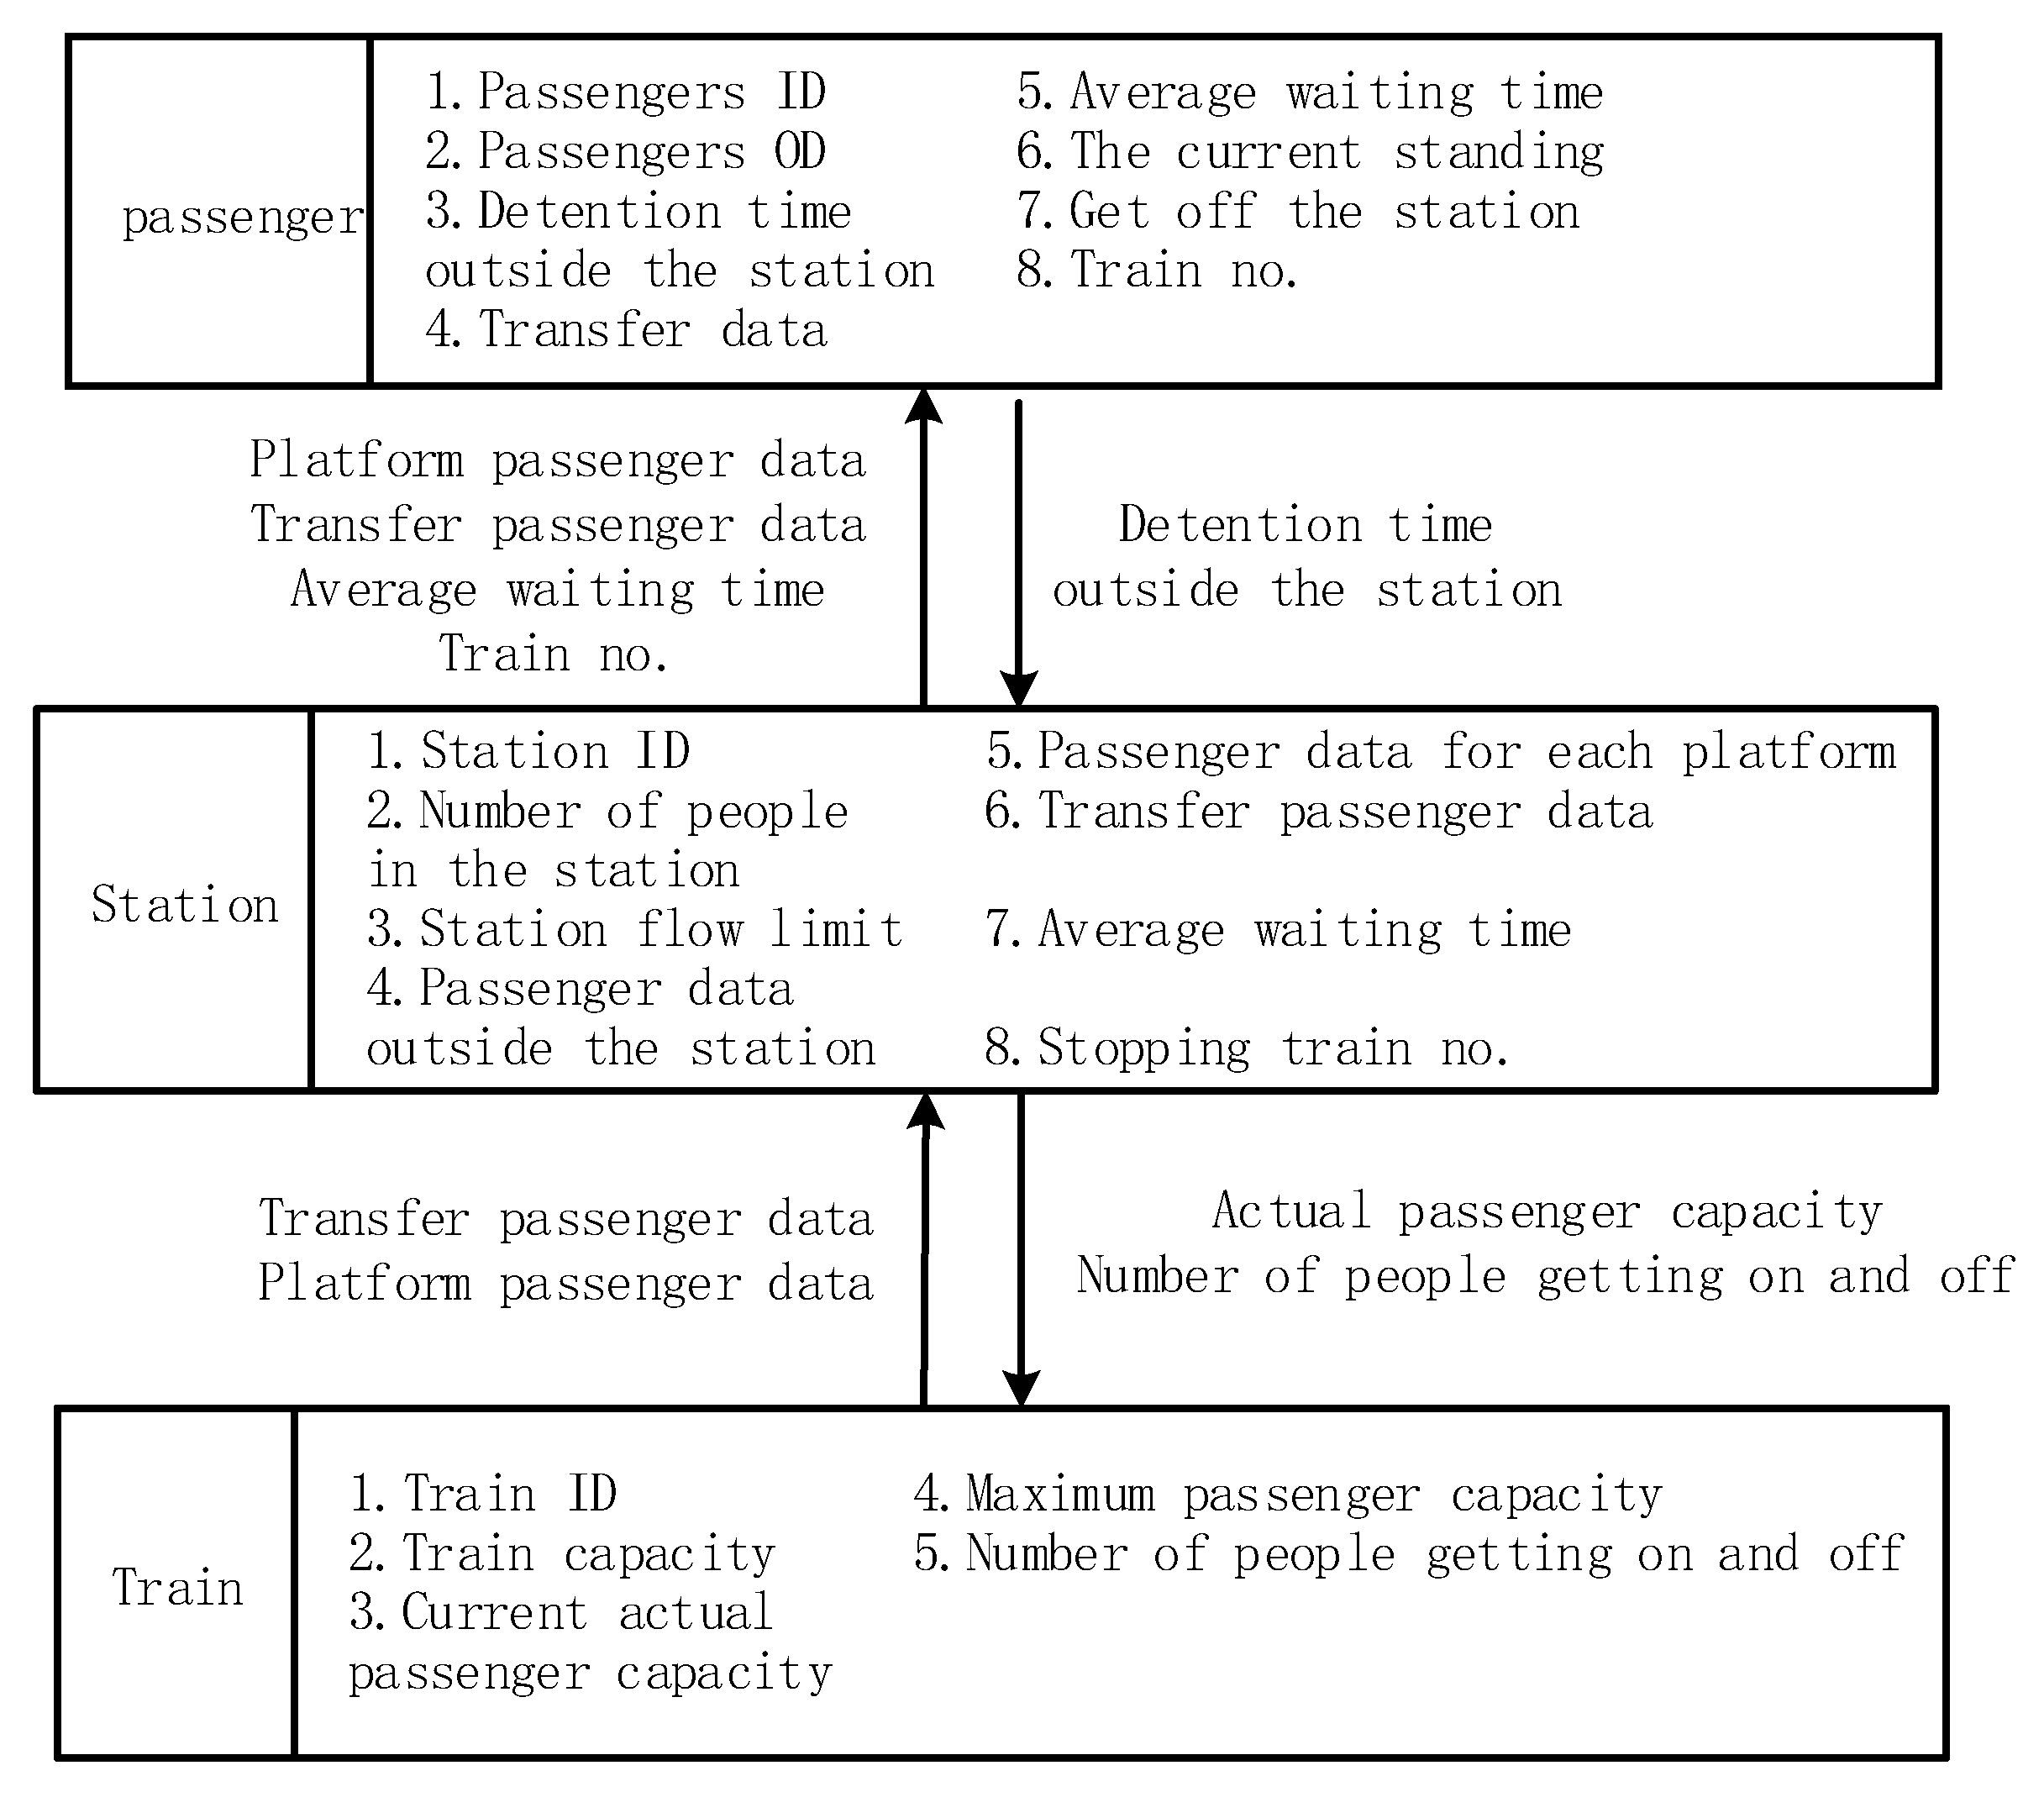
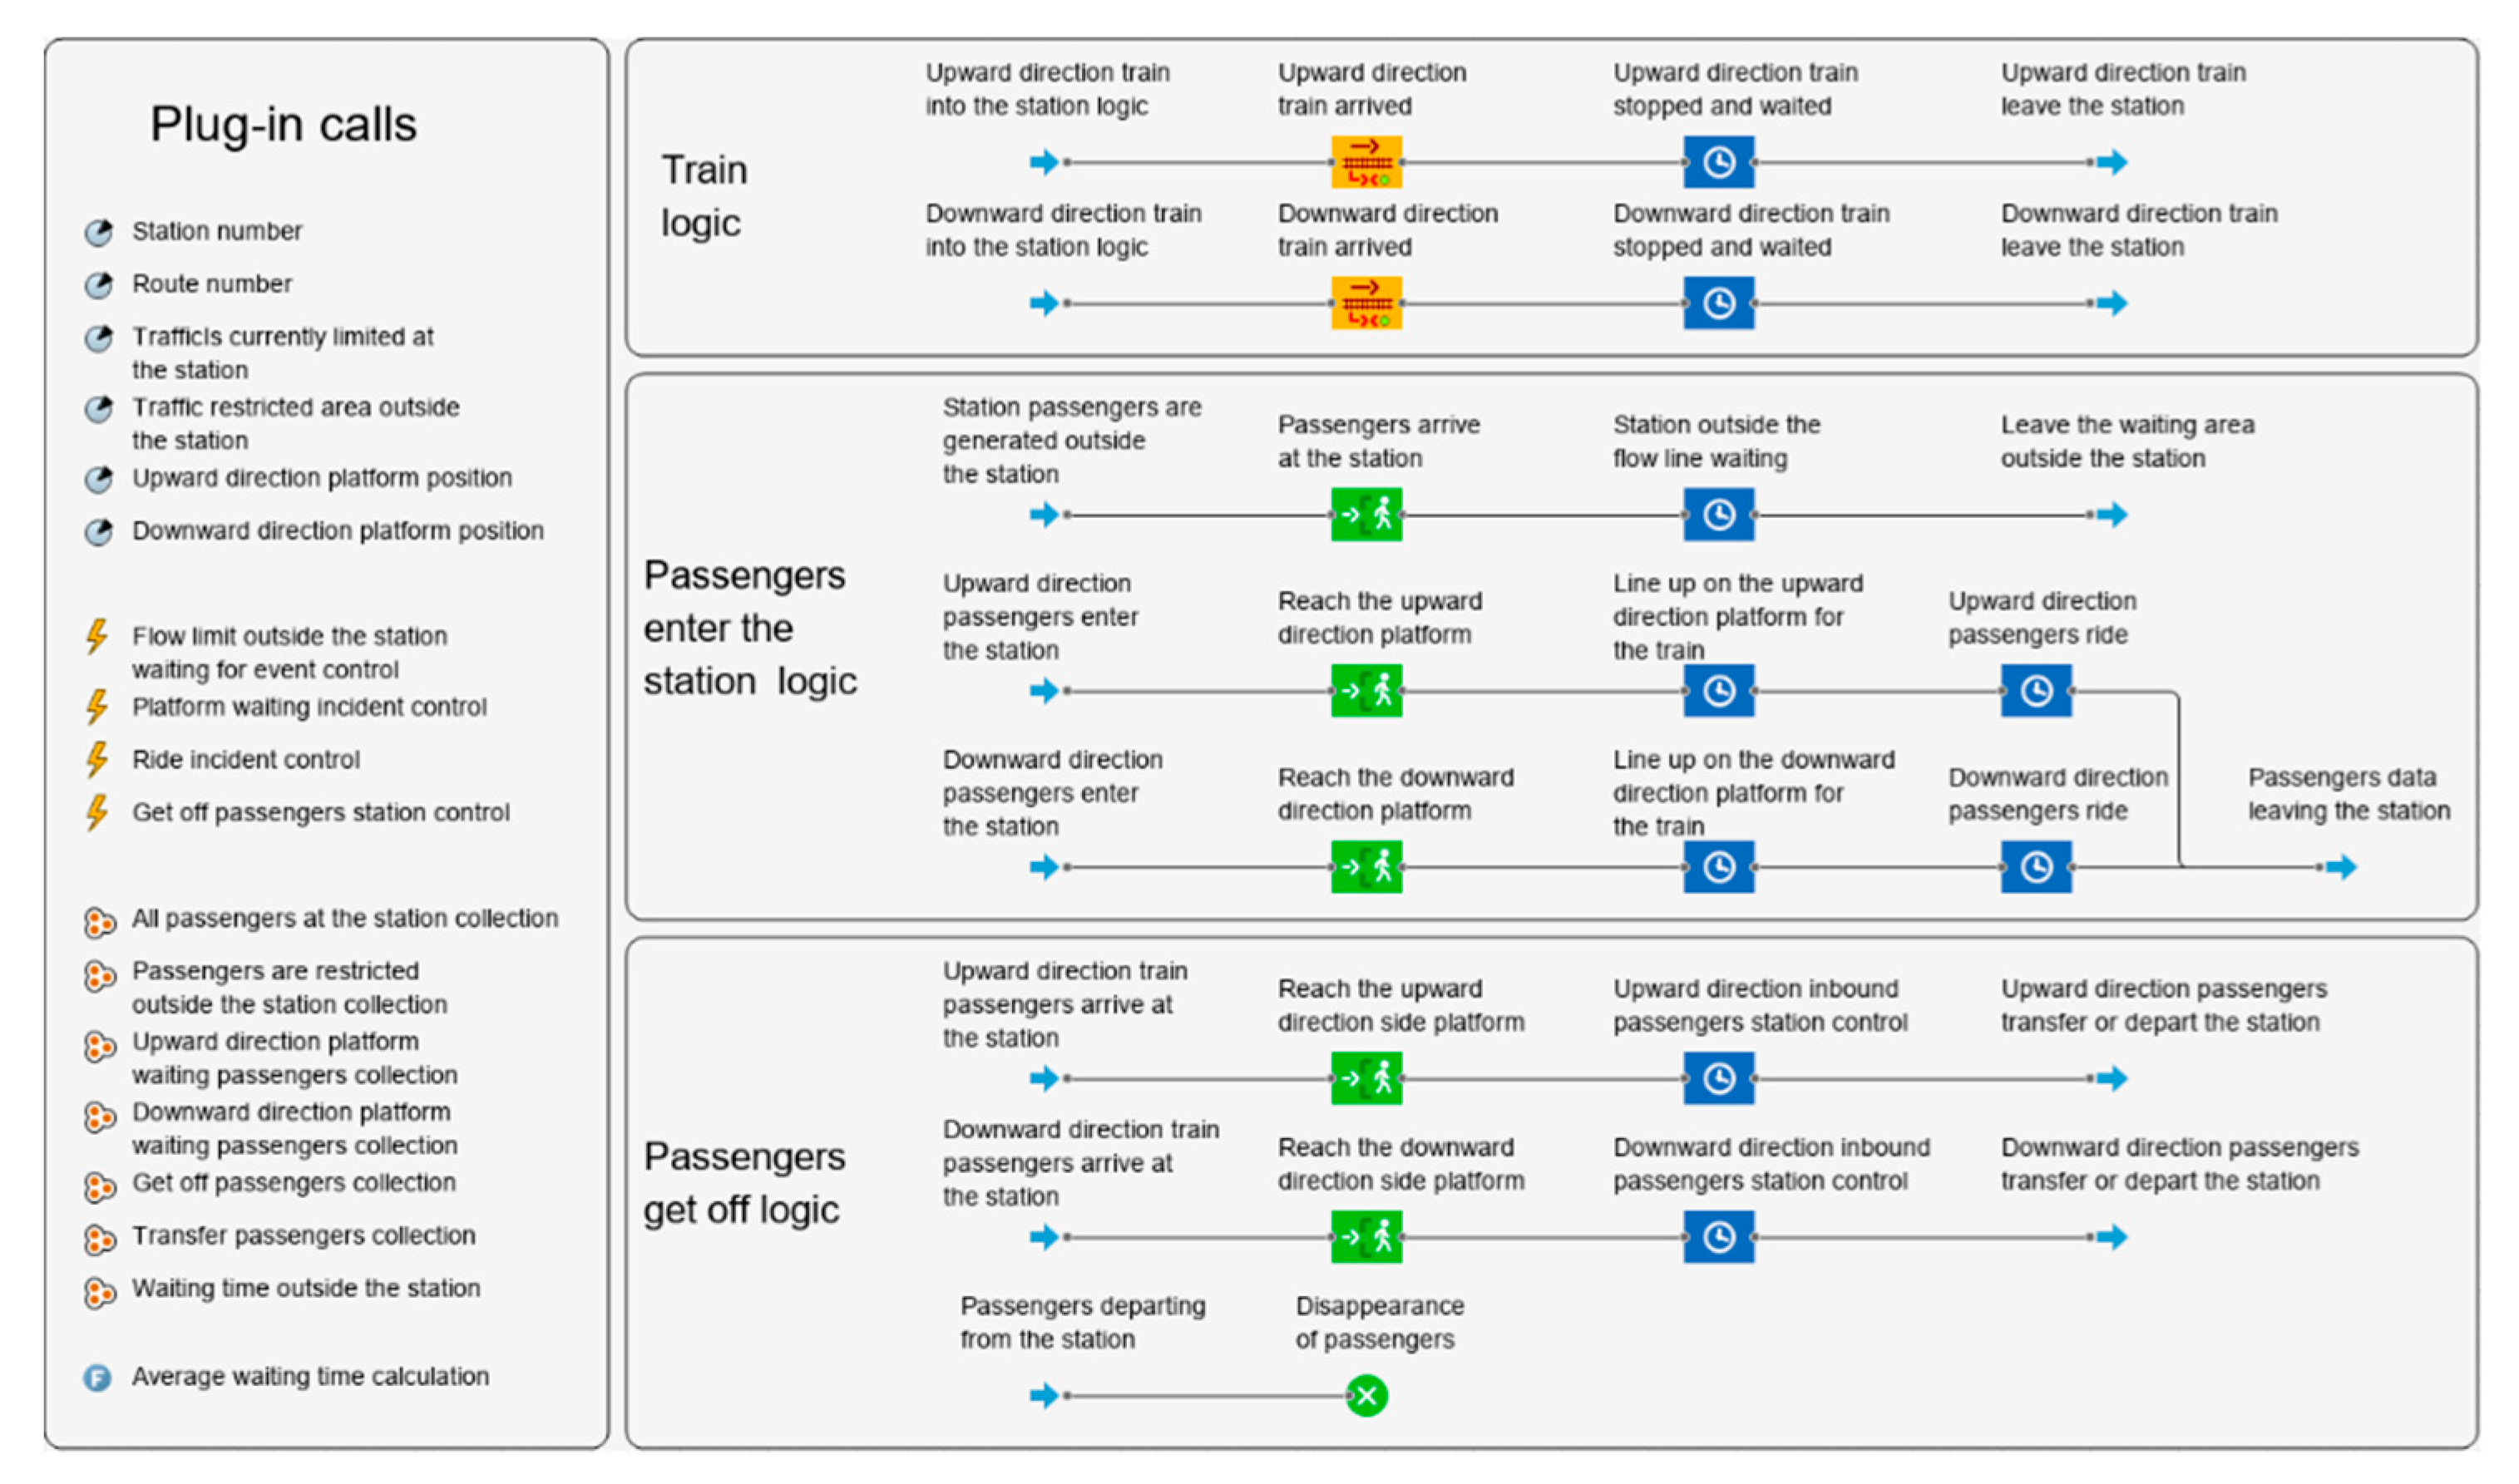
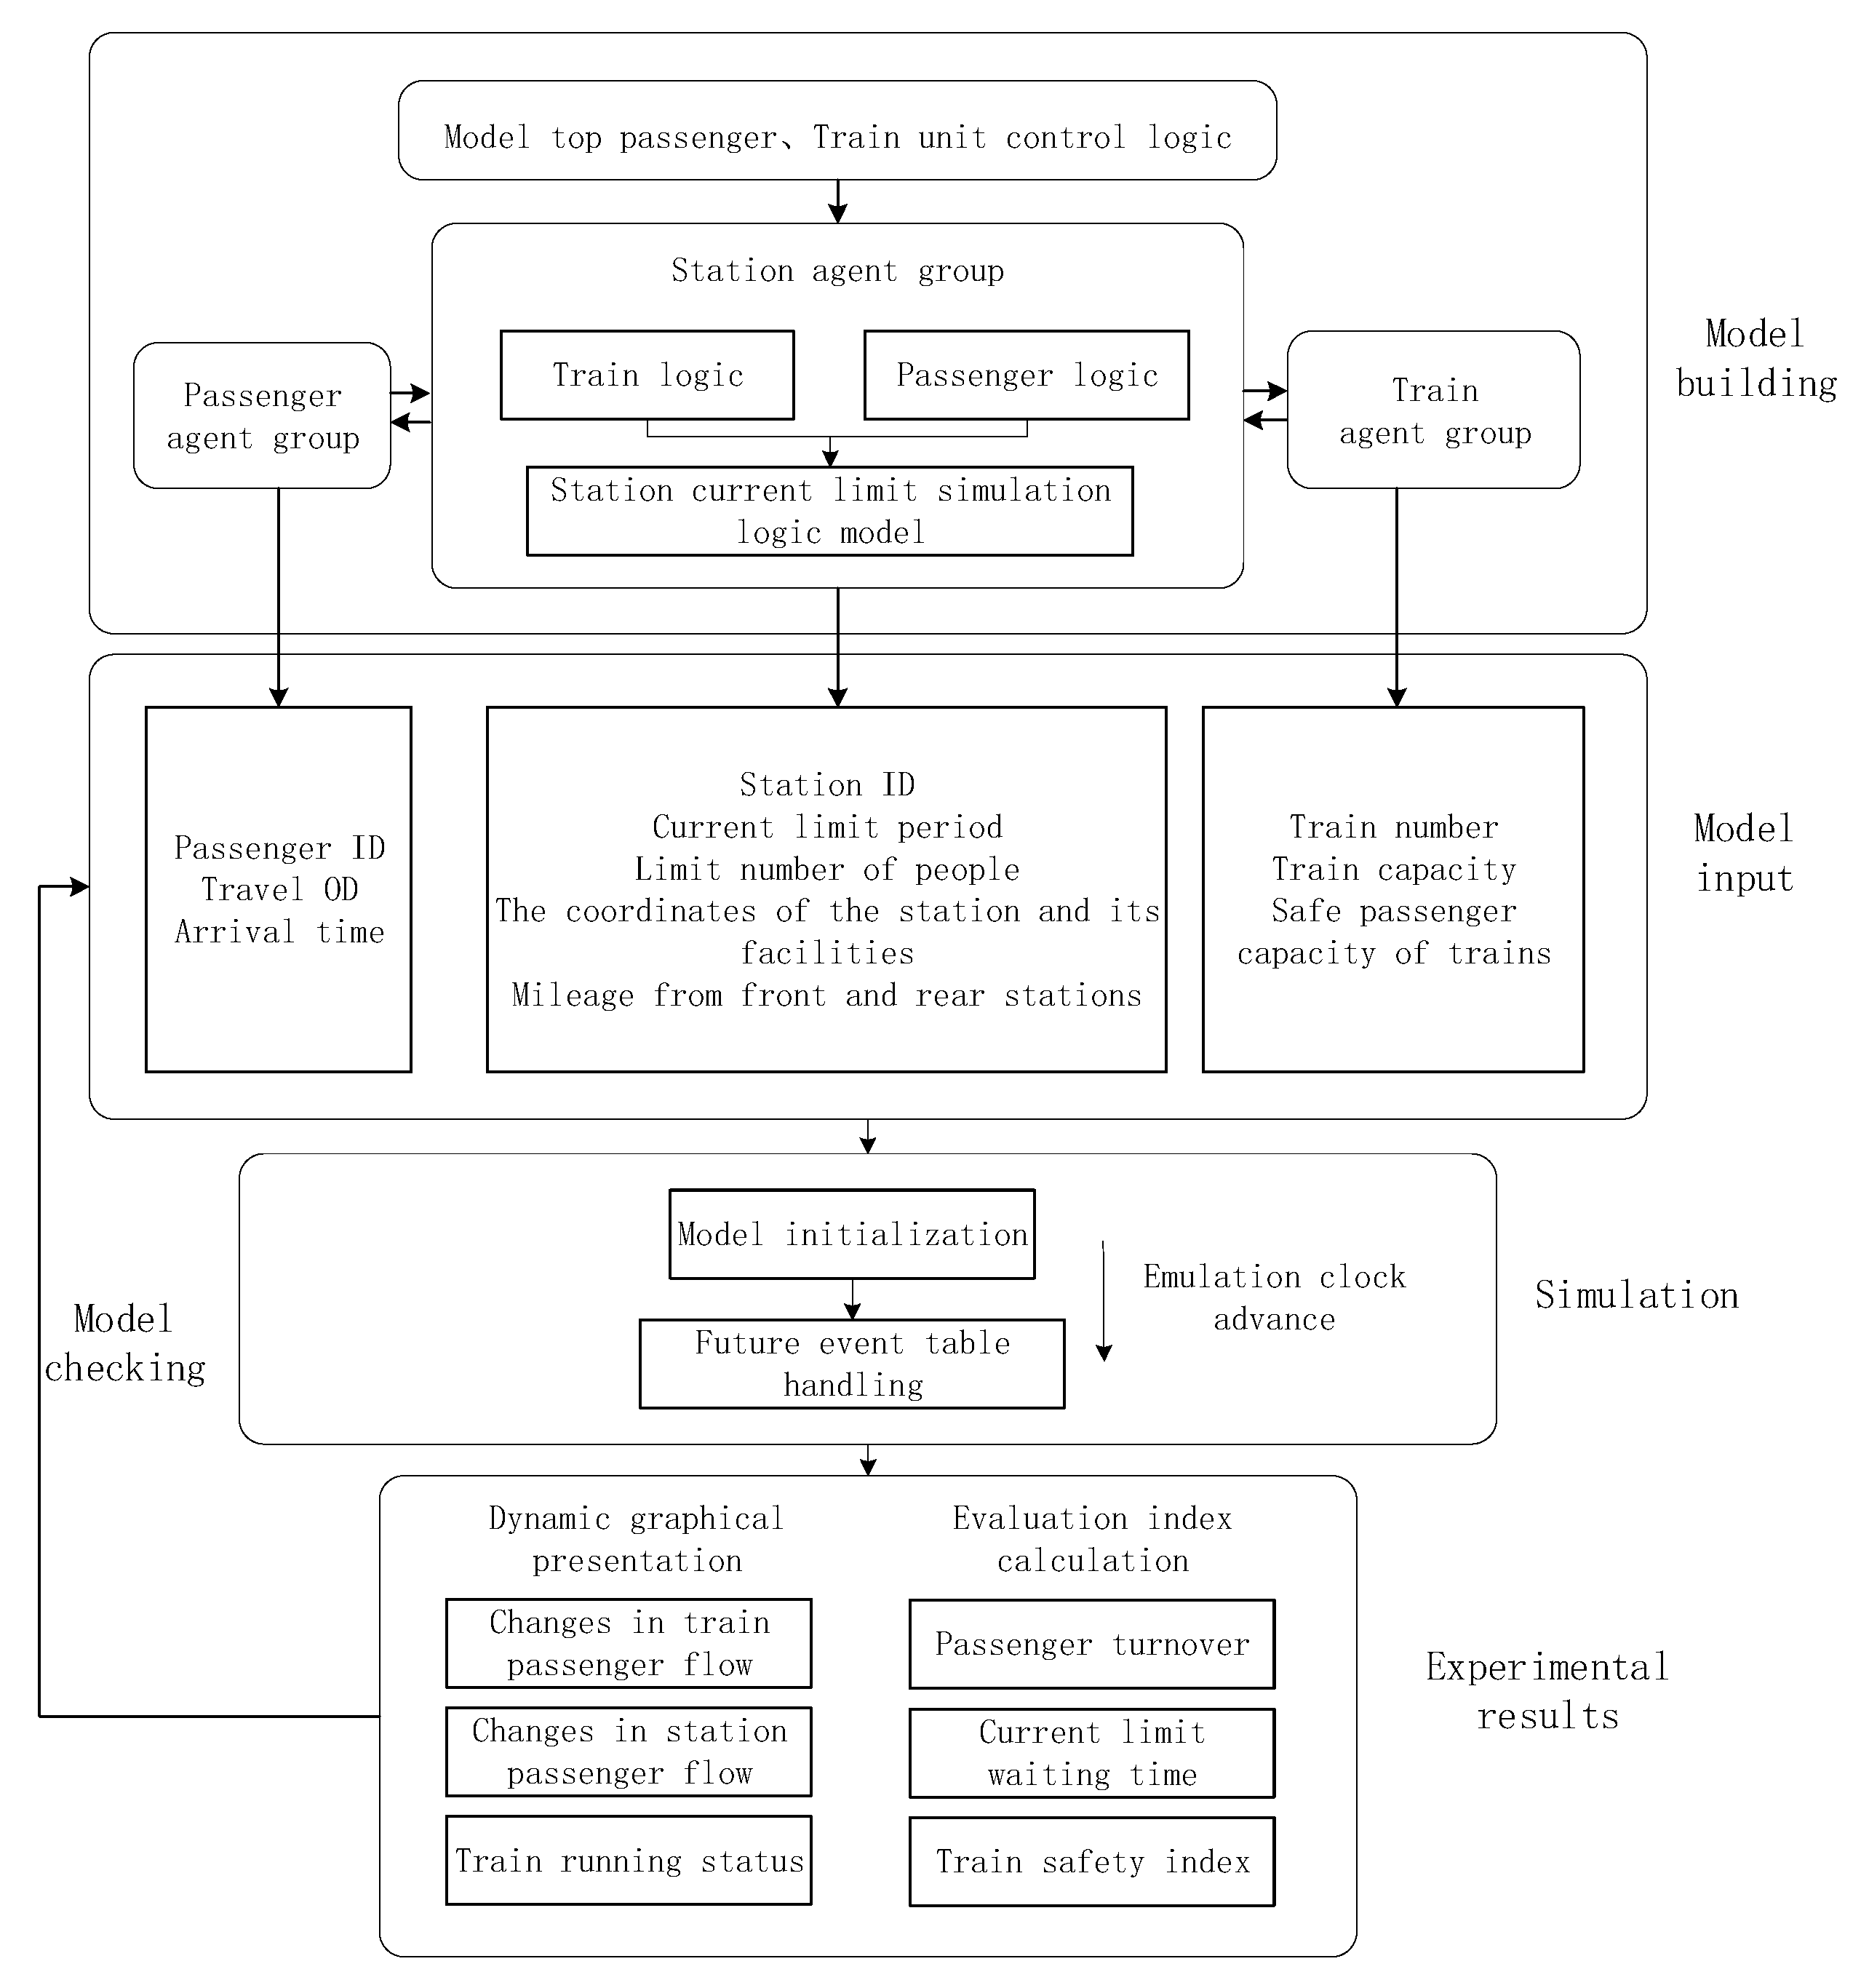
3.2.2. The Establishment of an Abstract Agent Group

For the mesoscale simulation evaluation model of the current limiting scheme for the line network, it is not necessary to pay too much attention to the details of the activities of passengers in the station and the line network, but the accuracy and validity of the data statistics in the current limiting process should be considered. Therefore, the data exchange under the simulation evaluation model can be simplified into a model structure with pedestrian agents and train agents as physical flow objects, and station agents in the track network as the basis for abstract data storage and exchanges. The abstract agent group data exchange logic is shown in Figure 3.
As the most basic unit for constructing the physical space model of the rail network, the abstract station agent should not only become a data exchange platform for passengers and train agents but also realize the exchanges of passenger data between stations and complete the abstract movement of passengers in time and space in the rail network. Although the attributes of each station in the network are different, as nodes for passengers to enter the network, all stations in the network can be regarded as an agent group. Based on the uniqueness of the individual master codes in the agent group, the precise definition of the agent’s parameters, the passenger’s action logic, and the interactive means of the agent realize the control of the flow process of passengers with complex OD characteristics in the network, and also the statistics and summary of the evaluation indicators of the huge station group in the line network. Although the station agent is not a top-level agent in the model, the event scheduling of the passenger action logic for a single station agent can be realized through driving events at the top level of the model. The movement of the pedestrian agent in the station can be simplified as the process of changing the data storage location according to the station status and arrival of the train, meaning the point-to-point movement of pedestrians in the network is the study of the arrival of the passengers at one station compared to other stations. Therefore, the process at each station can simplify the passenger ride process. That is, it is only necessary to use a train arrival event to control the transfer of passenger data from the upper station to the lower station. When a train arrives at a certain station, the data corresponding to the passengers who get off at the station continue to complete a follow-up. On-site logic is thus sufficient. In this way, the calculation amount of passenger data in the network model can be significantly reduced, and the tracking of individual passengers in the network can also be realized. The specific logic flow of single-passenger data processing is shown in Figure 4.
Due to the characteristics of each evaluation index in the evaluation system of the current limiting scheme of the rail transit network and based on the aforementioned assumptions regarding the flow of passengers in the network, the train agent can ignore the details of passengers getting on and off the train; that is, it does not consider all the data of the passenger agent after the train stops. The transfer and inheritance of the train agent simplify the data exchange process between passengers and trains as follows. According to the station-related status data of train stops, the number of people getting on and off, the update of train statistical indicators, and the definition of the number of trains taken by passengers is completed. The data processing logic for a single training agent is shown in Figure 5.

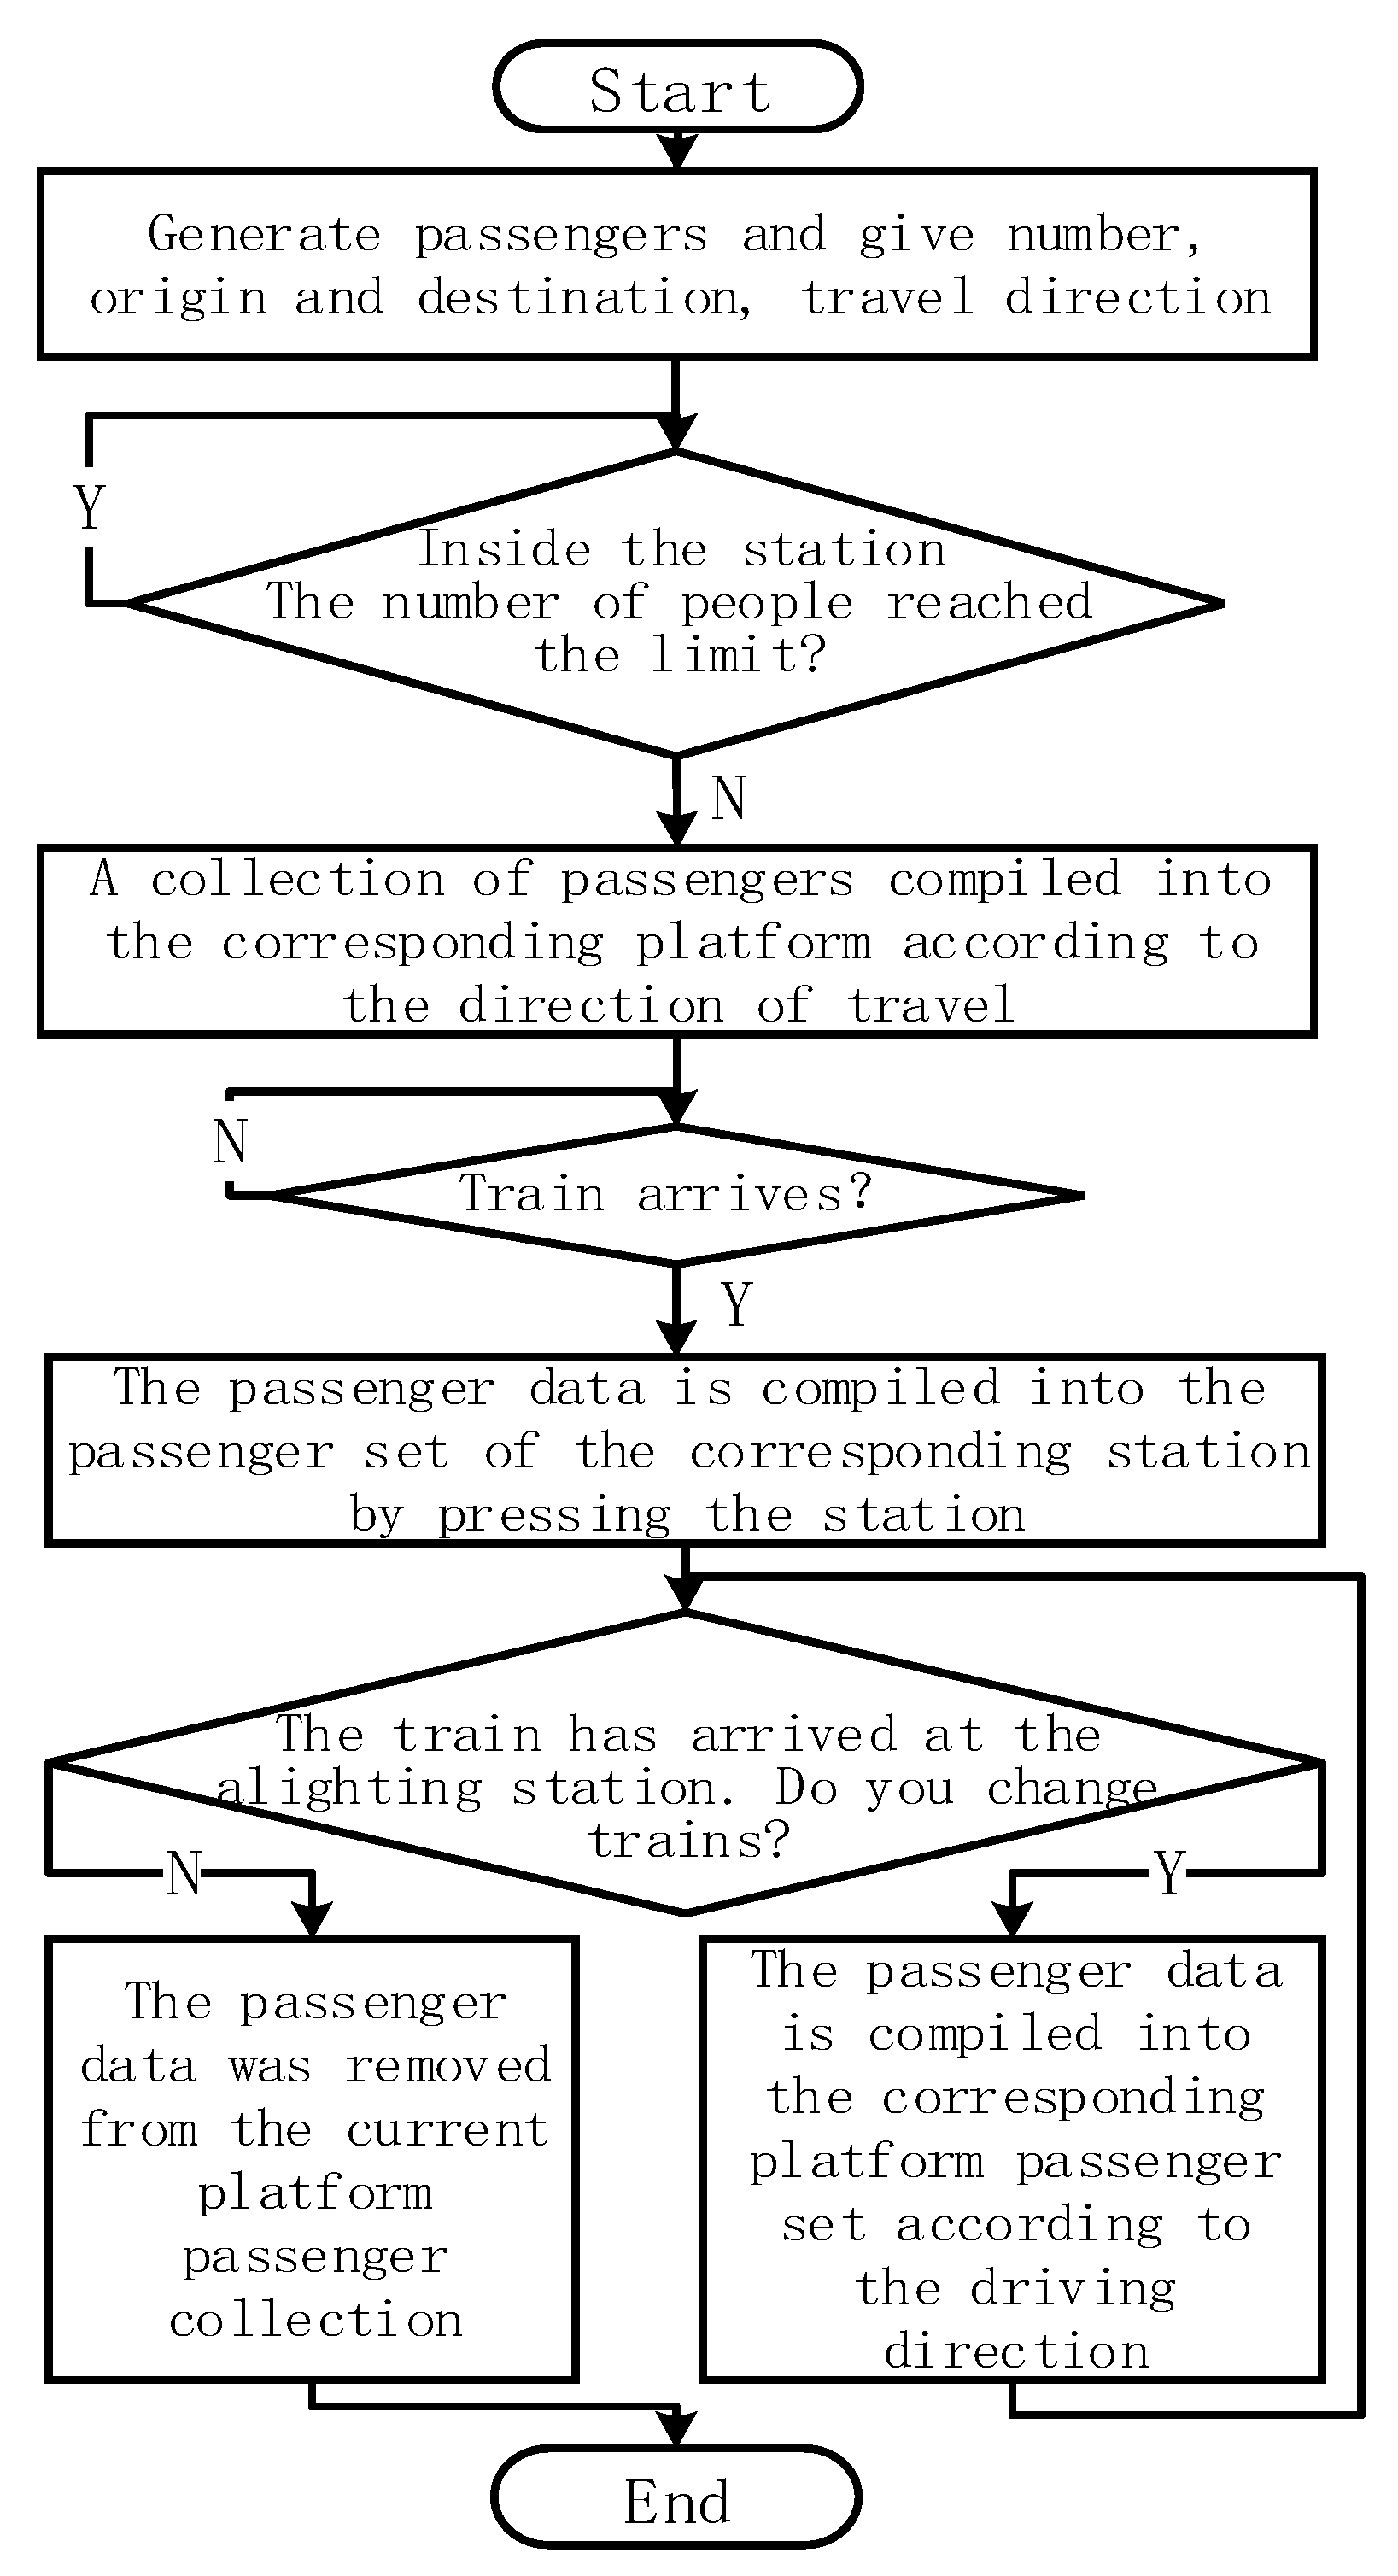
3.2.3. Passenger Arrival Event Control Method

For each station, the passenger arrival event follows a nonstationary Poisson distribution. In the process of dividing the time period of the flow restriction scheme, the impact of the different arrival rates of passengers on the flow restriction scheme for different periods has been comprehensively considered, In other words, the AFC data statistical time periods with similar passenger flows in China are classified into one category, then the time period division decision is made. Therefore, the corresponding mean of the Poisson distribution can be set for different time periods and the nonstationary Poisson distribution in the simulated whole time period can be approximated by the stationary Poisson distribution with different means by the method of “substituting straight for the curve.” The arrival rate of passengers in the same time period is different at each station, so each station corresponds to a specific Poisson distribution. Due to the probability of random events occurring at the same time in the time dimension is zero, each passenger will correspond to a unique generation time, which provides the possibility to realize a single-source control of passenger arrival events; that is, according to the obedience of passengers arriving at each station, the mean of the Poisson distribution is controlled by the single-source object generator to generate travelers. The passenger ID is assigned in sequence at the generation time of each passenger, the spatial position of the starting station is returned, data, such as the final station and the transfer station, are defined, and the total turnover mileage is automatically calculated. Through a generated unique passenger ID, the initial definition of a specific passenger arrival event is completed in the top-level process logic of the model.

3.3. Calculation of Evaluation Index of Current Limiting Scheme

The evaluation indicators of the pros and cons of the current limiting scheme usually need to include three aspects: fairness of the waiting time of passengers outside the station at each station in the network, safety of the train passenger environment, and operational benefits of the rail transit network. The three indicators have certain constraints in practical problems. In reality, to maximize benefits, urban rail companies may lack fairness and safety guarantees; however, a current limiting scheme that only pursues fairness may cause losses to the security and efficiency of the network.
To evaluate the fairness of the rail network, the average waiting times of all passengers arriving outside the station should be counted on a station basis, and the fairness of the current limiting scheme of the line network determined by comparing the mean and variance of the average waiting time of each station. Therefore, the evaluation model must be able to count the waiting time outside the station for all passengers in the network at the inbound node, calculate the average waiting time by station, and calculate the average and variance of the network waiting time.
The waiting time of passengers waiting outside the k station of the i flow-restricted station in the model is:
T k ( i ) = t k 2 ( i ) t k 1 ( i )
The average waiting time of passengers at the k flow-restricted station in model is written as:
T ( k ) = 1 n k i = 1 n k T k ( i )
The average waiting time at current limiting stations in the network is:
T = 1 m k = 1 m T ( k )
The variance of waiting time at current limiting stations in the line network is:
S 2 = 1 m k = 1 m [ T ( k ) T ] 2
m represents the number of current limiting stations in the model.
n k represents the total number of passengers waiting outside the k flow-restricted station in the model.
t k 1 ( i ) represents the arrival time of passengers waiting outside the i station at the k flow-restricted station.
t k 2 ( i ) represents the pit stop time of passengers waiting outside the i station of the k flow-restricted station.
The efficiency evaluation of a passenger transportation system is usually based on the seat utilization index; for a rail transportation network with non-designated seats, it is more appropriate to select passenger turnover as the evaluation index. In this study, the passenger turnover of the network is calculated based on the OD data of each passenger. Taking the mileage between stations as vector data, the passenger agent accumulates the mileage from the upper station to the lower station according to the direction of travel.
The turnover mileage of g passengers at the top of the model in the rail network is expressed as:
L ( g ) = j = a g b g l j
The passenger turnover within the rail network is:
L = g = 1 h L 0 ( g )
g represents the sequential number of the top passenger collection in the model.
h represents the number of passengers in the top passenger set of the model.
a g represents the first ride segment of the g passenger.
b g represents the last ride segment of the g passenger.
l j represents the mileage of the j ride segment of the g passenger.
The safety of the train riding environment has different meanings for different practical applications. In the normalized urban rail transportation organization, overcrowded passengers in a train will affect the safety of riding and even driving. In large public health emergencies (i.e., an epidemic), the factor that endangers the safety of riding is the safe distance between people in a car. According to the “Guidelines for the Division and Classification of the New Coronary Pneumonia Epidemic Prevention and Control in Passenger Terminals and Transportation Vehicles During the Spring Festival in 2021” issued by the Ministry of Transport in January 2021, the upper limit of the congestion degree in urban rail transit trains in high- and medium-risk areas is 50% and 70%, respectively. Therefore, the maximum passenger capacity of a train in the entire traffic can be used as the basis for evaluating the safety index of the current limiting scheme.
The actual passenger capacity of train at departure time of the k station is:
N k = N k 1 + X k Y k
The maximum passenger capacity of the train is:
N H = max { N 1 , N 2 , , N m }
X k represents the number of people who get on this train at station k .
Y k represents the number of people who get off this train at station k .

3.4. Simulation Experiment

To verify the validity and practicability of the above simulation evaluation model construction theory and show the basic characteristics of the urban rail transit network flow restriction scheme and intuitively, this study chooses Dalian urban rail lines 1 and 2 as an example, as they have strong tidal passenger flows. According to the modeling idea above and based on the simulation environment of AnyLogic software and in a Microsoft Windows 7 operating system and above, a custom-developed current limiting scheme evaluation simulation model was developed, and the simulation evaluation and analysis of the current limiting scheme were conducted.
The purpose of this simulation model is to accurately evaluate relevant indicators, such as passenger turnover, train passenger volume, and waiting time of passengers outside the station during the implementation of the current limiting scheme, without considering the traffic behavior of passengers at the station. Therefore, this model is a meso-level simulation model, and it is necessary to establish the relationship between the three and the top-level logic of the model by describing the details of the station, passengers, and train intelligence groups. We used “Process Modeling Library,” “Rail Library,” and “Pedestrian Library” in AnyLogic to establish the action logic of pedestrians and trains based on JAVA, to complete the call to each state passenger collection through a subroutine code “Collection”, and the control of various events “Event” were used to realize the precise control of the passenger agent in the Delay module and achieve data tracking and traceability. The simple passenger and train single-source generation control logic in the top layer of the model is associated with the complex passenger and train logic inside the station agent to achieve precise top-down control. The passengers, train logic, and plug-in calls inside the station agent are illustrated in Figure 6. The technical route of the simulation experiment is shown in Figure 7.
In the actual transportation organization and management process of urban rail companies, there is no scientific and reasonable flow-limiting plan, and most of them limit the flow of individual stations based on operating experience. As a result, there is great uncertainty in the degree of safety, efficiency, and fairness indicators. Therefore, in order to demonstrate the effect of the current limiting scheme obtained under the multi-objective programming model, three sets of experiments are conducted based on the above background. The first group does not take current limiting measures, in addition to being used for comparison with the latter two groups of experiments, it is also used as the basis for validating the model; Based on the experimental results of the first group, the second group conducts the same level of flow restriction according to experience for several stations with known large passenger flow or the station in front of the area with high passenger flow density; the third group performs current limiting according to the optimized current limiting scheme. By comparing the results of the second and third groups of experiments, the evaluation and suggestion of the optimized current limiting scheme is given.

3.5. Simulation Model Inputs and Assumptions

The input data for the simulation model include the current data limit, section mileage between stations, mean value of the distribution of passengers arriving at each station, OD distribution of waiting passengers at each station platform, and proportion of tidal passenger flow in each running direction. This study obtained the above input data related to passenger flows through the analysis and processing of the AFC data of each line of the Dalian urban rail in July 2020 (i.e., a period of epidemic prevention and control). According to epidemic prevention regulations in medium-risk areas, the model set the upper limit of the safe capacity of trains to 70% (i.e., the number of passengers on board under epidemic prevention conditions should not exceed 1022).
The current limiting scheme was simulated using a combination of qualitative and intuitive data visualization demonstration experiments and quantitative experimental results. The initial state of the implementation of the current limiting scheme in the model is that the urban rail transit network runs from 6:00 (the real moment when the urban rail line starts running in a day) to 7:00 without taking any current limiting measures.
Among them, the optimized current limiting scheme was selected by our research group by establishing fairness and benefit as the objective function, and the limited number of people in each station in the network was obtained by the multi-objective programming mathematical model with safety as the constraint (expressed as a percentage of the station’s platform capacity). The survey found that the most uneven distribution of passengers on lines 1 and 2 was concentrated in the section from stations 1 to 13 of line 2.

4. Results

(1)
Results of the first group of unlimited current simulation experiments
To verify the validity of the simulation model, this study adopted the method of comparing passenger flow survey data with the output results of the simulation model for verification [34,35]. The experiment used Dalian urban rail peak hour passenger flow data for one day in July 2020 as the observation value.
The experimental value of each index is the average value from 10 simulation experiments after obtaining the mathematical statistical distribution of the model input data, such as the passenger arrival time and travel OD at each station.
According to the experience and suggestions of the urban rail company, when the error ratio between the actual observation value and the experimental value is within 5%, the model results are considered reliable. Otherwise, it is necessary to continue to iteratively adjust the model until it becomes close to the real urban rail network system. On a personal computer with CPU 2.2 GHz and 4 G RAM, the simulation ran for 3 h (6:00 to 9:00 in the morning), and the average time for a single experiment was 23.6 min. The errors of the observed and experimental values of train passengers and passenger turnover are listed in Table 1 and Table 2, respectively. The errors of the two indicators in the 3 h sub-period are both within 5%, indicating the model can reflect the change in passenger flow in real life.
The dynamic distribution of the passenger flow in the network under normal and unrestricted conditions is thoroughly understood, and the relevant data on train safety and network profitability indicators are listed in Table 3. The number of trains exceeding the upper limit of the safe capacity accounts for around 18.26% of the total number of trains running in the network without taking flow limiting measures, and the average level of the maximum passenger capacity of all overloaded trains exceeds the specified safe capacity by around 136.97%. According to the passenger load data of each section of the train in the experimental results, the sections exceeding the upper limit of the safe capacity are concentrated in the nine inter-station sections from station 3 to station 12, which is consistent with the above-mentioned observations.
Therefore, combined with the observation data on passengers arriving at the station, according to the operational experience of the urban rail company, in the second group of experiments, the six stations, namely no. 2, 5, 6, 7, 8, and 9, of Metro Line 1 were selected: from 7:00 to 9:00, the same level of current limiting was conducted, and the current limiting rate was 75%; the third group was the current limiting rate at each time period, and each station calculated by the research group based on the tidal characteristics of the morning peak passenger flow of Dalian Metro (the ratio of the calculated optimal pitstop volume to the observed value of the actual pitstop volume) is shown in Table 4.
(2)
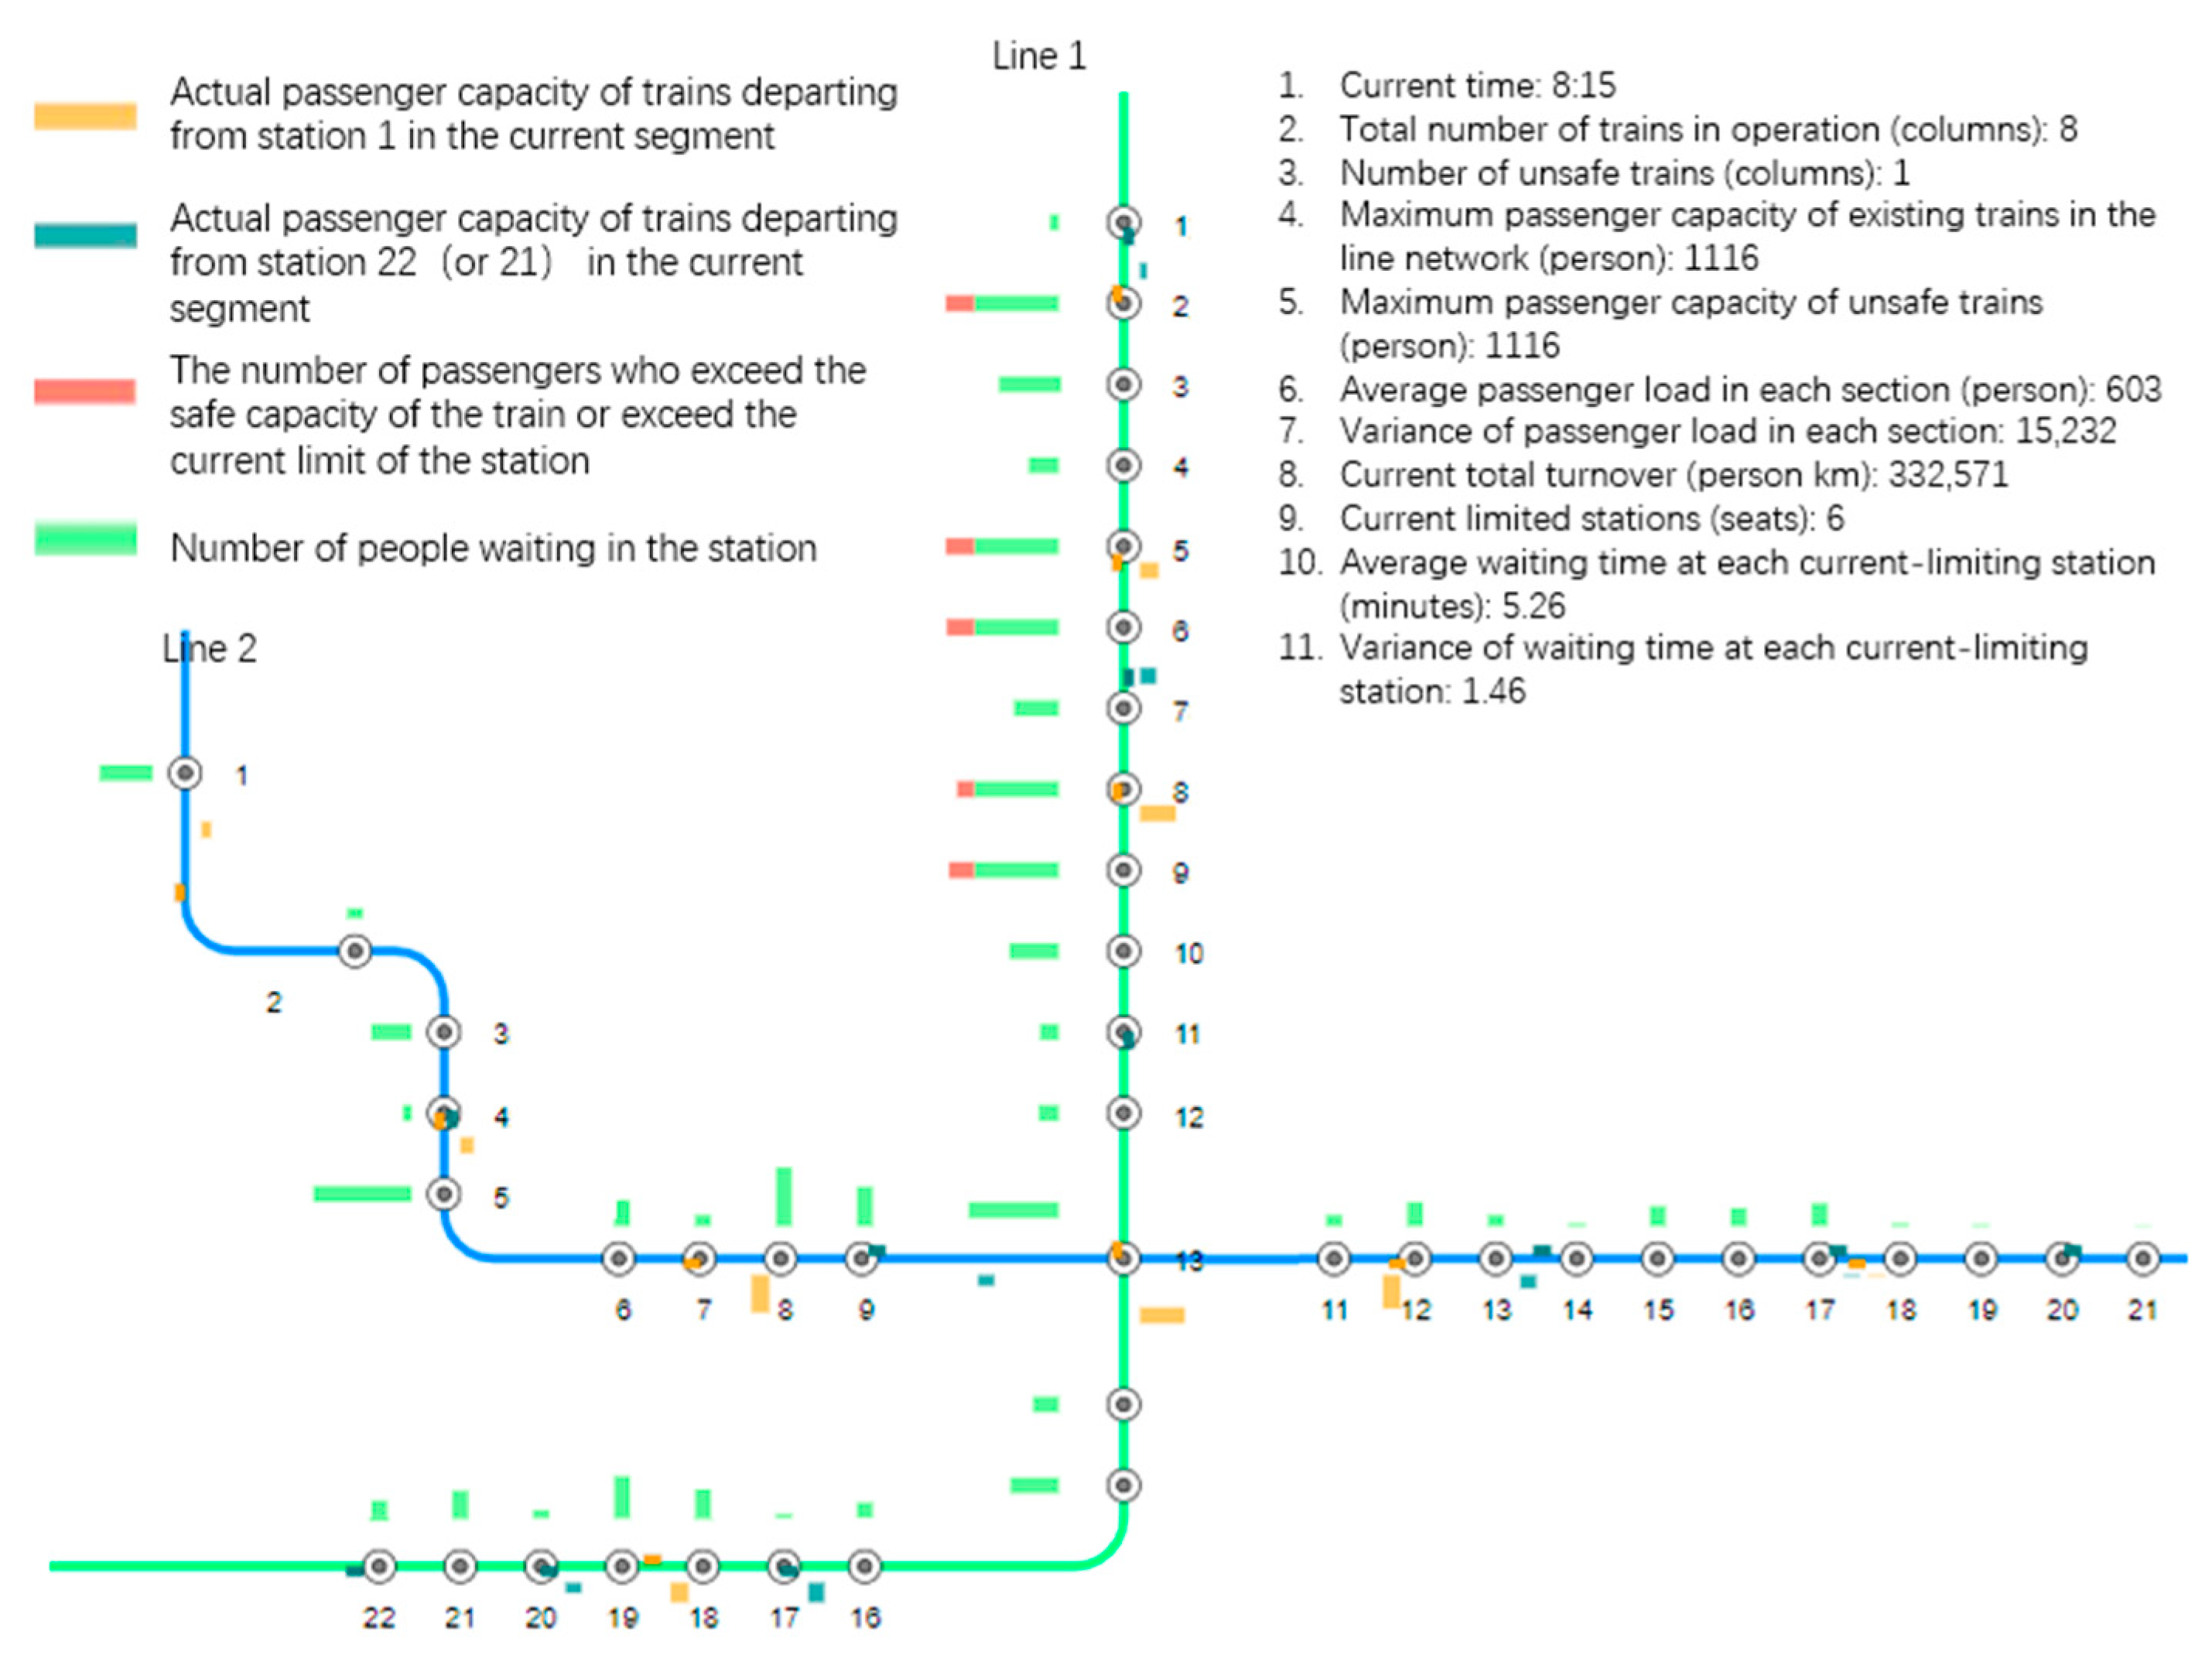
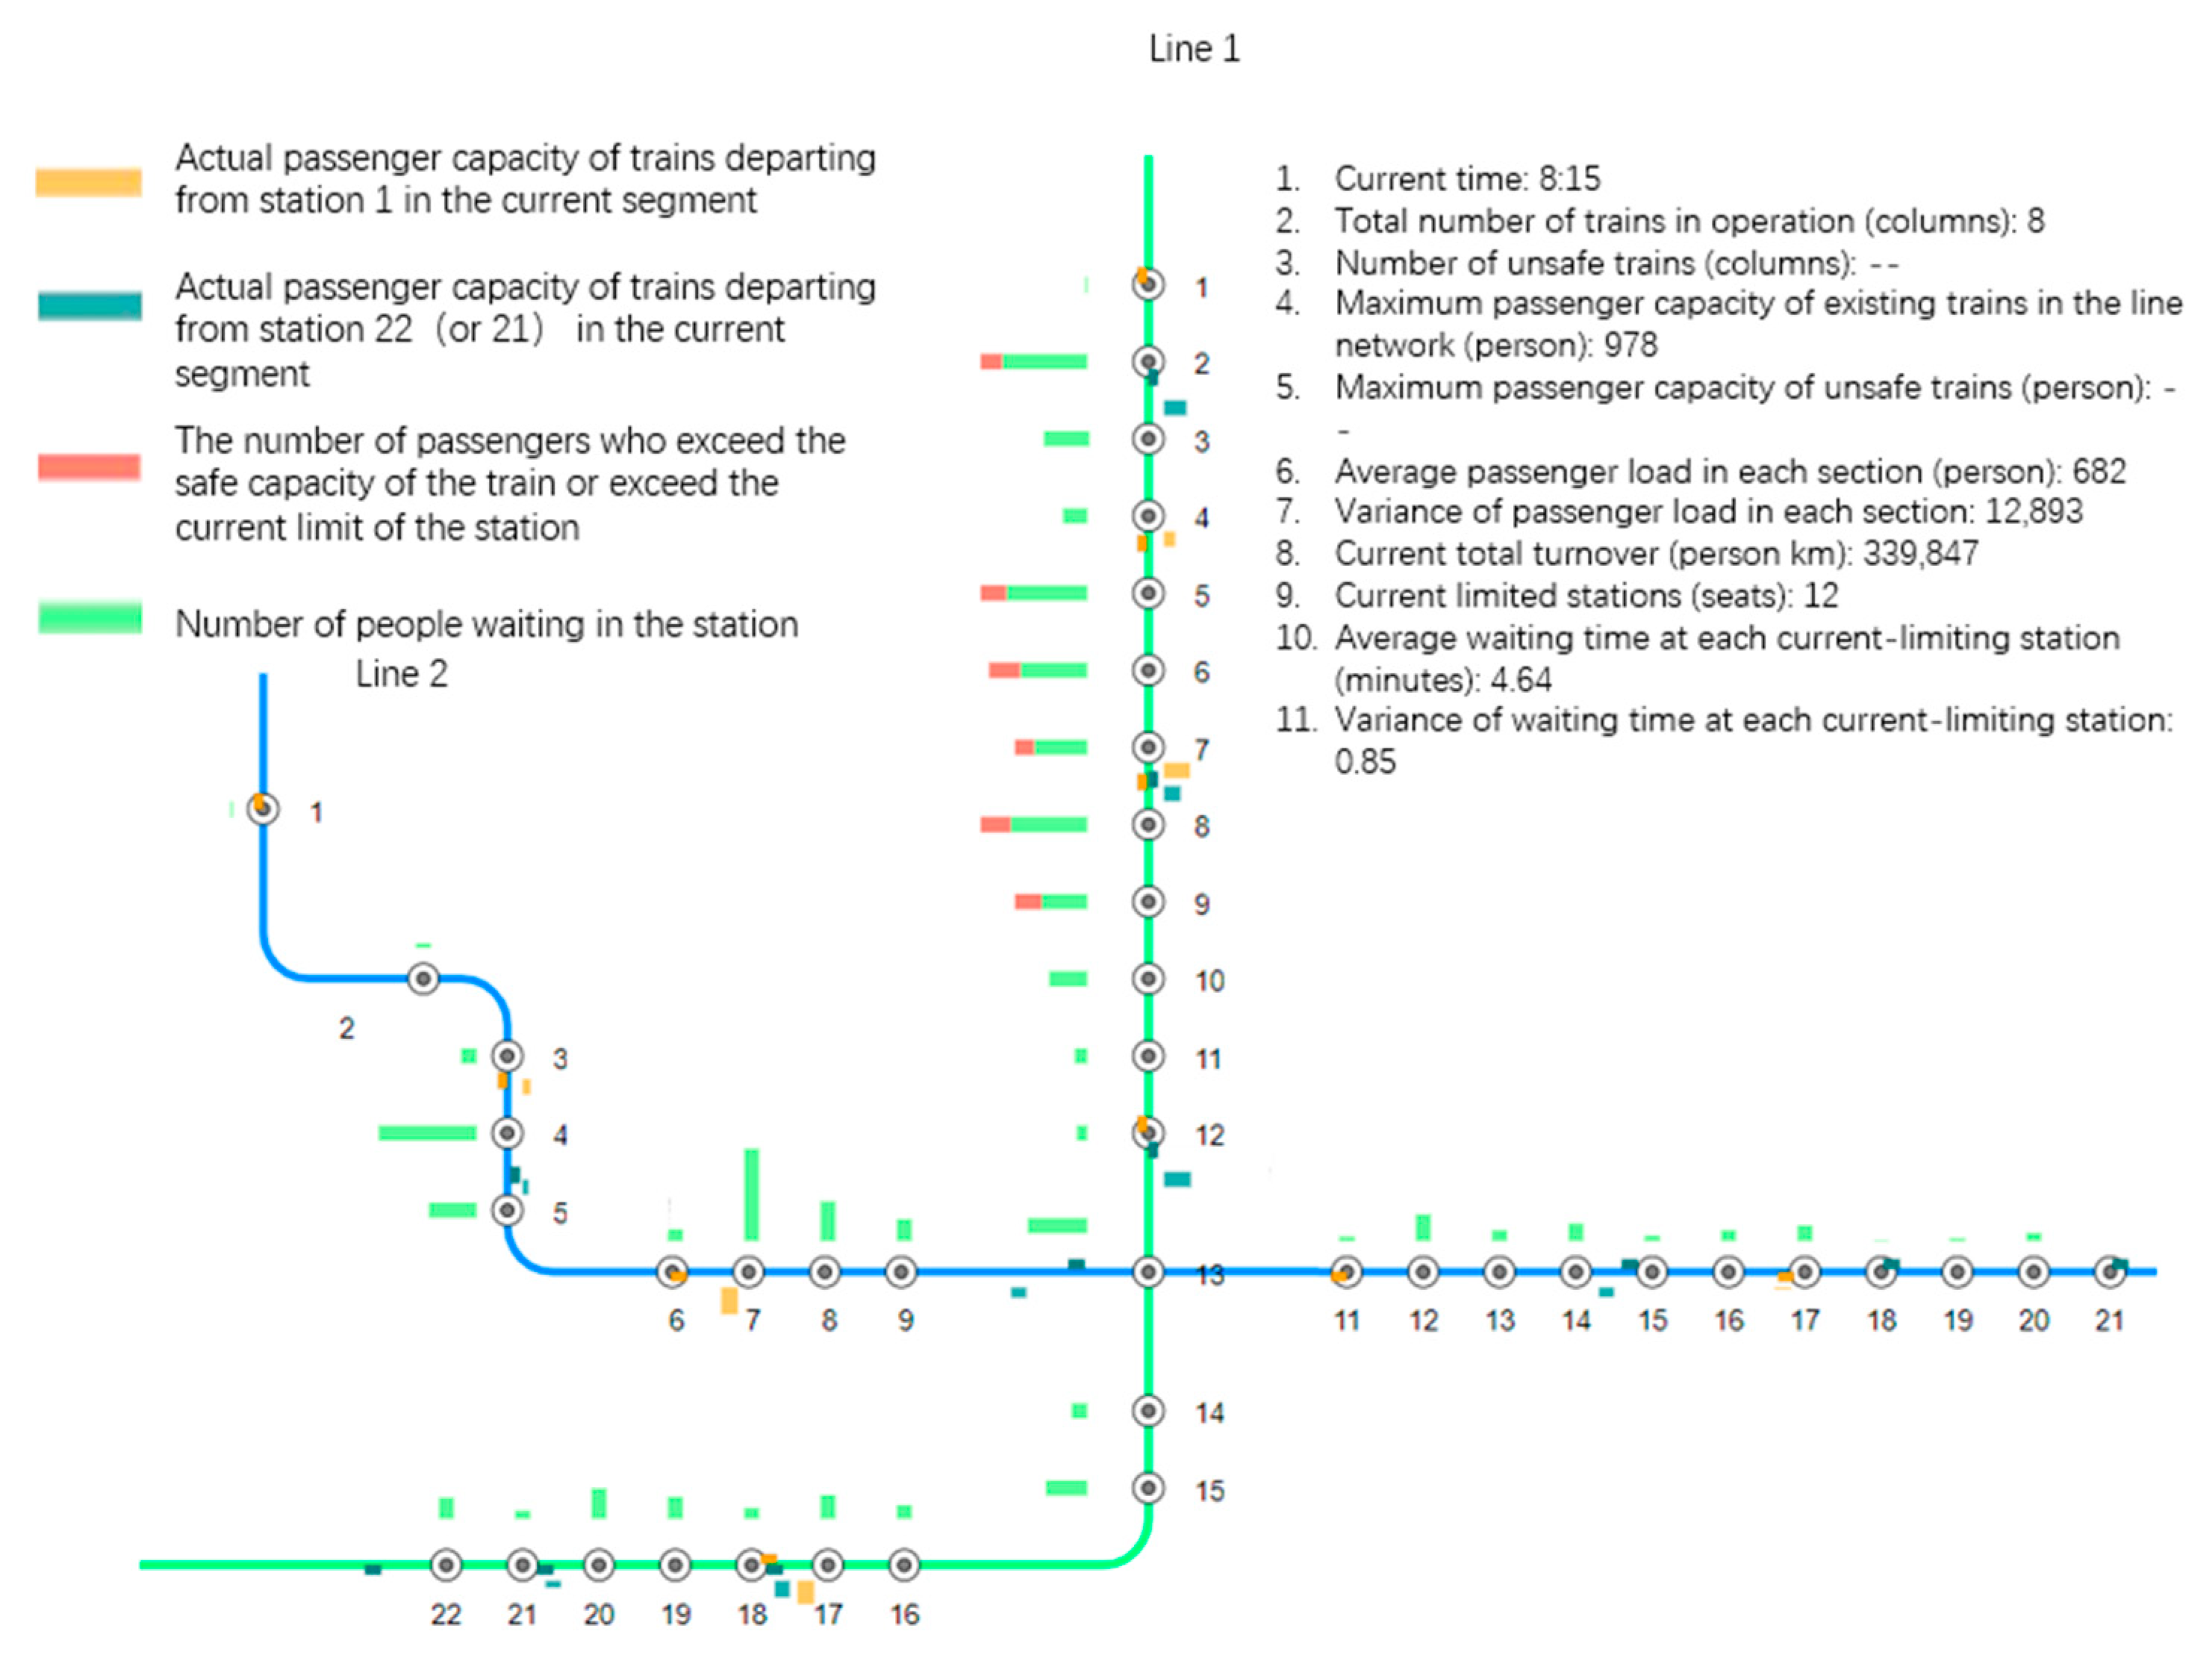
Comparison of the simulation experimental results of the second and third groups of current limiting to visually and dynamically displaying passenger data changes at each station and train in the two groups of experiments
The model uses different characteristic histograms to represent the number of passengers for different objects. In the second and third groups of experiments, the simulation interface states at a certain moment of current limitation are shown in Figure 8 and Figure 9, respectively.
As shown in Table 5, although the second group of empirical current limiting measures improve the train safety index, the variance of the average passenger capacity of the third group of experimental trains is larger than that of the third group of experimental trains and unsafe trains are still not eliminated; its benefits are the lowest among the three groups of experiments and the average waiting time of passengers in the network is higher than that of the third group. Overall, the simulation results of the third group of current limiting schemes are better for various indicators. Although the profitability indicators are lower than those in the first group, the maximum passenger capacity of the train is close to the lower side of the safe capacity, the average capacity utilization rate of the train is as high as 85.03%, the train safety and utilization rate are high, and the average waiting time of passengers at each station is reduced by approximately 21.08% compared with the second group of empirical current limiting experiments. The variance of the average waiting time of passengers and the variance of the average train passenger capacity is relatively small, which proves that the optimized current limiting scheme effectively balances the relationship between security, efficiency, and fairness.

5. Discussion

Zhang et al. [32] adopted a comprehensive development method of the synchronized train and passenger traffic simulation model for the URT network to reduce the model running time for one day (6:00–12:00, for a total of 18 h) to between 80−105 s. However, compared with previous studies, the simulation model in this paper takes 23.6 s to run during the morning peak period from 6:00 to 9:00. We considered the differences between the operating equipment conditions of the two and the levels of high, flat, and peak passenger flow in a day for different research objects. The computational performance of the two models is essentially the same, as both models effectively reduce the computational redundancy caused by the large passenger flow and complex transfers in the road network.
Additionally, this study provides an example simulation evaluation experiment on the current limiting scheme of an urban rail transit network, which provides reference for the simulation evaluation of the effect of the network- and line-level multi-station coordinated current limiting scheme. This study provides a simulation evaluation method based on the time division for the current limiting scheme of Li et al. [12], which uses the Fisher segmentation method to divide the current limiting period and provides a specific implementation method for the simulation evaluation of the passenger delay index, profitability index, and fairness index in the literature [10], as per Yang et al. [11], Li et al. [13], and Zhang et al. [14]. By comparing the experimental results of the second and third groups, this study found that the third group of current limiting schemes trades more optimization of safety, profitability, and delay levels at the cost of losing a small part of the peak passenger flow. At the same time, the variance of the passenger load in each interval and the variance of waiting time of each current limiting station in the third group were reduced by approximately 13.43% and 36.68%, respectively, compared with the second group. This shows that the current limiting scheme based on multi-objective programming models in previous research can purposefully weigh the mathematical relationship between different indicators and effectively improve the performance quality of the current limiting scheme, and the fairness of current limiting stations in the network. The modeling method based on the abstract agent group proposed in this paper improves the efficiency of modeling and the model transformation and effectively reduce the computational redundancy of the experiment.

6. Conclusions

The simulation evaluation and modeling of the current limiting scheme of urban rail transit networks is complicated and tedious, and the amount of calculations is large. The following conclusions were drawn from three sets of simulation evaluation experiments on the current limiting scheme of the Dalian urban rail network.
  • Using the mesoscale simulation method, the transfer process of passenger agent information data at each station of the urban rail line network replaced the details of the movement of passengers in the network, which can significantly improve the computing efficiency compared with the traditional micro-simulation model.
  • The evaluation simulation model of the current limiting scheme developed in this study establishes the pros and cons of various indicators through the average value and variance of various indicators, and the delay fairness and passenger flow balance of each station and line section. The model is especially suitable for evaluating the current limiting scheme under the multi-objective planning model.
  • The model can display the simulation status of the current limiting current scheme through an intuitive and vivid network passenger flow density graph and realize the visualization of station and vehicle data during the simulation process, which can accurately describe the differences in the various evaluation indicators under each passenger flow control method and can effectively assist urban rail companies to complete the evaluation and management of current limiting schemes. This has a certain significance for the simulation modeling of urban rail transit organizations.
At present, the simulation evaluation model of the current limiting scheme for the Dalian urban rail does not yet have a mature intelligent body communication mechanism. In future studies, we will start working on this issue, conduct in-depth research on the establishment and optimization of the agent communication mechanism, and further optimize the model structure.

Author Contributions

Conceptualization, H.H., J.L. and S.W.; methodology, H.H. and J.L.; writing original draft preparation, H.H.; writing—review and editing, H.H., J.L. and S.W. All authors have read and agreed to the published version of the manuscript.

Funding

This research was supported by the Scientific Research Funding Project of the Liaoning Provincial Education Department in 2020 (grant no. JDL2020016).

Institutional Review Board Statement

Not applicable.

Informed Consent Statement

Not applicable.

Data Availability Statement

Not applicable.

Conflicts of Interest

The authors declare no conflict of interest.

References

  1. Han, B.; Yang, Z.; Yu, Y.; Qian, L.; Chen, J.; Ran, J.; Sun, Y.; Xi, Z.; Lu, F. Statistical analysis of urban rail transit operation in the world in 2020: A review. Urban Rapid Rail Transit 2021, 34, 5–11. [Google Scholar]
  2. Zhou, H.; Zhang, Q.; Feng, Y.; Liu, Y.; Zheng, G. Linear quadratic optimal control of passenger flow in urban rail transfer stations. In Proceedings of the International Conference on Electrical and Information Technologies for Rail Transportation, Changsha, China, 20–22 October 2017; pp. 999–1011. [Google Scholar]
  3. Wang, L.; Yan, X.; Zhang, Y. Coordinative passenger flow control during peak hours in urban rail stations. In Proceedings of the 15th COTA International Conference of Transportation, Beijing, China, 24–27 July 2015; pp. 1153–1164. [Google Scholar] [CrossRef]
  4. Li, M.; Wang, Y.H.; Jia, L.M. Passenger flow modes and control strategies in urban rail transit station. J. Southeast Univ. 2015, 1203–1208. [Google Scholar] [CrossRef]
  5. Ren, G.; Ouyang, Y. Coordinated passenger flow control and bus connection setting during peak hour of urban rail transit. In Proceedings of the Sixth International Conference on Transportation Engineering, Chengdu, China, 20–22 September 2019; pp. 86–94. [Google Scholar] [CrossRef]
  6. Xue, H.; Yang, P.; Zhang, H.; Jing, E. Modeling on coordinated passenger flow control for multiple stations in a single line of urban rail transit. IOP Conf. Ser. Earth Environ. Sci. 2018, 234, 012008. [Google Scholar] [CrossRef]
  7. Wang, L.; Yan, X.; Wang, Y. Modeling and optimization of collaborative passenger control in urban rail stations under mass passenger flow. Math. Probl. Eng. 2015, 2015, 1–8. [Google Scholar] [CrossRef] [Green Version]
  8. Ma, Y.; Wang, Z.; Wen, S.; Luo, Q. Modeling of flow co-control among multi-stations based on passenger equilibrium waiting for urban rail transit. J. Shenzhen Univ. Sci. Eng. 2017, 34, 441–550. [Google Scholar] [CrossRef]
  9. Chen, Z.; Gan, J.; Wang, X. Three-level passenger flow control model for urban rail transit in consideration of safety. J. Cent. South Univ. Sci. Technol. 2020, 51, 1441–1450. [Google Scholar]
  10. Zhao, P.; Yao, X.M.; Yu, D.D. Cooperative passenger inflow control of urban mass transit in peak hours. J. Tongji Univ. 2014, 42, 1340–1443. [Google Scholar]
  11. Yang, T.-Y.; Zhao, P.; Yao, X.-M.; Zhang, P. Coordinated optimization model of rail transit delayed train stop-skip pattern and passenger flow control. J. Transp. Syst. Eng. Inf. Technol. 2021, 21, 105. [Google Scholar]
  12. Li, D.-H.; Peng, Q.-Y.; Lu, G.-Y.; Wang, K.; Wu, Z.-Y. Control method for passenger inflow control with coordination on urban rail transit line in peak hours. J. Transp. Syst. Eng. Inf. Technol. 2019, 19, 141. [Google Scholar]
  13. Li, X.; Bai, Y.; Su, K. Collaborative passenger flow control of urban rail transit network considering balanced distribution of passengers. Mod. Phys. Lett. B 2021, 35, 2150461. [Google Scholar] [CrossRef]
  14. Zhang, Z.; Huang, Z. Passenger Flow Control Method for Network-Wide Operation of Urban rail Transit System: A case study in Guangzhou. IOP Conf. Ser. Earth Environ. Sci. 2021, 638, 012012. [Google Scholar] [CrossRef]
  15. Lu, W.; Zhang, H.; Guo, J.; Qin, Y.; Jia, L. Coordinated control of urban rail train skip-stopping and inbound passenger flow based on deep Q-network. In Proceedings of the International Conference on Electrical and Information Technologies for Rail Transportation, Qingdao, China, 21–23 October 2021; pp. 545–557. [Google Scholar]
  16. Chen, W.-Y.; Zhang, Y.; Chen, X.; Wang, J.-Y. Collaborative full-length and short-turning plan and joint multi-station control of passenger flow in urban rail transit. J. Transp. Syst. Eng. Inf. Technol. 2019, 19, 177. [Google Scholar]
  17. Zhou, W.; Hu, P.; Huang, Y.; Deng, L. Integrated optimization of bus route adjustment with passenger flow control for urban rail transit. IEEE Access 2021, 9, 63073–63093. [Google Scholar] [CrossRef]
  18. Lu, Y.-H.; Yang, L.-X.; Meng, F.-T.; Xia, D.-Y.; Qi, J.-G. Collaborative optimization of train timetable and passenger flow control strategy for urban rail transit. J. Transp. Syst. Eng. Inf. Technol. 2021, 21, 195. [Google Scholar]
  19. Wang, Y.; Yin, X. Research the simulation model of the passenger travel behavior in urban rail platform. AIP Conf. Proc. 2017, 1839, 020124. [Google Scholar] [CrossRef]
  20. Wang, Z.-Q. Event driven simulation model research of urban rail transit emergency treatment process. Appl. Res. Comput. 2015, 32, 125–131. [Google Scholar]
  21. Liu, F.; Shao, C.; Jia, H.; Dong, C. Simulation evaluation for service facilities distribution and flow lines optimization on urban rail transfer station. J. Syst. Simul. 2021, 33, 1670. [Google Scholar]
  22. Xu, Q.; Mao, B.; Li, M.; Feng, X. Simulation of passenger flows on urban rail transit platform based on adaptive agents. J. Transp. Syst. Eng. Inf. Technol. 2014, 14, 28–33. [Google Scholar] [CrossRef]
  23. Zhang, Q.; Han, B.; Li, D.; Lu, F. Evaluation method for the operation performance of urban rail transit hub based on simulation technology. Zhongguo Tiedao Kexue 2011, 32, 120–126. [Google Scholar]
  24. Huang, D. The Research of Urban Rail Transit Coordinated Passenger Flow Control System Using Discrete Event-Simulation-Based Optimization Method. Master’s Thesis, Southwest Jiaotong University, Chengdu, China, 2019. [Google Scholar]
  25. Zheng, X.; Jiang, X. The study of passenger flow control at kecun station of urban rail transit based on system dynamics. J. Rail Way Sci. Eng. 2016, 13, 2284–2289. [Google Scholar]
  26. Li, Y. Research on Coordination Analysis and Evaluation of Urban Rail Transit Line Operation Based on Simulation. Master’s Thesis, Beijing Jiaotong University, Beijing, China, 2015. [Google Scholar]
  27. Luo, Q.; Wang, Z.; Li, X.; Zhang, X.; Xiong, P. Simulation and modeling of multi-stations’ mass passenger flow control based on waiting time equalization in urban rail line. In Proceedings of the 17th Cota International Conference of Transportation Professionals, Shanghai, China, 7–9 July 2017; pp. 1813–1821. [Google Scholar] [CrossRef]
  28. Chen, Z. Real-Time Estimation Model and Control Method for Urban Rail Transit Line Load. Master’s Thesis, Beijing Jiaotong University, Beijing, China, 2018. [Google Scholar]
  29. Jiang, X.; Feng, J.; Jia, F.; Sun, J.; Li, C. Modeling and simulation of passenger flow distribution in large-scale urban rail transit network. J. China Railw. Soc. 2018, 40, 9–18. [Google Scholar]
  30. Liu, J.; Hu, L.; Xu, X.; Wu, J. A queuing network simulation optimization method for coordination control of passenger flow in urban rail transit stations. Neural Comput. Appl. 2021, 33, 10935–10959. [Google Scholar] [CrossRef]
  31. Lei, Y.; Lu, G.; Zhang, H.; He, B.; Fang, J. Optimizing total passenger waiting time in an urban rail network: A passenger flow guidance strategy based on a multi-agent simulation approach. Simul. Modell. Pract. Theor. 2022, 117, 102510. [Google Scholar] [CrossRef]
  32. Cong, C.; Li, X.; Yang, S.; Zhang, Q.; Lu, L.; Shi, Y. Impact estimation of unplanned urban rail disruptions on public transport passengers: A multi-agent based simulation approach. Int. J. Environ. Res. Public Health 2022, 19, 9052. [Google Scholar] [CrossRef]
  33. Zhang, H.; Lu, G.; Lei, Y.; Zhang, G.; Niyitanga, I. A hybrid framework for synchronized passenger and train traffic simulation in an urban rail transit network. Int. J. Rail Transp. 2022, 1–30. [Google Scholar] [CrossRef]
  34. Gao, L.; Jia, L. Modeling and simulation of passenger flow distribution on urban rail transit station platform. Urban Rail Transit Res. 2019, 12. [Google Scholar] [CrossRef]
  35. Ma, Q.; Wang, C.; Lu, J.; Ma, Y.; Zhang, W. Simulation analysis of emergency evacuation at Rail transit statio. Urban Rail Transit Res. 2016, 19, 71–74+80. [Google Scholar]
Figure 1. Schematic diagram of the passenger flow limiting of a two-line cross urban rail transit network.
Sustainability 15 00375 g001
Figure 2. Simulation logic diagram of passenger flow control. a i indicates the start time of the current limit period or end time of the previous current limit period. b i indicates the arrival time of a train. t i indicates the time when a passenger arrives outside the station. t m indicates the time when the number of passengers in the station has reached the upper limit of the current limiting plan. x 1 indicates the number of people in the station corresponding to the time limit from a 1 to a 2 . x 2 indicates the number of people in the station corresponding to the time limit from a 2 to a 3 .
Sustainability 15 00375 g002
Figure 3. Schematic diagram of abstract agent group data exchanges.
Sustainability 15 00375 g003
Figure 4. Logic flow chart of single passenger data processing.
Sustainability 15 00375 g004
Figure 5. Logic flow chart of data processing for a single train agent.
Sustainability 15 00375 g005
Figure 6. Passengers, train logic, and main plug-in calls in the station agent.
Sustainability 15 00375 g006
Figure 7. Simulation experiment technology roadmap.
Sustainability 15 00375 g007
Figure 8. State of the simulation interface at a certain time in the second set of experiments.
Sustainability 15 00375 g008
Figure 9. The third set of experiments simulates the state of the interface at a certain moment.
Sustainability 15 00375 g009
Table 1. Errors between the observed value and the experimental value of the passenger capacity of the train.
TimeObserve the Maximum (Person)Experimental Maximum (Person)Deviation (Percentage)
6:00–7:00144114082.3
7:00–8:00162616581.9
8:00–9:00178517980.7
Table 2. Errors between observed value and experimental value of passenger turnover.
TimeObservations
(Person·km)
Experimental
(Person·km)
Deviation (Percentage)
6:00–7:00135,061141,1304.3
7:00–8:00182,671176,8263.2
8:00–9:00192,778185,2613.9
Table 3. Summary table of each evaluation index of the first group of experiments.
Evaluation Index NameThe First Set of Experimental Data
Safety evaluation indicatorsTotal number of trains (trains)115
Number of unsafe trains (trains)21
Maximum train capacity (persons)1658
Average maximum passenger capacity of unsafe trains (persons)1399
Average passenger capacity by zone (persons)763
Variance of passenger capacity by zone (persons)33,920
Effectiveness evaluation indicatorsTotal turnover (person km)503,216
Table 4. Optimized current limiting scheme.
Time
Station
7:00–
7:15
7:15–
8:30
8:30–
9:00
197.00%95.48%96.27%
299.68%91.25%82.87%
376.45%84.86%86.96%
476.78%54.47%73.48%
552.33%51.82%52.16%
654.30%53.64%52.77%
754.58%56.18%56.59%
865.47%50.41%54.24%
951.22%53.26%57.47%
1050.68%74.91%62.14%
1169.74%72.68%50.00%
12Unlimited traffic flow65.57%Unlimited traffic flow
Table 5. The second and third groups of evaluation indicators comparison table.
Evaluation MetricGroup II
Experiment
Group III
Experiment
Safety evaluation indicatorsTotal number of trains (trains)115115
Number of unsafe trains
(trains)
90
The train has a maximum passenger capacity maximum volume (persons)12031013
Unsafe trains most
Average large passenger capacity (persons)
1136none
Passenger capacity of each section
average (persons)
717869
Passenger capacity of each section
variance (persons)
36,45831,562
Effectiveness evaluation indicatorsTotal turnover
(person·km)
486,787491,235
Fairness indicatorsNumber of stations with limited flow (seats)711–12
Average waiting time at each restricted station (minutes)6.695.28
Variance of waiting time at each restricted station (minutes)50.7332.12
Disclaimer/Publisher’s Note: The statements, opinions and data contained in all publications are solely those of the individual author(s) and contributor(s) and not of MDPI and/or the editor(s). MDPI and/or the editor(s) disclaim responsibility for any injury to people or property resulting from any ideas, methods, instructions or products referred to in the content.

